
Abstract
A quantitative estimate of cerebral blood oxygen saturation is of critical importance in the investigation of cerebrovascular disease. We aimed to measure the change in venous oxygen saturation (Yv) before and after the intake of the vaso-dynamic agents caffeine and acetazolamide with high spatial resolution using susceptibility mapping. Caffeine and acetazolamide were administered on separate days to five healthy volunteers to measure the change in oxygen extraction fraction. The internal streaking artifacts in the susceptibility maps were reduced by giving an initial susceptibility value uniformly to the structure-of-interest, based on a priori information. Using this technique, Yv for normal physiological conditions, post-caffeine and post-acetazolamide was measured inside the internal cerebral veins as YNormal = 69.1 ± 3.3%, YCaffeine = 60.5 ± 2.8%, and YAcet = 79.1 ± 4.0%. This suggests that susceptibility mapping can serve as a sensitive biomarker for measuring reductions in cerebro-vascular reserve through abnormal vascular response. The percentage change in oxygen extraction fraction for caffeine and acetazolamide were found to be +27.0 ± 3.8% and −32.6 ± 2.1%, respectively. Similarly, the relative changes in cerebral blood flow in the presence of caffeine and acetazolamide were found to be −30.3% and + 31.5%, suggesting that the cerebral metabolic rate of oxygen remains stable between normal and challenged brain states for healthy subjects.
Keywords
Introduction
Being able to image the hemodynamics of the brain is key to diagnosing and understanding cerebrovascular diseases such as stroke,1–3 subarachnoid hemorrhage, 4 vascular dementia,5,6 and mild traumatic brain injury. 7 Two key components of brain function are oxygen extraction fraction (OEF) and cerebral metabolic rate of oxygen (CMRO2). The OEF represents the fractional amount of oxygen extracted from the arterial blood by the surrounding tissue during its passage through the capillary network. This oxygen utilization is related to brain function, which in turn regulates cerebral blood flow (CBF) and cerebral blood volume (CBV) to meet the CMRO2 demand. Although positron emission tomography (PET) studies8,9 have been widely used to study venous oxygen saturation (Yv) and CMRO2 for stroke and tumor imaging,10,11 PET imaging is a relatively low spatial-resolution technique and involves injection of a radioactively labeled isotope, which requires special equipment and has risks for the patient.
The complex physiology of blood flow and oxygen saturation levels modulates the MR signal in the veins,12–15 which can be detected using functional magnetic resonance imaging (fMRI) techniques through the blood-oxygen-level-dependent (BOLD) response.12,13 The BOLD effect is a function of CBV, CBF, and oxygen consumed by the brain tissues.16,17 Relative changes in the hemodynamic response are used as a surrogate to detect neuronal activity. MRI-based methods have been proposed to measure oxygenation in the brain, including the combination of fMRI BOLD and CBF measurements for calibrated estimates of CMRO2 changes.18–21 Despite its significance in the neurosciences, the BOLD technique measures relative changes and suffers from limited spatial resolution. 22 Furthermore, the specificity of the technique is difficult to assess because measurements may be contaminated by larger vessels representing an integrated effect from a larger territory than desired.23,24 A recent alternate approach based on T2 relaxation in MRI, T2-relaxation-under-spin-tagging (TRUST), allows quantification of Yv and CMRO2, but only offers measurements from a single slice placed judiciously in the brain. 25
Our goal is to introduce a method that provides high-resolution, quantitative measurements of the changes in OEF in the presence of physiological challenges, particularly, the administration of vaso-dynamic agents such as caffeine and acetazolamide (brand name Diamox). Using the susceptibility maps that are generated from gradient echo phase data, the susceptibility changes and the corresponding oxygen saturation level for a given vein can be quantified.14,26,27 In this article, we investigated the change in OEF based on the variation of susceptibility differences and, hence, deoxyhemoglobin levels,26,28 between cerebral veins and the surrounding brain parenchyma caused by vaso-dynamic agents. Using an iterative quantitative susceptibility mapping (QSM) approach known as susceptibility weighted imaging and mapping (SWIM), we demonstrated the potential to image the hemodynamics of the brain using the vaso-dynamic agents caffeine and acetazolamide. Furthermore, to assess the effects of these vaso-dynamic agents on the CMRO2, the global and local blood flow measurements were obtained by acquiring ASL data before and after the administration of caffeine and acetazolamide. ASL is a MRI-based method that utilizes blood as a tracer by altering its magnetization using radiofrequency (RF) pulses and provides non-invasive quantification of CBF. 29 Based on the labeling scheme, one of the main categories of ASL techniques is pulsed ASL (PASL), 30 which was used in this article.
Theory
Susceptibility maps are parametric images of relative magnetic susceptibility between tissues (such as a vein and the surrounding brain tissue) and, hence, can provide an endogenous oxygenation-dependent contrast.
14
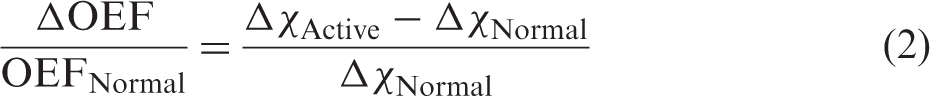
Hemoglobin in red blood cells is the primary carrier of oxygen in the body and, after the tissue extracts the oxygen from it, the resulting deoxyhemoglobin appears in the venous blood. Deoxyhemoglobin is paramagnetic due to the electron spin state of the heme iron and this is reflected in an increased susceptibility of venous blood with respect to the surrounding brain parenchyma. From the susceptibility shift (Δχ) measured using the susceptibility maps derived from the filtered-phase data, the OEF for each vessel can be quantified via:
16

Materials and methods
Forced iterative susceptibility weighted imaging and mapping (FIT-SWIM)
QSM is a means to monitor iron levels in tissue and can be used to monitor oxygen saturation.14,27,31,32 Our own approach, referred to as iterative SWIM has proven to be effective in reducing streaking artifacts in the brain and in improving the susceptibility values as well, 27 however, the streaking artifacts inside the structure-of-interest are still carried forward in the iterations. One way to reduce these artifacts is to set the susceptibility within the structure to a uniform value before applying the iterative algorithm. The idea here is to remove the effect of the streaking artifacts inside the veins by assigning a uniform initial value, which is based on our a priori knowledge about the susceptibility of the deoxyhemoglobin blood. The critical issue here is whether this will still allow the process to converge to the correct susceptibility value despite setting it to an initial empirical assumption. The concept of using a uniform initial value in FIT-SWIM was tested using a 3D brain model consisting of basal ganglia and mid brain structures, gray matter, white matter, and veins. A 3D brain susceptibility model was generated by assigning susceptibilities to various structures in the brain. By using the forward modeling approach, phase information was constructed.33–35 The susceptibility maps were then generated from the resulting phase maps using the iterative SWIM algorithm with and without setting the initial susceptibility values of 0.30, 0.45, 0.70, and 1.0 ppm constant inside the veins. The veins were assigned a uniform value only for the first iteration; and the subsequent iterations were carried out conventionally.
Inducing the physiological challenges
We compared the susceptibility maps before and after ingestion of a 200 mg NoDoz pill for caffeine (Novartis Consumer Health Inc, Parsippany, NJ, USA) and 1000 mg administered intravenously for acetazolamide (Sagent Pharmaceuticals, Schaumburg, IL, USA) to examine the changes in oxygenation levels in the veins. Caffeine is a vasoconstrictive agent and reduces CBF and so the OEF subsequently increases,36–43 while acetazolamide is a vasodilating agent and leads to an increase in CBF and so the OEF decreases.44–47 Subjects were scanned twice with caffeine and acetazolamide doses administered on two different days separated by at least 1 week. The subjects were instructed not to consume any food, drug, or beverage containing caffeine 24 h prior to the scan, and not to have any meal 2 h prior to the scan.
Selection of echo time (TE) for phase-susceptibility measurements
Susceptibility of the structure-of-interest is one of the major factors in selecting the TE. There is a trade-off involved between higher phase SNR at longer TEs versus less T2* signal decay and less phase wrapping at shorter TEs. As a compromise, we used a TE of 15 ms for the 3T acquisition to avoid phase wrapping between the vessel and background tissue, while maintaining a maximum expected phase difference of 2–3 radians for the physiological range of Yv (50–75%). 31
Data acquisition
Susceptibility weighted imaging (SWI) data26,28,48 were acquired once before the intake of acetazolamide or caffeine and then every 15 min for four time points after the intake.48,49 Acquiring data at different time points was essential to study the variation in susceptibility values based on the functional dynamics caused by the drug and to select the time point that provided the peak change. The study was approved by the institutional review board of Wayne State University, Detroit, MI, and performed in accordance with the ethical guidelines of the Declaration of Helsinki. After a thorough explanation of the study, written informed consent was obtained from seven healthy volunteers. All the SWI data were acquired using a radio-frequency (rf)-spoiled, fully flow compensated 3D sequence with the imaging parameters: TE = 15 ms, FA = 13°, TR = 24 ms, BW = 119 Hz/pixel, voxel size = 0.5 × 0.5 × 0.5 mm3, and matrix size = 448 × 336 on a 3T Verio scanner (Siemens Healthcare, Erlangen, Germany). For the first five volunteers, the product PASL 50 sequence from Siemens was used for CBF analysis. QUIPSS II (quantitative imaging of perfusion using a single subtraction, version 2), thin slice TI1, periodic saturation (Q2TIPS) with the proximal inversion with a control for off-resonance effects (PICORE) scheme was utilized with inversion time delays of TI1 = 700 ms (time between the inversion pulse and the beginning of periodic saturation pulses), TI1s = 1600 ms (time between the inversion pulse and the end of periodic saturation pulses), TI2 = 1800 ms (time between the inversion pulse and acquisition of the proximal image), and imaging parameters: TE/TR = 18 ms/3500 ms, FA = 18°, voxel size = 3.5 × 3.5 × 3.5 mm3 and BW = 2441 Hz/pixel.51,52 Interleaved label and control images were acquired using a gradient-echo single shot EPI readout.
Image processing
The original phase images were unwrapped using the Laplacian method,53,54 followed by background field removal using sophisticated harmonic artifact reduction for phase (SHARP) 55 to generate the processed phase map at TE = 15 ms. The signal-to-noise ratio (SNR) in the magnitude images was estimated as the ratio of mean over standard deviation of values measured within a homogeneous region of white matter. By using the arterial binary mask generated from the magnitude data, the flow artifacts inside the arteries were suppressed. 56 The proposed method of FIT SWIM (initial value of 0.45 ppm for veins) was used to produce the local susceptibility distribution maps.
The susceptibility distribution was measured inside the major cerebral veins: right and left internal cerebral veins (ICVs), right and left thalamo-striate veins, right and left septal veins, vein of Galen and straight sinus. The change in susceptibility between the normal brain state (
The CBF maps were calculated according to the formula from Wang et al. (2003), where we assumed longitudinal relaxation time for blood (T1b) = 1650 ms, λ = blood/tissue water partition coefficient = 0.9 g/ml and inversion efficiency, α = 0.95. 57 Whole brain gray matter maps used to measure mean CBF values were produced using statistical parametric mapping (SPM) 12 (Wellcome Trust Centre for Neuroimaging, University College of London, UK) implemented in Matlab (Mathworks Inc., USA).
Statistical analysis
Paired-sample t-tests were performed to assess the differences in FIT-SWIM before and after the caffeine or acetazolamide challenge across the subjects. The p values of less than 0.05 were used to indicate statistical significance. All data are expressed as mean ± standard deviation.
Results
Numerical simulations
The ability of FIT-SWIM to reduce internal streaking artifacts for the straight sinus compared with the conventional iterative SWIM method is shown in Figure 1. The mean and standard deviation of the susceptibility distribution inside the straight sinus was measured as Δχ = 0.41 ± 0.04 ppm for the conventional method, whereas the measured susceptibility distribution was found to be Δχ = 0.45 ± 0.01 ppm and Δχ = 0.46 ± 0.02 ppm when taking the initial values as 0.45 ppm and 0.70 ppm inside the veins, respectively, for FIT-SWIM.
Mean (a) and standard deviation (b) of the susceptibility measured inside the straight sinus at each iteration of the FIT-SWIM algorithm. Different initial values (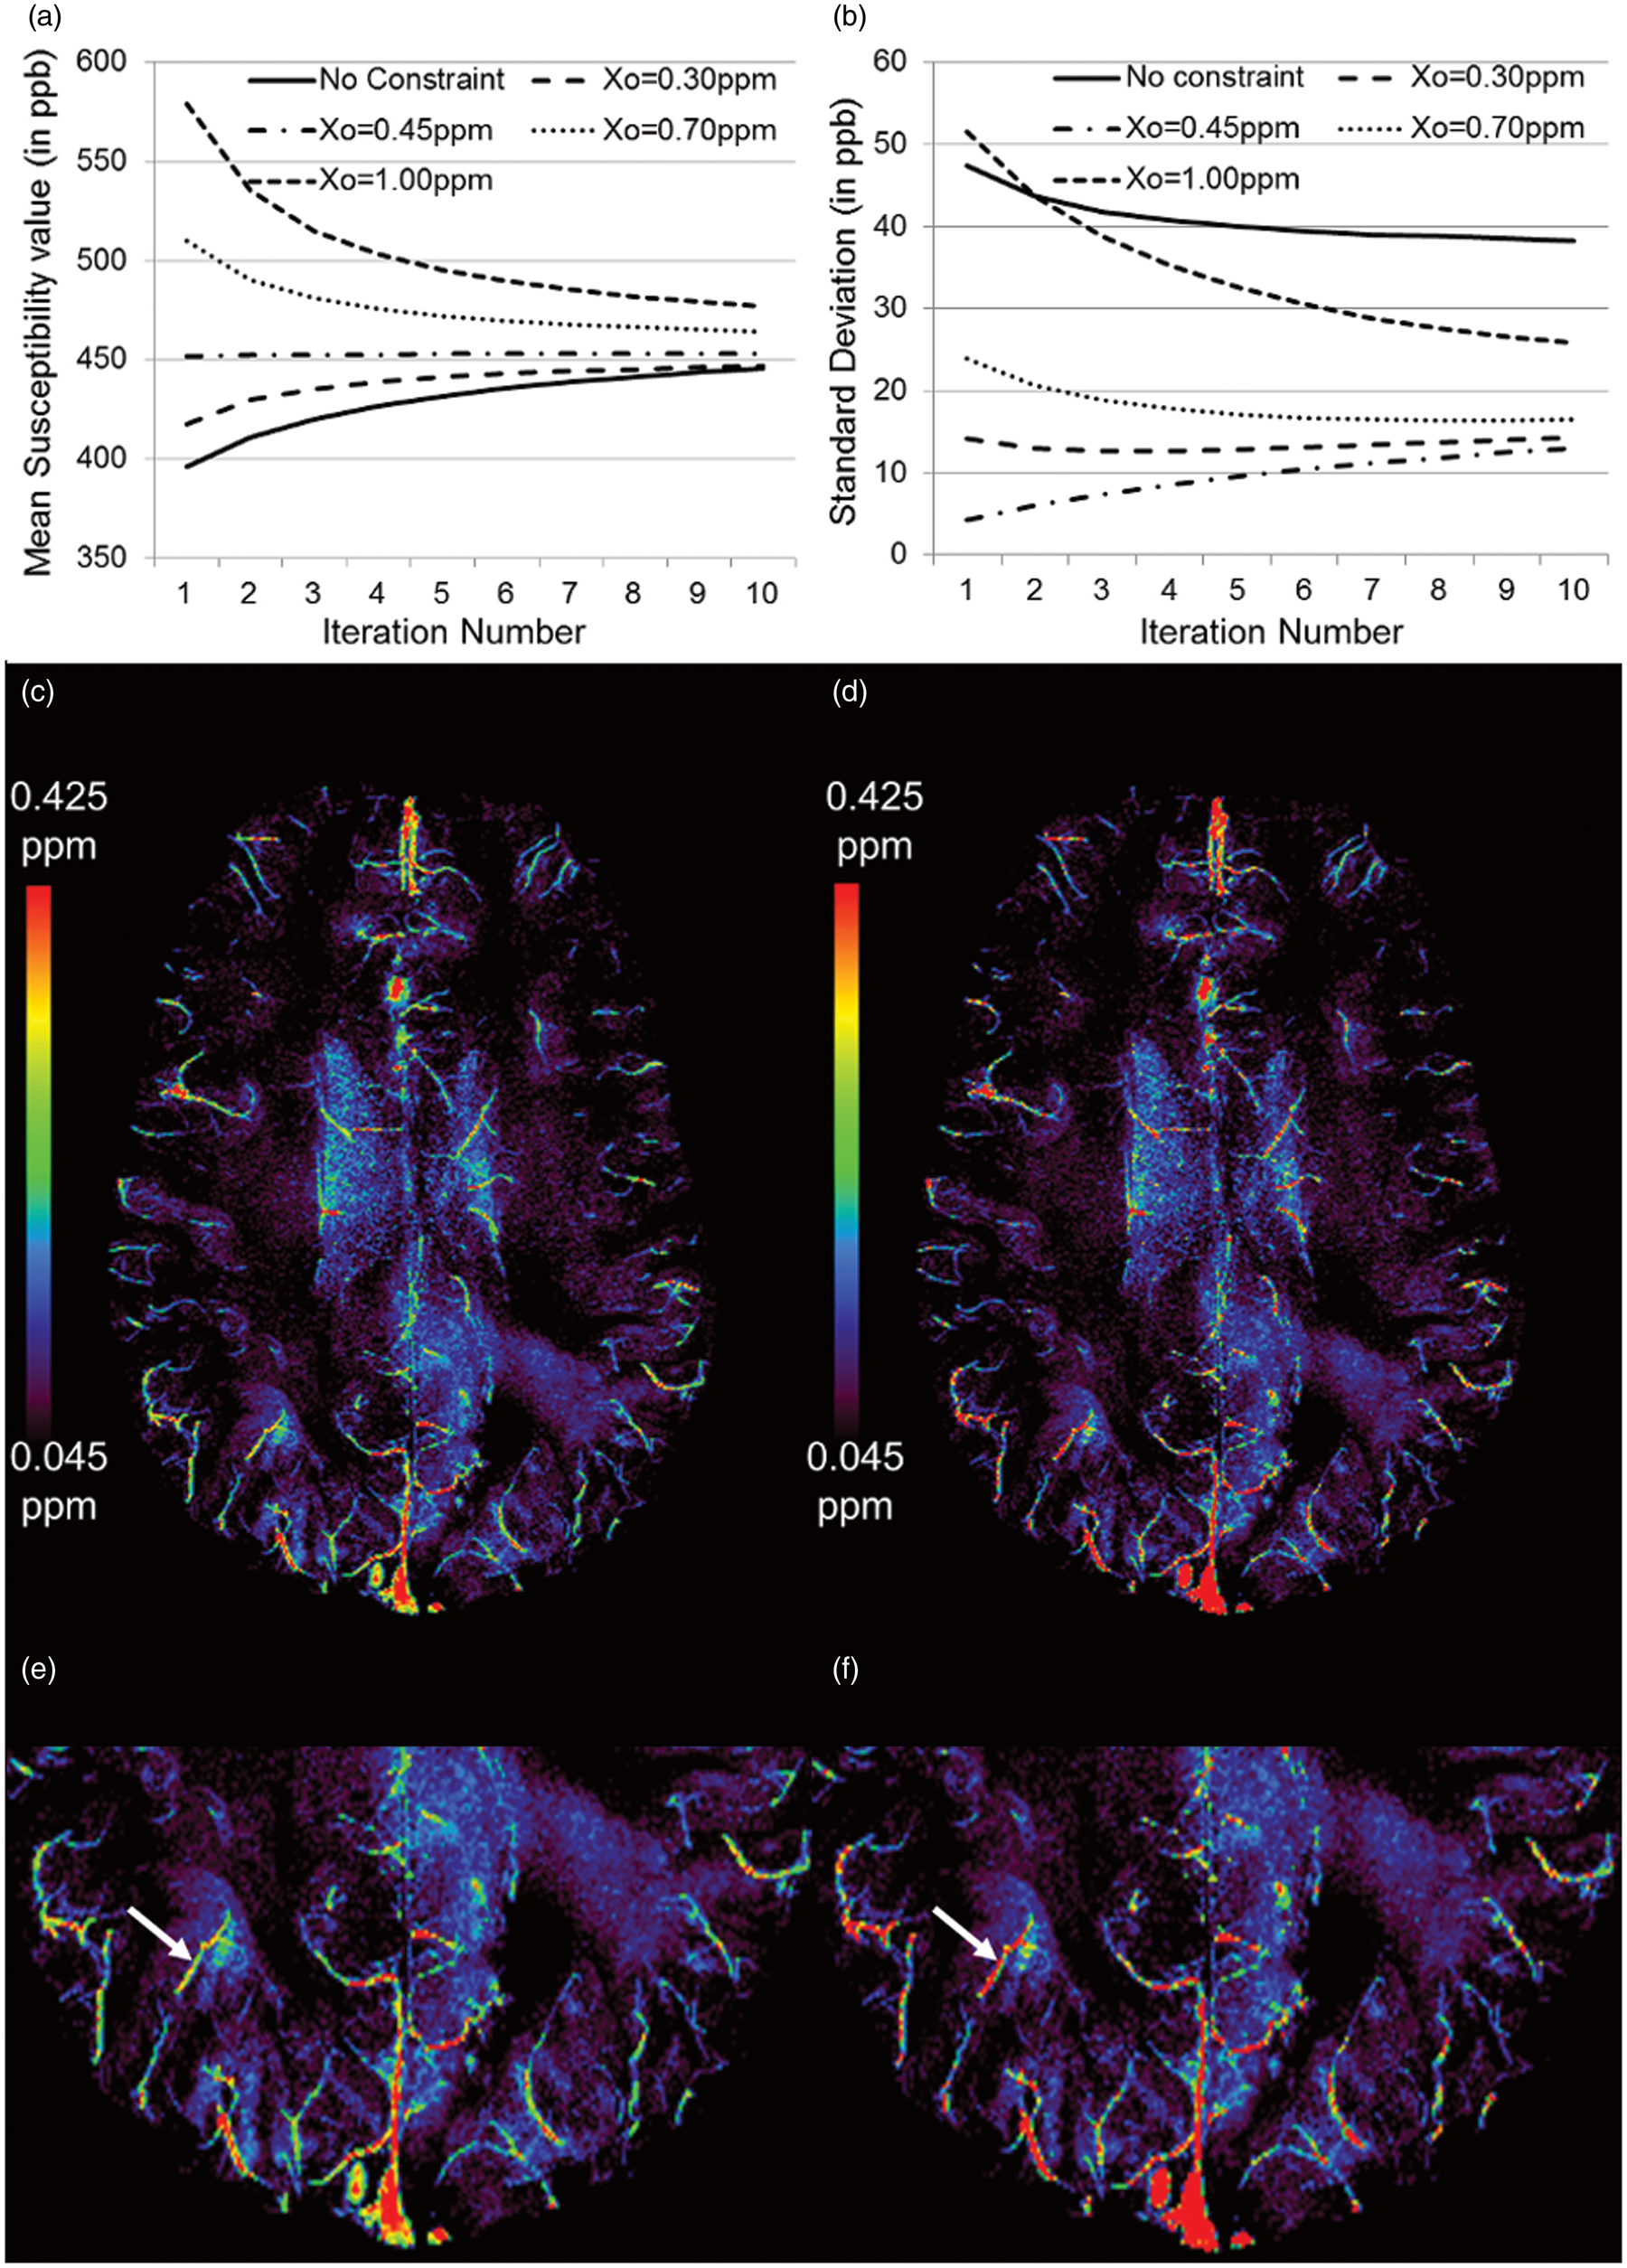
Figure 1(a) and (b) demonstrates that, independent of the choice of the initial value, the mean susceptibility value inside the straight sinus stays at or approaches the correct susceptibility value of 0.45 ppm. This is expected as only a small cone of k-space elements is modified (regularization threshold = 0.1), whereas the other remaining k-space components outside the cone of singularity help drive the value back to the true susceptibility. When the initial value of 0.45 ppm was used, the iterative results were the best in terms of the highest accuracy in the mean susceptibility value (0.453 ppm) and the lowest standard deviation (0.013 ppm). With no constraint on the values inside the straight sinus, the final measured susceptibility value was 0.446 ppm inside the straight sinus, but the standard deviation increased to 0.038 ppm due to the streaking artifacts.
In vivo data analysis
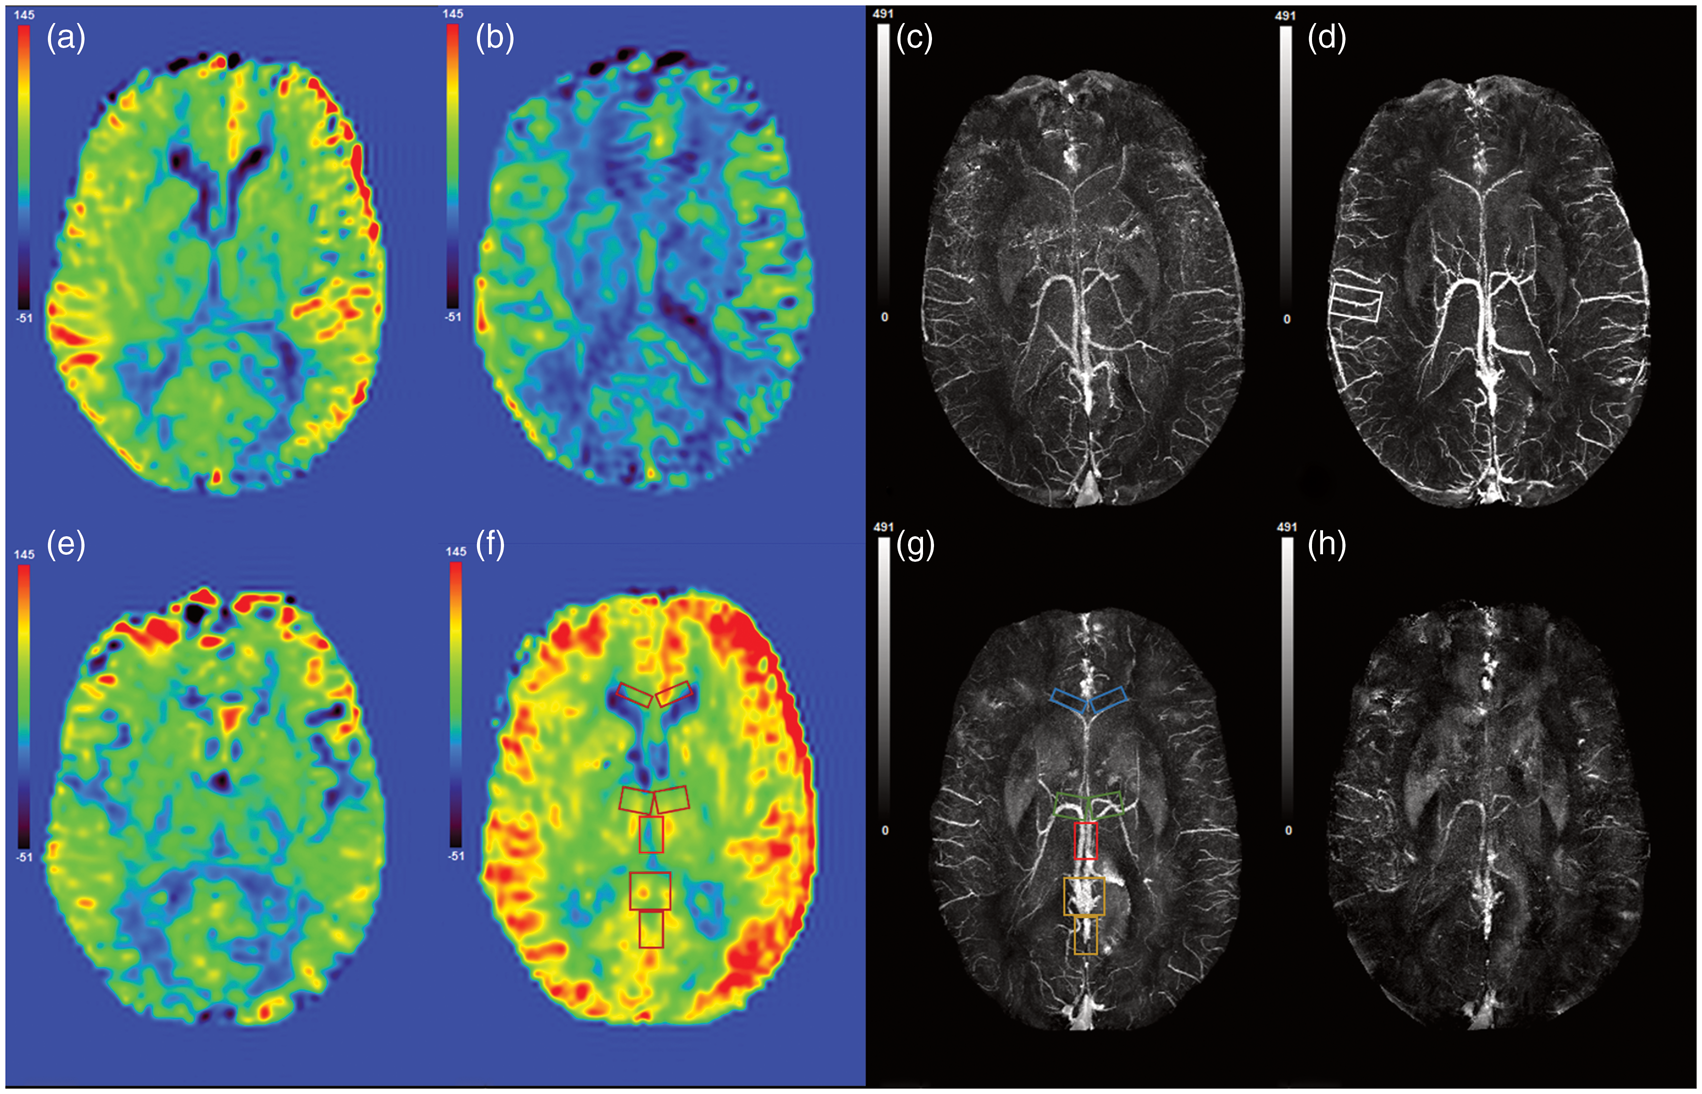
The SNR of the gradient echo magnitude images was measured as SNRmag = 17.8 ± 2.1. Similar to the numerical simulations, the results from the in vivo data (Figure 1(c) to (f)) demonstrate the improvement in the susceptibility reconstruction of the veins. The susceptibility value inside the straight sinus, without initial constraints, was measured to be 0.41 ± 0.14 ppm. On the other hand, when the starting value of 0.45 ppm was assigned, the susceptibility inside the straight sinus increased to 0.45 ± 0.06 ppm. Likewise, the susceptibility of a small peripheral vein improved from 0.32 ± 0.09 ppm to 0.36 ± 0.04 ppm (the vein is identified by the white arrows in Figure 1(e) and (f)). After caffeine intake, there is a clear increase in the susceptibility of venous blood, as can be seen from the brighter venous vessels in Figure 2(a) and (c), indicating an increase in deoxyhemoglobin level. On the other hand, after acetazolamide, there is a clear decrease in the susceptibility of venous blood, as can be seen from the less bright venous vessels in Figure 2(b) and (d), indicating a decrease in deoxyhemoglobin. The profile plots across the ICVs (black line in Figure 2(e) to (h)) demonstrate the effects of caffeine/acetazolamide intake on susceptibility (Figure 2(i)).
Evaluation of dynamic changes in venous susceptibility distribution due to the administration of caffeine and acetazolamide. Phase data were acquired 4 times after the drug ingestion/infusion, at an interval of 15 min. Maximum intensity projection (MIP) of susceptibility maps for the data acquired before (a) caffeine and (b) acetazolamide intake, respectively, (c) MIP of susceptibility maps for the data at the second time point (30 min) after caffeine intake, (d) MIP of susceptibility maps at the second time point (30 min) after acetazolamide intake. MIP images were generated from susceptibility maps over 32 slices or 16 mm in the slice-select direction. (e) to (h) represent zoomed insets of images (a) to (d), respectively. The profile plot (i) demonstrates the variation in susceptibility values across the septal veins, along the black lines shown in (e) to (h), caused by these altered brain states.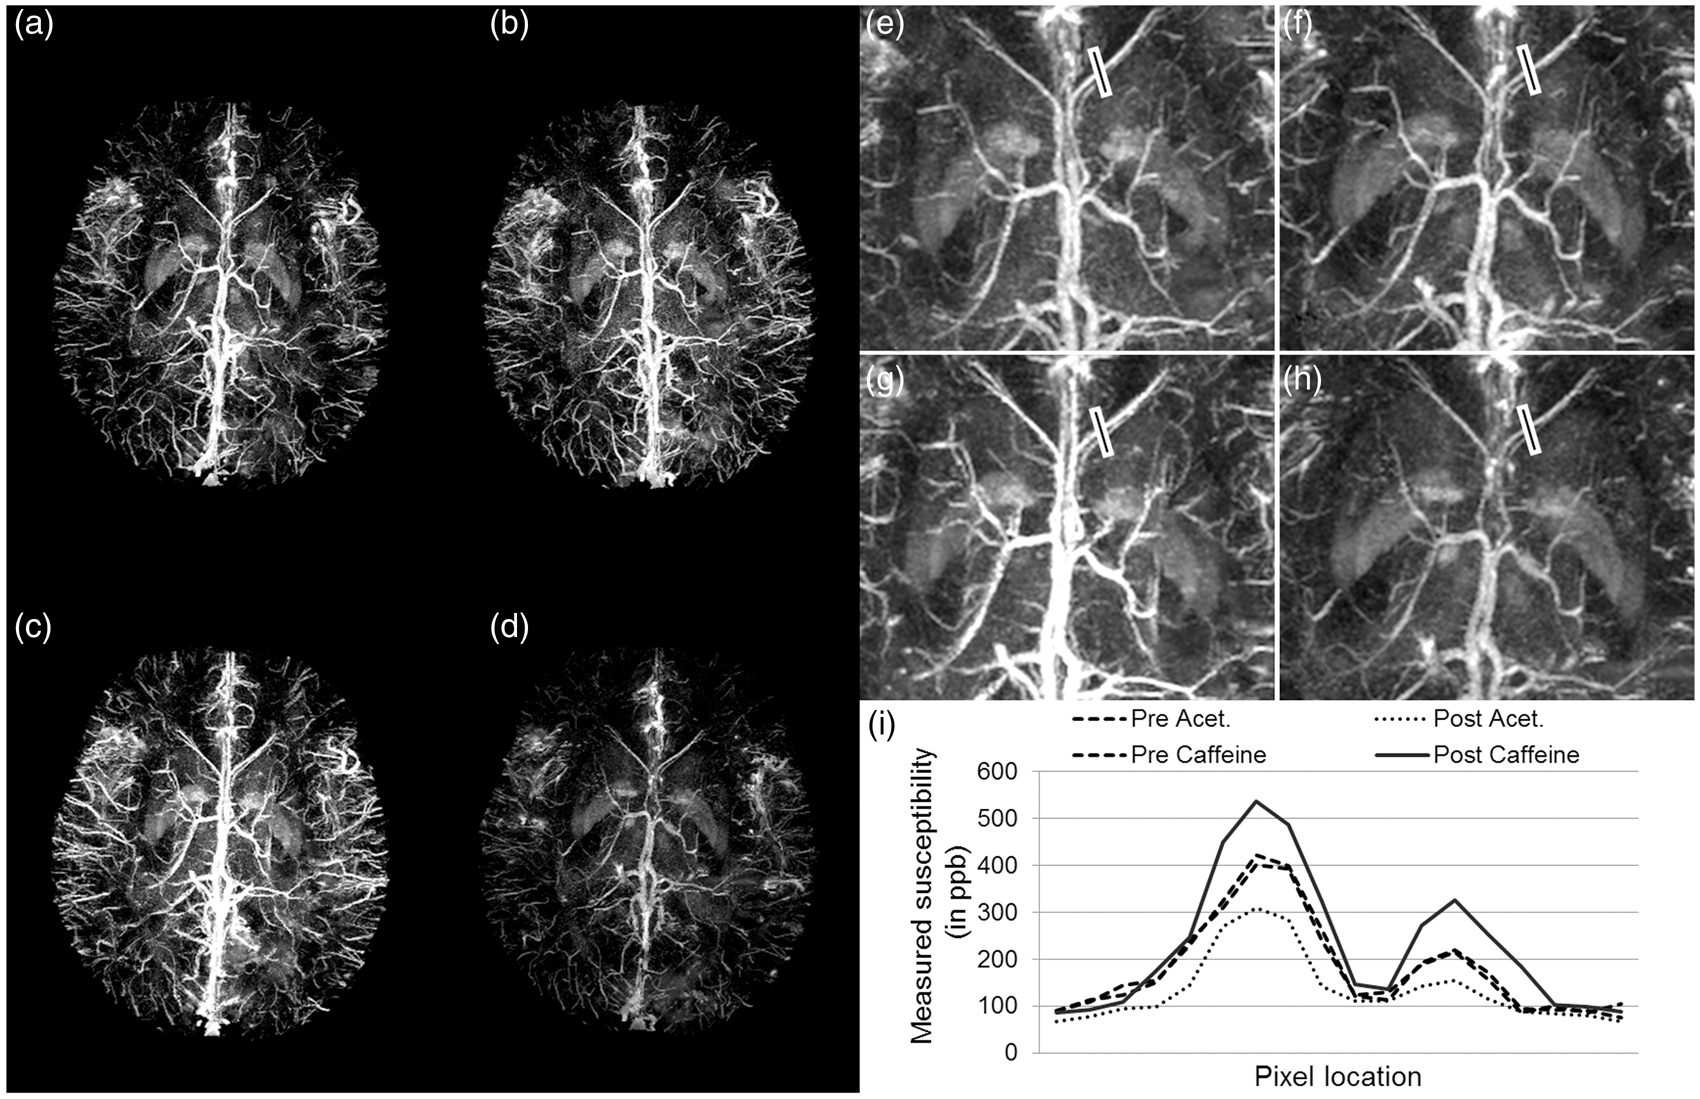
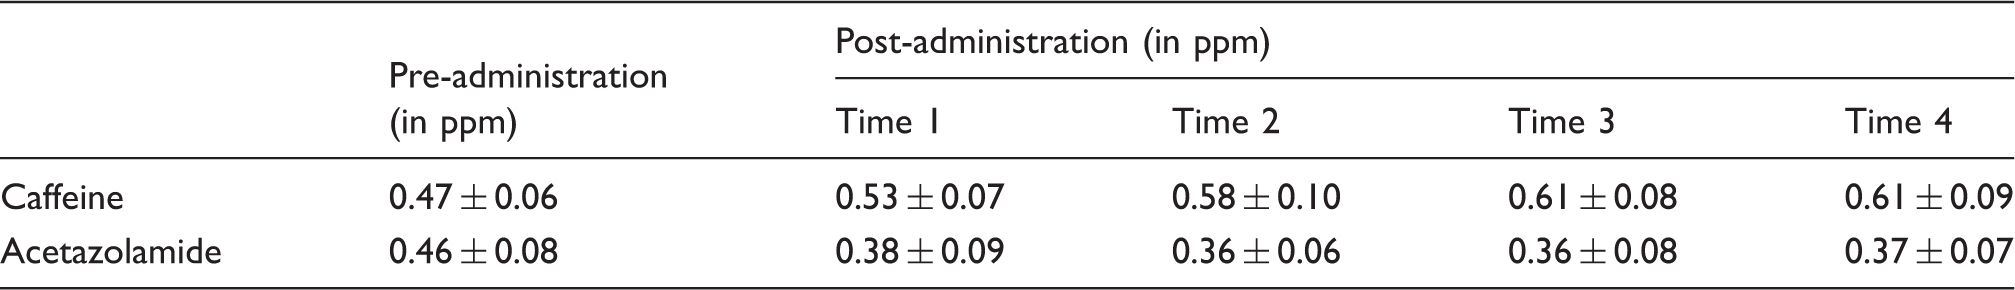
Measured susceptibility values inside the internal cerebral veins before and at four time points (at intervals of 15 min) after caffeine and acetazolamide administration.
Histograms of the mean GM CBF values before and after the intake of acetazolamide, for one healthy volunteer are shown in Figure 3. Whole brain GM mean CBF was measured during caffeine administration as pre CBF = 46.5 ml/100 g of tissue/min and post CBF = 32.4 ml/100 g of tissue/min. Similarly, for acetazolamide administration, pre CBF = 51.4 ml/100 g of tissue/min and post CBF = 67.7 ml/100 g of tissue/min. Hence, the relative change in the whole brain mean CBF in the presence of caffeine and acetazolamide was calculated as (ΔCBFcaffeine)/(CBFcaffeine) ≈ –30.3% and (ΔCBFAcet)/(CBFAcet) ≈ +31.5%. The CBF maps before and after the caffeine and acetazolamide administration and their respective susceptibility maps are shown in Figure 4. In addition, the regional measurements surrounding major veins provide a direct comparison with our SWIM values acquired from these major veins. The areas for regional CBF measurements are highlighted in Figure 4(f) and (g). The regional CBF values are stated in Figure 5 alongside the susceptibility mapping results.
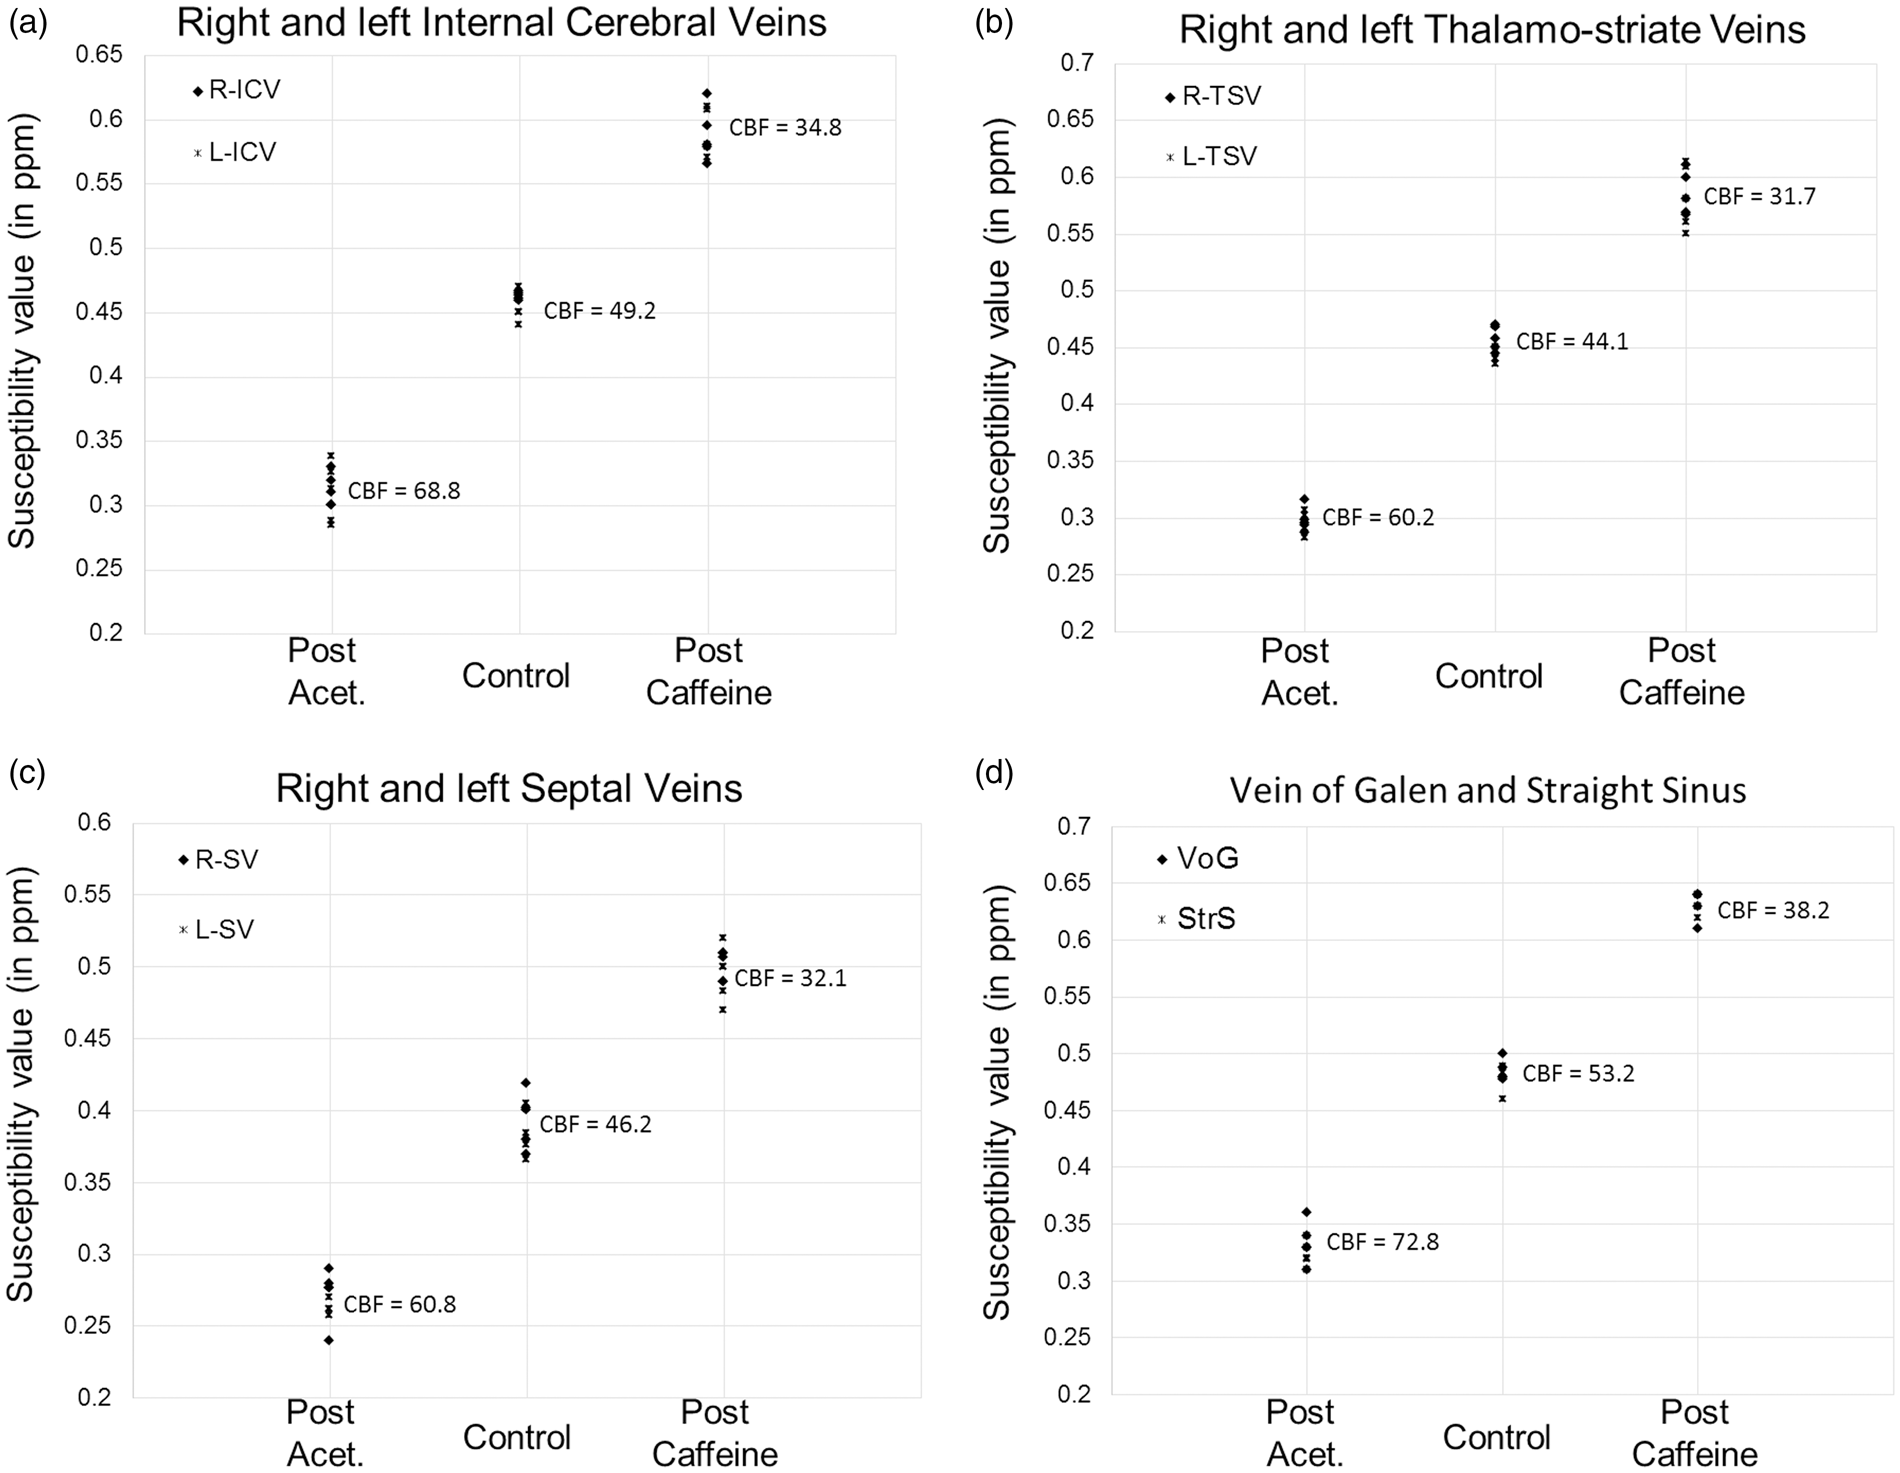
The histogram of the gray-matter (GM) mean CBF values generated from pulsed ASL (PASL) data of one healthy volunteer. Caffeine and acetazolamide were administered on separate days. GM mean CBF values in ml/100 g/min: CBFNormal = 51.4, CBFCaffeine = 32.1, and CBFAcet = 67.7. CBF maps (a) before and (b) after the intake of caffeine. Susceptibility maps (c) before and (d) after the intake of caffeine. Similarly, (e), (f) and (g), (h) are CBF and susceptibility maps before and after acetazolamide administration. The areas measured for regional CBF values are highlighted in (g) as right and left internal cerebral veins = red; right and left thalamo-striate veins = green; right and left septal veins = blue; vein of Galen and straight sinus = orange. Susceptibility values measured inside the major cerebral veins across five healthy volunteers: (a) right and left internal cerebral veins (R-ICV, L-ICV); (b) right and left thalamo-striate veins (R-TSV, L-TSV); (c) right and left septal veins (R-SV, L-SV); and (d) vein of Galen (VoG) and straight sinus (StrS). The phase data were acquired before and after the administration of acetazolamide and caffeine with TE = 15 ms and a voxel resolution = (0.5 mm3). Each drug test was performed on separate days. The susceptibility values generated from the data acquired pre-administration of these drugs were averaged. The mean regional CBF values (in ml/100 g of tissue/min) surrounding these major veins are stated for each vaso-dynamic brain state.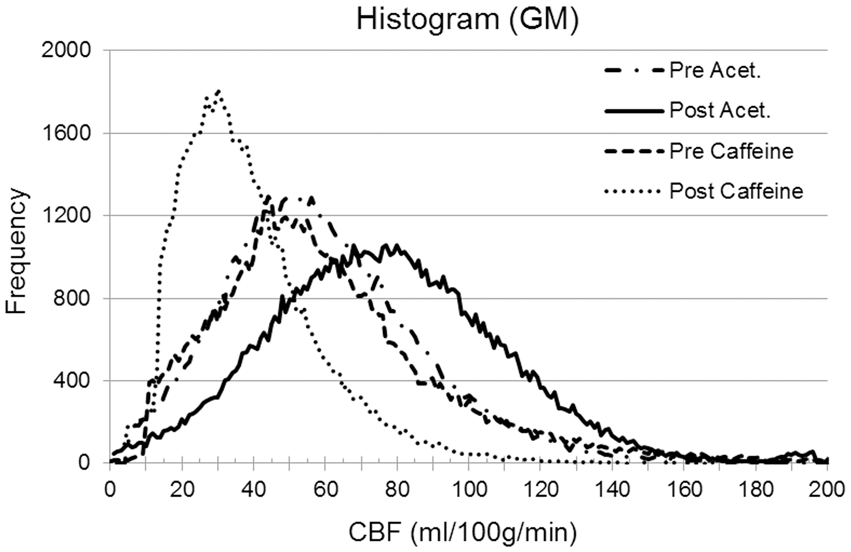
Mean ± inter-subject variability of the percentage change in oxygen extraction fraction for cerebral veins of different vessel sizes, across five healthy subjects, measured before and after administration of acetazolamide and caffeine.
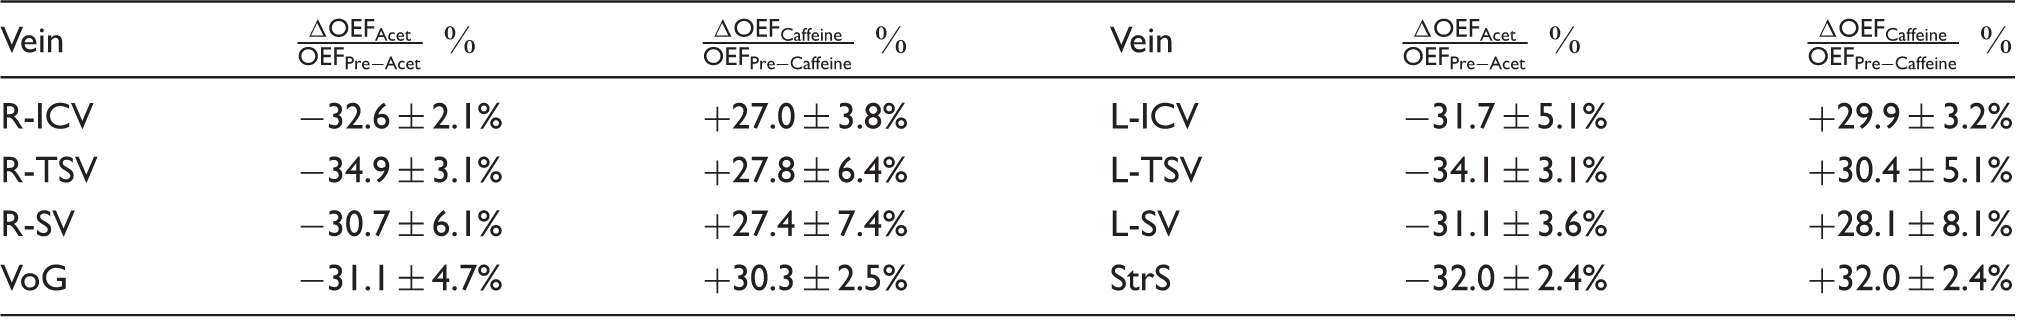
R-ICV, L-ICV: right and left internal cerebral veins; R-TSV, L-TSV: right and left thalamo-striate veins; R-SV, L-SV: right and left septal veins; VoG: vein of Galen; StrS: straight sinus.
Discussion
In this article, we have proposed a new QSM approach referred to as FIT-SWIM to reduce streaking artifacts by forcing susceptibility values to be uniform in the first iteration of the iterative SWIM approach. This method was then used to quantify in vivo local OEF changes in the brain in the presence of both caffeine and acetazolamide. The iterative SWIM approach itself has been used previously to evaluate contralateral changes in OEF in stroke by evaluating the presence of asymmetrically prominent cortical veins (APCV). 1 These changes have been ascribed to hypo-perfusion that leads to an effective OEF increase while the usual level of oxygen metabolism is maintained.
We have demonstrated that FIT-SWIM, even when using the constant phase constraint for just the first iteration, reduced not only the external streaking artifacts but also the streaking inside the veins. The plots shown in Figure 1(a) and (b) show that the method is robust against the errors made in assuming the initial phase value, as the measured susceptibility value converges toward the actual value. However, the closer the assumed value to the actual value, the faster the convergence. Hence, it is advantageous to have a priori information of the susceptibility value for the structure-of-interest. Consistent with the simulated results, the susceptibility maps reconstructed from the in vivo data (Figure 1(c) to (f)) using FIT-SWIM showed improvement over the conventional iterative SWIM. As part of the general processing, we also removed phase from the arteries to further reduce streaking artifacts from incomplete flow compensation. 56
In addition to measuring the oxygen saturation in a normal brain state, it can be useful to invoke special physiological challenges, such as vasodilation or vasoconstriction, to determine the state of autoregulation or cerebral vascular reserve. Caffeine-related antagonism reduces the ability of adenosine to contribute to functional increases in CBF.36,40,41,58 Since brain activity appears to remain constant, the decrease of CBF in the presence of caffeine should lead to an increase of OEF when CMRO2 is constant. The increased OEF would lead to an increase of deoxyhemoglobin in the venous blood; therefore, we expect to see higher susceptibility values in the post caffeine case.
59
This is validated in our study where it is clear that caffeine caused a decrease in the venous oxygen saturation levels, inside the ICVs from normal (
Some of the limitations of this study include limited resolution, the use of estimates for hematocrit and arterial oxygen saturation, and possible habituation for caffeine drinkers. Ideally, the measured variation should reflect the exact physiological alterations in the local venous vasculature where oxygen exchange between the cerebral vessels and tissue occurs during neural activation. In reality, the sensitivity in the smaller veins is confounded by the partial volume effect due to the limited resolution. There is much room for improvement in resolution by introducing fast imaging techniques such as compressed sensing.63–65
To calculate the venous oxygen saturation levels, several physiological parameters such as arterial oxygenation saturation level (Ya) and total hemoglobin concentration (Hct) are, in general, assumed constant among subjects. However, hematocrit values are dependent on the age and sex of the subject with normal levels ranging from 40.7% to 50.3% for males and 36.1% to 44.1% for females. 66 Making an assumption about the hematocrit will clearly impact the exact value of the estimated oxygen saturation. Therefore, our strategy was to estimate the percentage change in OEF values before and after the drug intake instead of its absolute value, which is independent of Hct.
Monitoring CMRO2 to see if it remains the same after these challenges requires CBF measurements,67,68 as CMRO2 is proportional to the product of OEF and CBF. A reduction of CBF by 30% was observed in response to caffeine intake, which is in good agreement with the previous studies.37,69–71 The change in oxygen saturation has been previously shown to be related to CBF changes: 28 |ΔY/(1–Y)| ≈ |ΔCBF/CBF|. From our QSM results, for caffeine and acetazolamide experiments: ΔYcaffeine = 0.09 [|ΔYcaffeine/(1–YNormal)| = 30%] suggests that the CMRO2 remains stable between normal and challenged brain states for a healthy subject. This uncoupling of CBF and CMRO2 is consistent with caffeine acting primarily on adenosine receptors to constrict blood vessels and reduce CBF, with a considerably weaker effect on energy metabolism. 72 The decrease in CBF is therefore revealed by increased OEF, in agreement with recent studies on the effect of caffeine on CMRO2.72,73 In addition, the CMRO2-CBF uncoupling is also observed for acetazolamide administration, where an increase in CBF by 32% is accompanied by the decrease in oxygen fraction, ΔYAcet = 0.1 [|ΔYAcet/(1–YAcet)| = 33.3%]. Previous PET studies have shown either no significant effect of acetazolamide on CMRO2 and neuronal activity 74 or at best a slightly decreased CMRO2. 44 This effect of acetazolamide on CBF is probably explained by a decrease in brain pH rather than by brain tissue hypoxia due to inhibition of oxygen unloading in the brain capillaries.
As for potential habituation effects for heavy coffee drinkers, Field et al. (2003) reported a higher caffeine-induced response, i.e. CBF reduction, in heavy caffeine users (>300 mg/day). 71 Consequently, the susceptibility values of veins should be larger as well. However, they investigated the subjects after more than 30 h of caffeine deprivation, when typical withdrawal symptoms, such as headache and fatigue, reach a maximum in intensity. 58 In contrast to their study design, we did not recruit heavy caffeine users. We consider it a more realistic scenario that the users are not in a state of severe withdrawal when the subjects refrain from caffeine intake 24 h prior to the scan.
In conclusion, this article demonstrated an improvement in iterative SWIM using FIT-SWIM for susceptibility mapping and showed that there appears to be decoupling between flow effects and CMRO2 by using both FIT-SWIM and CBF changes as measured with ASL. Further, the vascular effects of acetazolamide and caffeine, in normal human subjects, were proven to be large enough to be easily measured. Therefore, this susceptibility difference could serve as a sensitive biomarker for measuring cerebro-vascular reserve in stroke and other diseases.
Footnotes
Funding
The author(s) disclosed receipt of the following financial support for the research, authorship, and/or publication of this article: This work was supported in part by the Department of Defense through award DOD/USAMRAA W81XWH-12-1-0522 and by the National Institutes of Health (NIH) (grant number R21NS090153).
Acknowledgments
The views, opinions, and/or findings contained in this report are those of the author(s) and should not be construed as an official government position, policy or decision unless so designated by other documentation.
Declaration of conflicting interests
The author(s) declared no potential conflicts of interest with respect to the research, authorship, and/or publication of this article.
Authors' contributions
SB, YY, and EMH: project design; SB: data processing, analysis, manuscript drafting and revising; YY: subject recruitment and data acquisition; EMH: critiquing and final approval.