
Abstract
Spreading depolarization-induced focal dendritic swelling (beading) is an early hallmark of neuronal cytotoxic edema. Pyramidal neurons lack membrane-bound aquaporins posing a question of how water enters neurons during spreading depolarization. Recently, we have identified chloride-coupled transport mechanisms that can, at least in part, participate in dendritic beading. Yet transporter-mediated ion and water fluxes could be paralleled by water entry through additional pathways such as large-pore pannexin-1 channels opened by spreading depolarization. Using real-time in vivo two-photon imaging in mice with pharmacological inhibition or conditional genetic deletion of pannexin-1, we showed that pannexin-1 channels are not required for spreading depolarization-induced focal dendritic swelling.
Introduction
The ion fluxes during spreading depolarization (SD) lead to an abrupt partial loss of the transmembrane ion gradients followed by a rapid accumulation of water inside neurons and astrocytes. 1 SD-induced neuronal edema involves swelling of the somata and focal swelling or beading along the dendritic shaft separated from each other by thin segments rendering a dendritic appearance to resemble “beads-on-a-string.” Astrocytes express abundant water-selective aquaporins, whereas pyramidal neurons have not been reported to express functional aquaporins in their plasma membrane. 2 In line with these data, we have shown that pyramidal neuronal cell bodies, dendrites, and axons resist volume change in the face of acute osmotic stress, even as the surrounding astrocytes swell.3–5 This implies that passive osmotically obligated water entry after the ionic movements during SD is unlikely. Without functional aquaporins the molecular pathways by which bulk water molecules rapidly cross the osmotically tight neuronal plasma membrane during SD have remained elusive, but some candidates were chloride-coupled cotransporters and pannexins. By translocating a significant amount of water together with substrate in the direction dictated by the transmembrane ion gradients, 6 neuronal chloride cotransporters could significantly impact the volume of neurons lacking aquaporins. Accordingly, we have recently shown that SD-induced dendritic beading occurs, at least in part, as a consequence of altered driving forces, transport direction, and activity of several neuronal chloride-coupled cotransporters. 5 However, the beading was substantially but not entirely blocked by pharmacological inhibition of these cotransporters suggesting an involvement of additional parallel pathways for water entry. Here we tested if SD-induced pannexin-based water permeability contributes to dendritic beading.
Pannexins are large-pore nonselective ion channels broadly expressed in the CNS that can pass substances up to 1000 Da between the cytosol of cells and the extracellular space. 7 Pannexin-1 (Panx1) is abundantly expressed in pyramidal neurons of the cerebral cortex and the hippocampus8–11 and at the subcellular level it is present at postsynaptic sites. 12 Panx1 forms plasma membrane ion channels that can be opened by depolarization,13,14 high extracellular [K+]o, 15 strong elevation of intracellular [Ca2+]i, 16 activation of NMDA receptors, 17 and by mechanical stretch. 18 All of these conditions are present during SD, implying that the opening of Panx1 could instantly “flood” neurons with water and contribute to dendritic beading. Indeed, Panx1 channels could be directly activated by ischemia in acutely isolated hippocampal neurons, 19 by ischemia-induced SD in brain slices, 17 and in vivo by KCl-induced SD. 20 The uptake of large molecules of fluorescent dyes during Panx1 opening19,20 might indicate water entry together with the dye. However, it should not be immediately assumed that Panx1 conducts water as these channels display different permeability and gating for small atomic ions and fluorescent dyes. 21 Indeed, the exact water permeability profile for Panx1 has not yet been determined. Here, using in vivo two-photon laser scanning microscopy (2PLSM) in combination with pharmacological and genetic approaches, we investigated if Panx1 large-pore ion channels activated during SD contribute to dendritic beading.
Materials and methods
Transgenic mice and viral transduction
All procedures followed NIH guidelines for the humane care and use of laboratory animals. The Animal Care and Use Committee at the Medical College of Georgia approved all procedures in accordance with ARRIVE guidelines. Conditional Panx1 knock-out mice co-expressing a floxed Panx1flx/flx and a tamoxifen-inducable Cre recombinase-ERT2 under the wolfram syndrome 1 promoter have been described before. 17 Following tamoxifen administration, Cre activity is directed to neurons of layers II/III and V of the neocortex, hippocampus, striatum, thalamus, and cerebellum. 22 Homozygous Panxflx/flx mice were identified by PCR using a sense primer (5′-ACCTAAGAGACGGACCTG-3′) and an antisense primer (5′-GAATCAATCCTCTGTGCCT-3′). PCR products were separated on a 2% NuSieve GTG agarose gel (Lonza). The presence of Cre construct was confirmed using a Cre-F (ACGCACTGATTTCGACCAGGTTCG) and Cre-R (CATTCTCCCACCGTCAGTACGTGAG) primers (Integrated DNA Technologies). Founders of the B6.Cg-Tg(Thy1-EGFP)MJrs [GFP-M] colony were provided by Dr. J.Sanes (Harvard University). GFP-M mice express EGFP in sparse subsets of neocortical and hippocampal pyramidal neurons. 23 We used adult mice of both sexes; five GFP-M mice (51–73 days old), six Panxflx/flx + Cre, and four Panxflx/flx without Cre mice (68–287 days old) and five wild-type mice (79–178 days old). Animals were anesthetized using isoflurane (4% induction, 1–1.5% maintenance in 21% oxygen) and a small hole was made over somatosensory cortex to allow adeno-associated virus (AAV) delivery. Panxflx/flx + Cre mice were injected with 500 nL AAV5.CamKII0.4.eGFP.WPRE.rBG; titer 8.72 × 10¹³ GC/mL, diluted 1:10 in saline (UPenn Vector Core, catalog #AV-5-PV1917) and 500 nL of Cre-dependent AAV8-hSyn-DIO-mCherry; titer 8 × 10¹² GC/mL, diluted 1:10 in saline (UNC Vector Core). Panxflx/flx mice were injected with 500 nL AAV/DJ-CamKII-eGFP-T2A-iCRE; titer 3.6 × 10¹³ GC/mL, undiluted (Vector Biolabs VB, catalog #VB1918). Viruses were injected over 5 min using micropump (WPI) with micropipette placed to a depth of ∼500 µm and mice recovered for two to three weeks. Panxflx/flx + Cre mice were injected intraperitoneally with tamoxifen (200 mg/kg in corn oil) every other day for a total of 3 doses and recovered 10–15 days.
Preparation for in vivo imaging
Craniotomy for the optical window followed standard protocol. 24 An optical chamber was constructed by covering the intact dura with a cortex aCSF (in mM: 135 NaCl, 5.4 KCl, 1 MgCl2, 1.8 CaCl2, and 10 HEPES, pH 7.3). The chamber was open for access with glass micropipettes. Mice were anesthetized with an intraperitoneal injection of urethane (1.5 mg/g body weight) and maintained under urethane anesthesia with heart rate (450–650 beats/min) and blood oxygen saturation (>90%) monitored with a MouseOx® pulse oximeter (STARR Life Sciences). The trachea was cannulated and mice were ventilated with a SAR-1000 (CWE). Body temperature was maintained at 37℃ with a heating blanket (Harvard Apparatus). Hydration was maintained by intraperitoneal injection of 100–300 µL 0.9% NaCl with 20 mM glucose hourly. A 0.1 ml bolus of 5% (w/v) Texas Red Dextran (70 kDa) (Invitrogen) in 0.9% NaCl was injected into the tail vein for blood flow visualization. Chemicals were from Sigma unless indicated otherwise.
Electrophysiology
The DC potential was recorded with a glass microelectrode (1–2 MΩ) inserted next to imaged dendrites. SDs were induced by a pressure-injection of <5 nL of 1 M KCl with Picospritzer (Parker Hannifin) with a micropipette placed remotely ∼2 mm away. Signals were recorded with a MultiClamp 200B amplifier, filtered at 1 kHz, digitized at 10 kHz with Digidata 1322A and analyzed with pClamp 10 (Molecular Devices).
Imaging and analysis
2PLSM images were collected with 40 × /0.8 NA water-immersion objective (Zeiss) using the Zeiss LSM510 NLO META multiphoton system mounted on the Axioscope 2 FS microscope. The Spectra-Physics Mai-Tai laser was used for two-photon excitation. Image stacks consisting of 18–20 sections were taken at 1 µm increments using a 3 × optical zoom across a 75 × 75 µm imaging field. Images were processed with Huygens deconvolution software (scientific volume imaging) and analyzed with NIH ImageJ. All experiments were quantified blindly to the experimental conditions. Dendritic beading was quantified as reported previously.5,25,26 Briefly, maximum intensity projection (MIP) of 3D image stacks was divided into 6 × 6 squares (12.5 × 12.5 µm), and only the squares containing dendrites were counted. The percentage of squares containing beaded dendrites was calculated. The cross-sectional area of individual dendritic beads was traced manually using MIPs. Such analysis was adequate to determine relative changes in the size of dendritic beads, which underestimated the actual volume changes assuming they are approximately isotropic. 5
Two-dimensional maps of cerebral blood flow (CBF) were acquired by laser speckle imaging as described elsewhere.24,27 The cortical surface was illuminated by a 785 nm StockerYale laser and images were collected with 4 × /0.075 NA objective (Zeiss) at 13 Hz with 20 ms exposure time using the Zeiss AxioCam MRm CCD camera. Images of speckle contrast were converted to speckle correlation time images (τc) 27 and relative changes in CBF velocity were computed at different experimental time points.24,26,28 SigmaStat (Systat) was used for statistical analyses.
Immunohistochemistry
After imaging, brains were drop fixed in 2% paraformaldehyde overnight and then switched to citrate buffer for antigen retrieval. Brains were then frozen in sucrose and 10 μM sections were cut and incubated in a blocking solution (5% donkey serum and 0.1% Saponin in PBS). The c-terminal antibody (anti-Panx1, Invitrogen, catalog #488100) was diluted 1:250 in blocking solution and slices were incubated for 24 h. After three washes, slices were incubated with secondary antibody (Alexa Fluor 488, AbCam, catalog #150073) diluted 1:100 in blocking solution for 3 h, mounted onto slides, and visualized with the Zeiss confocal LSM510 microscope.
Results
To test if Panx1 participates in SD-induced dendritic beading, we started with a pharmacological approach using the potent Panx1 blocker (±)-erythro-(R*/S*)-mefloquine (IC50 = 52.7 ± 2.2 nM)
29
(Bioblocks, catalog #QU024-1). Several rounds of transient beading coinciding with the passage of normoxic SDs26,30 were evoked at 1 h intervals by a pressure-injection of small quantities of 1 M KCl.5,31 Laser speckle imaging before each SD shown an absence of apparent drug effects on major blood vessels after a cortex aCSF with 25 µM mefloquine32,33 was applied to the dura surface (Figure 1(a)). To circumvent confounding consequences of SD-induced oligemia typically observed in mice,34,35 we used five control mice without SD to test if mefloquine application could affect blood flow in the capillary bed. Indeed, quantification revealed a significant increase in blood flow in the capillary bed by 30 min after drug administration (Figure 1(b)), indicating that mefloquine penetrates the dura under our experimental conditions. When the first control SD transited though the imaging field, rapid reversible beading occurred(Figure 1(c)). Three, hourly KCl-induced SDs, triggered through the imaging field after mefloquine application also resulted in transient dendritic beading (Figure 1(d)). There was a tendency toward a reduction of SD amplitude during mefloquine application but it reached significance only at 3 h (16.9 ± 0.4 mV for first control SD, 15.7 ± 0.5 mV for second SD after 1 h of mefloquine exposure, 14.3 ± 0.4 mV for third SD at 2 h and 12.4 ± 1.2 mV for fourth SD at 3 h of mefloquine exposure; n = 5 mice, p < 0.01 one-way RM ANOVA). There were no significant differences between SD duration (44.9 ± 2.7 vs. 42.5 ± 1.8 vs 38.8 ± 3.0 vs. 41.2 ± 4.2 s for the first through fourth SD respectively, p = 0.3 one-way RM ANOVA) and slope of these consecutive SDs (3.5 ± 0.1 vs. 3.3 ± 0.3 vs. 2.7 ± 0.2 vs. 2.6 ± 0.3 mV/s, p = 0.07 one-way RM ANOVA). Thus, mefloquine was not affecting quantitative parameters of SD, at least during the first 2 h of application. The amount of beading was also unaffected up to 3 h of mefloquine exposure (Figure 1(e)). Bead size at 11.3 ± 0.5 s after SD onset was similar between control and third SD elicited at 2 h of mefloquine application, with the cross-sectional area of individual dendritic beads reaching 4.38 ± 0.28 and 4.51 ± 0.31 µm2, respectively (Figure 1(f); n = 46 beads in 5 mice, p = 0.63). These data suggest that pharmacological inhibition of Panx1 with mefloquine was not effective in the reduction of SD-induced dendritic beading.
Dendritic beading elicited by normoxic SD in vivo was not affected by the Panx1 blocker mefloquine. (a) Laser speckle contrast imaging of area within the craniotomy where flowing blood vessels appear dark. Representative image of 2PLSM area is shown with a square, glass recording, and KCl electrodes shown with dashed lines, and craniotomy boundary is marked with a curved dashed line. The second speckle image was taken just before an SD invaded an imaging area of the cortex treated with 25 µM mefloquine for 2 h (dura intact) and shows no obvious changes in appearance of large flowing blood vessels. (b) Time course of relative changes in average CBF velocity in the capillary bed over 3 h after mefloquine application in five control mice without SD induction. Changes in CBF velocity were calculated by using inverse speckle correlation time values corrected for the biological zero CBF level determined after cardiac arrest induced by air embolization into the tail vein at the end of each experiment. Every data point for each animal was calculated by averaging of 34 regions of interest covering most of the imaging field but omitting major vessels. Asterisks indicate significant difference from the time point of 0 min, which corresponds to the time of mefloquine application (one-way RM ANOVA with Tukey’s post hoc test). *p < 0.05. (c) 2PLSM MIP image sequence before mefloquine treatment showing rapid beading and recovery of EGFP-expressing dendrites (green) and Texas Red Dextran labeled blood vessels (red) during the passage of control SD. Brief focal injections of KCl from outside the imaging area were used to induce SDs. Time of image acquisition during SD is reflected with arrows and were obtained with a glass microelectrode in close proximity to the imaging site. (d) 2PLSM MIP series showing rapid SD-induced dendritic beading and recovery at 2 h mefloquine application, which appear similar to the control SD. (e) Quantification of SD-induced dendritic beading reveals that beading was not significantly different after 1, 2, and 3 h of 25 µM mefloquine (n = 5 mice). Asterisks at the bar during SD indicate significant difference from the time points Pre-SD and Post-SD (one-way RM-ANOVA with Tukey’s post hoc test). *p < 0.001. (f) Quantification of cross-section bead area at control and after 2 h mefloquine application from five mice indicates no significant difference (n = 46 beads, Wilcoxon Signed Rank Test). p = 0.63.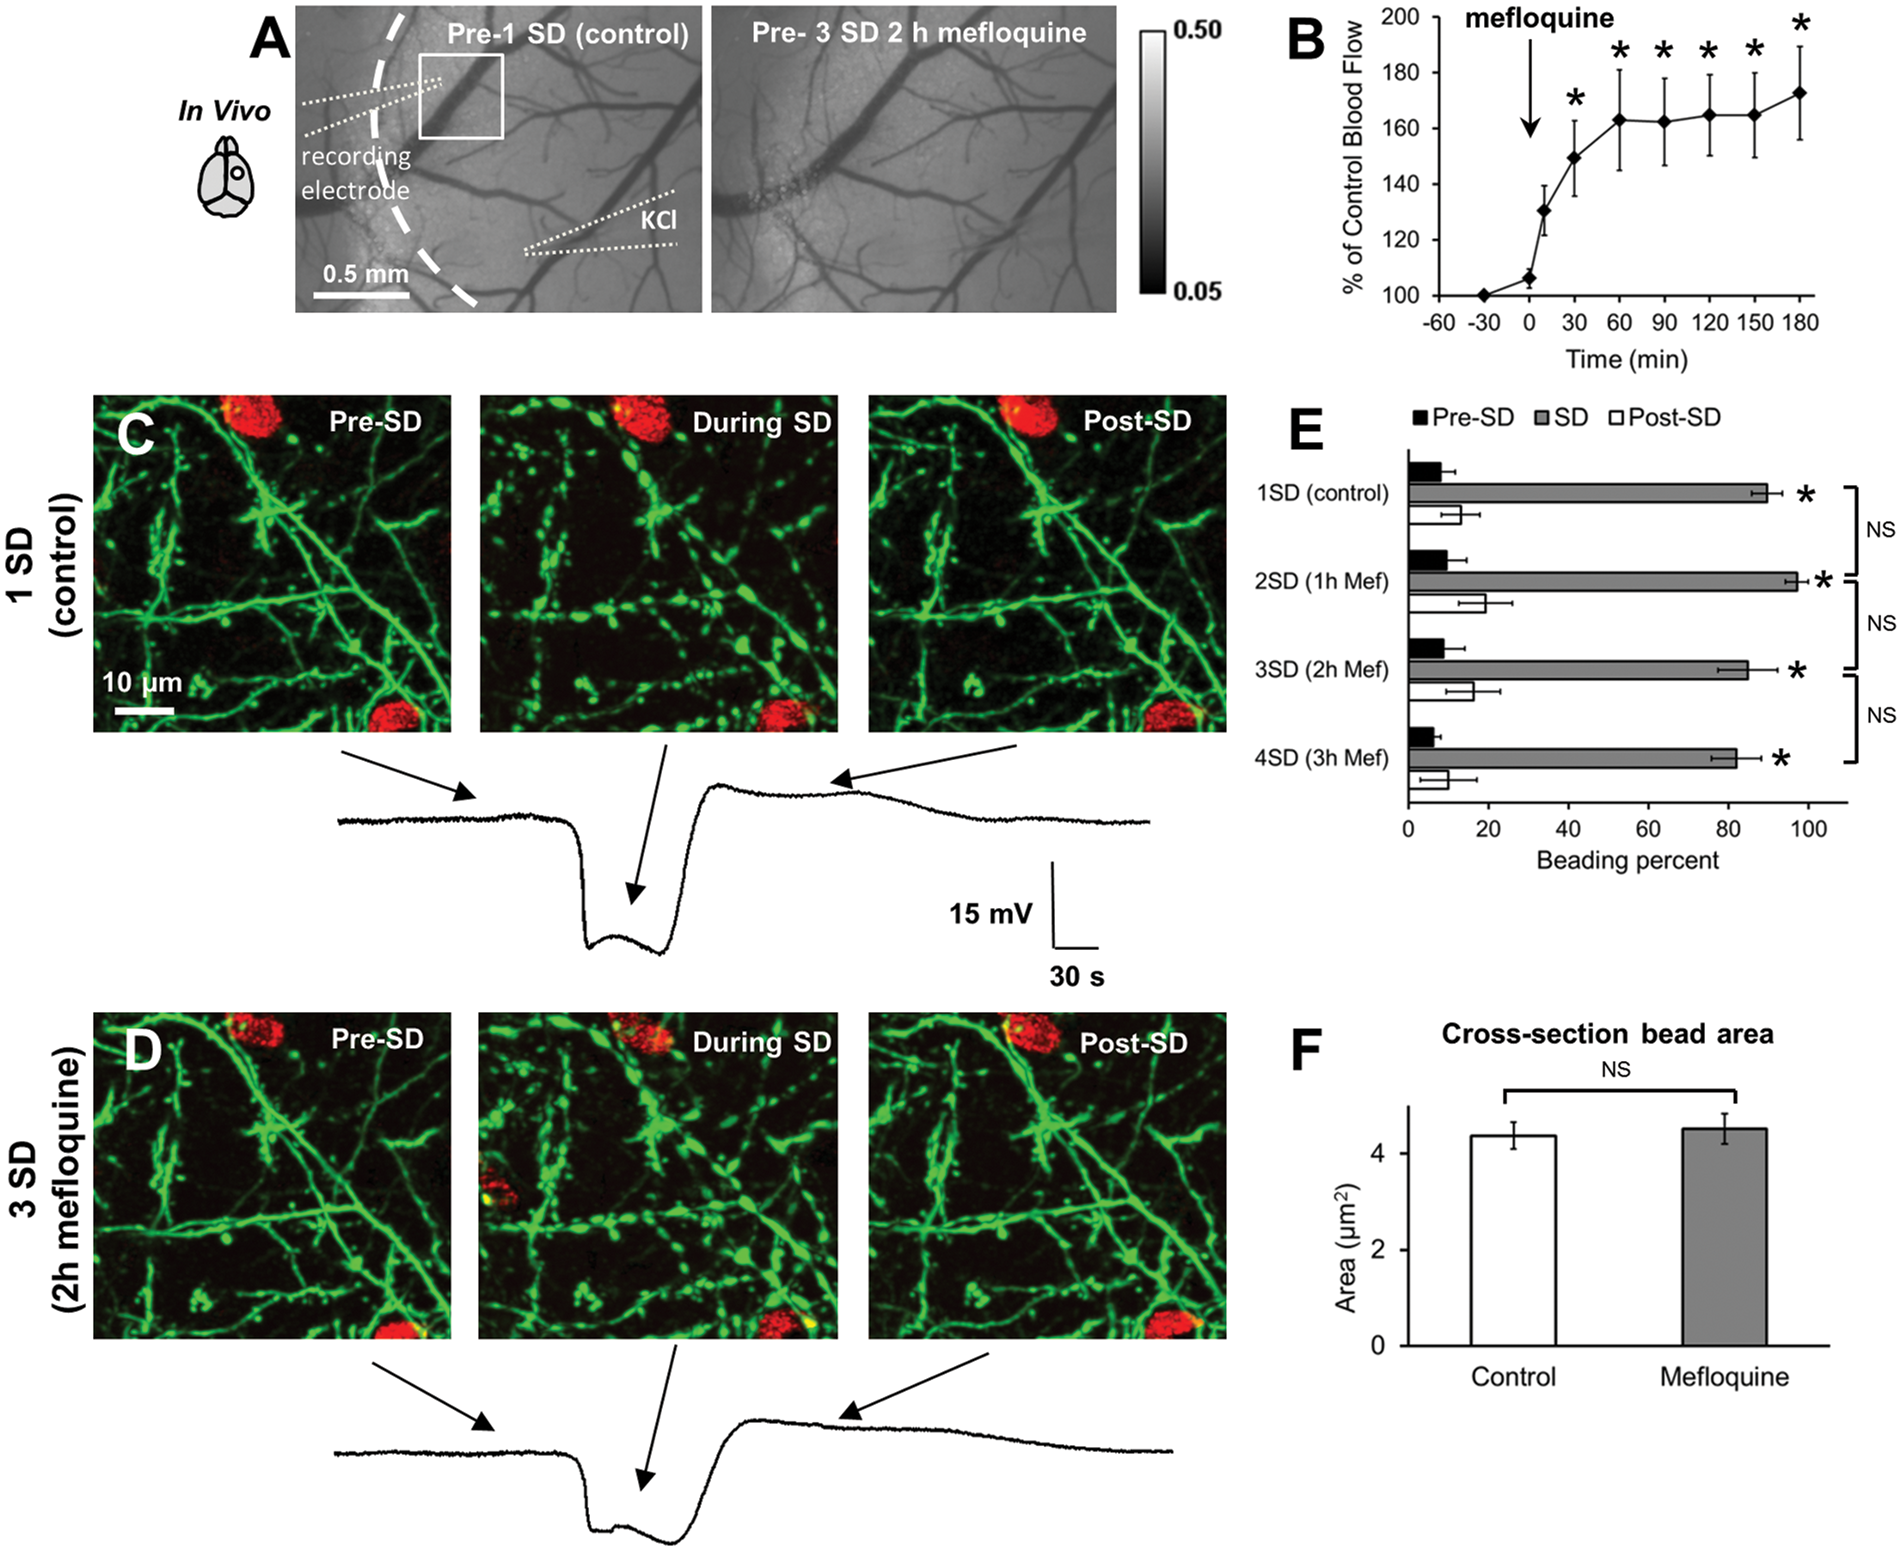
Although pharmacological tools to silence pannexins provide valuable information, data interpretation is often complicated
29
because drugs may not be entirely specific and may have a low efficacy.
36
Mefloquine-induced increase in blood flow in the capillary bed suggests some degree of permeability of the dura to mefloquine. Since mefloquine is a very potent Panx1 inhibitor at sub-µM concentrations, it is conceivable that Panx1 channels were blocked in our experimental settings. Yet mefloquine’s final concentration in the brain parenchyma is unknown and at higher concentrations it may initiate additional undesirable effects beyond those of blocking Panx1, such as disruption of calcium homeostasis
37
and oxidative stress.
38
Therefore, we employed knock-out strategies with conditional Panx1 knock-out mice
17
to investigate Panx1 channel participation in SD-induced dendritic beading. PCR was used to confirm genotypes (Figure 2(a)). To label dendrites of excitatory, glutamatergic neurons Panx1flx/flx + Cre mice were injected with AAV-CamKII(0.4)-EGFP. Some mice were also co-injected with Cre-dependent AAV-hSyn-DIO-mCherry to detect Cre-mediated recombination following tamoxifen administration. Accordingly, mCherry labeled neuronal somata and dendrites were detected in layers II/III and V of the neocortex confirming Cre activity (Figure 2(b)). In agreement with a previous report,
17
deletion of Panx1 in excitatory glutamatergic neurons was also verified by the loss of immunoreactivity to Panx1 (Figure 2(c)). When KCl-induced SDs (14.9 ± 1.8 mV, n = 6 mice) were triggered they again resulted in rapid dendritic beading (Figure 2(d)). Quantification of the beading during SD revealed 99.2 ± 0.8% of beaded dendrites in the imaging field (p < 0.001; Figure 2(e)). The cross-sectional area of dendritic beads reached 4.36 ± 0.19 µm2 at 12.1 ± 1.6 s after SD onset (n = 60 beads in 5 mice) and it was not significantly different from the size of beads in wild-type mice (p = 0.62, Mann–Whitney Rank Sum Test).
Conditional Panx1 knock-out reveals dendritic beading and recovery during passage of KCl-induced SD. (a) PCR was performed on DNA isolated from the tail. In the homozygous Panx1flx/flx mice, one band was present at 365 bp, while in the homozygous Panx1+/+, one band could be seen at 340 bp. In the heterozygous Panx1flx/+ both bands appeared. (b) Cre-ON DIO (double-floxed inverted ORF) mCherry expression detected in fixed neocortical slices confirms the presense of Cre expression in cortical neurons of tamoxifen-injected Panx1flx/flx + Cre mice. (c) Immunofluorescent tiled images of Panx1 expression in hippocampal neurons of tamoxifen-injected Panx1flx/flx + Cre mice (right) and their wild-type littermates (left). Higher magnification images of the boxed regions are shown at the bottom. (d) 2PLSM image of EGFP-expressing dendrites in tamoxifen-treated Panx1flx/flx + Cre mice showing rapid beading and recovery of dendrites during passage of SD. EGFP expression (green) is driven by AAV vector under the neuron CamKII promoter and blood vessels (red) are labeled with Texas Red Dextran. Time points for each image are indicated on the respective SD recording. Glass microelectrode used to record extracellular DC potential was placed next to imaged dendrites. (e) Quantification of SD-induced dendritic beading reveals significant beading in tamoxifen-treated Panx1flx/flx mice (n = 6 mice). Asterisks at the bar during SD indicate significant difference from the time points Pre-SD and Post-SD (one-way RM-ANOVA with Tukey’s post hoc test). *p < 0.001. (f) Expression of AAV EGFP-T2A-iCre construct driven by the CamKII promoter in cortical excitatory neurons of Panx1flx/flx mice imaged in fixed neocortical slices. Expression of EGFP marks transformed neurons coexpressing iCre. (g) 2PLSM MIP image sequence of EGFP-expressing dendrites of cortical excitatory neurons coexpressing iCre in Panx1flx/flx mice showing rapid reversible beading with SD passage. (h) Summary from four animals shows that dendrites undergo similar rounds of transient beading during the passage of SDs. Asterisks at each bar during SD indicate significant difference from the time point before and after SD (one-way RM-ANOVA with Tukey’s post hoc test). *p < 0.001.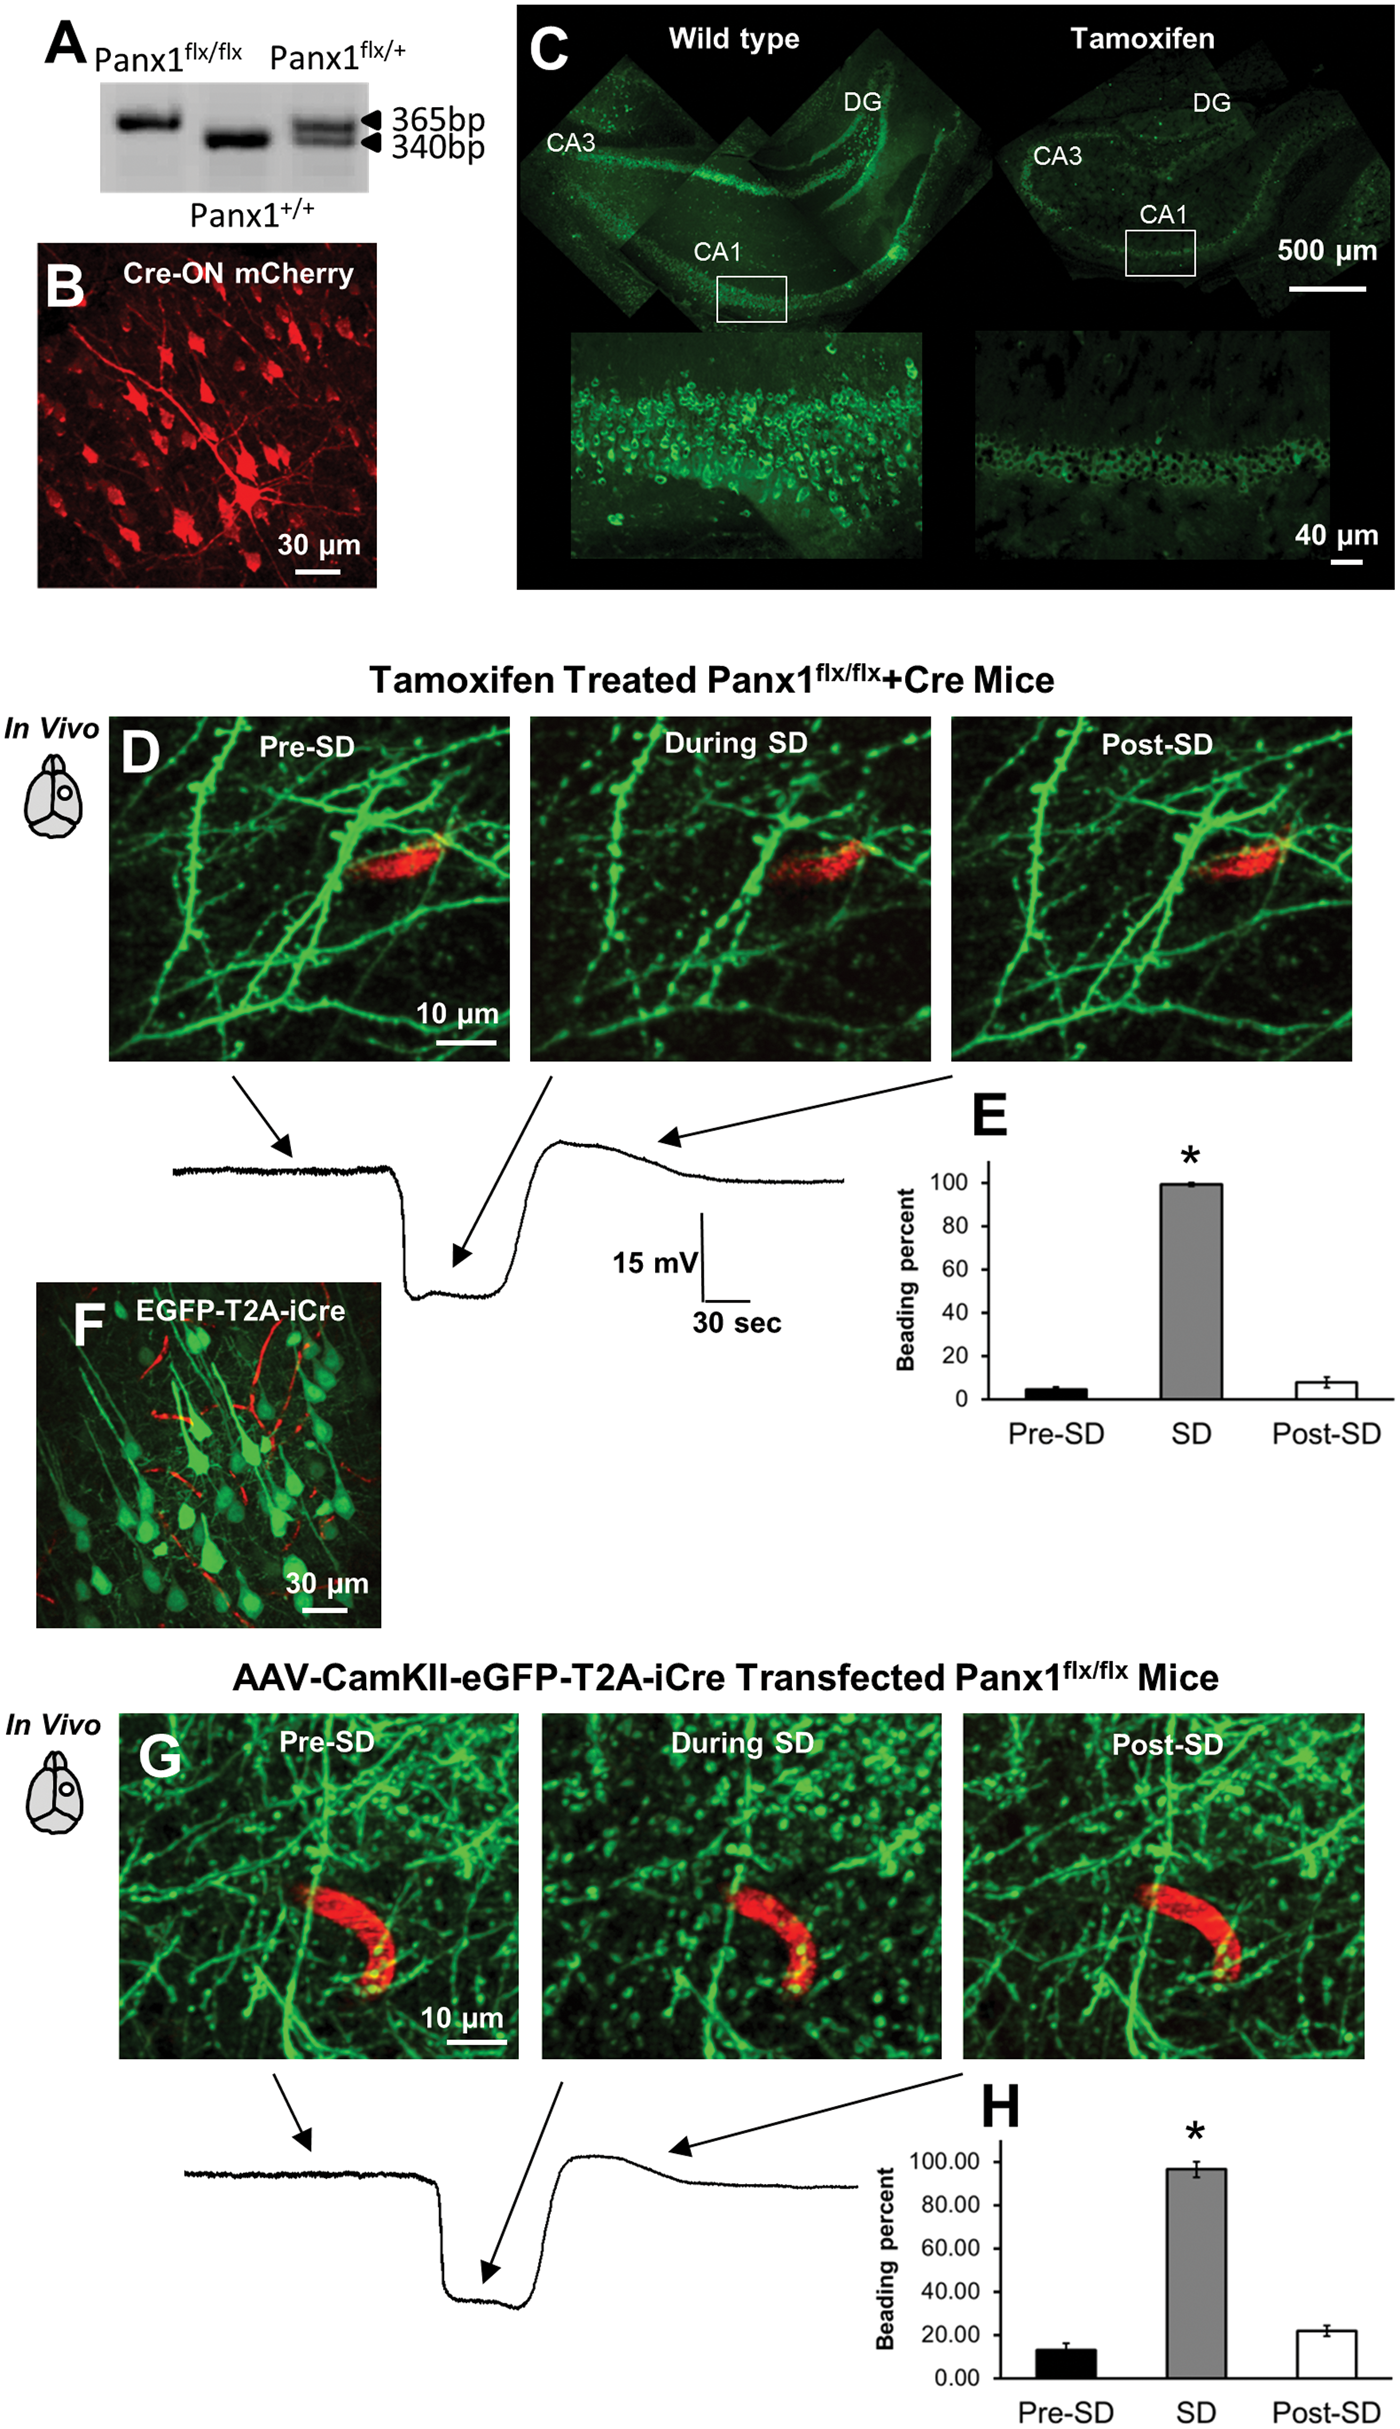
Since strains expressing Cre may have unexpected characteristics, including Cre recombinase expression patterns and inconsistent activity, 39 we have targeted Cre recombinase to excitatory glutamatergic neurons by injecting Panx1flx/flx mice with AAV carrying EGFP-T2A-iCre construct under the control of the CamKII(1.3) promoter. This single vector allows the simultaneous production of Cre recombinase with an enhanced level of expression (iCre) 40 and EGFP that labels fine dendritic structure. Consequently, imaging revealed EGFP expression in a subset of neocortical neurons (Figure 2(f)). Once KCl-induced SDs (18.7 ± 0.3 mV, n = 6 mice) propagated through the imaging field, dendrites became beaded (Figure 2(g)) with the fraction of beaded dendrites reaching 96.4 ± 3.6% (p < 0.001, Figure 2(h)). The size of dendritic beads at 14.3 ± 1.1 s after SD onset reached 4.34 ± 0.19 µm2 (n = 48 beads in four mice) which was similar to control values in wild-type animals (p = 0.7, Mann–Whitney Rank Sum Test). Taken together, these data indicate that the knock-out of Panx1 did not diminish dendritic beading under these conditions.
Discussion
Dendritic beading is associated with a flux of water into the dendrites3,41,42 and during SD it is mediated, at least in part, by the activity of several chloride-coupled cotransporters expressed in neurons. 5 Here, we tested the additional possibility that water influx during SD aided by cotransporters might be paralleled by water influx through large-pore non-selective Panx1 channels and thus could contribute to the beading. We have shown that the conditional knock-out of Panx1, as well as putative pharmacological blockade of these channels with mefloquine applied to the intact dura, had no effect on SD-induced dendritic beading, further emphasizing the important contribution of chloride-coupled transport mechanisms to focal dendritic swelling.
It was a surprising finding that the knock-out of Panx1 did not diminish beading. It is possible that another member of the pannexin family, pannexin-2 (Panx2), which is also expressed in pyramidal neurons8,9 could be compensating for the lack of Panx1. Although Panx2 is mainly present on intracellular membranes, 43 only the global ablation of both Panx1 and Panx2 was sufficient to reduce ischemic damage and improve functional outcomes after permanent middle cerebral artery occlusion in mice.44,45 Whether the knock-out of both channels is necessary to reduce, dendritic beading will require further experimentation.
Pannexin channel opening is often measured with large fluorescent dye molecules.14,46 The entry of dyes would suggest permeability to water and a wide range of other molecules along with the dye. Yet a recent investigation of Panx1 and Panx2 channels expressed in oocytes 21 revealed no direct link between ion conductance and dye permeability. In the Hansen et al. 21 study, only Panx1 displayed dye uptake, which was also detectable at resting membrane potential. Both Panx1 and Panx2 channels exhibited conductance during depolarization. This capacity of pannexins to differentiate between dye uptake and ion conductance warrants future studies to directly measure if pannexins are water permeable.
Several other possibilities might exist to explain our findings. Although Panx1 is localized to dendrites of excitatory neurons, 12 the density of Panx1 expression in dendrites is unknown. If the density of Panx1 channels is too low then their contribution to the beading might not be detectable with our imaging techniques. Additionally, it should be noted that Panx1 activation is not directly responsible for SD generation,33,44 but Panx1 functions to maintain SD.7,17 Several lines of evidence exist that prove that NMDA receptor activation recruits Panx114 by mechanisms involving Src family kinases, as was shown during anoxic SD. 17 This supports the notion that Panx1 opening occurs following the initial depolarization but it might take place with some delay. 25 It is possible that Panx1 contributes to neuronal swelling and persistent dendritic beading at later points over a time course of long-lasting anoxic SD, 47 but not to the rapid transient beading evoked by short-lasting normoxic SD. An open question remains as to what other molecular pathways of water influx during SD are involved in dendritic beading in addition to cotransport mechanisms. 5 This question requires further investigation, but other possible candidates could be acid-sensing ion channels (ASICs)48,49 and transient receptor potential (TRP) channels from the Melastatin family, TRPM7.50,51
Footnotes
Funding
The author(s) declared the following potential conflicts of interest with respect to the research, authorship, and/or publication of this article: This work was supported by National Institutes of Health Grant NS083858 (S.A.K.).
Acknowledgments
We thank Dr. Almira Vazdarjanova, Medical College of Georgia for advice on immunohistochemistry and Brendan Marshall of the Histology and Electron Microscopy Core at the Medical College of Georgia for assistance with immunohistochemistry. The AAV8-hSyn-DIO-mCherry virus was prepared and obtained from the vector core at UNC (Chapel Hill, NC) and the AAV5.CamKII.4.eGFP.WPRE.rBG was prepared and obtained from the UPenn vector core (Philadelphia, PA).
Declaration of conflicting interests
The author(s) declared no potential conflicts of interest with respect to the research, authorship, and/or publication of this article.
Authors’ contributions
S.A.K. designed research; J.S. and D.C. performed research; J.S., D.C., and S.A.K. analyzed data; P.L.W. provided conceptual advice and R.J.T. contributed mice and provided conceptual advice; J.S. and S.A.K. wrote the paper.