
Abstract
We have previously shown that labelled water positron emission tomography (H215O PET) can be used to identify regional cerebral blood flow (rCBF) changes in the human brain during volitional swallowing. (18F) fluorodeoxyglucose (FDG PET), by comparison, uses a glucose analogue to quantitatively measure regional cerebral glucose metabolism (rCMRglc) rather than rCBF. The main advantage of FDG PET is improved spatial resolution, and because of its pharmacodynamic properties, activation can be performed external to the scanner, allowing subjects to assume more physiologic positions. We therefore conducted a study of the brain's metabolic response while swallowing in the erect seated position, using FDG PET. Eight healthy male volunteers were studied with a randomised 2 scan paradigm of rest or water swallowing at 20-second intervals for 30 minutes. Data were analysed with SPM99 using multisubject conditions and covariates design. During swallowing, analysis identified increased rCMRglc (P<0.01) in the following areas: left sensorimotor cortex, cerebellum, thalamus, precuneus, anterior insula, left and right lateral postcentral gyrus, and left and right occipital cortex. Decreased rCMRglc were also seen in the right premotor cortex, right and left sensory and motor association cortices, left posterior insula and left cerebellum. Thus, FDG PET can be applied to measure the brain metabolic activity associated with volitional swallowing and has the advantage of normal task engagement. This has implications for future activation studies in patients, especially those suffering swallowing problems after brain injury.
Introduction
Positron emission tomography (PET) is a well-established imaging modality that is commonly used for brain activation studies (Phelps, 1991). Although PET does not provide a direct measure of neural activity, it offers a correlate in the form of haemodynamic and metabolic changes locally within the brain tissue by detecting the radioactive signal from a suitable radiolabelled tracer. This radiotracer might be 15O-labelled water (H215O) as a surrogate marker of blood flow, or 18F-labelled fluorodeoxyglucose (FDG) which, as a glucose analogue, provides an image of the rate of regional glucose metabolism (Ginsberg et al, 1988). As the local rate of energy metabolism or blood flow is believed to be coupled to neural activity, these surrogate changes are thus used to assess cortical activation and produce functional brain images. Less well established is the precise relationship between local metabolism and blood flow; it is therefore of interest to know how haemodynamic changes and neuronal metabolism (in the form of glucose phosphorylation) are related during a human motor activation task. Despite this, studies assessing neuronal metabolism for motor activations in humans are limited.
The use of FDG PET to study cerebral glucose metabolism (Phelps, 1981) is an adaptation of the 2-deoxy-D-[14C] glucose model originally developed by Sokoloff et al (1977), and has a number of advantages over H215O PET and other imaging modalities. For example, in contrast to glucose, which further metabolises to CO2 and H2O, the metabolic product of FDG, FDG-6-phosphate, remains trapped within the brain tissue for an extended period of time. This unique metabolic behaviour makes radiolabelled deoxyglucose an excellent candidate for mapping regional function in the brain in response to various stimuli. Furthermore, the slow kinetics of FDG require a delay before imaging, a consequence of the half-life of 18F; however, one potential advantage of this property is that the longer imaging time may contribute to improved image quality (reduced noise). In addition, it provides the potential for extraction of data at different time frames across one activation task, and thus for larger amounts of data. Finally, in contrast to most other functional imaging techniques where the tasks have to be performed supine, FDG PET allows activation to be assessed after performance of the task. This means that the task can be executed in a more physiologic position.
Swallowing is a fundamental physiologic process that is regulated by both the cortex and brainstem, working in conjunction to produce an ordered sequence of sensory and motor events, which enable the transport of food from the mouth to the stomach while concomitantly protecting the airway. The oral/preparatory stage of swallowing is almost entirely under voluntary control and can be interrupted at any point. This process likely commences in the motor areas of the cerebral cortex, thereby allowing the bolus of food/liquid/saliva in the mouth to be moved by the tongue into the oropharynx. With the passage of the bolus into the oropharynx, the ‘involuntary’ pharyngeal stage of swallowing begins. At this stage, the sequence becomes irreversible and brainstem control mechanisms become more important. Previous work by Hamdy et al, (1999b) investigated volitional swallowing in healthy subjects using water positron emission tomography (H215O PET), and showed that volitional swallowing (deglutition) recruits multiple cerebral regions. However, this was performed supine, which is a less physiological position for swallowing. Further, because of the complex hierarchical regulation of swallowing, and problems of interpreting lesion location in disease states where swallowing is disrupted, understanding the functional (metabolic) brain organisation subserving volitional swallowing assumes increased relevance.
Therefore, the aim of our study was to gain more precise whole brain information on the metabolic functional neuroanatomy of swallowing with FDG PET imaging and in so doing, collect data on (1) the normal metabolic brain response to swallowing, (2) subcortical regions involved in swallowing, and (3) brain organisation when swallowing while upright. A further objective was to compare and contrast two different analysis methods for FDG data.
Subjects
The protocol was approved by the Salford and Trafford Ethics Committee, and all volunteers gave written informed consent. Permission to administer radioactivity was obtained from the Administration of Radioactive Substances Advisory Committee of the Department of Health, UK (reference number RPC 103–1363 (14523)). A total of 8 healthy male volunteers were studied, median (range) age 32 years (29 to 37 years) with handedness being determined in each subject with the Edinburgh Handedness Inventory (Oldfield, 1971). Using this inventory, strong right-handedness would score 100% and strong left-handedness would score −100%.
Protocol
18F-labelled fluorodeoxyglucose PET scans were obtained in all subjects on two separate occasions. Subjects were initially randomised to one of two conditions: swallowing or rest. The alternate condition was performed for the followup scan on a separate day, at least seven days later. Before scanning, subjects were fasted for 4 hours (to ensure a relatively stable basal blood glucose level on entry to the study) and asked to refrain from taking any stimulants (e.g. caffeine) for ≥12 hours. The activation conditions were performed during the FDG uptake period before imaging in a quiet and darkened room adjacent to the PET scanner with subjects initially seated. To ensure that all subjects swallowed at the same rate during the activation part of the study, a purpose-built electronic light box (Department of Medical Physics, MRC Cyclotron Unit, Hammersith Hospital, London) was used to provide a visual cue. This was positioned in front of each subject, level with their eyes and programmed to flash every 20 secs (0.2-sec duration). During the control study, the light source was active but subjects were requested not to swallow. To facilitate swallowing during the activation study, water was infused orally via a fluid delivery catheter connected to a fluid reservoir at a rate such that each swallowed bolus was ∼5 mL (total volume swallowed per study approximately 500 mL). For both conditions the reservoir was filled with 1000 mL of sterile water and the catheter positioned comfortably just inside (approximately 3 cm) the subjects' mouth. Once sited, adhesive tape was used to secure the tube to the subjects' skin, outside the mouth. An intravenous cannula was then positioned in the antecubital fossa region of the nondominant arm and the subject was left to relax for 15 mins. The light source was turned on and the subject began the activation task (swallowing or rest) 2 mins before the intravenous administration of approximately 100 MBq FDG, and continued for a further 30 minutes (Figure 1). All subjects were advised to relax in the chair, concentrate on the light source and not to make any unnecessary movements other than swallowing (or resting). After 30 mins, the fluid delivery catheter was removed and the patients were positioned supine in the scanner. The subject's head was secured firmly with a moulded headrest and a head-restraining Velcro band to reduce motion artefact. The subject's head was then aligned within the scanner using standard low-power laser beams positioned within the gantry of the PET camera to ensure the inclusion of cortex and brainstem.
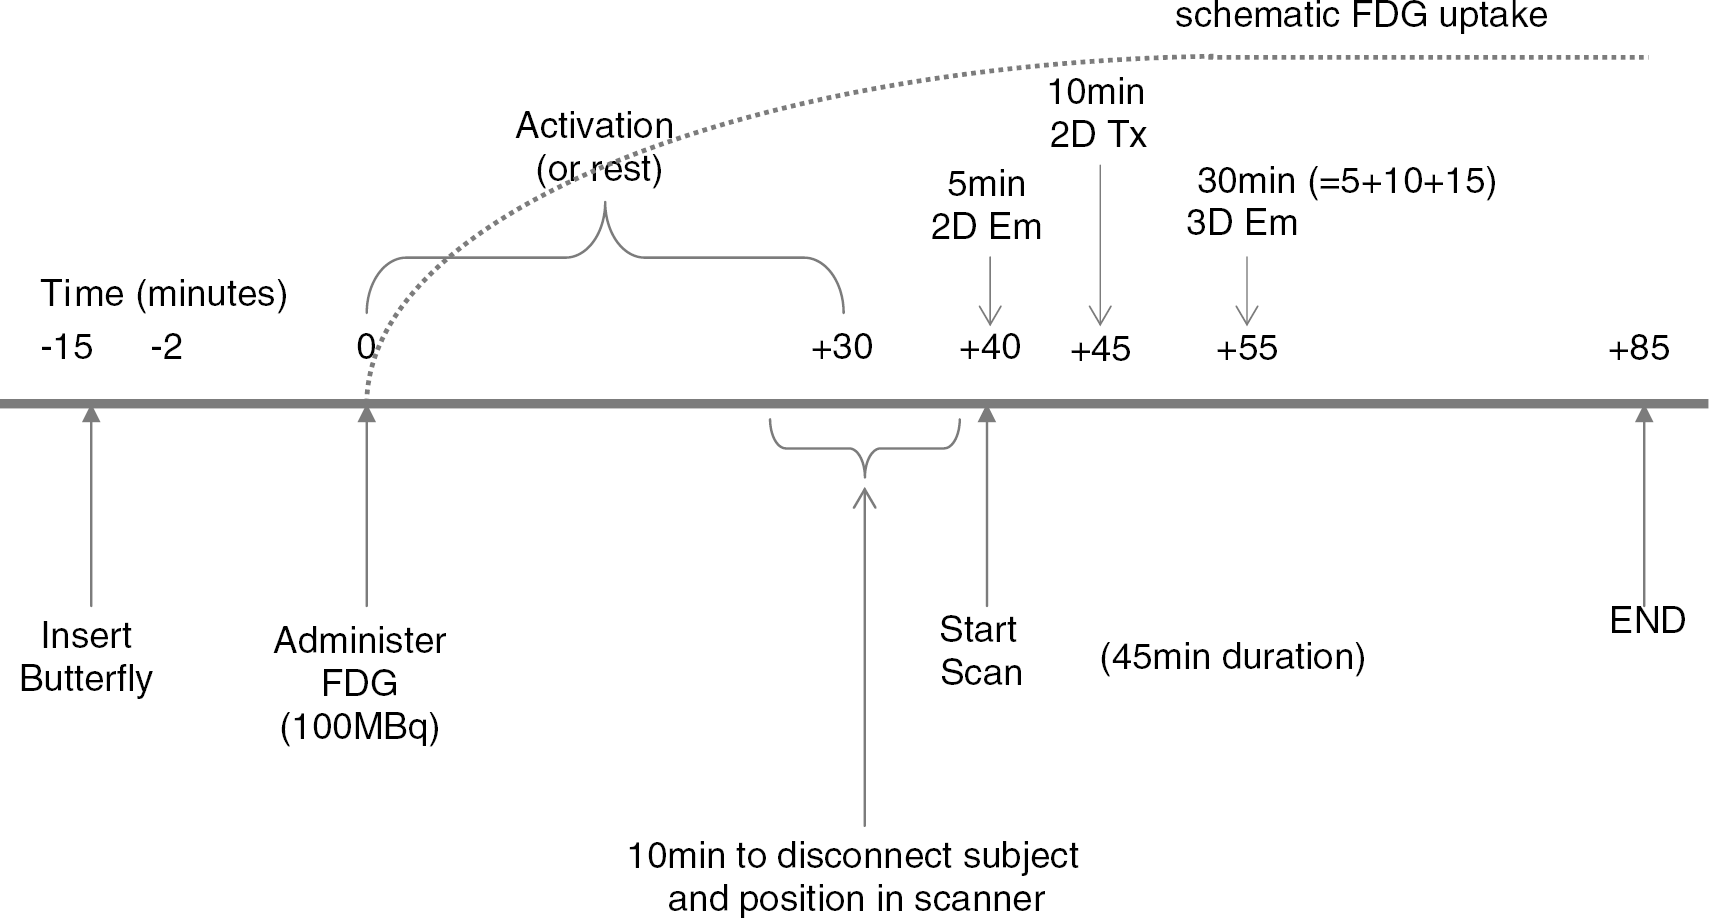
Schematic time line for FDG administration, uptake and scanning procedure.
Data Acquisition
Imaging was performed using a GE Advance PET scanner (General Electric Medical Systems, Milwaukee, WI, USA). An initial scout scan of 30 secs was performed to ensure the correct position of the subject within the scanner, before the commencement of the main scanning (40 mins after injection of the FDG). Scanning consisted of a 30-min 3-D emission scan preceded by a 10-min 2-D transmission scan (to correct for tissue attenuation) and a 5-min 2-D emission scan (to correct for emission contamination of the transmission scan) as shown in Figure 1. In all, 35 slices at 4.25-mm intervals were obtained so as to cover the whole brain including brainstem. From the acquired data, images of FDG distribution were produced for three time epochs at 5, 10 and 15 mins from the start of 3D imaging, providing different acquisition periods for comparison. In addition to producing three data sets per subject per scan, this was also done so as to investigate the amount of data required per FDG scan (results not presented in this manuscript).
Image Reconstruction
Images were reconstructed by fully-3D filtered back projection with reprojection into 128 × 128 × 35 image matrices (voxel size 1.95 × 1. 95 × 4.25 mm3) using measured attenuation correction.
Data Preprocessing
Statistical Parametric Mapping (SPM99) (Wellcome Department of Cognitive Neurology, Institute of Neurology, London, UK) software implemented in MATLAB (The MathWorks, Inc., Natick, MA, USA) was used for individual data image spatial transformation (realignment, normalisation and smoothing) followed by group statistical analysis of these data (Friston et al, 1995).
Before processing, individual images using the first as a reference were realigned to the mean to correct for head displacement in terms of translations and rotations. Each scan was then normalised to enable data from individual subjects to be transformed onto a common anatomic frame; an FDG template was used whereby the control scans were normalised to the standard H215O PET template, using the algorithm provided with SPM (Gispert et al, 2003). This normalisation process ensures that homologous regions are compared across subjects and consists of linear (affine) and nonlinear transformations, accounting for differences in position, orientation and overall brain size, and low spatial frequency global variability in head shape. This standard frame conforms to the space described in the atlas of Talairach and Tournoux (Talairach and Tournoux, 1988). The final preprocessing step involved data being smoothed using a 12-mm full-width at half-maximum (FWHM) Gaussian filter.
Data Analysis
Group data were initially analysed using a standard method for FDG activation: the population main effect design (two conditions, one scan per condition). With this type of analysis, the differences between each patient's active image and the control images (t statistic for P<0.01) on a voxel-by-voxel basis were examined to find significant increases in metabolism.
Although areas of activation were located in similar areas to previous work using this swallowing model with H215O PET (Hamdy et al, 1999b), an acceptable level of significance, corrected for spatially correlated multiple comparisons, was not attained. Thus, because our study had already extracted images at different time points during the total imaging time, we were able to trial a second method of analysis. For this analysis, three separate images were reconstructed of 5, 10 and 15 mins duration, and group data then analysed using a multisubjects conditions and covariates design (2 conditions, 3 scans per condition). Using this approach, highly significant and robust activations were obtained, the results of which are reported below.
Results
All subjects were right handed with a median (range) handedness score across subjects being 79% (42% to 100%). All subjects easily managed swallowing the predetermined water bolus over the 30-minute period without any discomfort.
The brain regions showing the most significant increased activations across all subjects are shown in detail in Table 1, described in the following text and displayed as maximum intensity projections (Figure 2) and 3-D brain images (Figure 3). Brain regions showing the most significant decreased activations are shown in Table 2.
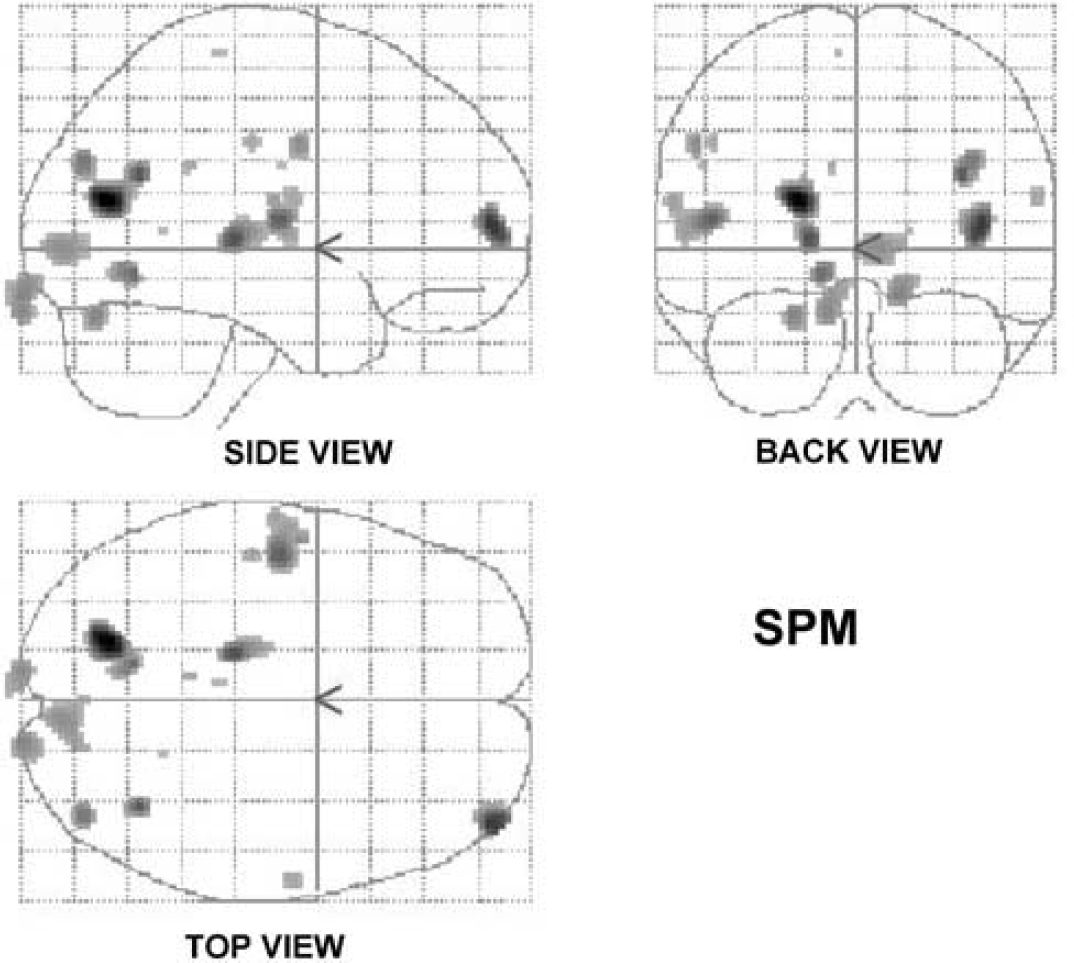
The group mean SPM maps of the areas of increased rCMRglc associated with volitional swallowing are shown as three orthogonal projections through sagittal (side view), coronal (back view) and transverse (top view) views of the brain.
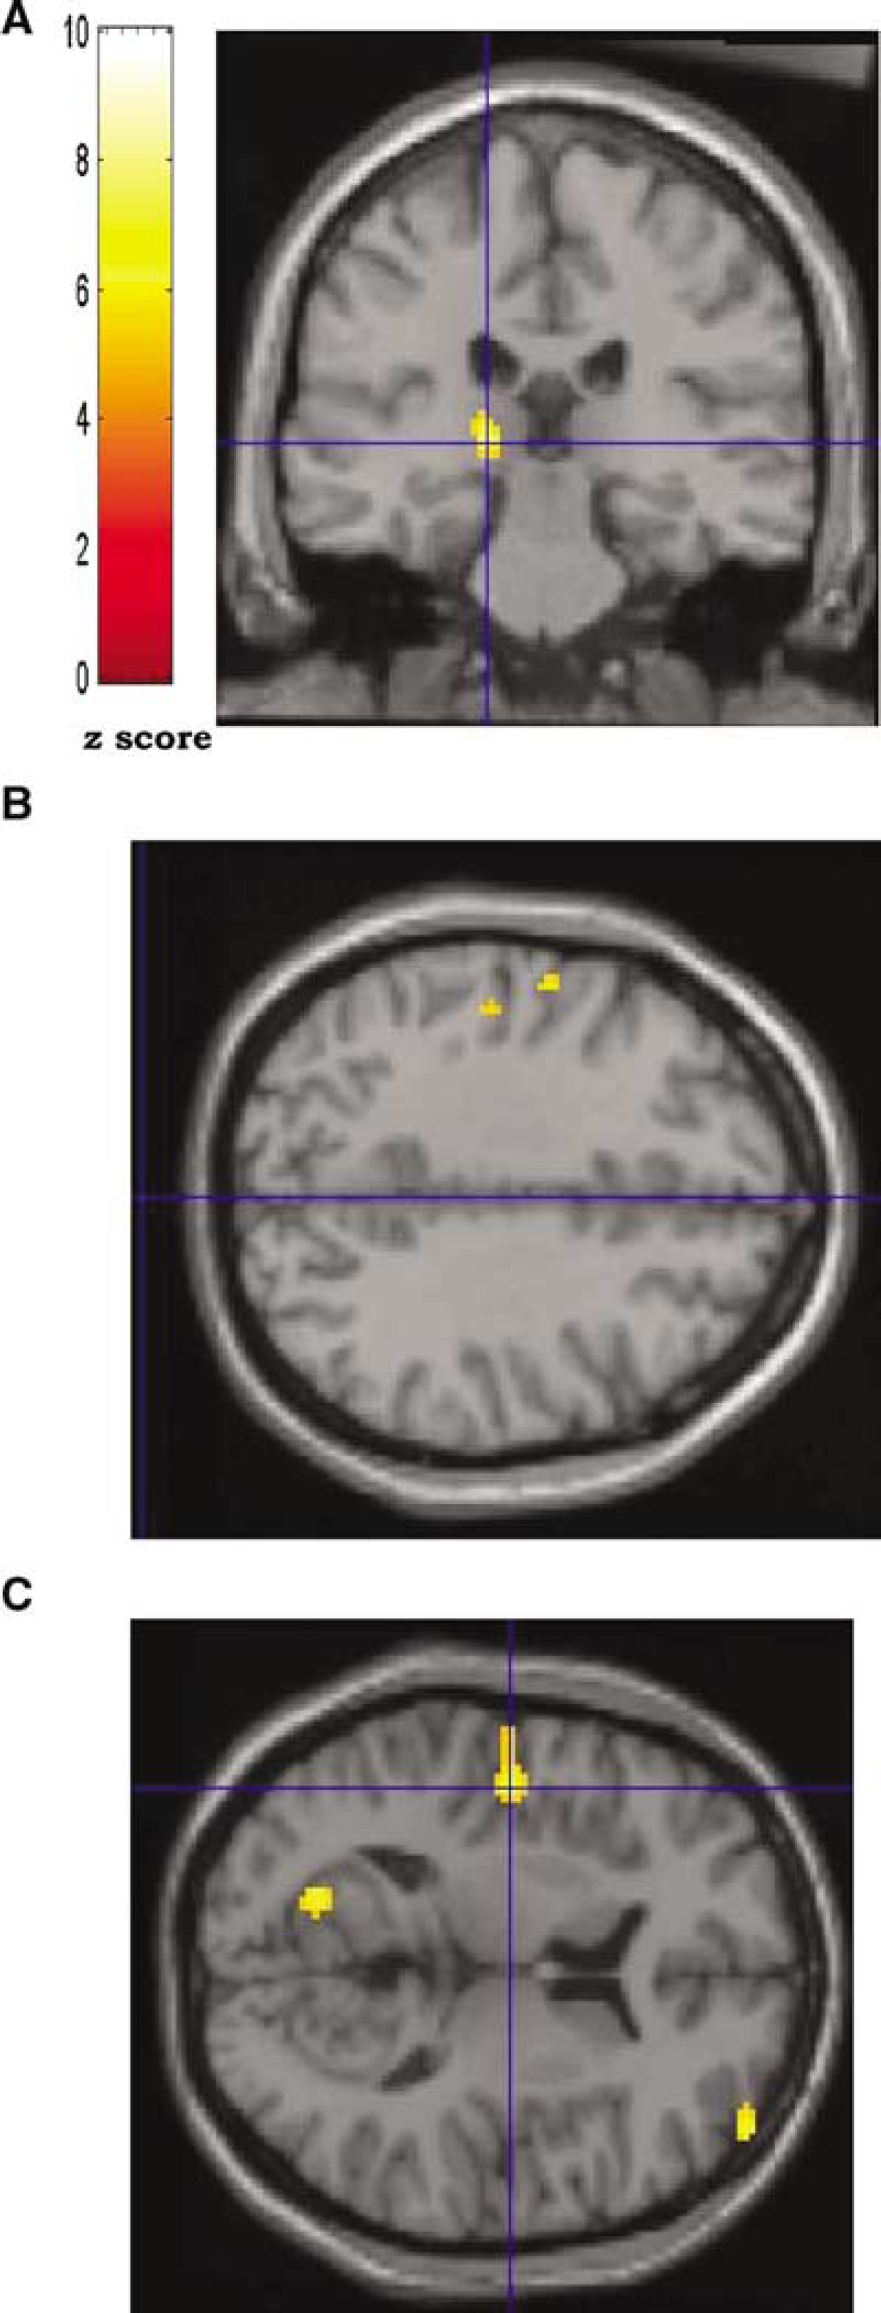
Group data showing areas of increased rCMRglc during volitional swallowing rendered onto normalised T1-weighted magnetic resonance imaging brain sections. The colour scale indicates the z-score level for each locus depicted. In the coronal section (
Group details of the cerebral loci activated during volitional swallowing
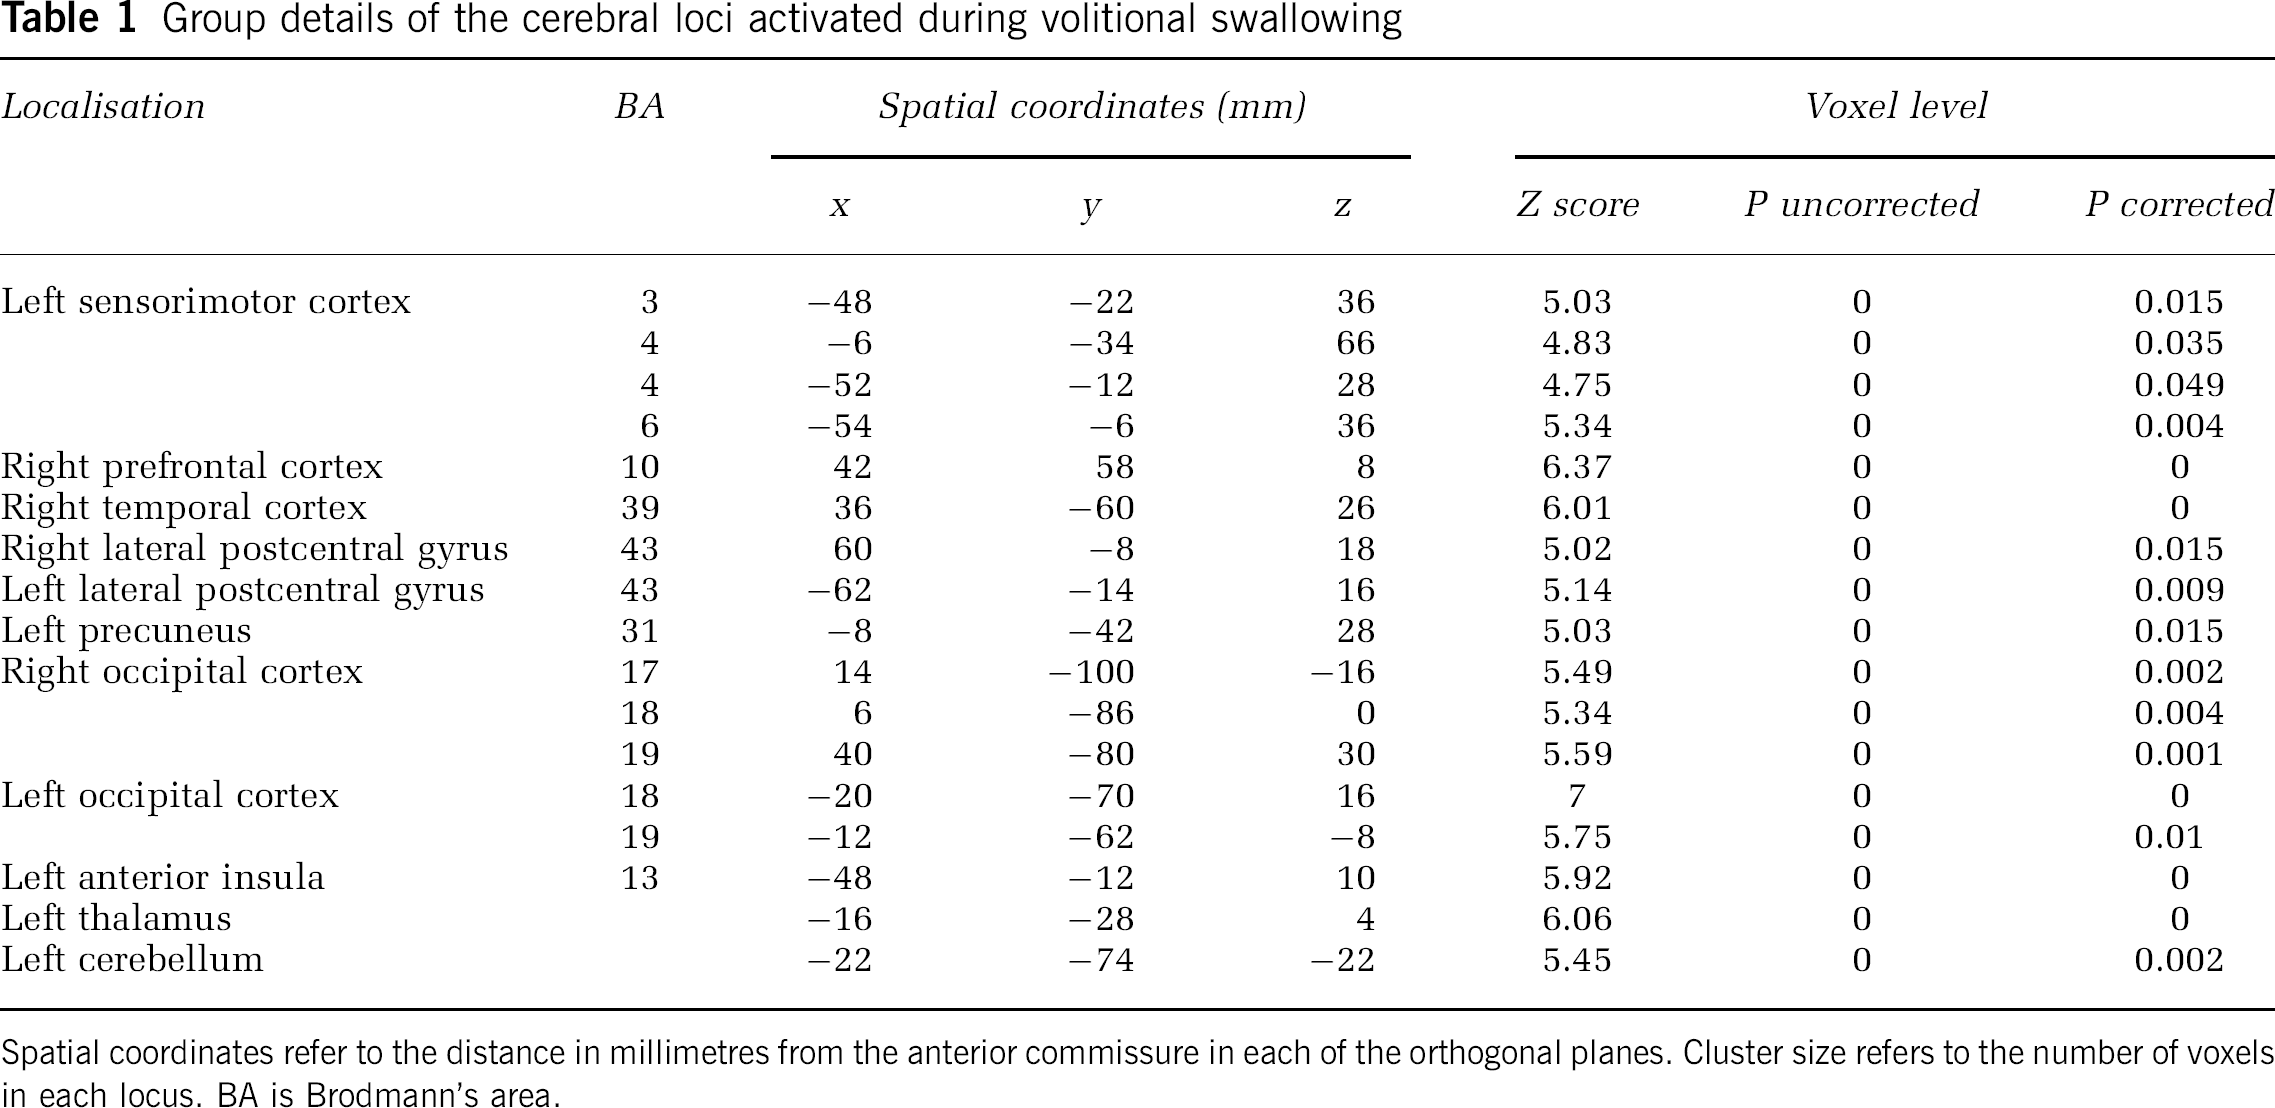
Spatial coordinates refer to the distance in millimetres from the anterior commissure in each of the orthogonal planes. Cluster size refers to the number of voxels in each locus. BA is Brodmann's area.
Group details of the cerebral loci deactivated during volitional swallowing
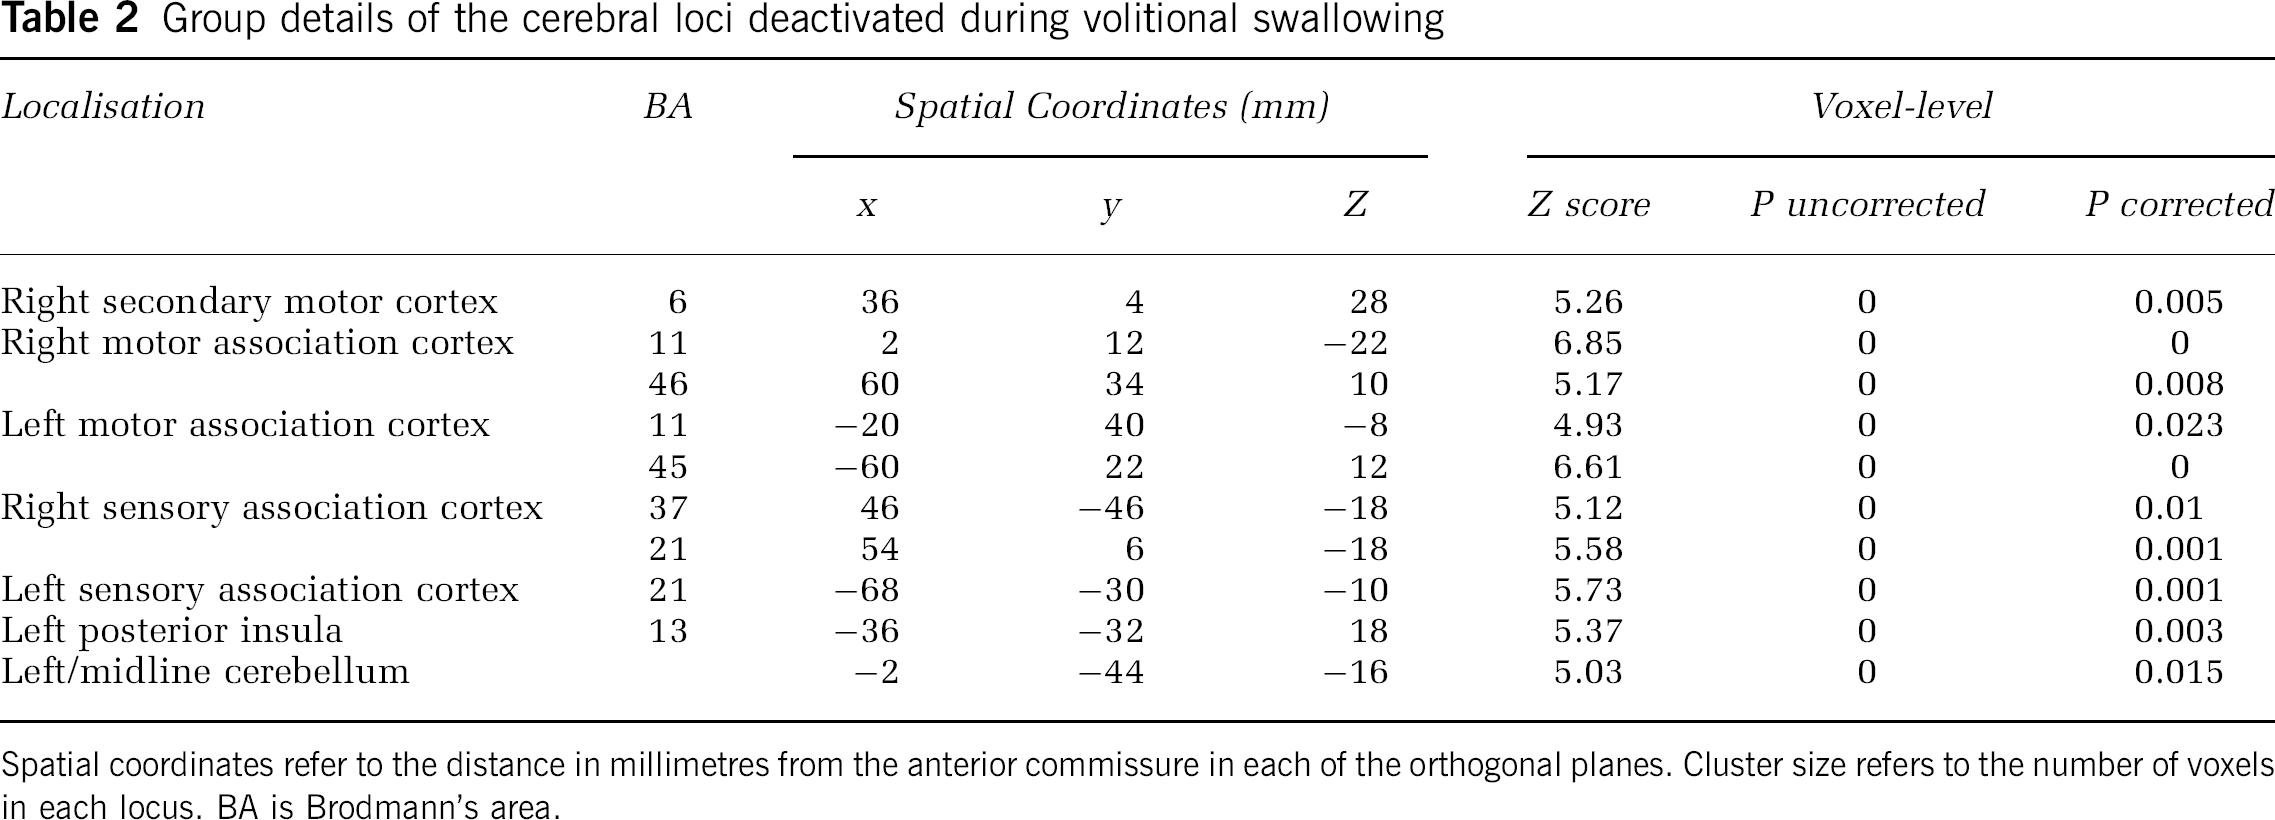
Spatial coordinates refer to the distance in millimetres from the anterior commissure in each of the orthogonal planes. Cluster size refers to the number of voxels in each locus. BA is Brodmann's area.
Areas of Increased Regional Cerebral Glucose Metabolism
With FDG PET, individual variability between subjects are not identifiable and results are presented as a group image format rendered onto a normalised T1-weighted MRI scan as shown in Figure 3.
Cortex:
The cortical areas activated by swallowing included the left sensorimotor cortex (Brodmann's areas (BA) 3, 4 and 6), right prefrontal cortex (BA 10), right temporal cortex (BA 39), right and left lateral postcentral gyrus (BA 43), left precuneus (BA 31), and right (BA 17,18,19) and left (BA 18,19) occipital cortex.
Subcortex:
Swallowing also activated two main subcortical areas in the left thalamus and the left anterior insula depicted in Figure 2.
Cerebellum:
Swallowing activated mainly the left side of the cerebellum.
Brainstem:
No brainstem activation was observed.
Areas of Decreased Regional Cerebral Glucose Metabolism
Regions with significantly decreased rCMRglc were also identified with swallowing. These areas included the right and left motor association cortex, right and left sensory association cortex, right premotor cortex, left posterior insula and left cerebellum (Table 2).
Discussion
This study has shown that FDG PET can be usefully applied to the study of the cortical processing of human voluntary swallowing. Specifically, a number of functionally distinct cortical and subcortical regions were identified that are considered important in the initiation, processing and execution of voluntary swallowing. These cerebral foci included the thalamus, insula, sensorimotor cortex, lateral prefrontal cortex, supplementary motor area, occipital cortex and cerebellum. Our data support previous work on imaging human swallowing (Dziewas et al, 2003; Hamdy et al, 1999b; Kern et al, 2001; Hamdy et al, 1999a; Mosier et al, 1999; Zald and Pardo, 1999; Suzuki et al, 2003; Martin et al, 2001) and confirm that the process involves a distributed network of brain regions functioning in concert to provide a safe effective physiologic response.
Even though the FDG PET results are group data, the majority of the regions of activation shown in this volitional swallowing study demonstrated hemispheric dominance, most commonly on the left side. Lateralisation is a commonly reported finding in functional brain imaging for swallowing in humans. Of interest, all our subjects were right handed and, while it is possible to speculate a link between handedness and swallowing, it has been previously shown that such a relationship does not seem to exist (Mosier et al, 1999; Hamdy et al, 1996). Nonetheless, our metabolic study appears to suggest that while blood flow may display certain lateralisation properties, in terms of glucose uptake, the left hemisphere is somehow important. This may in part be a consequence of the method and position of the swallowing task we used; perhaps future studies assessing differing swallowing tasks may alter this suggestion.
Subject position during task activation might be critical to areas of brain activation. Assuming as natural a position as possible during an activation task will likely give the best representation of normal brain activation. Swallowing is rarely performed in the supine position apart from perhaps small saliva swallows during sleep. During normal feeding, humans automatically assume the upright position. Intuitively, one may assume that lying flat during swallowing is more challenging and may add a greater risk of aspiration; however, little work has been performed to support this theory. In this study, the activation task was performed in the upright position outside of the scanner itself. Although areas of brain activation were not dissimilar to previous studies of swallowing where the subjects were supine, we found a noticeable left lateralisation effect. Interestingly, the only other study that has demonstrated strong left lateralisation of the sensorimotor cortex during swallowing was a MEG study that also assumed the upright position during the task engagement (Dziewas et al, 2003). Because anxiety of subjects during the study can directly influence brain metabolism both regionally and globally (Wienhard, 2002), it might be that when lying down and attempting to swallow in an unusual position, the swallow becomes more effortful, resulting in an alternate activation in the brain with recruitment of more bilateral or right hemisphere sensorimotor areas.
One novel aspect of the study is the use of three time epochs during the scanning window to generate increased data for multiple comparison analysis. This type of approach has not been applied to FDG PET before, but may provide a new and useful methodology for neuroactivation studies with FDG PET. In considering the methodological analysis used by SPM for PET FDG, several assumptions have been made before using the multiple comparison type of analysis. Firstly, it is assumed that the rate of glucose metabolism in neural tissue has reached a steady state by the time the subjects are scanned. This occurs between 30 and 120 minutes after injection of the FDG; thus, the scans taken in this study were all within those limits. Secondly, it is assumed that no habituation occurs in the swallowing pattern over the activation period. Therefore each single scan measures the locked-in activation pattern and is representative of normal volitional swallowing. Thirdly, it is assumed that the subjects have a stable plasma glucose level over the study period. Because all were healthy subjects who were fasted for 4 hours before the scan, this would seem a reasonable assumption. It is therefore likely that the three images taken were of similar quality and represent equivalent brain glucose metabolism during swallowing.
Whether FDG PET has the capacity to study motor activation tasks has been an issue of some controversy. For example, Hallett et al (1994) compared glucose metabolism and cerebral blood flow during a voluntary cortical motor activation task with FDG PET and H215O PET. Using region of interest analysis, they concluded that measurement of rCBF was more sensitive than rCMRglc, possibly a consequence of technical differences with the scanning procedures. In addition, it was noted that a limitation of FDG PET was that the resting and activated scans had to be performed on two different occasions whereas with H215O PET both conditions can be performed on the same day. As a result, there is more chance that the subject's head would be in a different position within the scanner between PET sessions, thus producing an added error with realignment of the images. A major limitation of the Hallett study, however, was that the numbers of subjects investigated in the FDG PET group were small compared with the H215O PET group (4 versus 11), and may well have limited the accuracy of the analysis. With our new methodological approach for FDG PET, and higher numbers, we would now contend that it is possible to get good activation patterns of similar quality to H215O PET.
Conclusion
This study demonstrates that FDG PET imaging can sensitively measure brain metabolic activity associated with swallowing and that the results are consistent with previous work using H215O PET. Importantly, it has the advantage of easier task engagement for subjects, which has significant implications for future studies of swallowing problems in patients after brain injury. In addition, by applying our novel method of analysis, a relatively low number of subjects can be studied, another advantage when recruiting for patient studies. Furthermore, FDG PET offers the unique capability of high neural resolution and enhanced image quality. 18F-labelled fluorodeoxyglucose PET could therefore be used to image areas of brain where detail is required in the setting of complex motor task activities.
Footnotes
Acknowledgements
We are grateful to Professor Steve Williams, Chair in Imaging Science, University of Manchester for his analysis advice and to the Technicians and Radiographers in the North Western Medical Physics Department of the Christie Hospital NHS Trust for their technical support.