
Abstract
The WNK-SPAK kinase signaling pathway controls renal NaCl reabsorption and systemic blood pressure by regulating ion transporters and channels. A WNK3-SPAK complex is highly expressed in brain, but its function in this organ remains unclear. Here, we investigated the role of this kinase complex in brain edema and white matter injury after ischemic stroke. Wild-type, WNK3 knockout, and SPAK heterozygous or knockout mice underwent transient middle cerebral artery occlusion. One cohort of mice underwent magnetic resonance imaging. Ex-vivo brains three days post-ischemia were imaged by slice-selective spin-echo diffusion tensor imaging magnetic resonance imaging, after which the same brain tissues were subjected to immunofluorescence staining. A second cohort of mice underwent neurological deficit analysis up to 14 days post-transient middle cerebral artery occlusion. Relative to wild-type mice, WNK3 knockout, SPAK heterozygous, and SPAK knockout mice each exhibited a >50% reduction in infarct size and associated cerebral edema, significantly less demyelination, and improved neurological outcomes. We conclude that WNK3-SPAK signaling regulates brain swelling, gray matter injury, and demyelination after ischemic stroke, and that WNK3-SPAK inhibition has therapeutic potential for treating malignant cerebral edema in the setting of middle cerebral artery stroke.
Introduction
“Malignant” cerebral edema (i.e., brain swelling) can cause significant neurological morbidity or even death after large hemispheric ischemic strokes1,2 and is an independent predictor of poor outcome after ischemic stroke. 3 Na-K-Cl cotransporter isoform 1 (NKCC1) is a critical mediator of the intracellular Na+ overload and associated cell swelling that contributes to the pathogenesis of ischemic cerebral edema.4–6 The WNK (with no lysine = K) and Ste20/SPS1-related proline-alanine-rich protein kinases and (SPAK)/oxidative stress-responsive 1 (OSR1) kinases are evolutionarily conserved serine-threonine kinases that regulate the activities of multiple ion transporters and channels, including NKCC1, via protein phosphorylation.7–10 Mutations in WNK1 or WNK4 cause the salt-sensitive hypertensive syndrome pseudohypoaldosteronism type II 11 by up-regulating SPAK kinase-dependent phosphorylation and activation of Na-K-Cl cotransporter isoform 2 (NKCC2) and of the Na-Cl cotransporter (NCC), kidney-specific cousins of the ubiquitous NKCC1. 10
WNK and SPAK/OSR1 kinases are abundantly expressed in the central nervous system, 12 but their functions in the normal and ischemic brain are not well understood. We recently demonstrated that cerebral ischemia induced hyper-phosphorylation of the SPAK/OSR1 catalytic T-loop and of NKCC1 at Thr203/Thr207/Thr212 (see Begum et al. 13 ). Transgenic knockout (KO) of WNK3, an upstream regulator of SPAK/OSR1, reduced ischemia-mediated SPAK/OSR1-NKCC1 phosphorylation and significantly decreased infarct volume following middle cerebral artery (MCA) stroke. 13 These findings prompted us to evaluate the contribution of the WNK3/SPAK signaling complex to the development of malignant cerebral edema after ischemic MCA using ADC (apparent diffusion coefficient) and DTI (diffusion tensor imaging) magnetic resonance imaging (MRI), which allow semi-quantitative measurements of total brain water and demyelination. 14 Using these techniques, we detected less cerebral edema formation and a decrease in demyelination in brains from WNK3 KO or SPAK KO mice after ischemic stroke. WNK3 KO and SPAK KO mice also exhibited improved post-stroke neurological recovery. Together, these findings corroborate and extend our previous observations 13 and support the hypothesis that the WNK-SPAK signaling pathway is an important regulator of NaCl and water content in the mammalian brain and a key factor in the development of ischemic cerebral edema. As such, the cerebral WNK-SPAK pathway may be an important novel therapeutic target for the reduction of post-ischemic cerebral edema.
Materials and methods
Animals
All animal experiments and procedures were approved by the University of Pittsburgh Institutional Animal Care and Use Committee and performed in accordance with the National Institutes of Health Guide for the Care and Use of Laboratory Animals. All sections of this report adhere to the ARRIVE Guidelines for reporting animal research.
Animal preparation
WNK3−/− knockout (WNK3 KO) mice were generated from the ES cell line RRJ5k30 (Bay Genomics) by the Mutant Mouse Regional Resource Centers at the University of California-Davis (mmrrc.ucdavis.edu) as described. 13 Female WNK3−/−, male WNK3Y/− KO mice, and WT WNK3 mice were obtained by breeding gene-targeted WNK3 heterozygous (HET) female WNK3+/− mice into the C57Bl/6 J background. Mice on postnatal day 21 (P21) were genotyped by polymerase chain reaction (PCR) of tail DNA with a 3-primer protocol as described previously. 13 A total of 51 WNK3 (30 WT and 21 KO) mice were used in this study without any subjects excluded from analysis.
SPAK−/− knockout mice (SPAK KO, C57BL/6 genetic background) were generated as described. 15 Littermates were bred and tail genomic DNA samples from P14 mice were obtained for PCR genotyping.13,15 Totally, 55 SPAK mice were used in the study (25 WT, 15 HET, and 15 KO). Among these, 22 SPAK mice were used for neurological behavioral tests on days 1 to 14 post-tMCAO.
Focal ischemic stroke model
Transient focal cerebral ischemia was induced by occlusion of the left middle cerebral artery (MCAO), as described previously. 5 The left common carotid artery was exposed under 1.5% isofluorane anesthesia, and occipital artery branches of the external carotid artery were isolated and coagulated. The internal carotid artery was isolated, and the extracranial branch was dissected and ligated. A polyamide resin glue-coated suture (6–0 monofilament nylon) was used to block MCA blood flow as determined by transcranial Doppler. Then, the animal was monitored during the 60-min MCAO in the absence of isofluorane anesthesia. After 60 min of MCAO, the animal was exposed to 1.5% isofluorane anesthesia and the suture was withdrawn to achieve reperfusion. The incision was closed, and the mice were allowed to recover under heat lamp to ensure maintenance of core temperature at 36.0–37.0℃ during recovery. To control for non-specific effects due to animal handling, anesthesia, or surgery procedures, sham control animals underwent identical surgical procedures but were not subjected to suture insertion and vessel occlusion.
Neurological function tests
Neurological functional deficits in mice were screened in a blinded manner with the following tests: neurological score, corner test, adhesive removal test, and rotarod test, all considered reliable for identifying and quantifying sensorimotor deficits and postural asymmetries.16,17
Neurological score
Neurological deficit grading system was used to evaluate neurological deficit at 1, 2, 3, 5, 7, 10, and 14 days after tMCAO. 18
Corner test
Neurological functional deficits in mice were also determined by the corner test. 16 Corner tests were conducted at 1, 2, 3, 5, 7, 10, and 14 days after tMCAO. The apparatus consists of two cardboards (30 × 20 × 1 cm each) placed together at a 30° angle to form a narrow alley. The mouse was placed between the two angled boards facing the corner. When exiting the corner, uninjured mice will turn left or right randomly. After tMCAO, animals with unilateral brain damage will exhibit unidirectional turning. The numbers of left and right turns of each mouse during 10 trials were recorded, and turning movements that were not part of a rearing movement were not scored. 17
Adhesive removal test
An adhesive removal test was used to measure somatosensory deficits as described previously. 19 Two pieces of adhesive tape (4 mm × 3 mm) were attached to the forepaws in an alternating sequence and with equal pressure by the experimenter before each trial. The removal time is defined as the time at which the animal removes the tape. The trial ended after the adhesive patch was removed or after 2 min had elapsed. Pre-operative training was carried twice per day for three days. 19 Animals were tested on day 1, 2, 3, 5, 7, 10, and 14 after tMCAO.
Rotarod test
The rotarod test was used to assess motor coordination and balance alterations. The apparatus consisted of a black striated rod separated in four compartments (Model 755; IITC Life Science Inc., Woodland Hills, CA). Animals were first habituated to a stationary rod for 2 min and then placed on a rotating drum accelerating from 4 to 40 r/min over a 5-min period. The time the animal stayed on the drum was recorded. Three trials were performed with 15-min interval rest periods. Then, the mice were placed on the rotating drum at 40 r/min and observed over 60 s. The time at which the animal fell off the drum was recorded. 20 Animals were tested on day 1, 2, 3, 5, 7, 10, and 14 after tMCAO.
DTI of ex-vivo brains
Seventy-two hours post-reperfusion, mice were anesthetized with 5% isoflurane, transcardially perfused with 4% paraformaldehyde (PFA) and decapitated. For ex-vivo MRI, brains were maintained within the skull to avoid anatomical deformation. After post-fixation in 4% PFA overnight, heads were stored in PBS solution at 4℃. MRI was performed at 500 MHz using a Bruker AV3HD 11.7 T/89 mm vertical bore small animal MRI scanner, equipped with a 25-mm quadrature RF coil and Paravision 6.0 (Bruker Biospin, Billerica, MA). Following positioning and pilot scans, a DTI data set covering the entire brain was collected using a multislice spin echo sequence with 3 reference and 30 non-collinear diffusion-weighted images with the following parameters: TE/TR = 22/5000 ms, 4 averages, matrix size = 192 × 192 reconstructed to 256 × 256, field of view = 17.3 × 17.3 mm, 33 axial slices, slice thickness = 0.5 mm, b-value = 1200 s/mm2, and Δ/δ = 10/5 ms.
DTI data were analyzed with DSI Studio (http://dsi-studio.labsolver.org/). In a blinded manner, region of interests (ROIs) were manually drawn for the ipsilateral (IL) and contralateral (CL) cortex, striatum, corpus callosum (CC), and external capsule (EC). Values for the fractional anisotropy (FA), ADC, and diffusivity were calculated for the entire volume of each ROI (Figure 2(a)).
Double immunofluorescence staining
After MRI analysis, the ex-vivo brains were stored in 20% sucrose for 24 h and then in 30% sucrose for another 24 h period before sectioning (35 µm thickness) on a freezing sliding microtome (Leica SM2000R, Leica, IL). Brain sections were cryoprotected in antifreeze solution and stored at −20℃. Two coronal brain sections (0.26 mm posterior from bregma, interaural 4.06 mm) from each brain were used for quantification of white matter injury. After rinsing with tris-buffered saline (TBS), brain sections were incubated with TBS++ (0.1% Triton X-100 and 3% goat serum in 0.1 M TBS) as previously described. 13 Sections were double-stained with chicken polyclonal antibody against myelin basic protein (MBP, 1:200) and mouse monoclonal antibody against adenomatous polyposis coli (APC, 1:100) for 1 h at 37℃ and then overnight at 4℃. After washing with TBS, brain sections were incubated for 1 h at 37℃ with goat anti-chicken Alexa Fluor 546-conjugated IgG for MBP (1:200) and goat anti-mouse Alexa Fluor 488-conjugated IgG for APC (1:100). Sections were then incubated in To-Pro-3 Iodide, mounted on slides as described, 13 and imaged with a Leica DMIRE 2 inverted confocal microscope and software (Leica Inc, IL). Immunofluorescence staining images were auto-thresholded using ImageJ to subtract background staining. 21 ROI were selected within the IL and CL CC or EC. Fluorescence intensity was calculated as the percentage of fluorescence-positive pixels within each ROI and expressed as a ratio of IL/CL values.
Calculation of infarct volume and swelling with 2,3,5-triphenyltetrazolium chloride monohydrate staining
At 24–72 h post-reperfusion, mice previously subjected to tMCAO were anesthetized with 5% isoflurane and then decapitated. Two-millimeter coronal brain slices were stained with 2% 2,3,5-triphenyltetrazolium chloride monohydrate (TTC). 13 Ischemic lesions were traced in each slice in a blinded manner, and the total volume of infarction was calculated with correction for edema, as described by Swanson 22 using ImageJ software. Infarct areas were summed across all slices and multiplied by slice thickness to yield total infarct volume (mm3). Brain swelling was determined with the following formula: swelling (% contralateral hemispheric volume) = [(ipsilateral hemispheric volume) − (contralateral hemispheric volume)]/(contralateral hemispheric volume) × 100, as described. 23
Statistics
The animal subjects were randomly assigned into different studies and surgical procedures, and data analyses were performed by investigators who were blinded to the experimental conditions. Values are expressed as means ± SD or SEM. Statistical analysis was performed using the Mann–Whitney rank-sum test, or for multiple comparisons, ANOVA with Bonferroni post-test (SigmaStat, Systat Software, Point Richmond, CA, USA). The Pearson correlation coefficient was calculated using online statistics software (Office for Research Development and Education, version 1.1.23-r7). A p-value less than 0.05 was considered statistically significant.
Results
WNK3 KO mice subjected to ischemic MCA stroke exhibit less radiographic ischemic injury and cerebral edema
WNK3 KO mice exhibit smaller infarct size as determined by TTC staining at 24 h post-tMCAO with reperfusion.
13
We investigated the extent of ischemic injury in WNK3 WT and WNK3 KO mice at 72 h reperfusion, a time point of maximum cerebral edema and infarct.
24
Figure 1(a) shows representative ADC maps of ex-vivo brains from both WNK3 WT and WNK3 KO mice. The WNK3 WT mice exhibited large edema lesion formation in the IL cortex and striatum (45.7 ± 26.8 mm3), in contrast to the smaller lesion volumes (11.7 ± 6.6 mm3) in WNK3 KO animals (Figure 1(c)).
Diffusion-weighted MRI detection of smaller ischemic lesions in WNK3 KO mice after tMCAO. (a) Representative ADC maps of ex vivo-imaged brains of WNK3 WT and WNK3 KO mice. Brain tissues were harvested at 72 h after tMCAO and imaged with the Bruker 11.7 Tesla MRI scanner. IL: ipsilateral; CL: contralateral. Arrows: large lesion; Arrowheads: small lesion. (b) Representative 3D reconstructions of the infarct areas in ex vivo-imaged brains. (c) Infarct volume (mean ± SD, identified by areas of low ADC) in WNK3 WT (n = 10) and WNK3 KO brains (n = 5). **p < 0.01, ***p < 0.001. WNK3 KO mice exhibit smaller white matter lesions after tMCAO. (a) Representative fractional anisotropy (FA) and directionally encoded color (DEC) maps of ex vivo brains were shown. Ex vivo brains were harvested at 72 h after tMCAO. Boxed area: corpus callosum (CC) or external capsule (EC) for immunostaining analysis. Arrows: intact EC; Arrowheads: damaged EC. (b) FA values (mean ± SD) in CC, EC, or total white matter (n = 4–5). *p < 0.05, ***p < 0.001. (c) Representative immunofluorescence images of APC+ cell number and MBP protein expression in white matter tissues of WNK3 WT and WNK3 KO brains. Arrows: abundant APC+ cells; Arrowheads: fewer APC+ cells. Open arrows: abundant MBP; Open arrowheads: reduced levels of MBP. (d) Immunostaining values of APC+ cells and MBP protein expression (mean ± SD, n = 4). *p < 0.05, **p < 0.01 for WT vs. KO.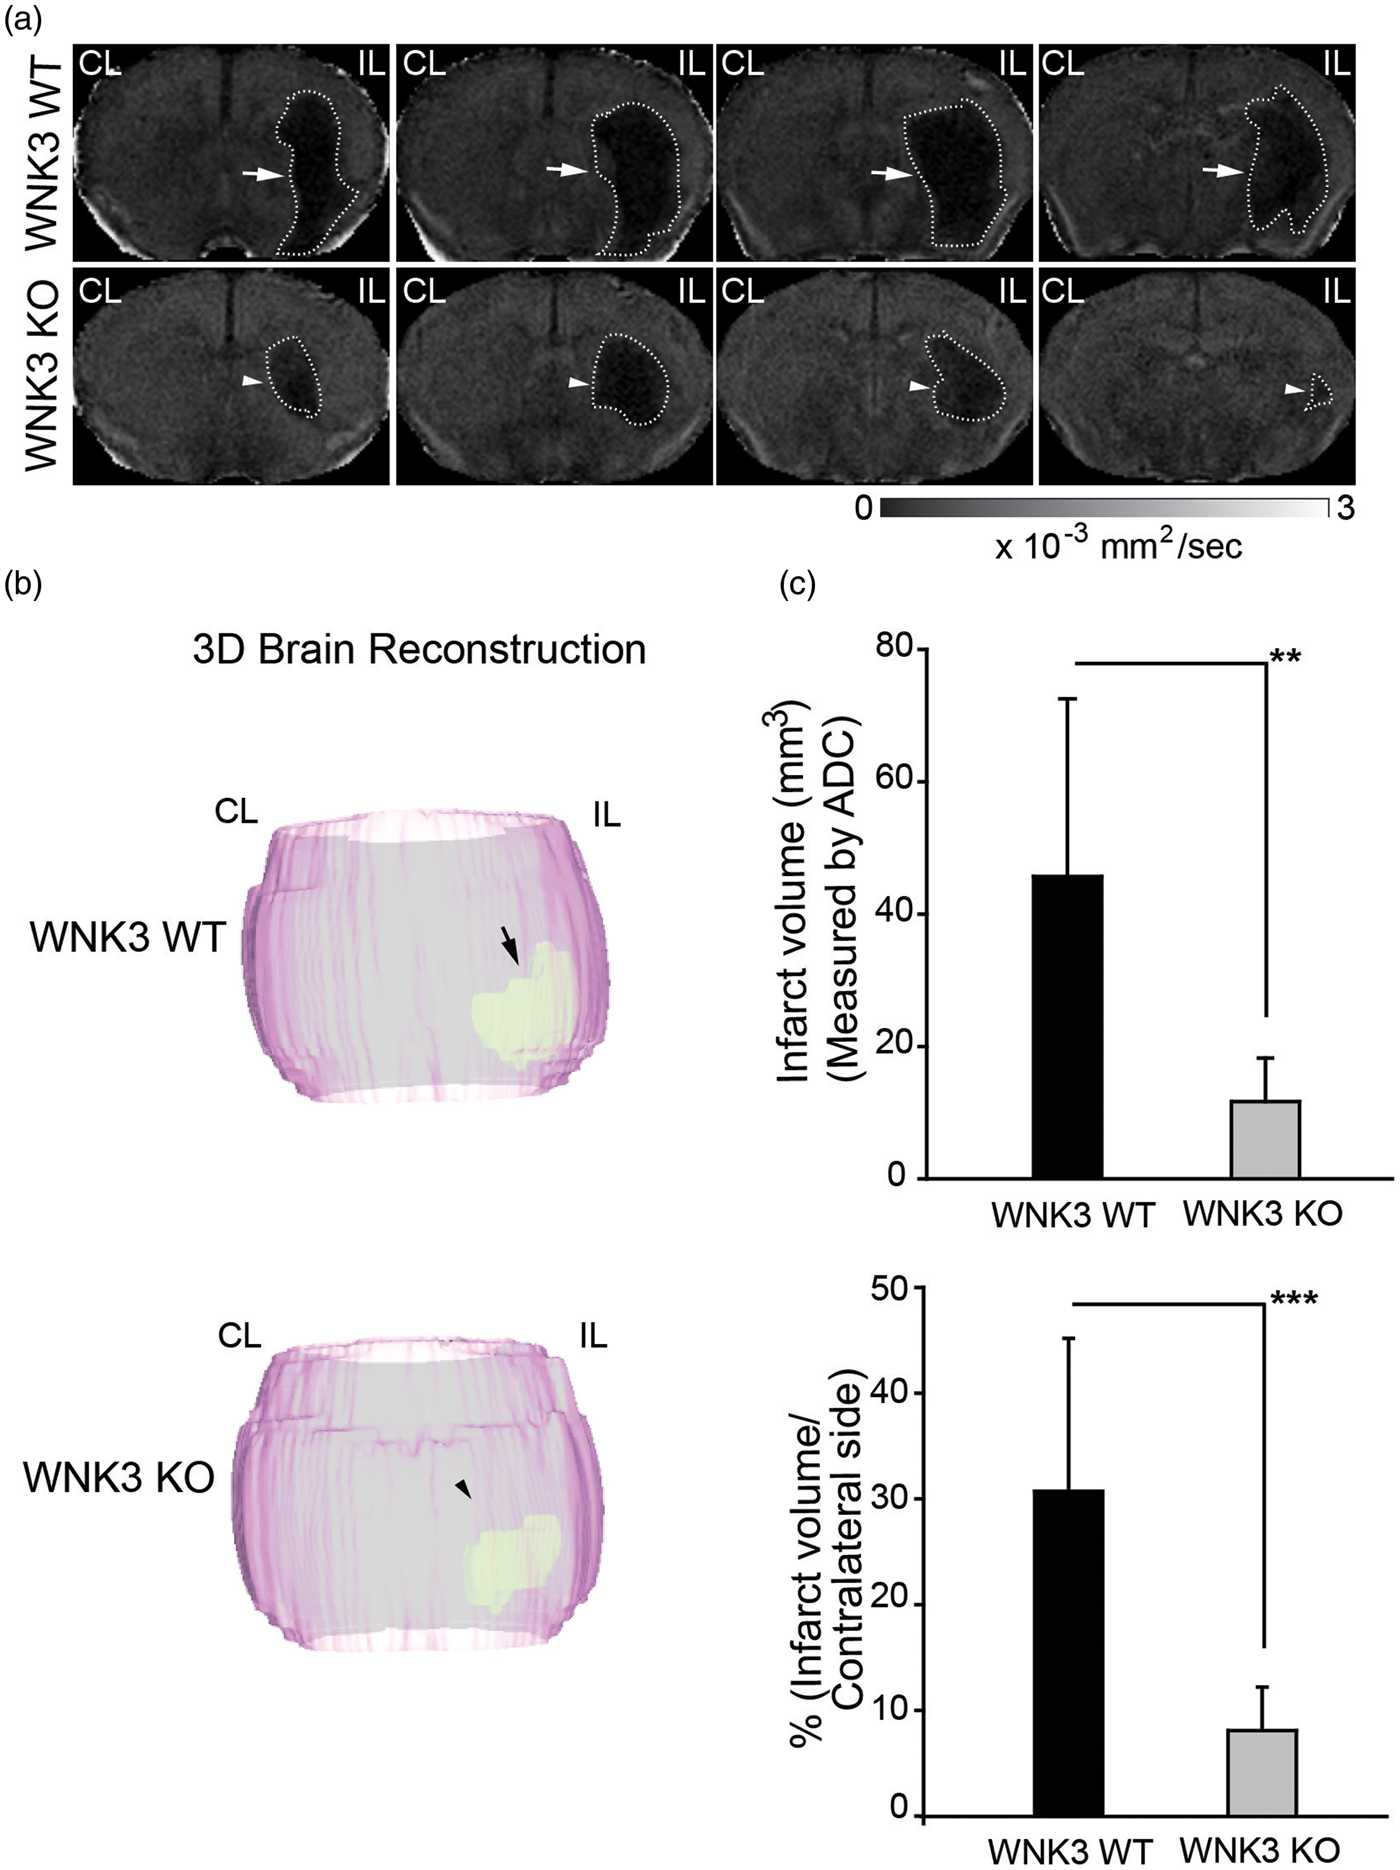
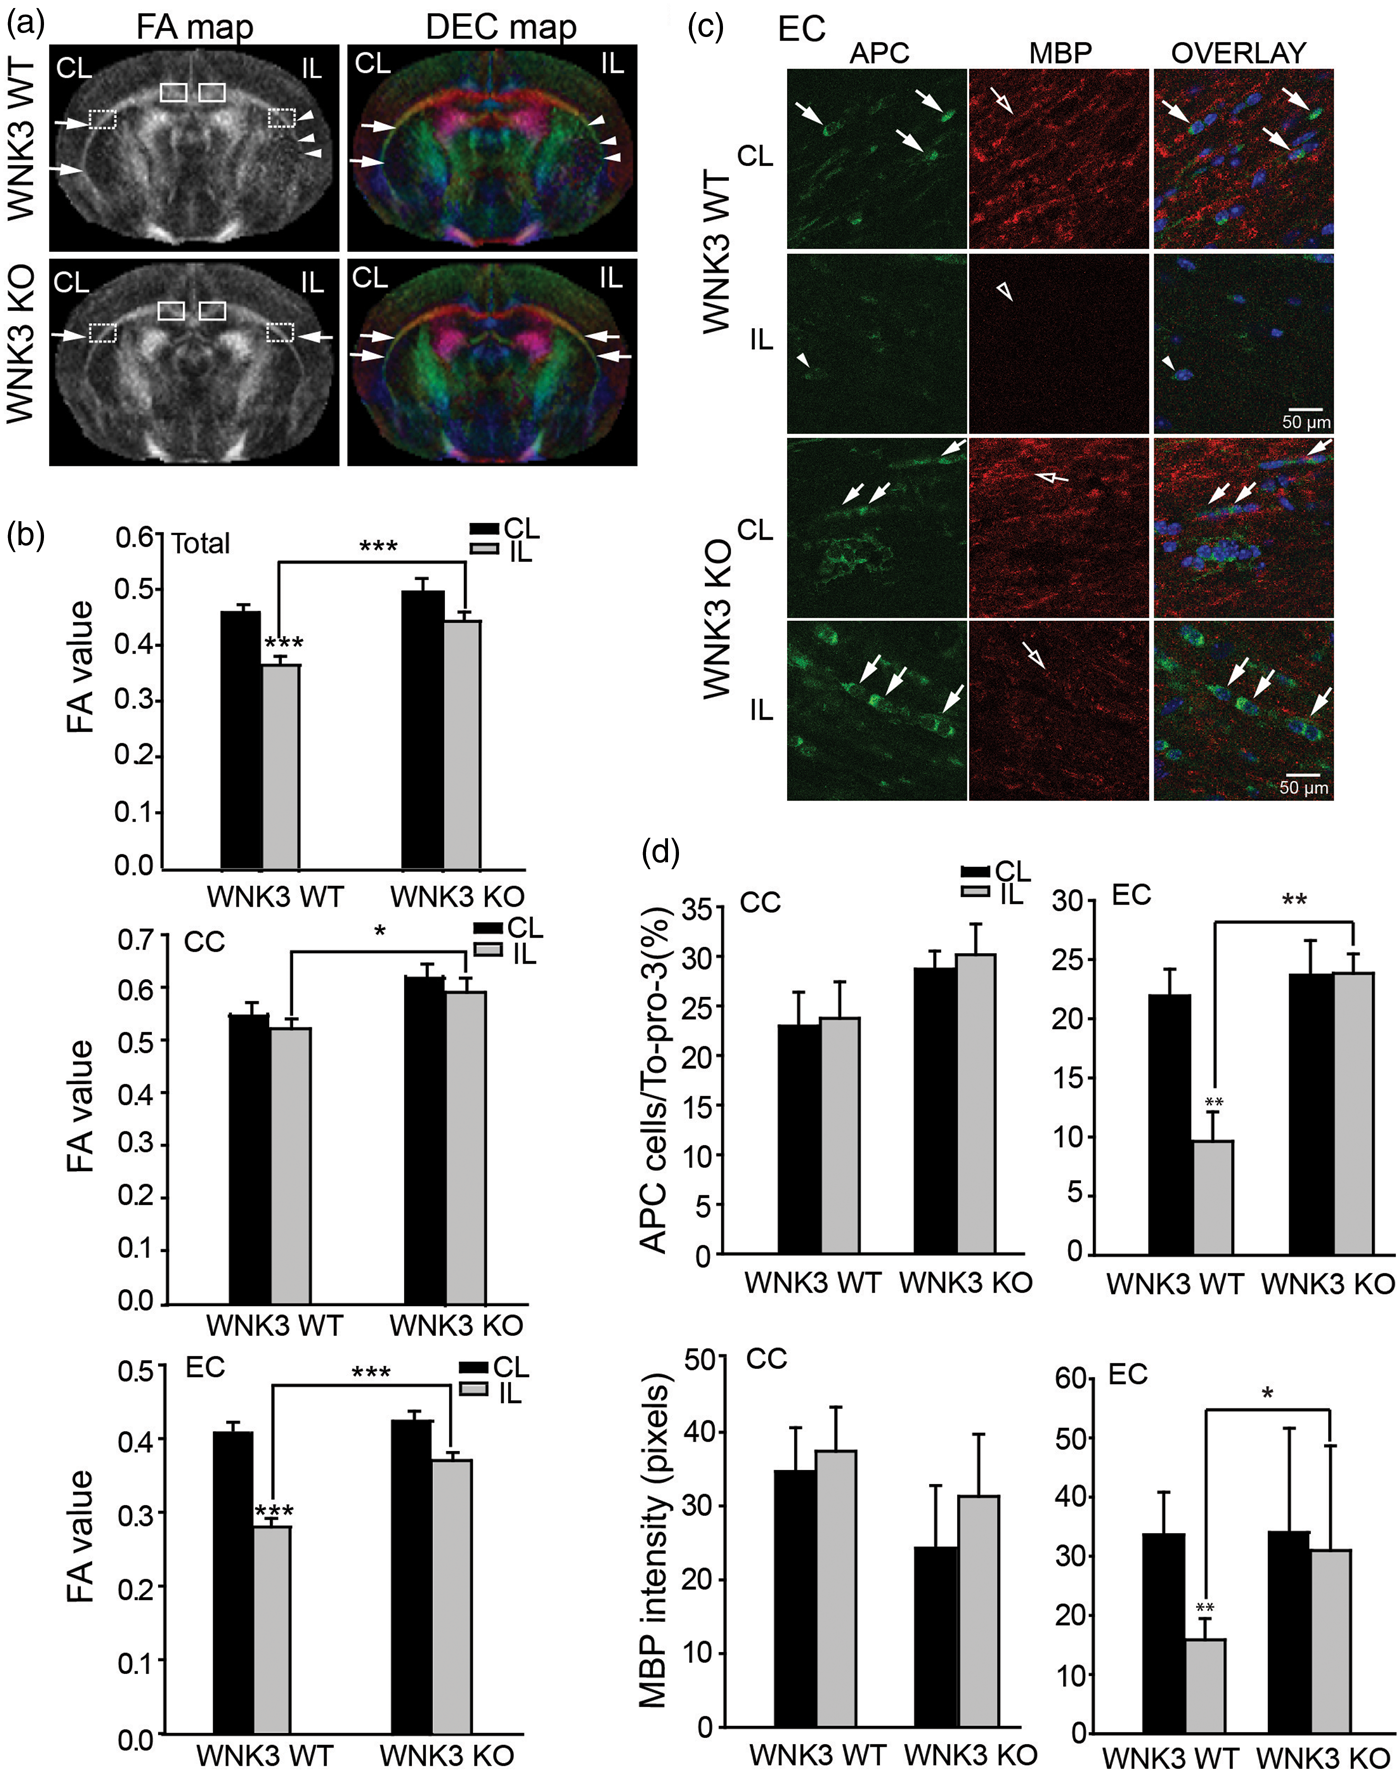
To evaluate stroke-mediated white matter injury, we examined the FA maps and the directionally encoded color (DEC) maps of the CC and EC in the CL and IL hemispheres in these brains. As shown in Figure 2(a), the FA and DEC maps illustrate intact CC and EC (arrows) in the CL of both the WNK3 WT and the WNK3 KO brains. In the IL hemisphere, the CC appears undamaged in both groups of mice, but the EC in the IL hemisphere of WNK3 WT mice shows some injury as compared with WNK3 KO mice (Figure 2(a), arrowheads). CC and EC FA values do not differ for either group of mice in the CL hemisphere. In contrast, both CC and EC FA values in the IL hemisphere are significantly lower in WNK3 WT mice than in WNK3 KO mice (0.52 ± 0.08 vs. 0.60 ± 0.09 CC; and 0.28 ± 0.05 vs. 0.37 ± 0.04 EC, Figure 2(b)). These data imply that WNK3 KO mice exhibited not only less ischemic cerebral swelling but also increased resistance to ischemic damage in white matter.
We subsequently evaluated changes of mature oligodendrocyte numbers and axon myelination by immunofluorescence staining with antibodies for APC and MBP marker proteins, respectively. As shown in Figure 2(c) and (d), APC+ mature oligodendrocytes were abundant in the CC tract in the CL hemispheres of WNK3 WT and KO brains (arrows). These oligodendrocytes were surrounded with myelinated axons (open arrows). Enlarged images from Figure 2(c) (presented in Supplemental Figure 2) show that APC and MBP immnunofluorescence signals were respectively localized in oligodendrocyte cell body or myelinated fibers, with minimum co-localization. In the IL CC of WNK3 WT brains, there was no significant reduction of APC+ oligodendrocytes or MBP expression (Figure 2(d)). In contrast, severe loss of APC+ cell number and reduced MBP expression were evident in the EC of WNK3 WT brains (Figure 2(d)). But, WNK3 KO brain EC tracts exhibited significantly less reduction in APC+ cell number (9.63 ± 2.49 WT vs. 23.83 ± 1.65 KO) and less loss of MBP protein expression (15.9 ± 3.6 WT vs. 31.0 ± 17.7 KO) (Figure 2(d)). These data are consistent with changes of FA values of DTI data. In fact, FA correlated positively with MBP expression (R = 0.891, p < 0.05) and with APC+ oligodendrocyte numbers (R = 0.701, p < 0.05) in EC axon tracts (Figure 5). Taken together, these findings clearly suggest that deletion of WNK3 in WNK3 KO mice preserves mature oligodendrocytes and prevents axonal demyelination after ischemia.
Genetic depletion of SPAK kinase reduces ischemic brain injury after tMCAO
We investigated whether WNK3 signaling in ischemic damage might involve its down-stream substrate SPAK, an effector kinase of the WNK cascade.
7
Figure 3(a) to (c) shows that SPAK WT, HET, and KO mice underwent similar expected reductions of rCBF during the 60-min MCAO. However, SPAK Het and SPAK KO mice exhibited significantly less infarct as measured with TTC staining at 48 h post reperfusion (p < 0.05). tMCAO resulted in significant hemispheric swelling in SPAK WT brains examined by TTC staining, as previously described
23
(Figure 3(d)). Furthermore, hemispheric swelling in SPAK HET or KO brains was less than in SPAK WT brains, and SPAK protein expression in SPAK HET brain tissues was reduced by 70% (Supplemental Figure 1).
Less severe ischemic infarct was detected in SPAK HET and SPAK KO mice after tMCAO. (a) Representative regional cerebral blood flow (rCBF) traces in SPAK WT, HET, and KO mice. (b) Representative TTC staining images showing extent of cerebral ischemic lesion in SPAK WT, HET or KO mice at 48 h after tMCAO. (c) Infarct volumes (mean ± SEM; n = 3–5). * p < 0.05 WT vs. HET or KO. Percentage of hemispheric swelling calculated from TTC staining (mean ± SEM, n = 3–5). *** p < 0.001 WT vs. HET or KO. (d) Representative ADC maps of ex vivo-imaged brains of SPAK WT, HET, and KO mice. Brain tissues were harvested at 72 h after tMCAO. Arrows: large lesion; Arrowheads: small lesion. Infarct volume (mean ± SD, n = 4). *p < 0.05; **p < 0.01; ***p ≤ 0.001 for WT vs. HET or KO.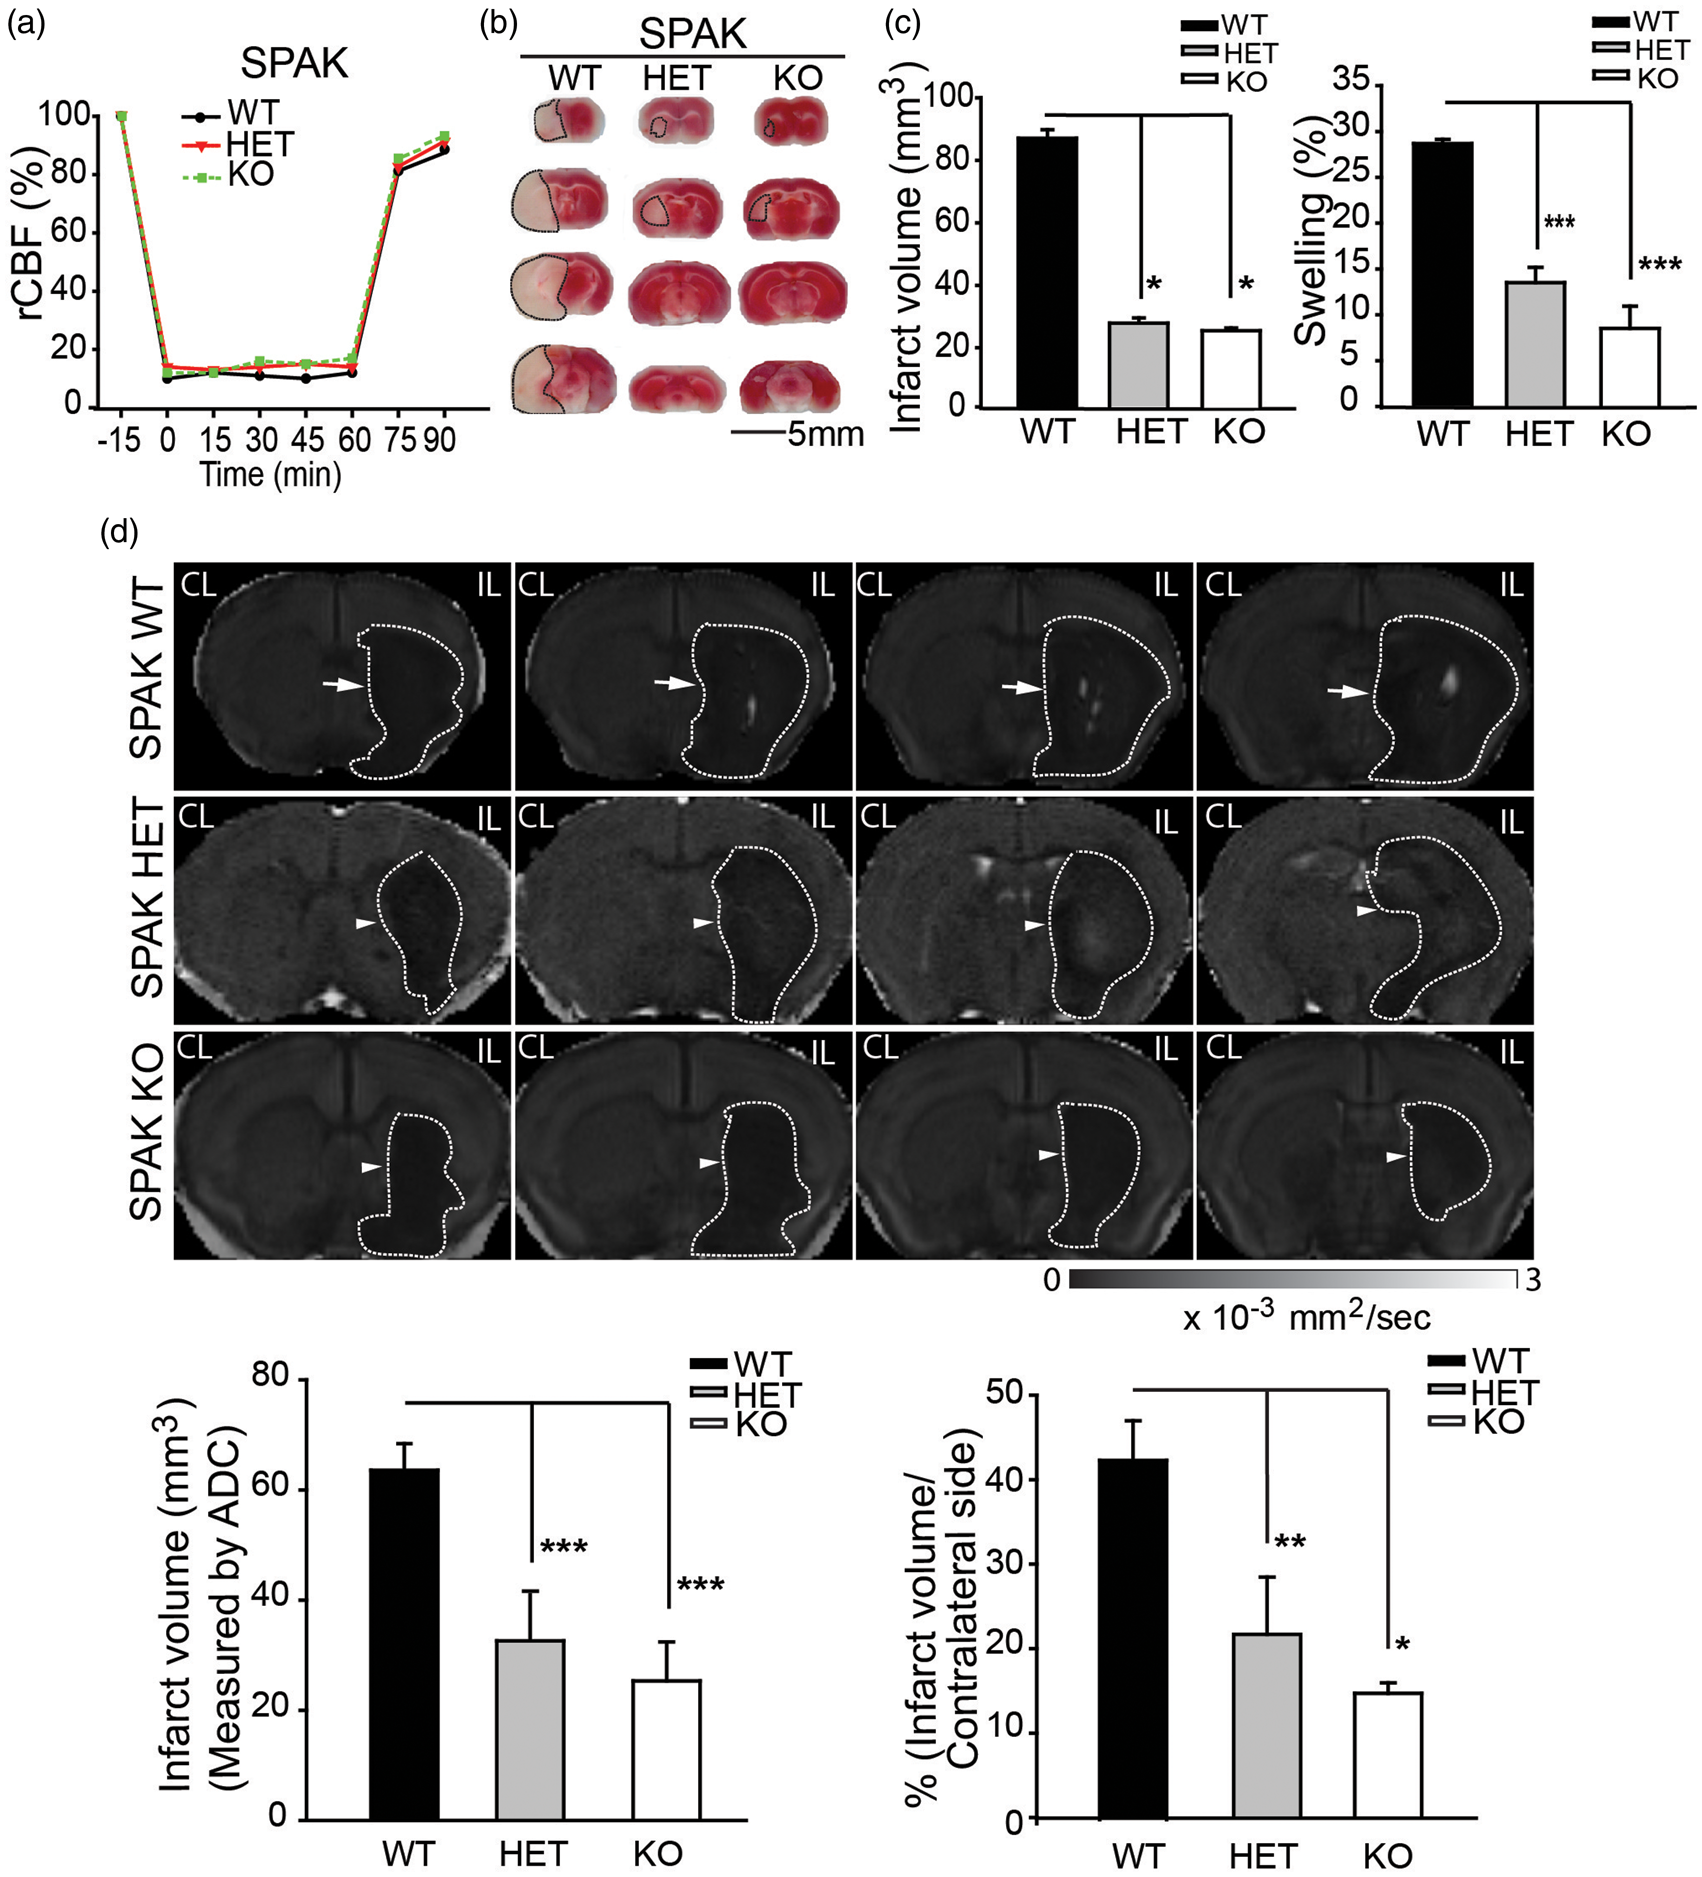
At 72 h post-reperfusion, ADC maps of SPAK WT mice revealed a sustained ischemic edema lesion in the IL cortex and striatum of SPAK WT mice (arrows, Figure 3(d)). SPAK KO mice exhibited significantly smaller ADC lesion volume. ADC-positive lesion was present only in striatal areas of SPAK KO brains (arrowheads, Figure 3(d)). ADC ischemic lesion volume was reduced by ∼50% in SPAK HET and in SPAK KO mice (p < 0.05), consistent with the TTC staining data (Figure 3(c)).
The FA and DEC maps in Figure 4(a) and (b) demonstrate that SPAK HET and SPAK KO mice exhibited less white matter damage (arrows) than SPAK WT mice (arrowheads), with the EC tracts most severely affected (Figure 4(a) and (b)). Immunofluorescence experiments revealed that only SPAK KO brains substantially preserved APC+ cells and MBP expression, although SPAK HET brains exhibited intermediate levels of preservation of APC+ cells and MBP expression. As shown in Figure 4(d), APC+ oligodendrocytes were abundant in the CC tract in the CL hemispheres of SPAK WT, HET, and KO brains and were surrounded by myelinated axons. Enlarged images of Figure 4(c) (presented in Supplemental Figure 3) confirm minimal co-localization of APC and MBP immnunofluorescence signals. Oligodendrocytes and myelinated axons were also abundant in the CC tract in the IL hemisphere of SPAK WT, HET, and KO brains. These data are consistent with FA values of DTI data for the CC tracts.
SPAK, HET, and SPAK KO mice showed less white matter lesion and less demyelination after tMCAO. (s) Representative FA and DEC maps of ex vivo brains from SPAK WT, HET, and KO mice. Boxed areas: corpus callosum (CC) or external capsule (EC) for immunostaining analysis. Arrows: intact CC or EC; Arrowheads: damaged CC or EC. (b) FA values (mean ± SD, n = 3–5) of white matter tissues. *p < 0.001 for CL vs. IL. (c) Representative immunofluorescence images of APC+ and MBP protein expression in white matter tissues of WNK3 WT and WNK3 KO brains. Arrows: abundant APC+ cells; Arrowheads: fewer APC+ cells. Open arrows: abundant MBP. Open arrowheads: less MBP. (d) Mean immunostaining values (mean ± SD, n = 4). *p < 0.05 or **p < 0.01 for WT vs. KO. Pearson correlation analysis between FA and expression of MBP or APC. (a) Correlation between FA values and MBP expression (in pixels) in EC of WNK3 WT and KO mice (data adapted from Figure 2). *p < 0.05. (b) Correlation between FA values and APC expression (APC cell/Topo3) in EC WNK3 WT and KO mice (data adapted from Figure 2). *p < 0.05. (c) Correlation between FA values and MBP expression (in pixels) in EC of SPAK WT, HET, and KO mice (data adapted from Figure 4). *p < 0.05. (d) Correlation between FA values and APC expression (APC cell/To-pro-3) in EC of SPAK WT, HET, and KO mice (data adapted from Figure 4).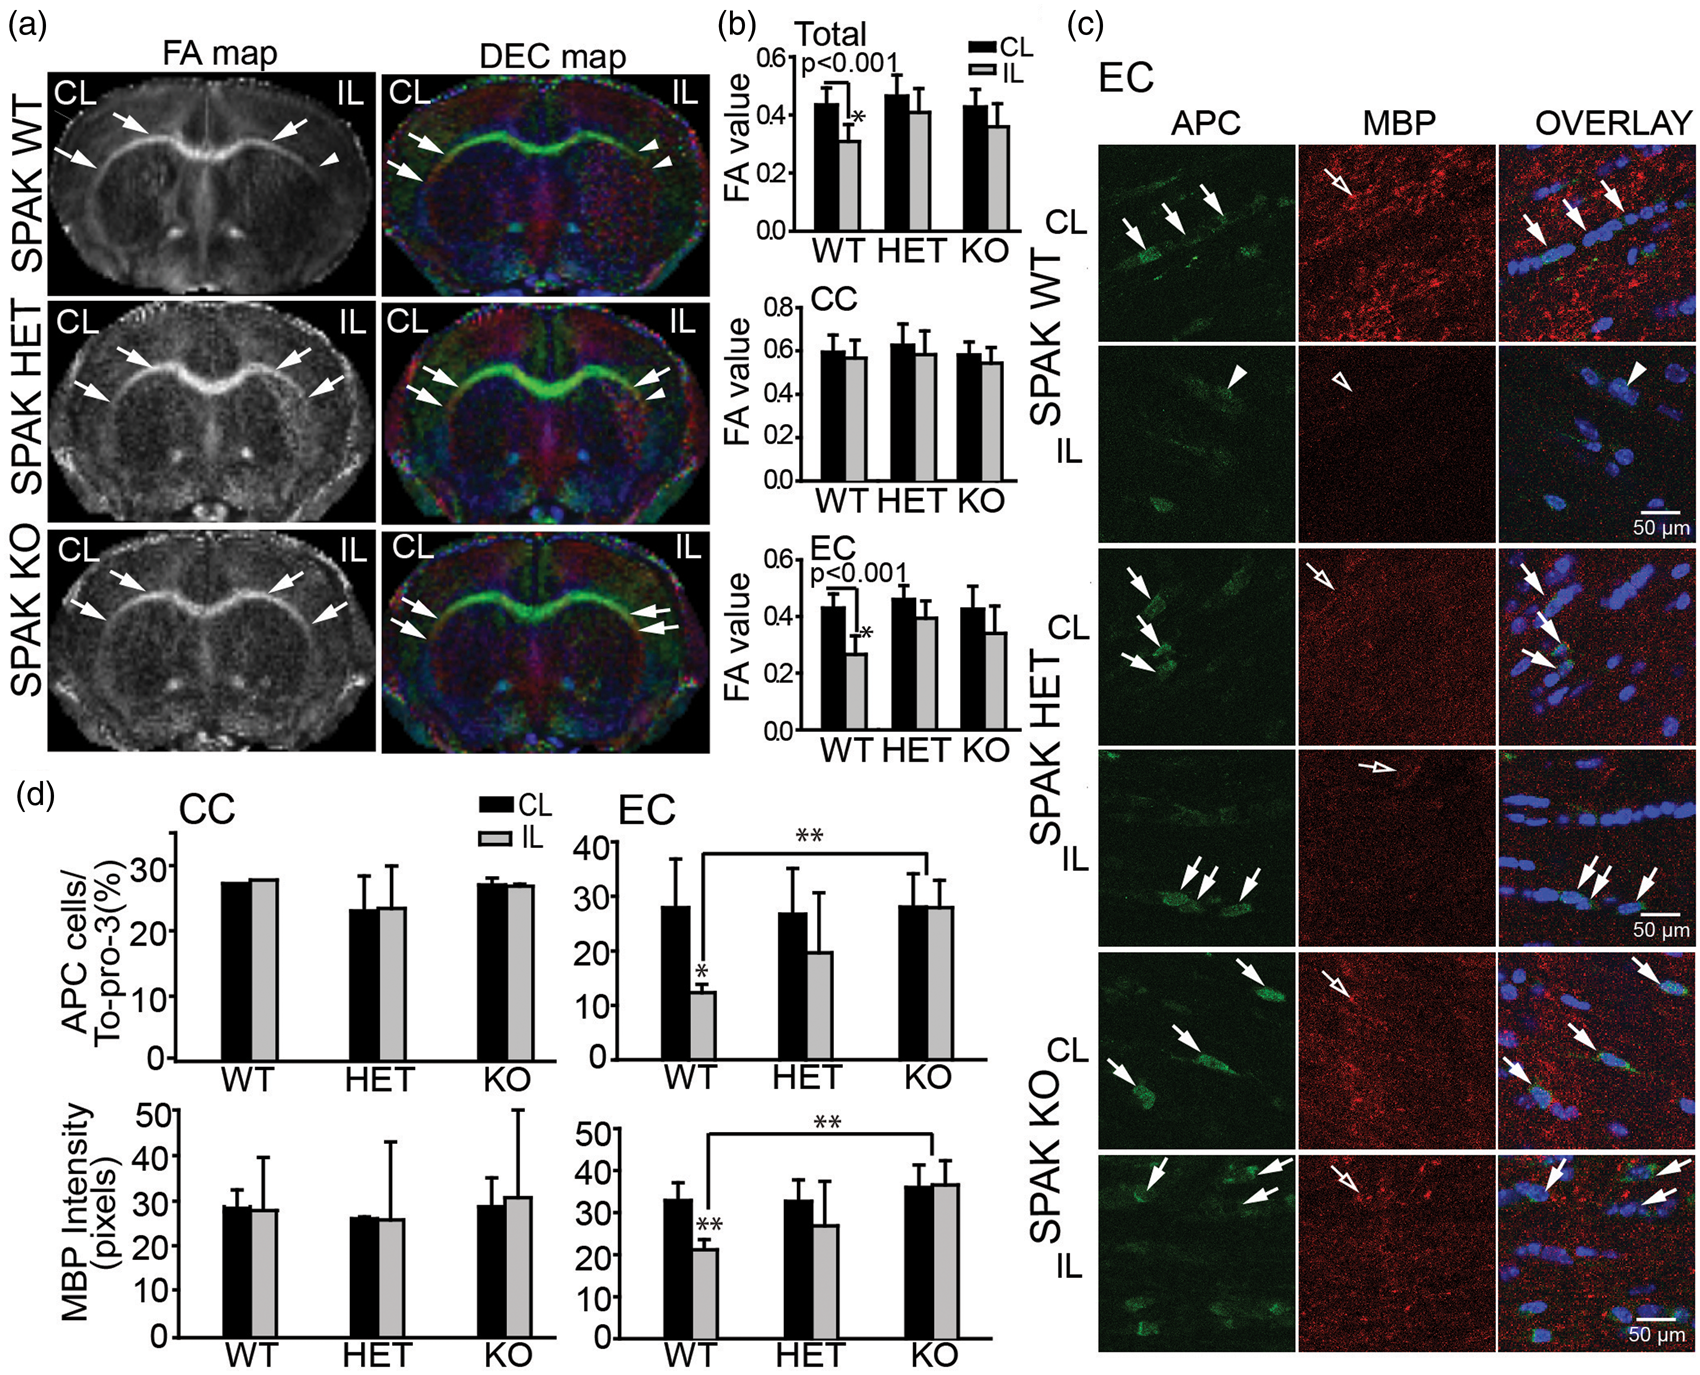
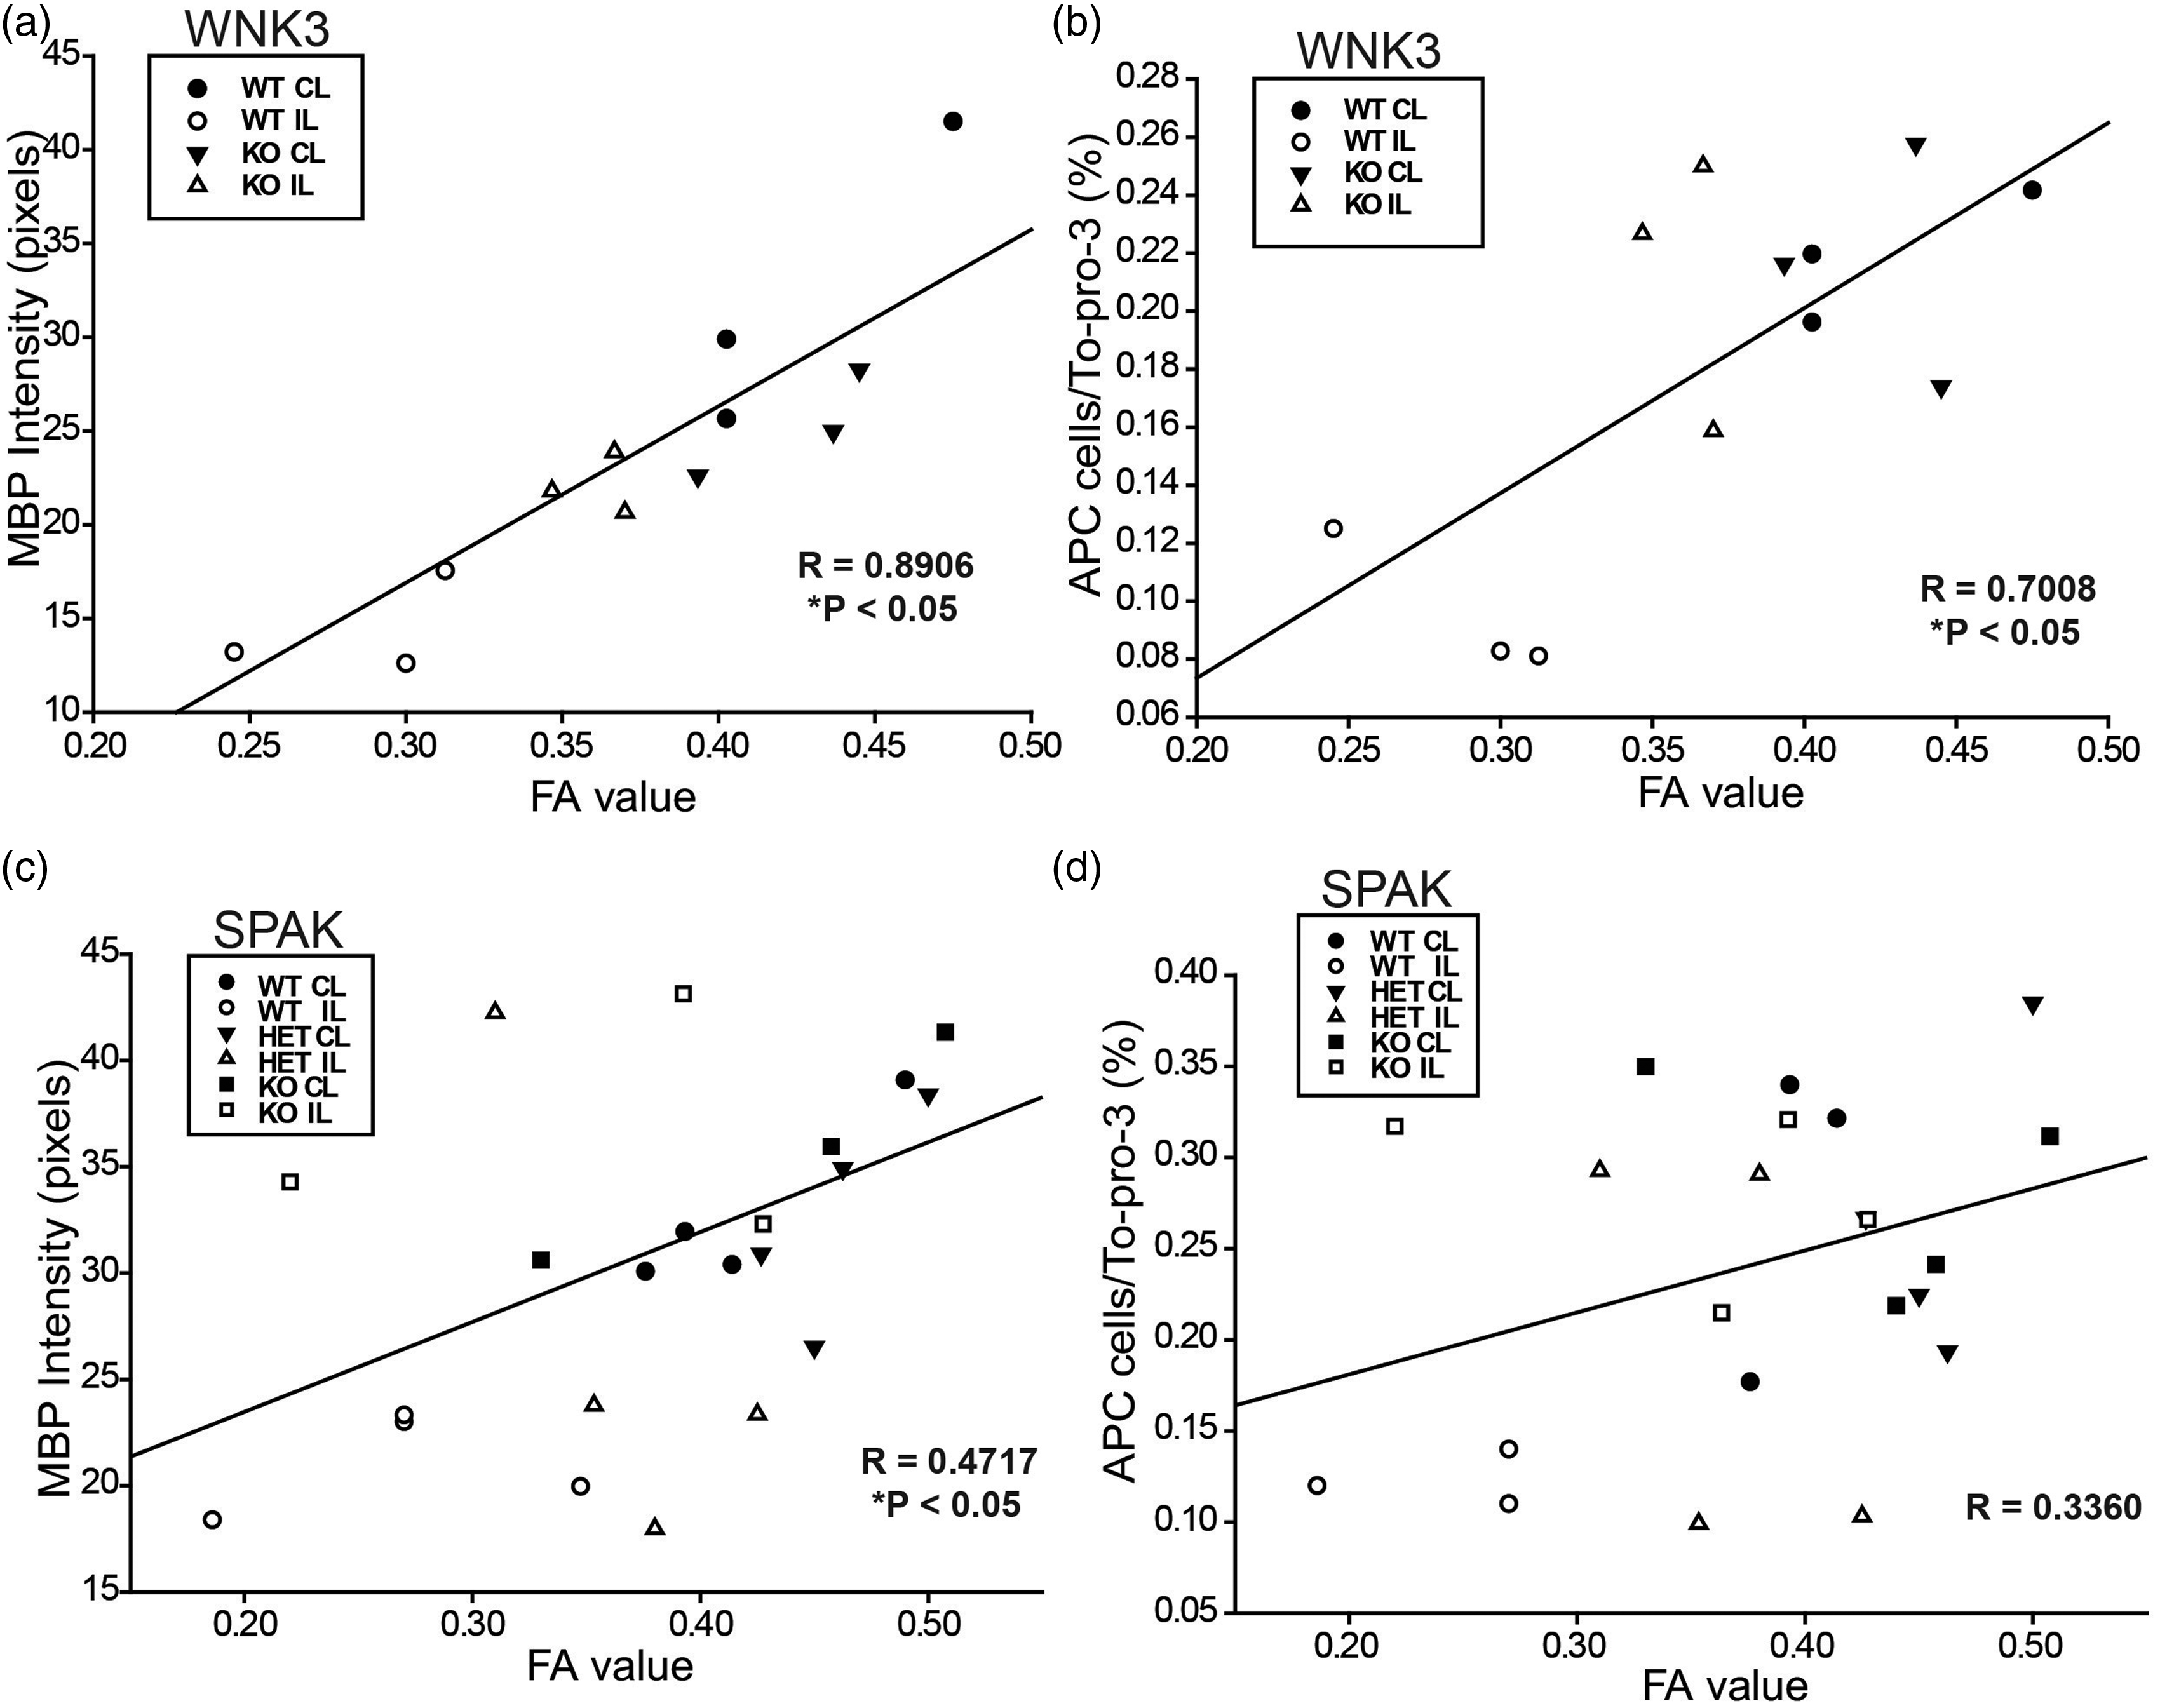
The loss of APC+ cells (arrowheads) and reduced MBP expression (open arrowheads) were severe in the EC of the SPAK WT brains (Figure 4(c) and (d)). In contrast, SPAK HET and KO mouse brains exhibited less severe loss of APC+ cells (arrows) and preservation of MBP expression (open arrows) in the EC tract (Figure 4(c)). Despite lack of significant post-tMCAO FA changes in the EC of SPAK HET mice, both APC+ oligodendrocyte number and MBP expression were reduced to intermediate levels (Figure 4(c) and (d)). These findings, together with the positive correlation between FA changes and MBP expression in the EC (R = 0.472, p < 0.05) (Figure 5), suggest an important role for the WNK3-SPAK signaling pathway in ischemic white matter damage.
WNK3 KO mice show faster neurological functional recovery after tMCAO
We next evaluated neurological function recovery in WNK3 WT, WNK3 KO mice at 1–14 days after tMCAO. The neurological deficit scores are generally associated with motor impairment. The neurological scores demonstrated neurological deficits in WNK3 WT mice on days 2 to 7 after tMCAO, but with progressive improvement on days 7 to 14 (Figure 6(a)). WNK3 KO mice exhibited less severe deficits on days 3 to 5, followed by a faster neurological recovery on days 7 to 14 post-tMCAO (Figure 6(a)). Neurological scores of WNK3 WT and KO mice are evaluated separately for males and females in Supplemental Figure 5. Neurological behavioral scores of male and female mice were indistinguishable within each genotype. WNK3 KO mice of both sexes showed faster neurological function recovery than WNK3 WT mice, consistent with their smaller cerebral infarction size.
Improved neurological function in WNK3 KO mice after ischemic stroke. (a) Neurological score of sham-operated or ischemic stroke WNK3 WT and KO mice at 1–14 days after surgical procedures. Data are mean ± SEM. Sham-operated WNK3 WT mice n = 5 (3 female, 2 male); Sham-operated WNK3 KO mice n = 5 (3 female, 2 male). Ischemic WNK3 WT mice (n = 10; 5 female, 5 male); Ischemic WNK3 KO mice (n = 11; 4 female, 7 male). *p < 0.05, **p < 0.01, ***p < 0.001 for ischemic WNK3 WT vs. KO mice. (b) Corner test of WNK3 WT and KO mice (same cohort as in (a); mean ± SEM). *p < 0.05, **p ≤ 0.01, ***p ≤ 0.001 for ischemic WNK3 WT vs. KO mice. (c) Removal time of adhesive test in WNK3 WT and KO mice (same cohort as in (a); mean. ± SEM. *p < 0.05 for ischemic WNK3 WT vs. KO mice. (d) Rotarod test with accelerating speed in WNK3 WT and KO mice (same cohort as in (a); mean ± SEM). Ischemic WNK3 WT vs. KO mice.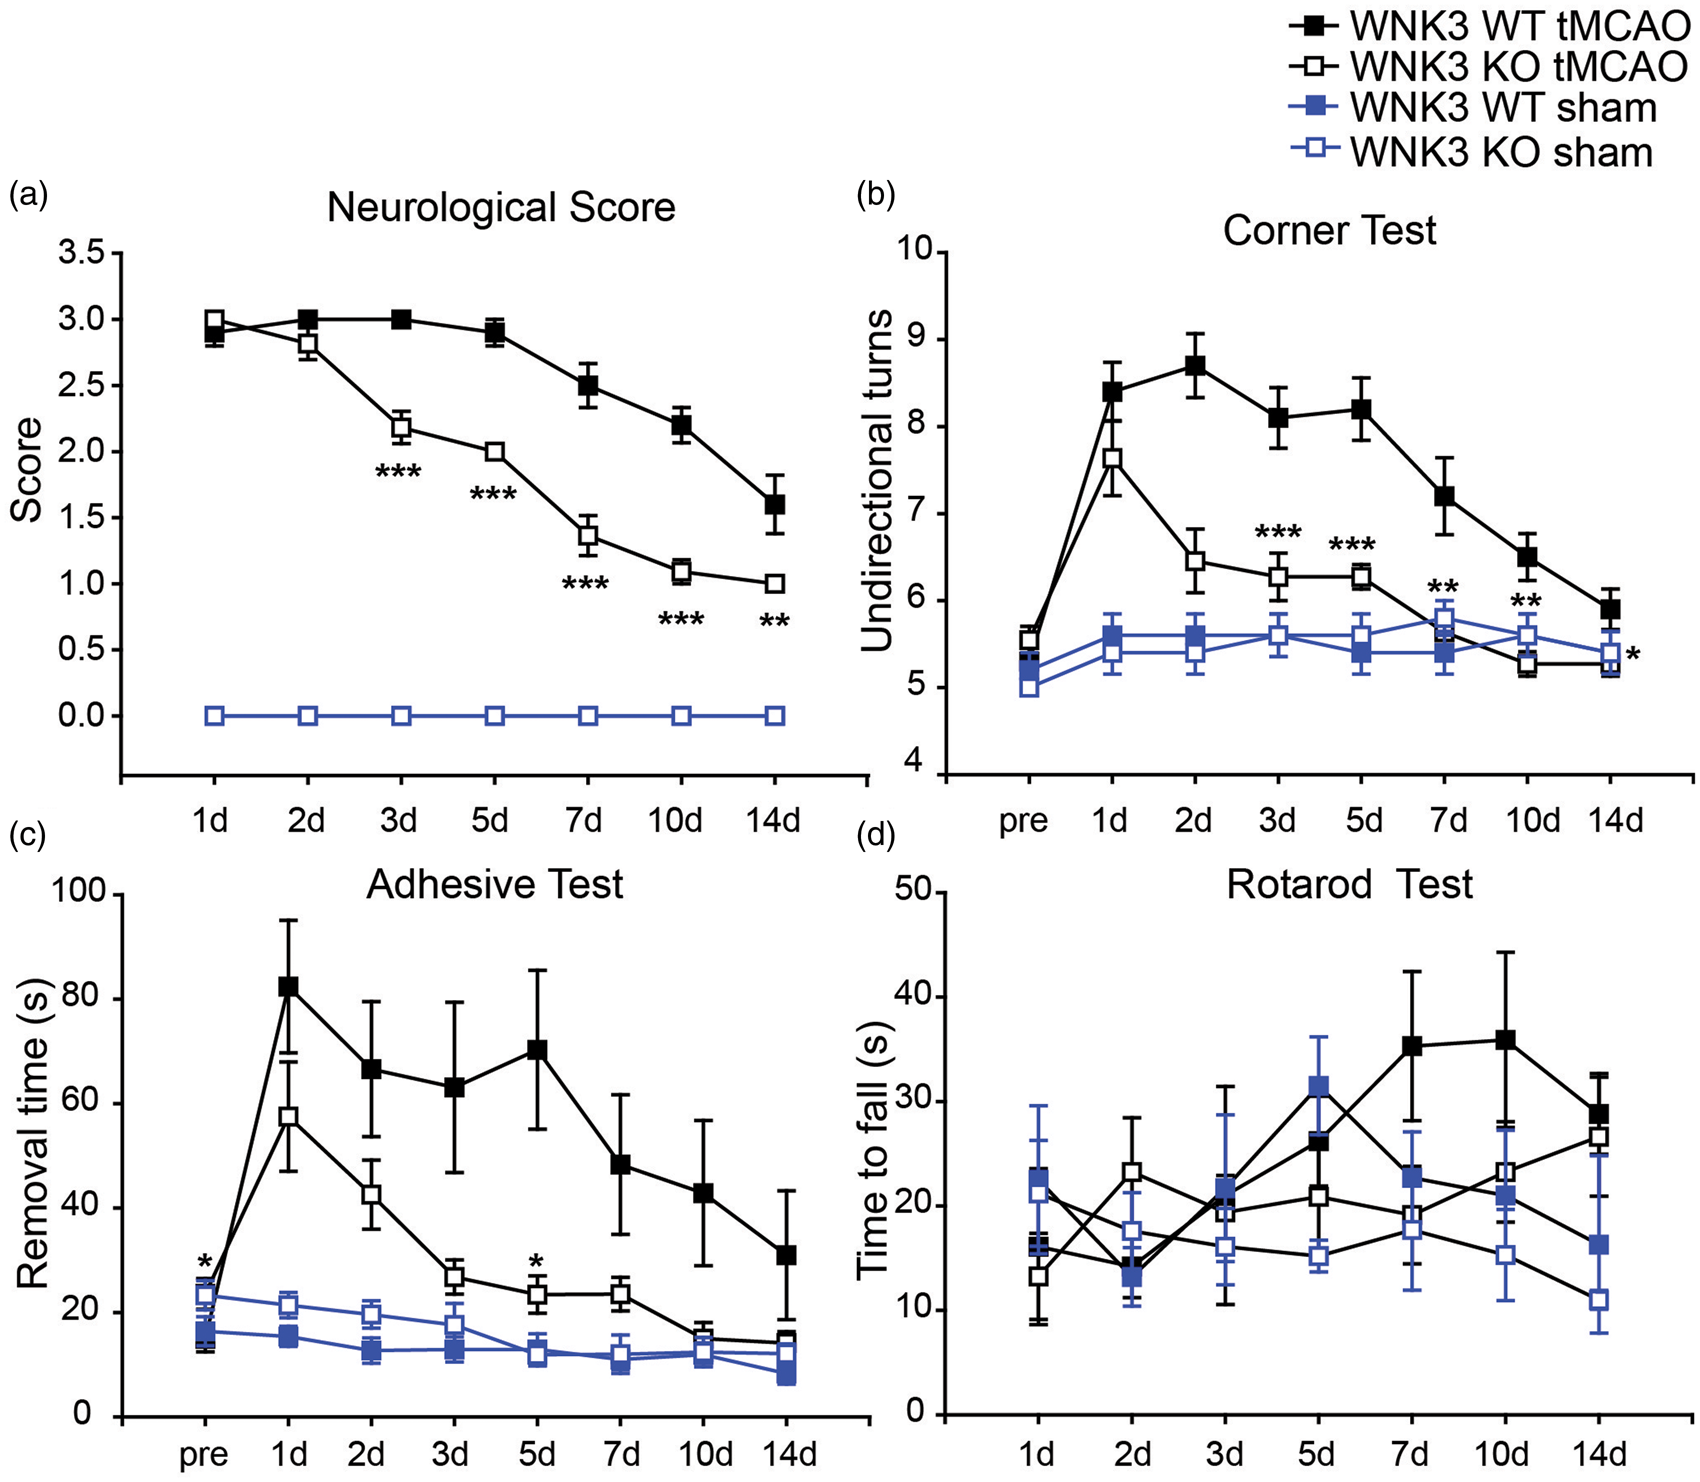
We conducted a panel of neurological behavioral tests to further assess sensorimotor function deficits in these mice (Figure 6(b)). Prior to tMCAO, WNK3 WT and WNK3 KO mice showed no behavioral asymmetries on the corner test and made approximately the same number of turns toward either side during the experimental period. However, after tMCAO, WNK3 WT mice exhibited a preference for unidirectional turns at days 1 to 5 post-tMCAO and recovered towards normal behavior by day 14. In contrast, the unidirectional side preference occurred less frequently in WNK3 KO mice throughout the test period (1–14 days after MCAO, Figure 6(b)).
In the initial adhesive removal test prior to tMCAO, WNK3 WT mice exhibited shorter removal time than WNK3 KO mice (15.0 ± 2.5 vs. 23.6 ± 2.9, p < 0.05, Figure 6(c)). After tMCAO, WNK3 WT mice required longer time to remove the right hand tape (Figure 6(c)), followed by a slow, progressive recovery. In contrast, WNK3 KO mice showed a faster trend in tape removal, reaching statistical significance by days 3 to 5 after tMCAO. WNK3 WT and WNK3 KO mice did not exhibit differences on contact time (Supplemental Figure 4). Lastly, WNK3 WT and KO mice both improved their performances over time on the rotarod test with the accelerating speed rate (Figure 6(d)), consistent with active motor learning in both WNK3 WT and WNK3 KO mice. Interestingly, WNK3 KO mice performed less well in the high-speed rotating drum test than WNK3 WT mice (Supplemental Figure 4).
We also conducted control studies in sham-operated WNK3 WT and WNK3 KO mice in four neurological behavioral tests. No significant differences were observed between sham-operated WNK3 WT and WNK3 KO mice for the neurological score test, the corner test, or the adhesive contact test (Figure 6). However, the performances of sham-operated WNK3 WT and KO mice differed on the rotarod test (steady fast speed), as shown in Supplemental Figure 4. The sham-operated WNK3 KO mice showed motor function deficits on the rotarod test, similar to those observed in WNK3 KO mice after tMCAO. These data suggest that the WNK3 signaling pathway plays an important role in regulation of sensory and motor functions. Further studies are warranted to elucidate the underlying mechanisms.
Improved neurological recovery in SPAK HET and SPAK KO mice after tMCAO
We assessed recovery of neurological function in SPAK WT, SPAK HET, and SPAK KO mice at 1–14 days after tMCAO. Both SPAK WT and SPAK HET mice displayed severe neurological deficits with little recovery from day 1 to 14 after tMCAO, whereas SPAK KO mice despite presenting initial functional neurological deficits of equivalent severity, showed significant improvement over the same period (Figure 7(a)). In the corner test, mice of all three SPAK genotypes exhibited symmetric turns prior to ischemic stroke (Figure 7(b)). After tMCAO, SPAK WT mice showed a significant propensity for unidirectional turns after tMCAO, with a slow recovery (Figure 7(b)). SPAK KO mice, however, exhibited less preference in the unidirectional turns and faster recovery than SPAK WT mice (Figure 7(b)). Corner test behavior for SPAK HET mice fell between those of SPAK WT and SPAK KO mice (Figure 7(b)).
Improved neurological function in SPAK HET and KO mice after ischemic stroke. (a) Neurological scores of SPAK WT, HET, and KO mice (means ± SEM); SPAK WT mice, n = 9 (7 female, 2 male); SPAK HET mice, n = 6 (5 female, 1 male); SPAK KO mice, n = 8 (3 female, 5 male). *p < 0.05, **p ≤ 0.01, ***p ≤ 0.001 for SPAK KO vs. SPAK WT or SPAK HET. (b) Corner test in SPAK WT, HET, and KO mice (others are same cohort as in (a) except that SPAK HET mice were n = 4 (4 female). Data are mean ± SEM. *p < 0.05. **p ≤ 0.01, ***p ≤ 0.001 for SPAK KO vs. SPAK WT or SPAK HET. (c) Removal time of adhesive test in SPAK WT, HET and KO mice (same cohort as in (a); mean ± SEM). *p < 0.05. **p ≤ 0.01, ***p ≤ 0.001 for SPAK KO vs. SPAK WT or SPAK HET. (d) Rotarod test with accelerating speed in SPAK WT, HET, and KO mice (same cohort as in (a)). Data are mean ± SEM.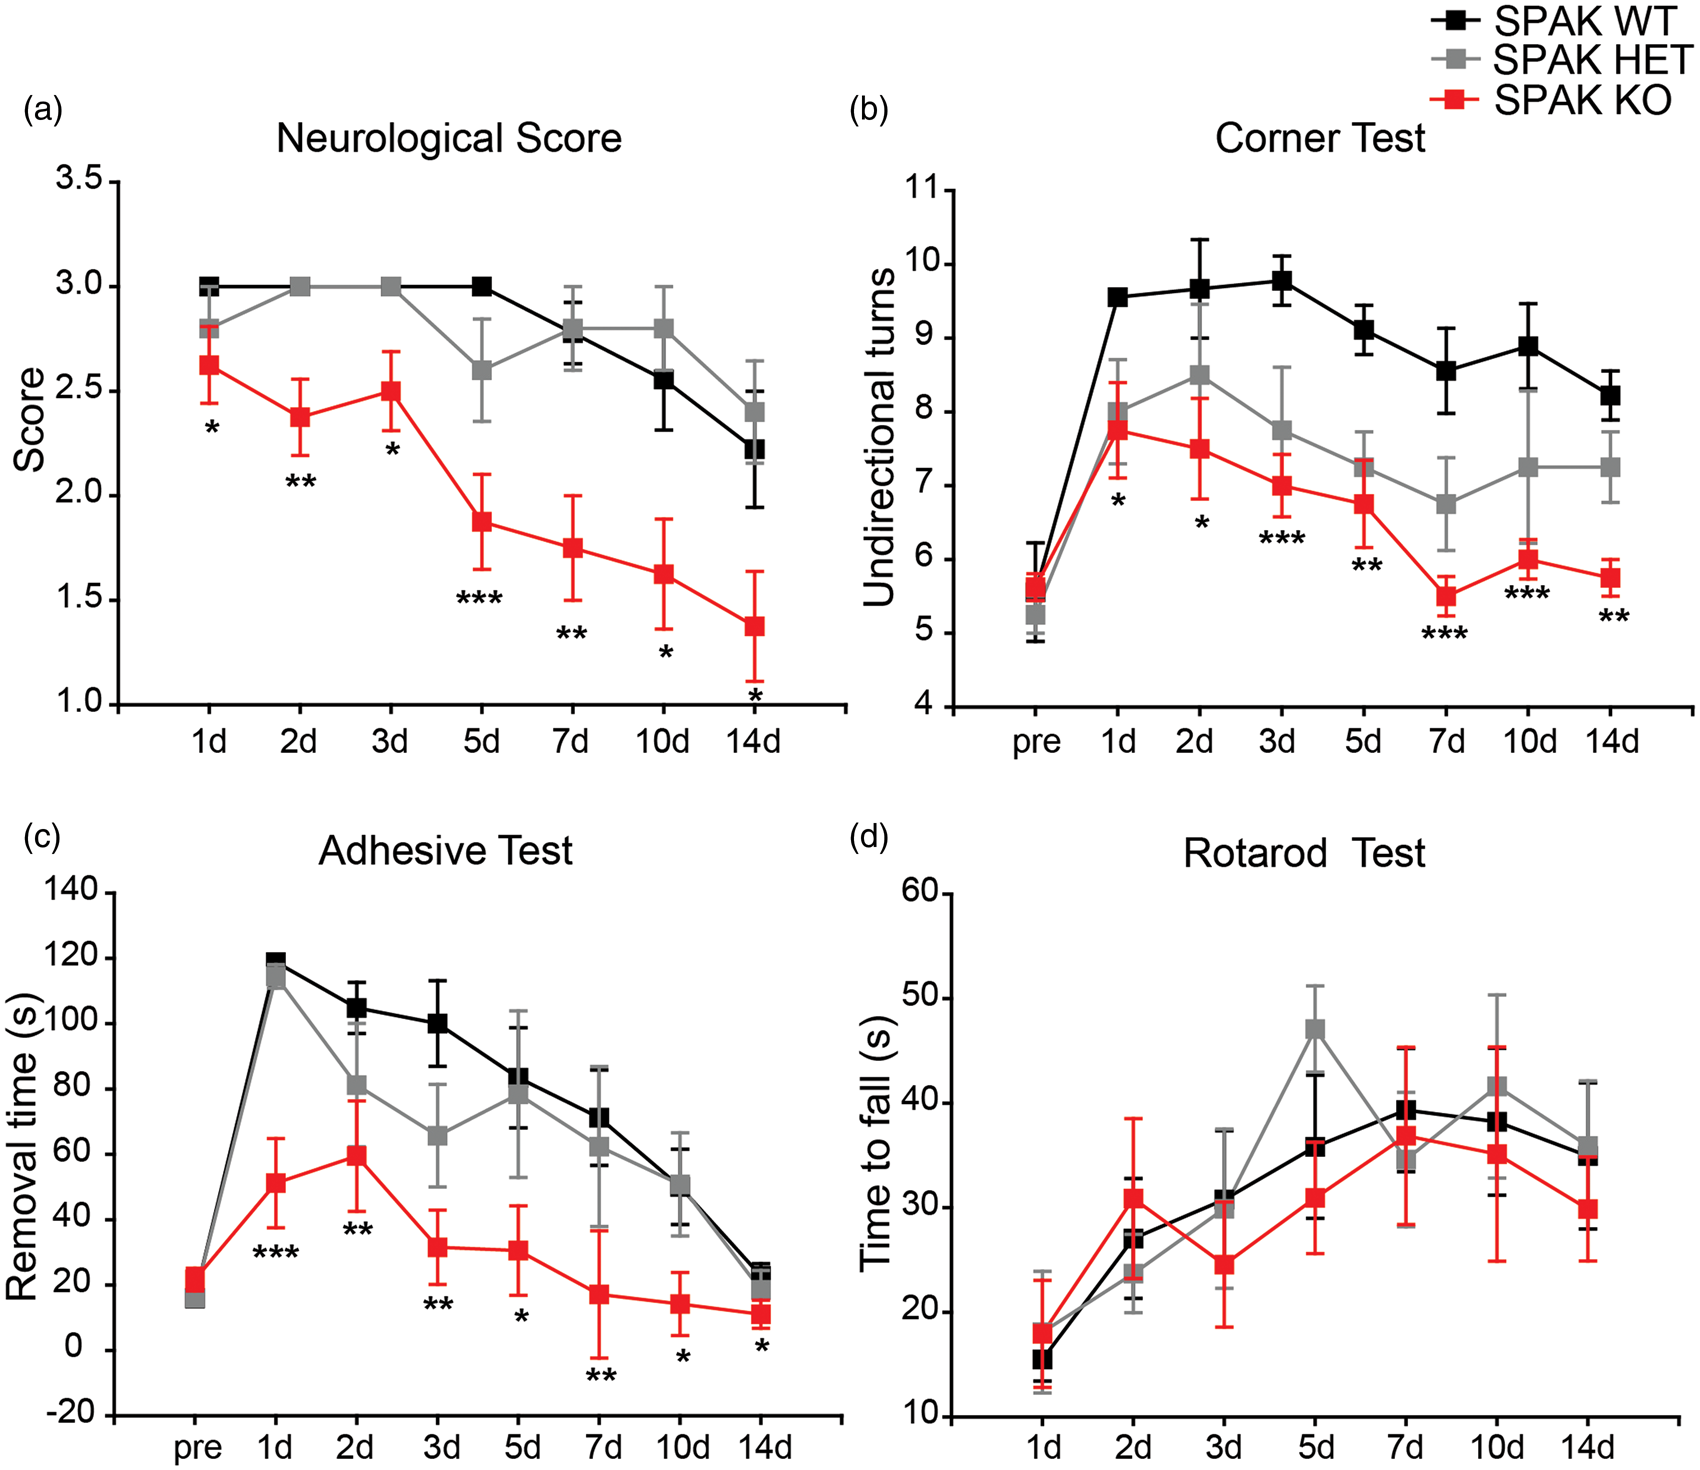
In the adhesive test, SPAK WT and SPAK HET mice exhibited difficulty in removing the tape within 120 s on day 1 after tMCAO, but SPAK KO mice were able to remove the tape, although more slowly than before ischemic injury (Figure 7(c)). All mice began to recover between days 2 and 14, but SPAK KO mice regained function most rapidly. SPAK KO mice also exhibited the shortest right hand contact time among the three genotypes (Supplemental Figure 2). However, the three genotypes did not differ in motor learning or in maintaining balance on the rotating drum (Figure 7(d), Supplemental Figure 5).
Discussion
The WNK3-SPAK signaling pathway in ischemic brain edema
Brain edema is a secondary complication of large hemispheric stroke with significant impact on patient morbidity and mortality. 25 A recent MRI study provided evidence for a positive correlation between cerebral swelling and poor neurological functional outcome in patients with moderate-size stroke. 3 However, current osmotic therapy protocols or surgical decompression by hemicraniectomy for malignant edema have not been shown to improve outcomes in patients after ischemic stroke. 25 Therefore, effective management of cerebral edema with novel therapies that target the molecular pathophysiology of the process may benefit stroke patients across the spectrum of stroke severity.
In the current study, we investigated roles of the WNK3-SPAK signaling pathway in ischemic edema formation and evaluated its potential as a novel target for anti-edema therapy using genetic models of these genes, coupled with MRI technology. At the peak of ischemic lesion formation three days after tMCAO, ADC maps revealed ∼30% to 40% hemispheric edema lesion volume in WNK3 WT or SPAK WT mice with DWI; in contrast, ADC lesion volume was significantly reduced in WNK3 KO, SPAK HET, and SPAK KO mice. The higher relative percentage of the hemispheric edema lesion resulted from a decrease in the CL hemispheric volume in the fixed ex-vivo brains calculated from MRI ADC maps (WNK3 WT, 147.68 ± 36.6 mm3; WNK3 KO 145.9 ± 20.6 mm3) compared to the unfixed brain values in the TTC staining experiments (WNK3 WT, 204.1 ± 8.9 mm3; WNK3 KO 190.8 ± 3.8 mm3). Therefore, the fixed ex-vivo brain volumes are significantly reduced. Similar brain volume changes were detected in the fixed SPAK ex-vivo brains. Taken together, these findings strongly suggest that the WNK3-SPAK signaling pathway contributes to the pathogenesis of ischemic brain edema.
The WNK kinase family and its key downstream substrate SPAK regulate renal ion transport by altering the net phosphorylation state of transporters and channels in the nephron to regulate renal NaCl and K+ handling, and blood pressure homeostasis.8–10 We recently demonstrated that focal cerebral ischemia stimulated phorphorylation of three key proteins (p-SPAK, p-OSR1, p-NKCC1) in neurons and oligodendrocytes, 13 and inhibition of the WNK-SPAK signaling pathway in cell culture with small interfering RNA or transgenic knockout of WNK3 in intact mice protected against cell death in neurons and oligodendrocyte precursur cells. 13 Together with the new MRI findings of the current study, these data suggest that activation of WNK3-SPAK signaling in the setting of cerebral ischemia contributes to post-ischemic damage of both gray and white matter.
The WNK3-SPAK complex is an important regulator of NKCC1. Our lab and others have documented that ischemic activation of NKCC1 protein causes intracellular Na+ and Cl− overload in astrocytes and neurons.4,26,27 Either pharmacological inhibition or genetic ablation of NKCC1 significantly reduced ischemic cell death in vivo and in in vitro ischemic models.4,26,27 Although the reduction in ischemic brain injury in WNK3 KO and SPAK KO mice may be largely attributable to inhibition of the WNK3-SPAK-NKCC1 cascade, increased Cl− efflux via K-Cl cotransporter (KCC) proteins may also play a role. Yang et al. 28 have detected increased basal KCC2 protein expression and decreased ratios of NKCC1/KCC2 in SPAK KO brains. Further examinations of alterations of NKCC1 and KCC in ischemic WNK3 KO and SPAK KO brains are warranted in future studies. The efficacy of recently identified inhibitors of the WNK-SPAK/OSR1 complex29,30 in reducing ischemic brain edema and injury should also be evaluated. These will be rich topics of future investigation.
The WNK3-SPAK signaling pathway in ischemic white matter injury
In the current study, DTI imaging showed a reduction in FA of the IL external capsule, accompanied by loss of mature oligodendrocytes and demyelination. WNK3 KO, SPAK HET, and SPAK KO mice exhibited reduced demyelination as shown by both DTI and immunostaining. Moreover, changes in FA correlated positively with APC+ oligodendrocyte numbers and MBP expression in the IL EC of ischemic brains. Future studies should determine whether WNK3-SPAK inhibition-mediated neuroprotection occurs through reducing cell death of immature and mature oligodendrocytes or by altering oligodendrocyte differentiation and maturation.
Improved neurological functional recovery in WNK3 KO and SPAK KO mice during the sub-acute post ischemic stroke period
Neurological score assessment, the corner test, and the adhesive tape removal test consistently detected neurological deficits in WNK3 KO mice, SPAK HET, and SPAK KO mice that were less severe than in WT mice. These results are consistent with smaller infarction size and DTI lesions at early times post-reperfusion in these mutant mice. The data suggest that inhibition of the WNK/SPAK complex not only provides acute protection of neurons and oligodendrocytes after tMCAO, but also facilitates faster neurological functional recovery in the sub-acute post-stroke period.
Neither WNK3 KO nor SPAK KO mice subjected to ischemic stroke in our study showed greater improvement in the rotarod test of motor function than comparably treated WT mice. In contrast, WNK3 KO mice (in either sham or ischemic stroke groups) performed less well on the rotarod at steady high speed than WNK3 WT mice (Supplemental Figure 4), consistent with previously reported locomotor deficits in SPAK KO mice. 31 Higher nociceptive threshold, superior sensorimotor gating and novelty exploration, and increased anxiety-like phenotypes were detected in SPAK KO mice.31,32 Geng et al. 31 reported a worse performance for SPAK KO mice in the rotarod test under basal conditions.
Our study reveals for the first time about motor function deficits in sham-operated WNK3 KO mice, in contrast to the grossly normal clinical phenotypes previously reported in two different WNK3−/− mouse lines.33,34 However, the mechanisms underlying differential recovery of sensory and motor functions after ischemic stroke in WNK3 KO and SPAK KO mice are not apparent. We postulate that global deletion of WNK3 or SPAK may dysregulate excitatory and inhibitory transmission in the peripheral and/or central nervous system, with consequent effects on locomotor function, likely independent (at least in part) of the ischemic lesion. Taken together, these neurological findings suggest complex roles for the WNK3/SPAK signaling pathway in regulation of sensory and motor functions that merit further study. Improved understanding of the functions of the WNK3/SPAK signaling pathway in the nervous system will be essential to their development as therapeutic targets for treatment of disease.
Footnotes
Funding
The author(s) disclosed receipt of the following financial support for the research, authorship, and/or publication of this article: The study was supported by National Institute of Health Grants R01 NS038118 (to DS and TKH) and NS075995 (to DS). KTK was supported by the Manton Center for Orphan Disease Research (Harvard University and Boston Children’s Hospital) and the Harvard-MIT Basic Neuroscience Award.
Acknowledgements
We are grateful to Dr. FC Yeh (Department of Psychology, Carnegie Mellon University) for his assistance in MRI data analysis.
Declaration of conflicting interests
The author(s) declared no potential conflicts of interest with respect to the research, authorship, and/or publication of this article.
Authors’ contributions
HZ, XG, and SW performed surgery procedures and data analysis. RN conducted and quantified immunofluorescent staining studies. XG, LMF and TKH conducted MRI data collection and quantification. GB, WZ, VMP, and LMF managed transgenic colonies. HZ performed animal behavioral tests. KTK, SSY, SHL, SLA, SSH, ZZ, and DS designed the experiments. RN, KTK, SLA, and DS completed the manuscript writing.
References
Supplementary Material
Please find the following supplemental material available below.
For Open Access articles published under a Creative Commons License, all supplemental material carries the same license as the article it is associated with.
For non-Open Access articles published, all supplemental material carries a non-exclusive license, and permission requests for re-use of supplemental material or any part of supplemental material shall be sent directly to the copyright owner as specified in the copyright notice associated with the article.