
Abstract
Antiantiogenic therapy with bevacizumab in recurrent glioblastoma is currently understood to both reduce microvascular density and to prune abnormal tumor microvessels. Microvascular pruning and the resulting vascular normalization are hypothesized to reduce tumor hypoxia and increase supply of systemic therapy to the tumor; however, the underlying pathophysiological changes and their timing after treatment initiation remain controversial. Here, we use a novel dynamic susceptibility contrast MRI-based method, which allows simultaneous assessment of tumor net oxygenation changes reflected by the tumor metabolic rate of oxygen and vascular normalization represented by the capillary transit time heterogeneity. We find that capillary transit time heterogeneity, and hence the oxygen extraction fraction combine with the tumoral blood flow (cerebral blood flow) in such a way that the overall tumor oxygenation appears to be worsened despite vascular normalization. Accordingly, hazards for both progression and death are found elevated in patients with a greater reduction of tumor metabolic rate of oxygen in response to bevacizumab and patients with higher intratumoral tumor metabolic rate of oxygen at baseline. This implies that tumors with a higher degree of angiogenesis prior to bevacizumab-treatment retain a higher level of angiogenesis during therapy despite a greater antiangiogenic effect of bevacizumab, hinting at evasive mechanisms limiting bevacizumab efficacy in that a reversal of their biological behavior and relative prognosis does not occur.
Introduction
Currently, the internationally most commonly used salvage therapy for recurrent glioblastoma (rGB) consists of antiangiogenic monotherapy with bevacizumab (BEV), a humanized monoclonal antibody to vascular endothelial growth factor A (VEGF-A). Glioblastoma (GB) secures oxygen and nutrient supply by stimulating neoangiogenesis1,2; and the extent of vessel formation is an indirect marker of aggressiveness, high malignancy, and proliferative potential. Accordingly, we have previously used non-invasive dynamic susceptibility-weighted contrast-enhanced MRI (DSC-MRI) to demonstrate that (a) high pretreatment cerebral blood flow (CBF) and cerebral blood volume (CBV) predict poor BEV efficacy, 3 and that (b) patients with a higher degree of angiogenesis prior to BEV-treatment show a greater antiangiogenic effect in response to BEV, which also negatively impacts treatment outcome. 4 These treatment-related effects may in part be explained by intratumoral hypoxia resulting from BEV-induced vessel pruning and subsequent activation of compensatory survival pathways that would be expected to negatively impact BEV response by negating any early transient benefits attributable to reductions in vascular permeability and contrast enhancing tumor. 3 Indeed, the effects of antiangiogenic agents on tumor oxygenation status remain controversial, with evidence supporting either vascular regression, which is associated with increased intratumoral hypoxia,5,6 or a so-called “normalization” of the tumor vasculature, resulting in improved tumor oxygenation and cytotoxic chemotherapy sensitivity.7–9
The tumor microcirculation is characterized by abnormal capillary bed topology, elevated edema pressure, and microthromboses, all of which give rise to shunting of oxygenated blood through the tissue. 10 The resulting reduction in oxygen extraction efficacy is not accounted for by the classical flow-diffusion equation, 11 which we normally use to assess tissue oxygenation based on CBF and CBV. This equation was recently extended to describe the effects of capillary flow patterns on brain oxygenation, introducing capillary transit time heterogeneity (CTH) as an index to account for the distribution of microvascular flow patterns. 12 The extended flow-diffusion equation can account for parallel changes in microvascular volume and microvascular shunting during antiangiogenic therapy, 13 and recently, it became possible to estimate CTH and its effects on tissue oxygenation based on standard clinical DSC-MRI raw data. 14
In this study, we use this new method to determine CTH and indices of tumor oxygenation from DSC-MRI data in 71 patients before and during antiangiogenic therapy with BEV, to assess how BEV affects tumor oxygenation and whether patients with improved tumor oxygenation show improved response to therapy. To assess BEV-induced changes, we used Gaussian-normalized parametric response mapping (PRM), an innovative approach for longitudinal quantification of parametric alterations on a voxel-by-voxel basis.4,15
Material and methods
All investigations were conducted according to the principles expressed in the Declaration of Helsinki. Retrospective data evaluation was approved by the local ethics committee of the University of Heidelberg (ethics approval number: S-320/2012) and informed consent was waived. Of all MRI examinations performed at our institution in the inclusion period between July 2009 and January 2014, a total of 78 consecutive patients with primary GB were identified who met the following criteria: (a) pathologically confirmed GB with recurrence, (b) patients regularly treated for GB recurrence with BEV monotherapy (Avastin, Roche; 10 mg/kg of body weight) every 2 weeks, (c) availability of conventional-anatomic MRI and DSC-MRI at baseline prior to BEV treatment and at first follow-up after treatment initiation. Patients were excluded from this study if (a) a repeat surgery was performed prior to BEV treatment initiation, resulting in immeasurable contrast-enhancement at baseline (n = 2), or if surgery occurred between baseline and follow-up scan (n = 1), or if (b) the MRI data were of insufficient quality due to motion artifacts or poor contrast injection (n = 4). In total, 71 rGB patients receiving BEV were included in this study. The population of the present study has already served as a (sub)population of two recent studies from our institution3,4 and has not been part of any interventional clinical trial.
Baseline epidemiological and clinical characteristics including time to first follow-up and timing between treatment and imaging examinations are shown in Supplementary Table 1. Assessment of response to BEV-treatment was performed according to the Response Assessment in Neurooncology (RANO) working group criteria.3,16 At the time of last assessment (April, 2015) 97% of patients (69/71) showed tumor progression and 83% of patients (59/71) have died.
MR imaging
Images were acquired using a 3 Tesla MR system (Magnetom Verio/Trio TIM, Siemens Healthcare, Erlangen, Germany) with a 12-channel head-matrix coil. Prior to dynamic imaging, pre-contrast T1-weighted 3D magnetization-prepared rapid acquisition gradient echo (MPRAGE) images were acquired (cT1; TI = 1100 ms, TE = 4 ms, TR = 1710 ms, and FA = 15°). DSC-MRI was performed as described previously. 17 Briefly, before dynamic imaging, a 0.1 mmol/kg prebolus dose of gadoterate meglumine (Gd-DOTA, DOTAREM, Guerbet, France) was administered to diminish any T1 effects from contrast agent extravasation. DSC-MRI was performed with a T2*-weighted gradient-echo EPI sequence during the bolus injection of a standard dose (0.1 mmol/kg) of intravenous gadoterate meglumine. Twenty-six to 28 slices with a thickness of 5 mm were acquired with fat suppression (TE = 36 ms, TR = 2220 ms, FA = 90°, field of view = 240 × 240 mm, image matrix = 128 × 128 pixels). In total, 50 to 75 dynamic image volumes were acquired. Then, post-contrast T1-weighted 3D MPRAGE (identical sequence parameters as the pre-contrast sequence) and fluid attenuated inversion recovery (FLAIR; TI = 2400 ms; TE = 85 ms; TR = 8500 ms; section thickness, 5 mm; interslice gap, 5%) images were acquired.
Image post-processing and analysis
Post-processing of DSC-MRI data was performed with a custom developed software package in Matlab (Mathworks, Natick, MA, USA), which implements DSC-MRI analysis for CTH estimation using the extended flow-diffusion equation.
12
In short, the probability density function of capillary transit times h(t) is modeled by a gamma variate distribution with parameters α and β, according to:
We note that the resulting tumor oxygenation, TMRO2 represents oxygen availability under our reference conditions rather than actual tumor oxygen metabolism. If “true” local tumor oxygen utilization exceeds TMRO2, “true” OEF is higher than the estimate above, and tumor tissue therefore hypoxic relative to normal brain tissue.
The arterial-input function (AIF) was determined semiautomatically by preselecting candidate voxels using cluster analysis and a tracer arrival timing-insensitive method.
21
Data were leakage corrected using a gamma variate fit to the measured R2* curve.
14
Baseline and follow-up images were subsequently co-registered using the FMRIB software library (FSL, http://fsl.fmrib.ox.ac.uk/fsl/fslwiki/FSL), as described previously.
4
Briefly, after brain extraction (using FSL BET),
22
CTH-derived parametric maps were registered to the brain extracted T1 volume using the linear image registration tool (FLIRT)23,24 with a mutual information algorithm and a 12-degree of freedom transformation. Tumor segmentations were generated as previously described.
4
Briefly, tumor segmentation was performed semi-automatically using a region-growing segmentation algorithm implemented in ITK-SNAP software (www.itksnap.org).
25
After initial (possibly multiple) manual seed point definition, the voxel neighborhood of each seed point is repeatedly grown three dimensionally for a user-determined number of iterations until satisfactory segmentation is achieved, optionally followed by manual correction of the segmentation result. Subsequently, tumor segmentations were transformed into the Montreal Neurological Institute (MNI) space
26
along with the CTH-derived parametric maps, by first applying a linear 12-degree of freedom transformation (FLIRT), followed by non-linear image registration (FNIRT).
27
Finally, to further reduce remaining small intraindividual misregistrations, follow-up volumes were co-registered to corresponding baseline volumes using a second non-linear (FNIRT) transformation. Subsequent VOI-analyses were performed using customized in-house software implemented in Matlab (Natick, MA). Both, VOI descriptive statistics for baseline and follow-up examinations, and Gaussian normalized PRM were calculated using an established approach.4,28 Briefly, Gaussian normalization of TMRO2, OEF, and CTH maps was performed as suggested by Ellingson et al. with voxelwise division of the corresponding map through the standard deviation of the normal appearing brain volume (derived from the inverted FLAIR-based tumor segmentations).
28
In the following and in the figures and tables, TMRO2, OEF, and CTH are given as unitless Gaussian normalized values. PRM analyzes parameter changes between baseline and first follow-up, counting voxels as increased [PRM(+)] or decreased [PRM(−)], respectively, if they exceed the 95% confidence interval threshold of a comparative parameter measurement in normal-appearing brain. The number nPRM(±) of voxels classified as either PRM(+) or PRM(−) was expressed in terms of all tumor voxels ntumor, as a fraction [%PRM(+), and %PRM(−), respectively], according to:
Statistical analysis
Statistical analysis was performed using STATA version 12 (STATA Corp., Texas, USA). A Wilcoxon matched-pairs signed-rank test was used to compare the difference between measured parameters (TMRO2, OEF, and CTH) at baseline and follow-up. Survival was calculated from BEV treatment initiation until death or last follow-up. Similarly, time to progression was calculated from BEV treatment initiation until tumor progression. Univariate cox-regression analysis was used to assess the influence of TMRO2, OEF, and CTH (including assessment of the initial and residual values at baseline and at first follow-up, as well as the alteration between baseline and follow-up with %PRM(−) and %PRM(+)) on progression-free survival (PFS) and overall survival (OS) rates. Kaplan–Meier estimates and the log-rank test were performed for assessment and comparison of PFS and OS rates. Linear regression analysis was used to evaluate the association of (a) CBF and OEF on TMRO2 and (b) the influence of the parameters at baseline (TMRO2, OEF, and CTH) on %PRM(−). P-values < 0.05 were considered significant. MTT and CTH values are usually strongly correlated in healthy brain tissue. From prior studies in patients with newly diagnosed GB, it is known that this relationship is altered, resulting in elevation of the coefficient of variation (COV), calculated as the CTH/MTT ratio. 29 To examine whether this is also the case in our rGB cohort, we used the coefficient of determination R2 between MTT and CTH. In addition, to examine how changes in TMRO2 are related to changes in oxygen extraction and blood flow, the significance and degree of correlation between TMRO2 and OEF and between TMRO2 and CBF were examined using coefficient of determination R2.
Results
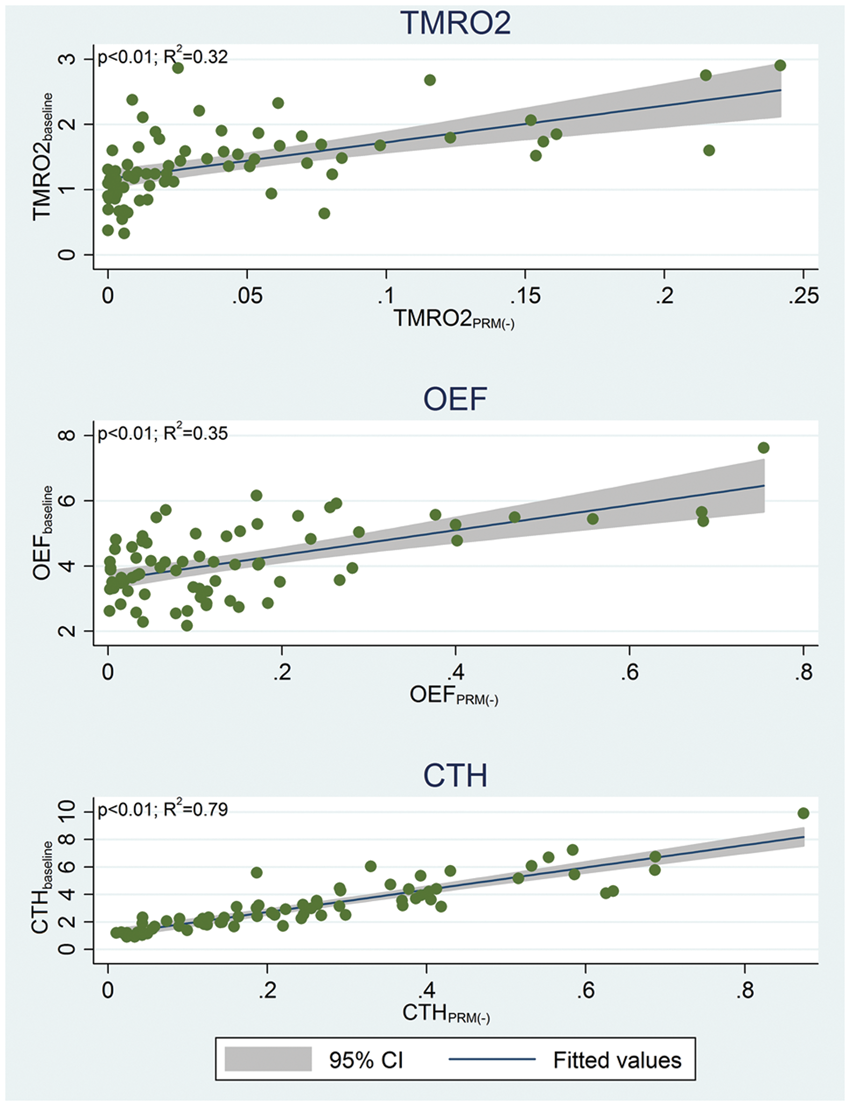
Median TMRO2, CTH, and OEF values at baseline were 1.36 (interquartile range (IQR), 1.04–1.69), 2.66 (IQR, 1.84–4.25), and 4.04 (IQR, 3.31–4.92) (Figure 1). Following BEV treatment initiation, TMRO2 and CTH showed a significant reduction to a median of 1.09 (IQR, 0.84–1.64) and 1.85 (IQR, 1.28–2.53) (p < 0.01, respectively), whereas OEF remained unchanged at a median of 3.99 (IQR, 3.22–5.05) (p = 0.89) (Figure 1). Linear regression analysis revealed that the parametric reduction [%PRM(−)] for TMRO2, CTH, and OEF was a function of the corresponding baseline value, with greater reduction for higher baseline values (p < 0.01, respectively) (Figure 2).
Dotplot of average intratumoral TMRO2, OEF, and CTH values at baseline and first follow-up after bevacizumab treatment initiation. The yellow crossed line represents the median center for each parameter (green and red lines represent the corresponding upper and lower quartiles). A Wilcoxon matched-pairs signed-ranks test identified a significant reduction between baseline and first follow-up for TMRO2 and CTH, however not for OEF (p-values are plotted in the upper-right corner). Parameters (TMRO2, OEF, and CTH) are given after Gaussian normalization (unitless). Linear regression of baseline average intratumoral TMRO2, OEF, and CTH with corresponding parametric decrease between baseline and follow-up %PRM(−) reveals a significant association for all parameters. Thereby higher baseline parameters increased the likelihood for a greater %PRM(−) in each case (p < 0.01, respectively). Parameters (TMRO2, OEF, and CTH) are given after Gaussian normalization (unitless). The coefficient of determination R2 and the significance level of the correlation are given in the top left corner of each diagram.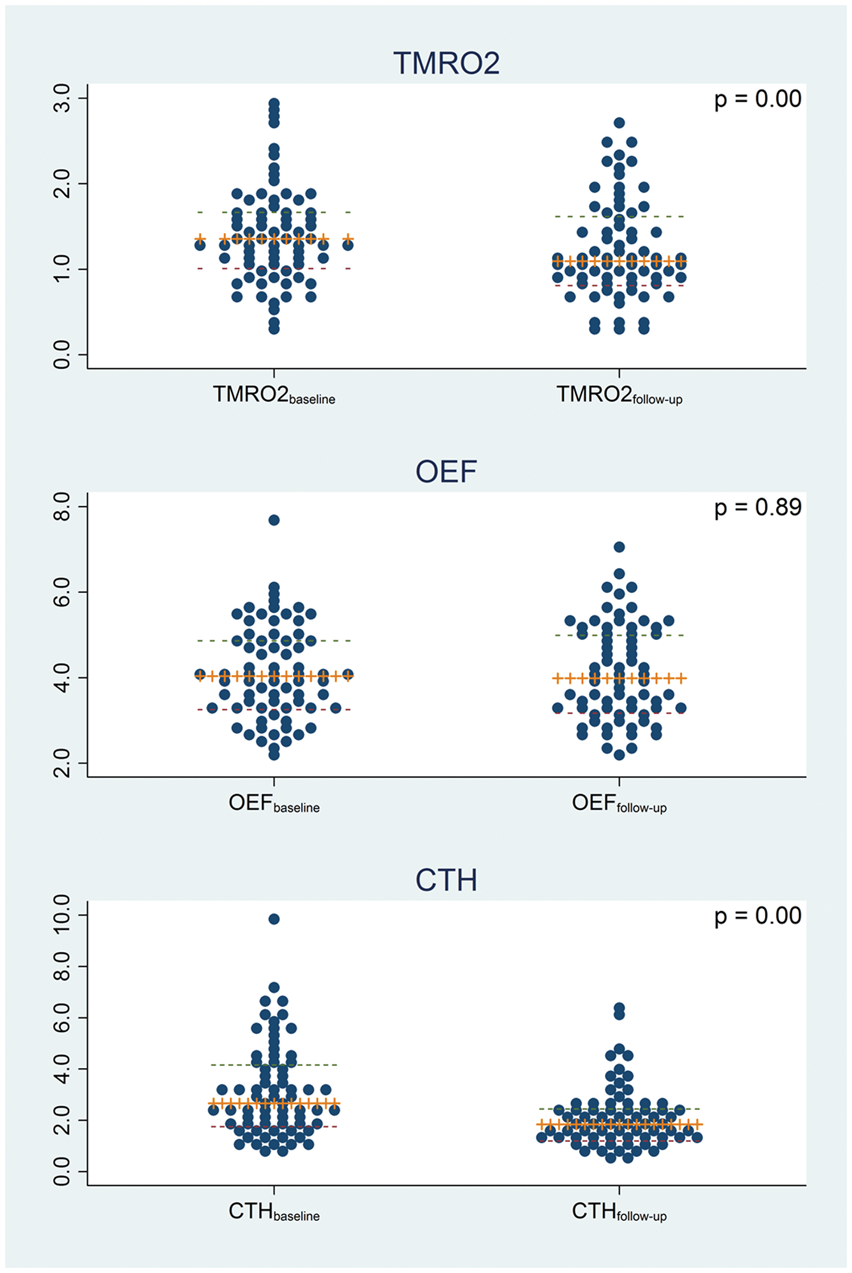
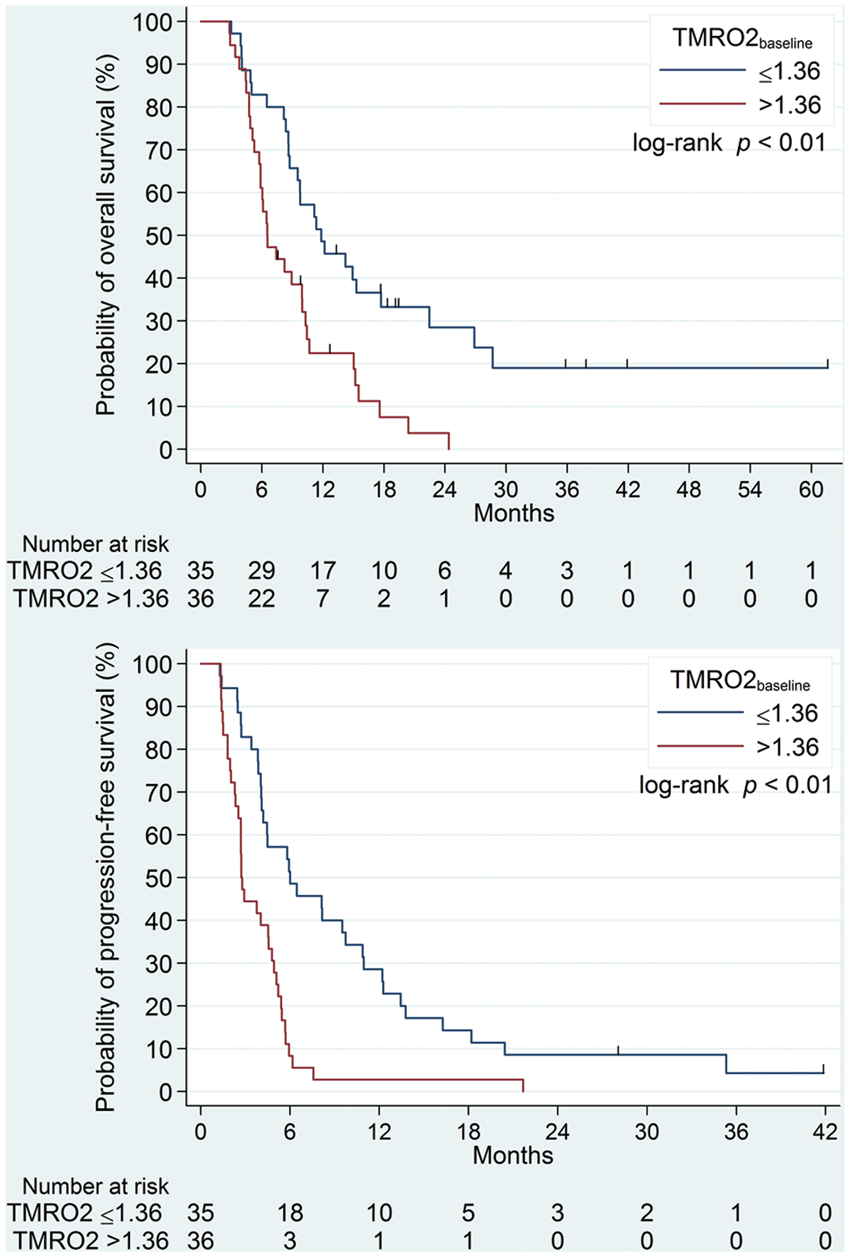
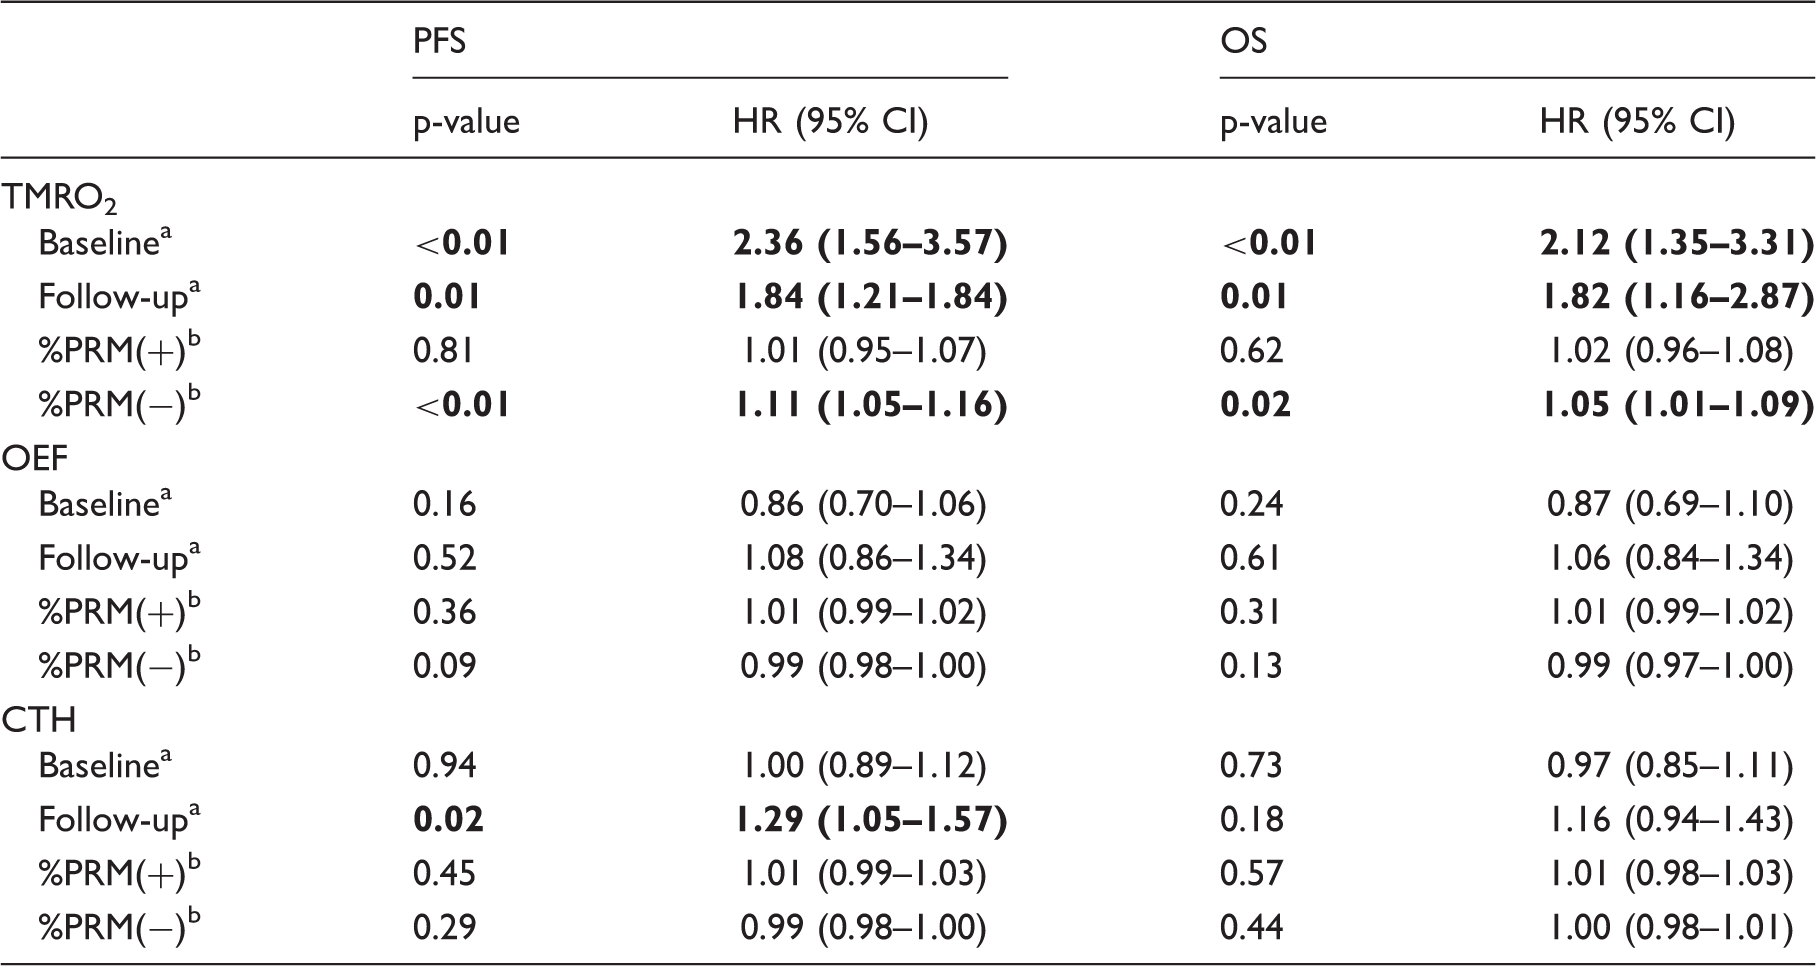
Univariate cox-regression analysis demonstrated a significant association of TMRO2 at baseline with PFS (hazard ratio (HR) = 2.36, p < 0.01) and OS (HR = 2.12, p < 0.01) (Figure 3, Table 1), whereas CTH and OEF at baseline were not related with treatment outcome (Table 1). Using a cut-off of 1.36 (i.e. the median TMRO2 at baseline), median OS and PFS rates for patients with baseline TMRO2 values of ≤ 1.36 were 11.3 and 6.0 months as compared with 6.6 and 2.7 months for patients with TMRO2 > 1.36 (p = 0.01, respectively) (Figure 4). Furthermore, the parametric reduction [%PRM(−)] was significantly associated with PFS and OS for TMRO2 (HR = 1.11, p < 0.01; HR = 1.05, p = 0.02), whereas there was no such association for CTH and OEF. The parametric increase [%PRM(+)] was not associated with treatment outcome for any of the evaluated parameters (Table 1).
Contrast-enhanced T1 (T1-C+) images, FLAIR images and Gaussian normalized TMRO2 maps of four representative patients with recurrent glioblastoma (A–D) at baseline prior to initiation of BEV treatment (upper row) and at first follow-up (middle row), with corresponding PRM for TMRO2. Univariate cox-regression demonstrated significantly increased hazards for shorter PFS and OS in patients with larger number of PRM(−) voxels (blue) (A,B: progression after 2.0 months for A and 1.5 months for B) as compared with patients with mostly stable PRM voxels (green) (C,D > progression after 35.3 months for C and 13.8 months for D). Kaplan–Meier plots for Gaussian normalized TMRO2 at baseline prior to bevacizumab treatment stratify both overall and progression-free survival (OS, upper panel; PFS, lower panel). Vertical lines in the graphs indicate censored events. Univariate cox-regression analysis for PFS and OS. Given HR corresponds to a one-unit increase. Given HR corresponds to a one-percent increase. CI: confidence interval; CTH: Gaussian normalized capillary transit time heterogeneity; HR: hazard ratio; OEF: Gaussian normalized oxygen extraction fraction; OS: overall survival; PFS: progression-free survival; TMRO2: Gaussian normalized tumor metabolic rate of oxygen; PRM: parametric response mapping. Bold values are statistically significant.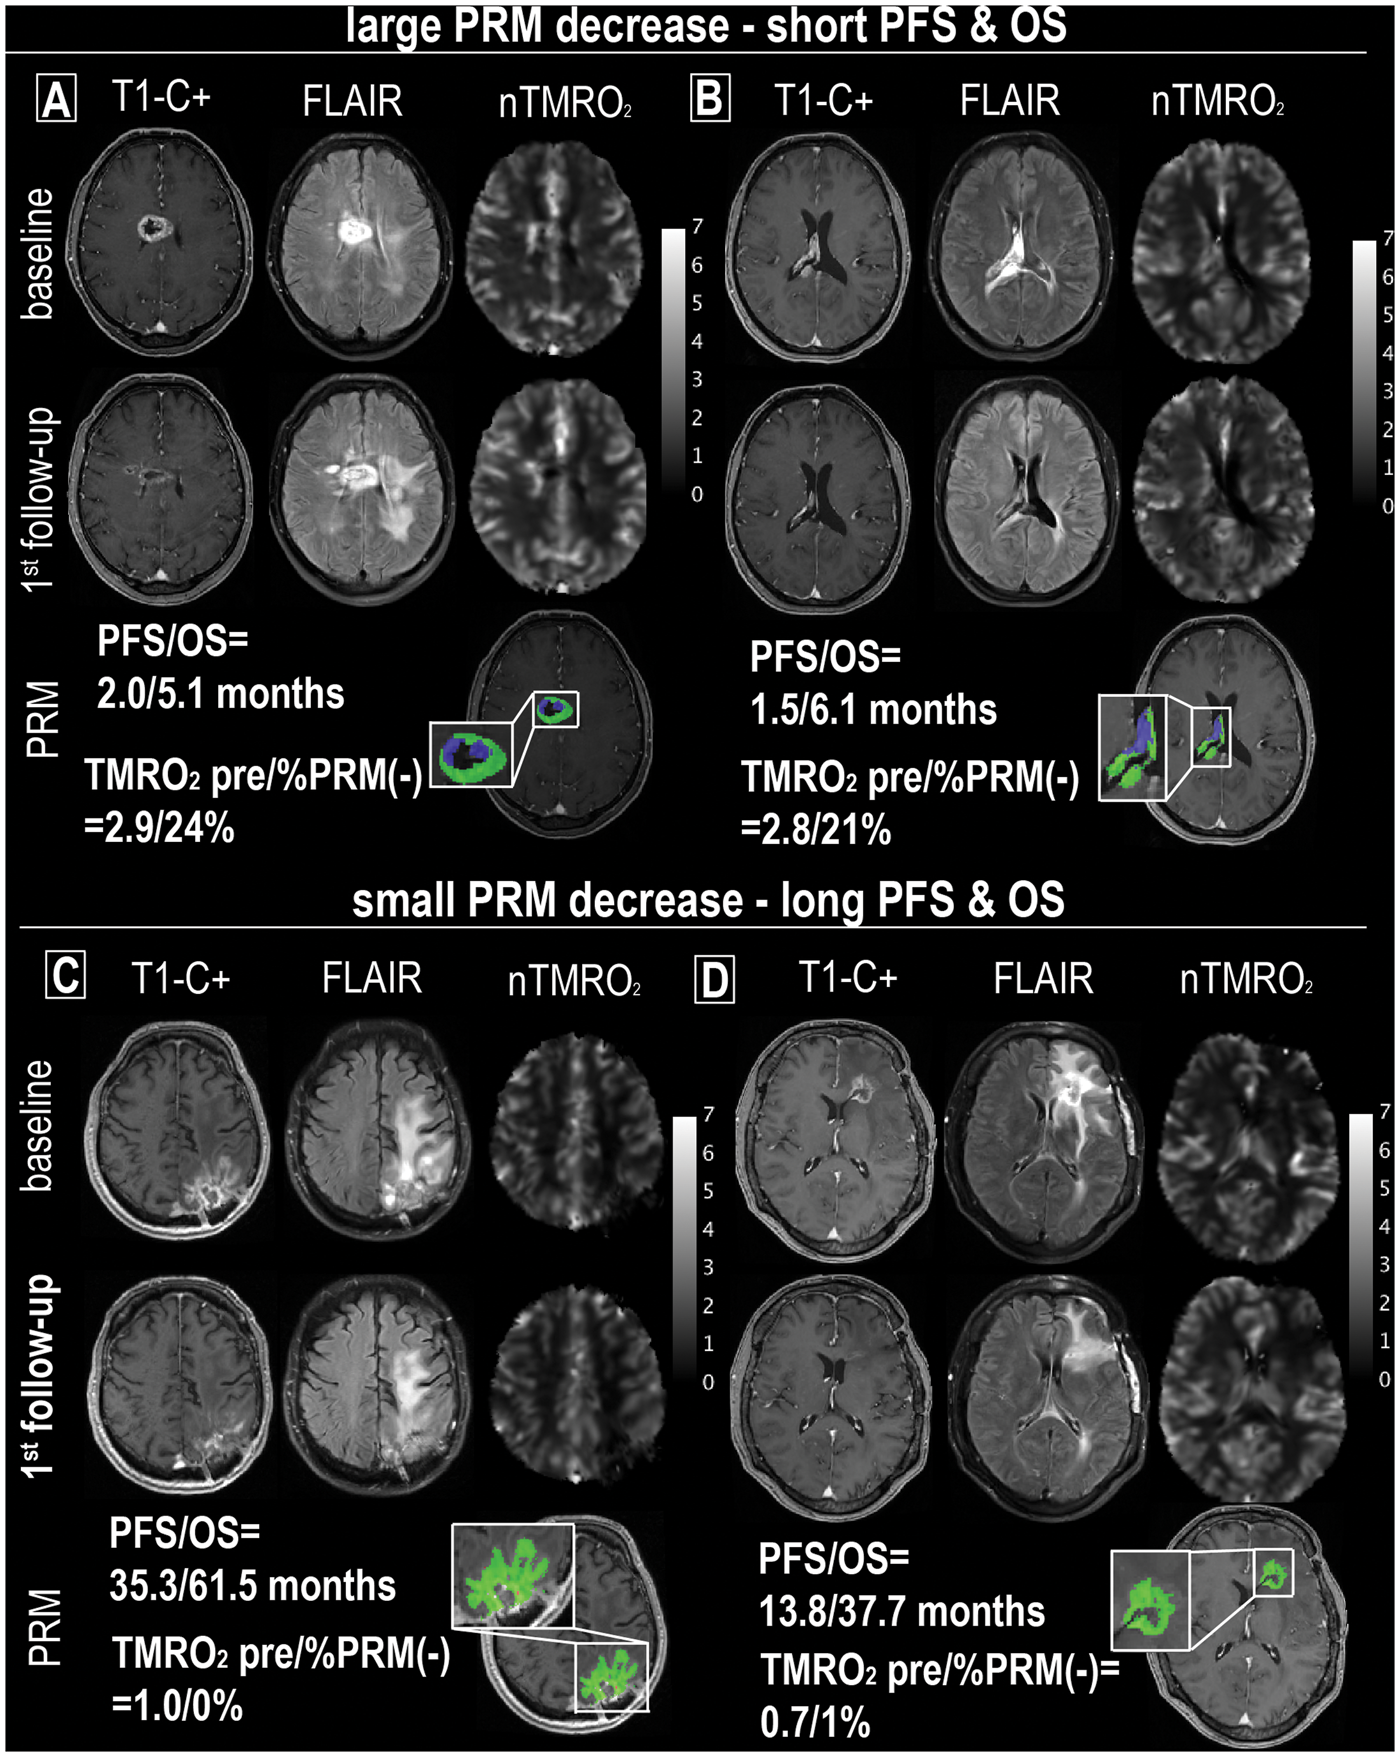
We found a significant positive correlation between MTT and CTH, in that 94% of the variation in MTT could be explained by CTH (R2 = 0.94, p < 0.01) (Figure 5). A significant correlation was also noted between TMRO2 and both OEF (negative correlation with R2 = 0.12, p < 0.01) and CBF (positive correlation with R2 = 0.64, p < 0.01) (Figure 6), whereas there was no correlation between TMRO2 and CTH (R2 = 0.02, p = 0.20; Supplementary Figure 1).
Linear regression analysis demonstrates a significant association between MTT and CTH values (p < 0.01). MTT and CTH are given after Gaussian normalization (unitless). Linear regression analysis shows a significant association of TMRO2 with both OEF and CBF (p < 0.01), however only 12% of the variation in TMRO2 is explained by OEF, whereas 64% of the variation in CMRO2 is explained by CBF. Parameters (TMRO2, OEF, and CTH) are given after Gaussian normalization (unitless).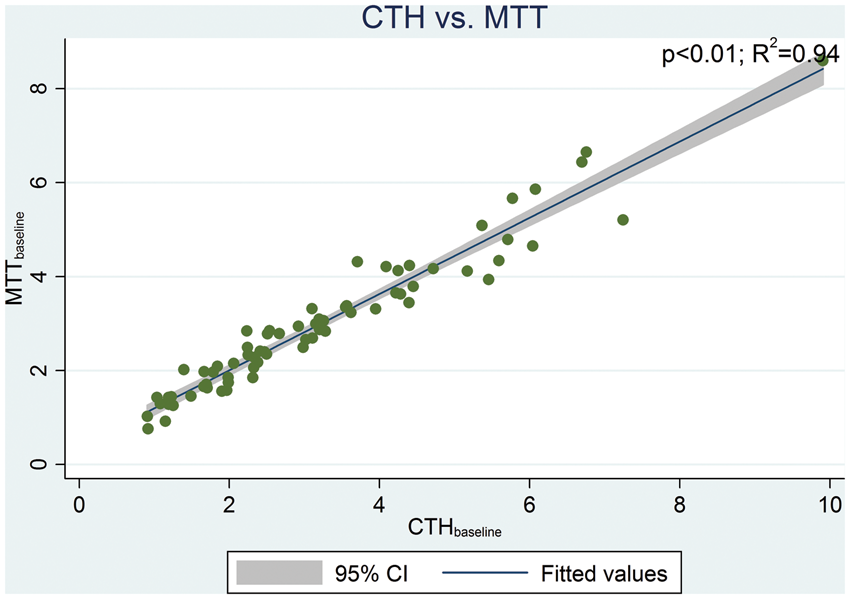

Discussion
Using a novel DSC-MRI based method to assess CTH and tumor oxygenation, we found that a larger %PRM(−) for TMRO2 increases the hazards for progression and death in rGB, indicating unfavorable therapeutic effects of BEV-induced hypoxia in the setting of tumor recurrence. In addition, the pretreatment TMRO2 was higher in tumors of patients with shorter OS and PFS, consistent with the notion that highly aggressive tumors recruit angioneogenesis to match their high metabolic demand. Importantly, we observed a decrease of CTH during therapy, indicative of microvascular pruning/vascular normalization. We did however not observe instances of improved TMRO2 as a result of vascular normalization, as previously reported in animal models of GB 13 and hypothesized to be prognostically advantageous in patients. It should be kept in mind, however, that our follow-up measurement 8 weeks after treatment initiation may be outside of the window during which vascular normalization may be expected to lead to improved tumor oxygenation, which is believed to occur from a few days until 4–5 weeks after BEV initiation, 7 and instead appears to already fall within the phase of microvascular rarefaction. Indeed, in the examined cohort, effects of microvascular rarefaction and hypoxia appear to outweigh the potentially beneficial influence of microvascular normalization. This interpretation is supported by our previous findings in the same patient group focused on examination of perfusion (CBV and CBF) 4 where we found that a larger %PRM(−) for CBV and CBF increased the hazards for progression and death in patients treated for rGB, with the magnitude of %PRM(−) being dependent on pretreatment parameters. Combining the prior hemodynamic results with metabolic assessment from this study, blood and oxygen supply to the examined tumors appear not overall improved but specifically tumors associated with worse outcome had larger decreases in CBF and TMRO2 and we find that CTH, and hence the OEF combines with the CBF in such a way that the overall tumor oxygenation appears to be worsened despite vascular normalization. The findings in this study provide additional insight into the underlying pathophysiology by demonstrating that changes in TMRO2 under BEV therapy are primarily determined by changes in CBF while OEF remains relatively unchanged. Conceptually, this may be important in that the rationale of antiangiogenic therapy focuses on normalization of the microvasculature, while largely disregarding that neurovascular coupling may alter CBF once the microcirculation is modified.
In our patient cohort, BEV-induced reductions in TMRO2 were more likely in patients with a higher baseline TMRO2, and TMRO2 remained elevated relative to less aggressive tumors even after BEV initiation. Our finding of increased pretreatment TMRO2 in more aggressive tumors shows that these tumors achieve a high level of oxygenation compared with less aggressive tumors, despite having a microvascular network architecture that is more chaotic and therefore presumably less effective in terms of oxygen delivery. This important finding supports that tumor oxygenation cannot be inferred from the degree of angiogenesis (i.e. CBV) or CBF alone, but requires the additional knowledge of oxygen extraction efficacy. 13 In the examined cohort of rGB, CTH analysis indeed suggests that angioneogenesis remains effective at maintaining oxygenation even in the highly aggressive tumors with pronounced recruitment of new vessel formation. This does not exclude that the effectiveness of oxygenation may further increase for a period of time after BEV initiation due to added effects of vascular normalization. The observation that tumor hypoxia during BEV treatment occurred predominantly in more aggressive tumors, and to a much smaller degree in less aggressive tumors, may be interpreted as either a treatment effect too small to improve survival (antiangiogenic effect not sufficient to change the biological behavior and relative prognosis) or intrinsic mechanisms that counteract the antiangiogenic effect and thus an unwanted side effect related to worsening tumor hypoxia. Hypoxic cancer cells may become more resistant to chemotherapy and radiation and increase their metastatic potential. 30 While larger treatment-related decline in TMRO2 was observed in tumors where pre-treatment oxygenation was already high, tumors with low baseline TMRO2 were associated with better treatment outcome and also displayed less tendency to develop reduced oxygenation and hypoxia after treatment initialization. MTT and CTH were strongly correlated in the tumors examined. Theoretically, MTT and CTH are closely correlated in passive, idealized microvascular networks, 31 and an earlier study showed deviations from this relation in primary GB according to tumor grade. 29 Our findings therefore indicate that the vascular network in treated and recurrent GB may be different from that of primary GB, as suggested by the observation of microvascular rarefaction after standard first-line therapy with temozolomide. 32
We found that OEF was negatively correlated with TMRO2. This is supportive of topological models which assume that oxygen extraction becomes less efficient as microvascular topology becomes more chaotic with more extensive angiogenesis. Importantly, this effect can be counterbalanced by an increase in CBF, causing a more modest overall effect on net tumor oxygenation across the rGB cohort. Accordingly, BEV induced a strong antiangiogenic effect, with reduction of tumor oxygenation at the 8-week follow-up. Despite this, oxygenation and flow parameters remained more elevated in rGB with shorter OS compared with rGB with longer OS, suggesting that evasive cellular mechanisms counteract the BEV effect and prevent the reduction of angiogenic activity in these tumors to the baseline values of less aggressive tumors. Recent trials have shown therapeutic benefits from combination of chemotherapy and/or radiation with antiangiogenic therapy. 33 We speculate that these effects relate to the ability of such protocols to utilize the vascular normalization window for chemotherapeutic delivery and overcome evasive mechanisms of tumor cells.8,33
A limitation of this study in addition to the not fully homogenous study cohort is the possibility of methodological uncertainties in parameter estimation. Assessment of tissue metabolism using DSC raw data requires the use of literature values for parameters that cannot be directly measured. While additional parameters can be measured with non-standard imaging sequences, 34 their acquisition requires specialized protocols which often require substantial additional time for acquisition. The advantage of the used method is its applicability to standard DSC data acquired in clinical practice. Well known limitations of the DSC technique are also applicable to our study, including AIF determination uncertainties, incomplete contrast agent leakage correction and numerical instability of deconvolution methods. Image processing was performed with the most optimal parameter settings for the selected analysis methods known to the authors.
In conclusion, this study demonstrates the utility of using DSC-derived CTH-based oxygenation parameters in the assessment of rGB. Within a cohort of patients with rGB treated with BEV, we find that CTH, and hence the OEF combine with the CBF in such a way that the overall tumor oxygenation appears to be worsened despite vascular normalization. In addition to this most important result our data also (a) supplement prior data by showing that the previously reported higher recruitment of angiogenesis at baseline in tumors associated with increased hazards for progression and death3,35 is accompanied by increased oxygen metabolism, (b) suggest that BEV induced tumor hypoxia may contribute to reduced BEV efficacy in highly vascular tumors, (c) indicate that under BEV treatment more aggressive tumors maintain a relatively higher TMRO2, and (d) demonstrate that the elevated TMRO2 is primarily supported by an increase in CBF, which counterbalances small reductions in OEF caused by shunting in the chaotic neovasculature, suggesting a different microvascular topology in rGB compared with primary GB and underlining the importance to assess oxygenation parameters in addition to topological and flow parameters to more fully reflect the underlying microvascular processes. In the future, it will be of interest to examine CTH-based oxygenation parameters in the early time window after BEV initiation to capture parametric changes during possible vascular normalization and also to use the technique in the assessment of combination therapy of BEV with cytotoxic chemotherapeutic agents (e.g. lomustine), to further investigate the relationship between microvascular topology, flow physiology, and tumor metabolism.
Footnotes
Funding
The author(s) received no financial support for the research, authorship, and/or publication of this article.
Acknowledgments
PK is a fellow of the Medical Faculty Heidelberg Postdoc-Program.
Declaration of conflicting interests
The author(s) declared no potential conflicts of interest with respect to the research, authorship, and/or publication of this article.
Authors’ contributions
PK and DB concepted and designed the study; PK, DB, OE, KM, and LØ performed image post-processing; PK performed statistical analysis; AW and WW were involved in clinical follow-up; AR, FTK, MB and PK were involved in the radiological follow-up of the patients; PK, DB, and LØ wrote large parts of the manuscript; KM, AR, FTK, OE, AW, HPS, WW, and MB contributed to the manuscript.
References
Supplementary Material
Please find the following supplemental material available below.
For Open Access articles published under a Creative Commons License, all supplemental material carries the same license as the article it is associated with.
For non-Open Access articles published, all supplemental material carries a non-exclusive license, and permission requests for re-use of supplemental material or any part of supplemental material shall be sent directly to the copyright owner as specified in the copyright notice associated with the article.