
Abstract
Treating recurrent glioblastoma (GB) is one of the challenges in modern neurooncology. Hypoxia, neovascularization, and energy metabolism are of crucial importance for therapy failure and recurrence. Twenty-one patients with initially untreated GB who developed recurrence were examined with a novel MRI approach for noninvasive visualization of the tumor microenvironment (TME). Imaging biomarker information about oxygen metabolism (mitochondrial oxygen tension) and neovascularization (microvascular density and type) were fused for classification of five different TME compartments: necrosis, hypoxia with/without neovascularization, oxidative phosphorylation, and glycolysis. Volume percentages of these TME compartments were compared between untreated and recurrent GB. At initial diagnosis, all 21 GB showed either the features of a glycolytic dominant phenotype with a high percentage of functional neovasculature (N = 12) or those of a necrotic/hypoxic dominant phenotype with a high percentage of defective tumor neovasculature (N = 9). At recurrence, all 21 GB revealed switching of the initial metabolic phenotype: either from the glycolytic to the necrotic/hypoxic dominant phenotype or vice-versa. A necrotic/hypoxic phenotype at recurrence was associated with a higher rate of multifocality of the recurrent lesions. Our MRI approach may be helpful for a better understanding of treatment-induced metabolic phenotype switching and for future studies developing targeted therapeutic strategies for recurrent GB.
Introduction
Glioblastoma (GB) is the most common and malignant primary brain tumor in adults. 1 GB is characterized by rapid proliferation, highly aggressive-invasive growth into surrounding central nervous system (CNS) tissues, and aberrant vascularization. 2 Hypoxia is a common microenvironmental feature of most cancers including GB. High proliferation rates drive excessive oxygen needs, which, in combination with tumor-related intravascular thrombosis and hemorrhage, lead to tissue hypoxia. 3 The responses of GB cells include migration from the hypoxic area resulting in pseudopalisading necrosis and production of angiogenic factors to induce new blood vessel formation through neovascularization 3 These major biological aspects make GB one of the most vascularized and hypoxic of all solid tumors. 4 Furthermore, to sustain rapid proliferation, cancer cells metabolize glucose to lactate even in the presence of oxygen (aerobic glycolysis) for both energy production and generation of carbon molecules essential for biosynthesis. This phenomenon, which is known as the Warburg effect, 5 is in clear contrast to the energy metabolism of normal cells via oxidative phosphorylation (OxPhos) in mitochondria. GB cells also tend to present with a metabolic preference for aerobic glycolysis. However, recent studies have revealed that the metabolic characteristics of GB cells are not as uniform as initially thought.6,7
All these compartments present specific niches within the tumor microenvironment (TME) which is emerging as a critical regulator of cancer progression and therapeutic response in primary and metastatic brain malignancies.4,8 Accumulating evidence suggests that intratumoral heterogeneity and divergent development of the TME within the same tumor are keys for understanding treatment failure.9,10 Despite multimodal treatment of GB involving surgical resection followed by radiotherapy with concomitant and adjuvant chemotherapy with temozolomide, GB rapidly progresses and leads to relapse about eight to nine months post diagnosis, with an average survival of only 15 months. 11 Currently, there is no standard treatment for recurrent GB, 12 which are less sensitive to therapy than the original tumor. In many cases, the tumor has invaded functional brain areas thereby enabling a second surgical resection in only 20–30%. 13 Most current GB studies focus on newly diagnosed untreated tumors, whereas TME changes upon recurrence remain largely unknown. 12 Thus, treatment development for recurrent GB has to rely on the knowledge of untreated GB, even though accumulating evidence suggests a treatment-induced phenotypic switch.14,15
The interplay between hypoxia, neovascularization, and energy metabolism is of crucial importance for elucidating the pathophysiological mechanisms of recurrence and therapy failure. Most of the available techniques, however, are not well suited for in-vivo characterization in humans due to their invasiveness (electrodes), limited availability and high costs ( 15 O2 positron emission tomography, PET), or low spatial resolution (near-infrared spectroscopy, NIRS). A novel multiparametric MRI approach (termed “TME mapping”) has been introduced recently which allows for the classification of TME compartments and detection of tumor supportive hypoxic and vascular niches in GB patients. 16 TME mapping enables the assessment of the dominating metabolic strategy for energy production and uncovered two survival-relevant metabolic phenotypes of GB. In this study, we used this physiological MRI approach and hypothesized that TME mapping provides insight into pathophysiological mechanisms and detects changes in tumor metabolism upon recurrence within the same GB patients.
Materials and methods
Patients and histopathology
Using an institutional database, we retrospectively identified patients with newly diagnosed untreated GB World Health Organization (WHO) grade IV, who developed recurrence after treatment according to the standard of care, i.e. maximal safe resection, radiotherapy, and concomitant and adjuvant chemotherapy with temozolomide. 11 Further inclusion criteria were: (i) aged >18 years; (ii) MRI data using our study protocol available both at initial diagnosis and at recurrence; (iii) patients who received no anti-glioma treatment before initial diagnosis MRI with our study protocol; (iv) pathologically confirmed GB based on the WHO histological grading system; (v) recurrence was determined by at least two board-certified radiologists in consensus based on the updated response assessment in neuro-oncology (RANO) criteria 17 with clear radiological features of recurrence; and (vi) patients who received bevacizumab or alternative chemotherapy regimens as part of their initial treatment regimen (i.e. before tumor recurrence) were excluded. The institutional review boards of the University of Erlangen and the University Clinic of St. Pölten approved this retrospective study. All patients gave written informed consent in accordance with the ethical standards of the Helsinki Declaration of 1975 and its later amendments. Written consent was obtained from all enrolled patients.
Isocitrate dehydrogenase-1 (IDH1) and epidermal growth factor receptor (EGFR) gene mutation status as well as cellular proliferation using Ki-67 (Kiel-67; Ventana Medical Systems, Oro Valley, USA) was routinely analyzed by immunohistochemical staining. For IDH-1, we used a R132H point mutation specific IDH1 antibody (Dianova, Hamburg, Germany). In cases, in which IDH1 (R132H) immunohistochemical staining was not conclusive, both IDH1 and IDH2 mutation status were determined by pyrosequencing. EGFR was assessed as a percentage of positive tumor cells and patients were divided into EGFR positive and EGFR negative. Cases with tumors demonstrating >20% EGFR immunohistochemical expression were considered positive, while below 20% were assigned negative. 18 O6-methylguanin-DNA-methyltransferase (MGMT) promoter status was determined by using DNA bisulfite conversion and pyrosequencing (QIAGEN, Hilden, Germany). Methylation values ≤5% were considered potential background signals of questionable significance, as described previously. 19
MRI data acquisition
MRI examinations were performed on a 3 Tesla clinical scanner (Tim Trio, Siemens, Erlangen, Germany) equipped with a standard 12-channel head coil. The MRI protocol included the following sequences: axial fluid-attenuated inversion-recovery (FLAIR; TR/TE/TI: 5000/460/1800 ms; in-plane resolution: 0.45 × 0.45 mm, slice thickness: 3 mm); a single-shot diffusion-weighted echo-planar imaging (DW-EPI) sequence (TR/TE: 5300/98 ms; in-plane resolution: 1.2 × 1.2 mm, slice thickness: 4 mm; 29 slices, b-values of 0 and 1000 s/mm2); and pre- and post-contrast enhanced T1-weighted gradient-echo MRI sequences (TR/TE: 250/2.8 ms; in-plane resolution: 0.5 × 0.5 mm, slice thickness: 4 mm; 29 slices).
For measurement of oxygen metabolism, we used the multiparametric quantitative blood oxygen level dependent imaging (qBOLD) approach, which required (i) a multi-echo gradient echo (GE) sequence for R2*-mapping (8 echoes; TE, 5–40 ms), and (ii) a multi-echo spin echo (SE) sequence for R2-mapping (8 echoes; TE, 13–104 ms), respectively.
For assessment of neovascularization, we used the vascular architecture mapping (VAM) approach, which required dynamic susceptibility contrast (DSC) perfusion MRI data obtained with SE (TR, 1740 ms; TE, 33 ms) and GE (TR, 1740 ms; TE, 22 ms) EPI sequences, respectively, using dual contrast agent injections.20–22 Both DSC perfusion examinations were performed with 60 dynamic measurements and administration of 0.1 mmol/kg-body-weight gadoterate-meglumine (Dotarem, Guerbet) at a rate of 4 ml/s using an MRI-compatible injector (Spectris, Medrad). A 20-ml-bolus of saline was injected subsequently at the same rate. Our strategy to minimize the probability of patient motions and differences in the time to first-pass peak, which may significantly affect the data evaluation, was described in detail previously.20–22 Geometric parameters were chosen identical for these four sequences: in-plane resolution: 1.8 × 1.8 mm, slice thickness: 4 mm; 29 slices. The additional acquisition time (TA) for the qBOLD (R2* and R2-mapping: TA, 1.5 and 3.5 min, respectively) and VAM sequences (SE-EPI DSC perfusion: TA, 2 min) was 7 min.
MRI data processing
Processing of qBOLD and VAM data, and calculation of MRI biomarker maps for oxygen metabolism and neovascularization were performed with custom-made MatLab (MathWorks, Natick, MA) software. Details about the whole data processing pipeline from MRI data acquisition over pre-processing to biomarker calculation are shown online in the Supplementary Materials (Supplementary Figure 1). Briefly, both qBOLD and VAM data processing consisted of three steps.
The qBOLD data processing: (i) Corrections for background fields of the R2*-mapping data20 and for stimulated echos of the R2-mapping data; 23 (ii) calculation of R2*- and R2-maps from the multi-echo MR relaxometry data; and (iii) calculation of absolute cerebral blood volume (CBV) and flow (CBF) maps from the GE-EPI DSC perfusion MRI data via automatic identification of arterial input functions (AIFs). 24 These data were used for the calculation of MRI biomarker maps of oxygen metabolism, including oxygen extraction fraction (OEF), cerebral metabolic rate of oxygen (CMRO2) 25 and the average mitochondrial oxygen tension (mitoPO2), as described previously. 26
The VAM data processing was described in detail previously.21,22 It consisted of (i) correction for remaining contrast agent extravasation; 27 (ii) fitting of the first bolus curves for each voxel of the GE- and SE-DSC perfusion data with gamma-variate function; 28 and (iii) calculation of the ΔR2,GE versus (ΔR2,SE)3/2 diagram 29 – the so-called vascular hysteresis loop (VHL). These data were used for the calculation of MRI biomarker maps of neovascularization, including the microvessel type indicator (MTI) and the upper limit of microvessel density (NU) and radius (RU). 30
TME mapping
Criteria for classification of TME compartments.
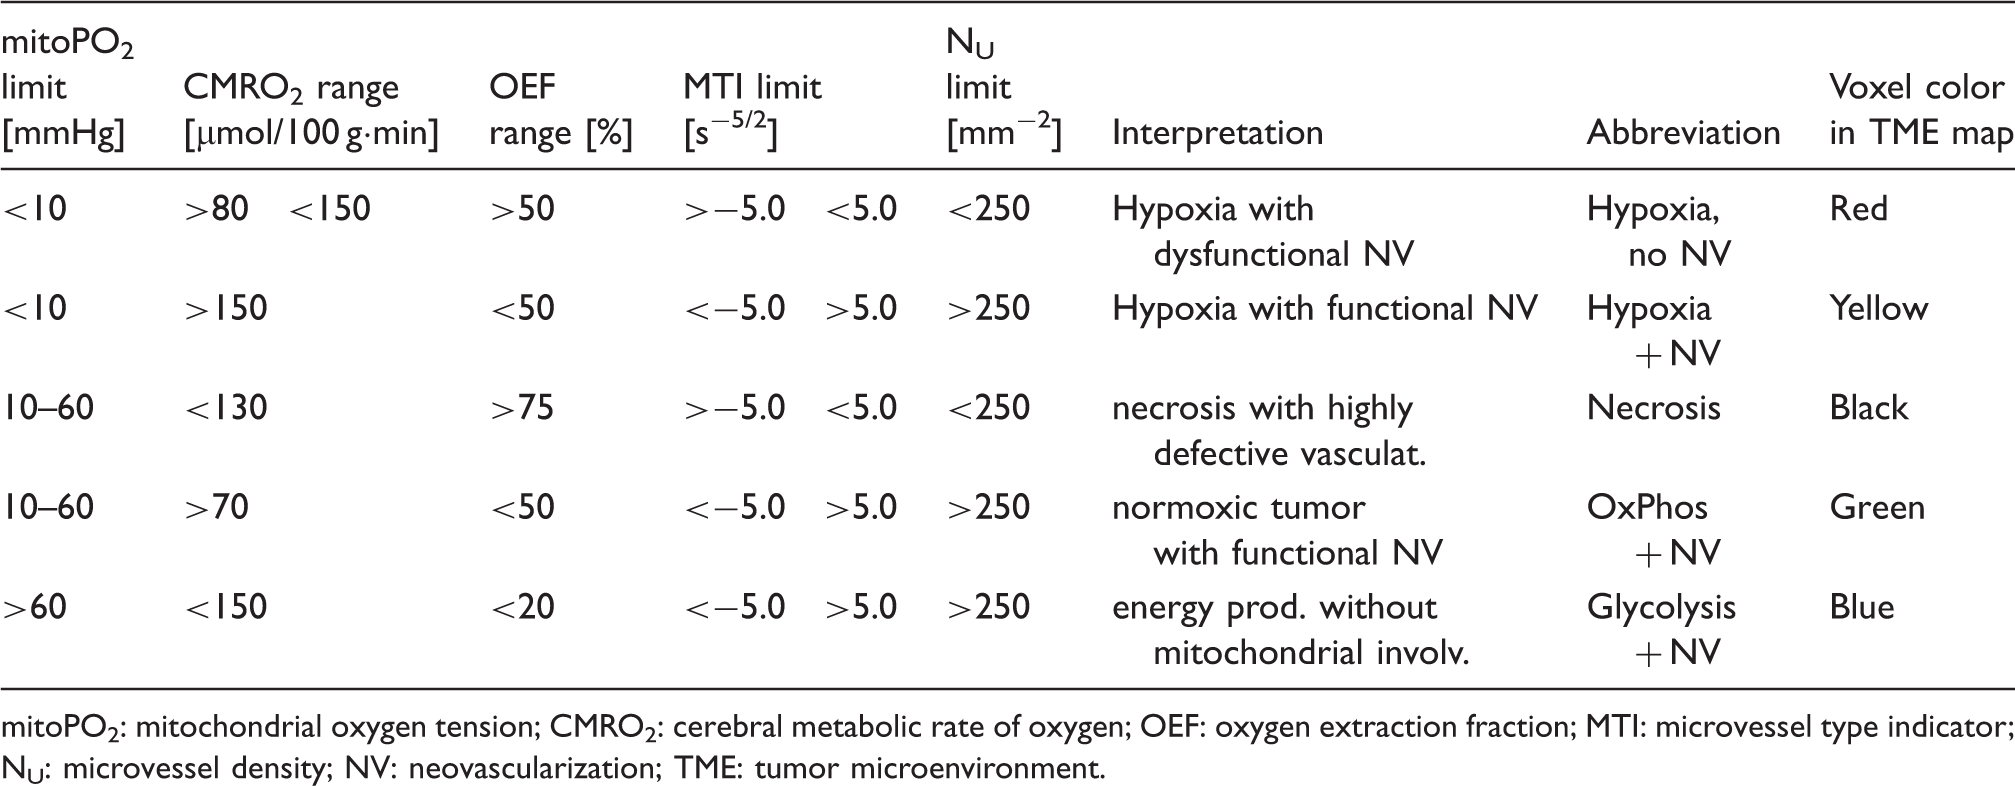
mitoPO2: mitochondrial oxygen tension; CMRO2: cerebral metabolic rate of oxygen; OEF: oxygen extraction fraction; MTI: microvessel type indicator; NU: microvessel density; NV: neovascularization; TME: tumor microenvironment.
Quantitative and statistical analysis
For quantitative analysis of the TME compartments, regions of interest (ROIs) were manually defined by an experienced radiologist (A.D. or G.H.) based on features seen in the contrast-enhanced (CE) T1-weighted images covering the enhancing tumor volume. The ROIs were transferred to the TME maps and the volumes of the five TME compartments were calculated after linear (rigid) registration using the VINCI software package (“Volume Imaging in Neurological Research, Co-Registration and ROIs included”, version 4.9, Max-Planck-Institute for Neurologic Research, Cologne, Germany). 31 The CE T1w MRI and the MRI sequences for TME mapping had identical geometric parameters (i.e. field-of-view as well as position, number, thickness, and angulation of the slices). Therefore, linear registration was used for compensation of potential patient movement between the sequences only.
In a previous study, 16 we found in a cohort of 52 patients with untreated GB, that there existed two subgroups with no overlap in the “Glycolysis + NV” tumor volume. For definition of this TME compartment, we refer to Table 1. In accordance with these previous findings, we used the “Glycolysis + NV” compartment for differentiation of metabolic phenotypes: (i) tumors with a high percentage of “Glycolysis + NV” were assigned to the glycolytic dominant phenotype, whereas (ii) tumors with a low percentage of “Glycolysis + NV” were assigned to the necrotic/hypoxic dominant phenotype, respectively. 16 For validation purposes of TME mapping with conventional MRI (cMRI) features, we calculated the volumes for edema (on FLAIR) as well as total contrast-enhancing tumor volume and necrotic tumor volume (on CE T1w MRI) via manual segmentation.
Data are presented as percentage of TME volume relative to the total tumor volume as mean values ± standard deviations. Software (SPSS 21, IBM, Chicago, IL, USA) was used for statistical evaluation. Percentages (TME volume relative to the total tumor volume; MIB-1) were log-transformed and normality was assessed using a Kolmogorov–Smirnov test. The Mann–Whitney test was used for comparison of log-transformed TME compartment volumes, time to progression (TTP), and MIB-1 between the subgroups with different metabolic phenotypes. A Wilcoxon signed-rank test was used for comparison of log-transformed TME compartment volumes and MIB-1 between initial diagnosis and recurrence within the same patients (paired). The Chi-square test was used to look for group differences (phenotypic subgroups) in tumor focality at recurrence (multifocal vs. unifocal), MGMT status (positive vs. negative), and EGFR status (positive vs. negative). Linear regression analysis was performed for correlation between percentage of necrosis in conventional MRI and TME mapping. P values less than 0.05 were considered to indicate significance. Progression was determined by at least two board-certified radiologists in consensus based on the updated RANO criteria with clear radiological features of recurrence. 17 TTP was determined as the time interval between initial detection of the lesion and recurrence.
Results
Patient and tumor characteristics.
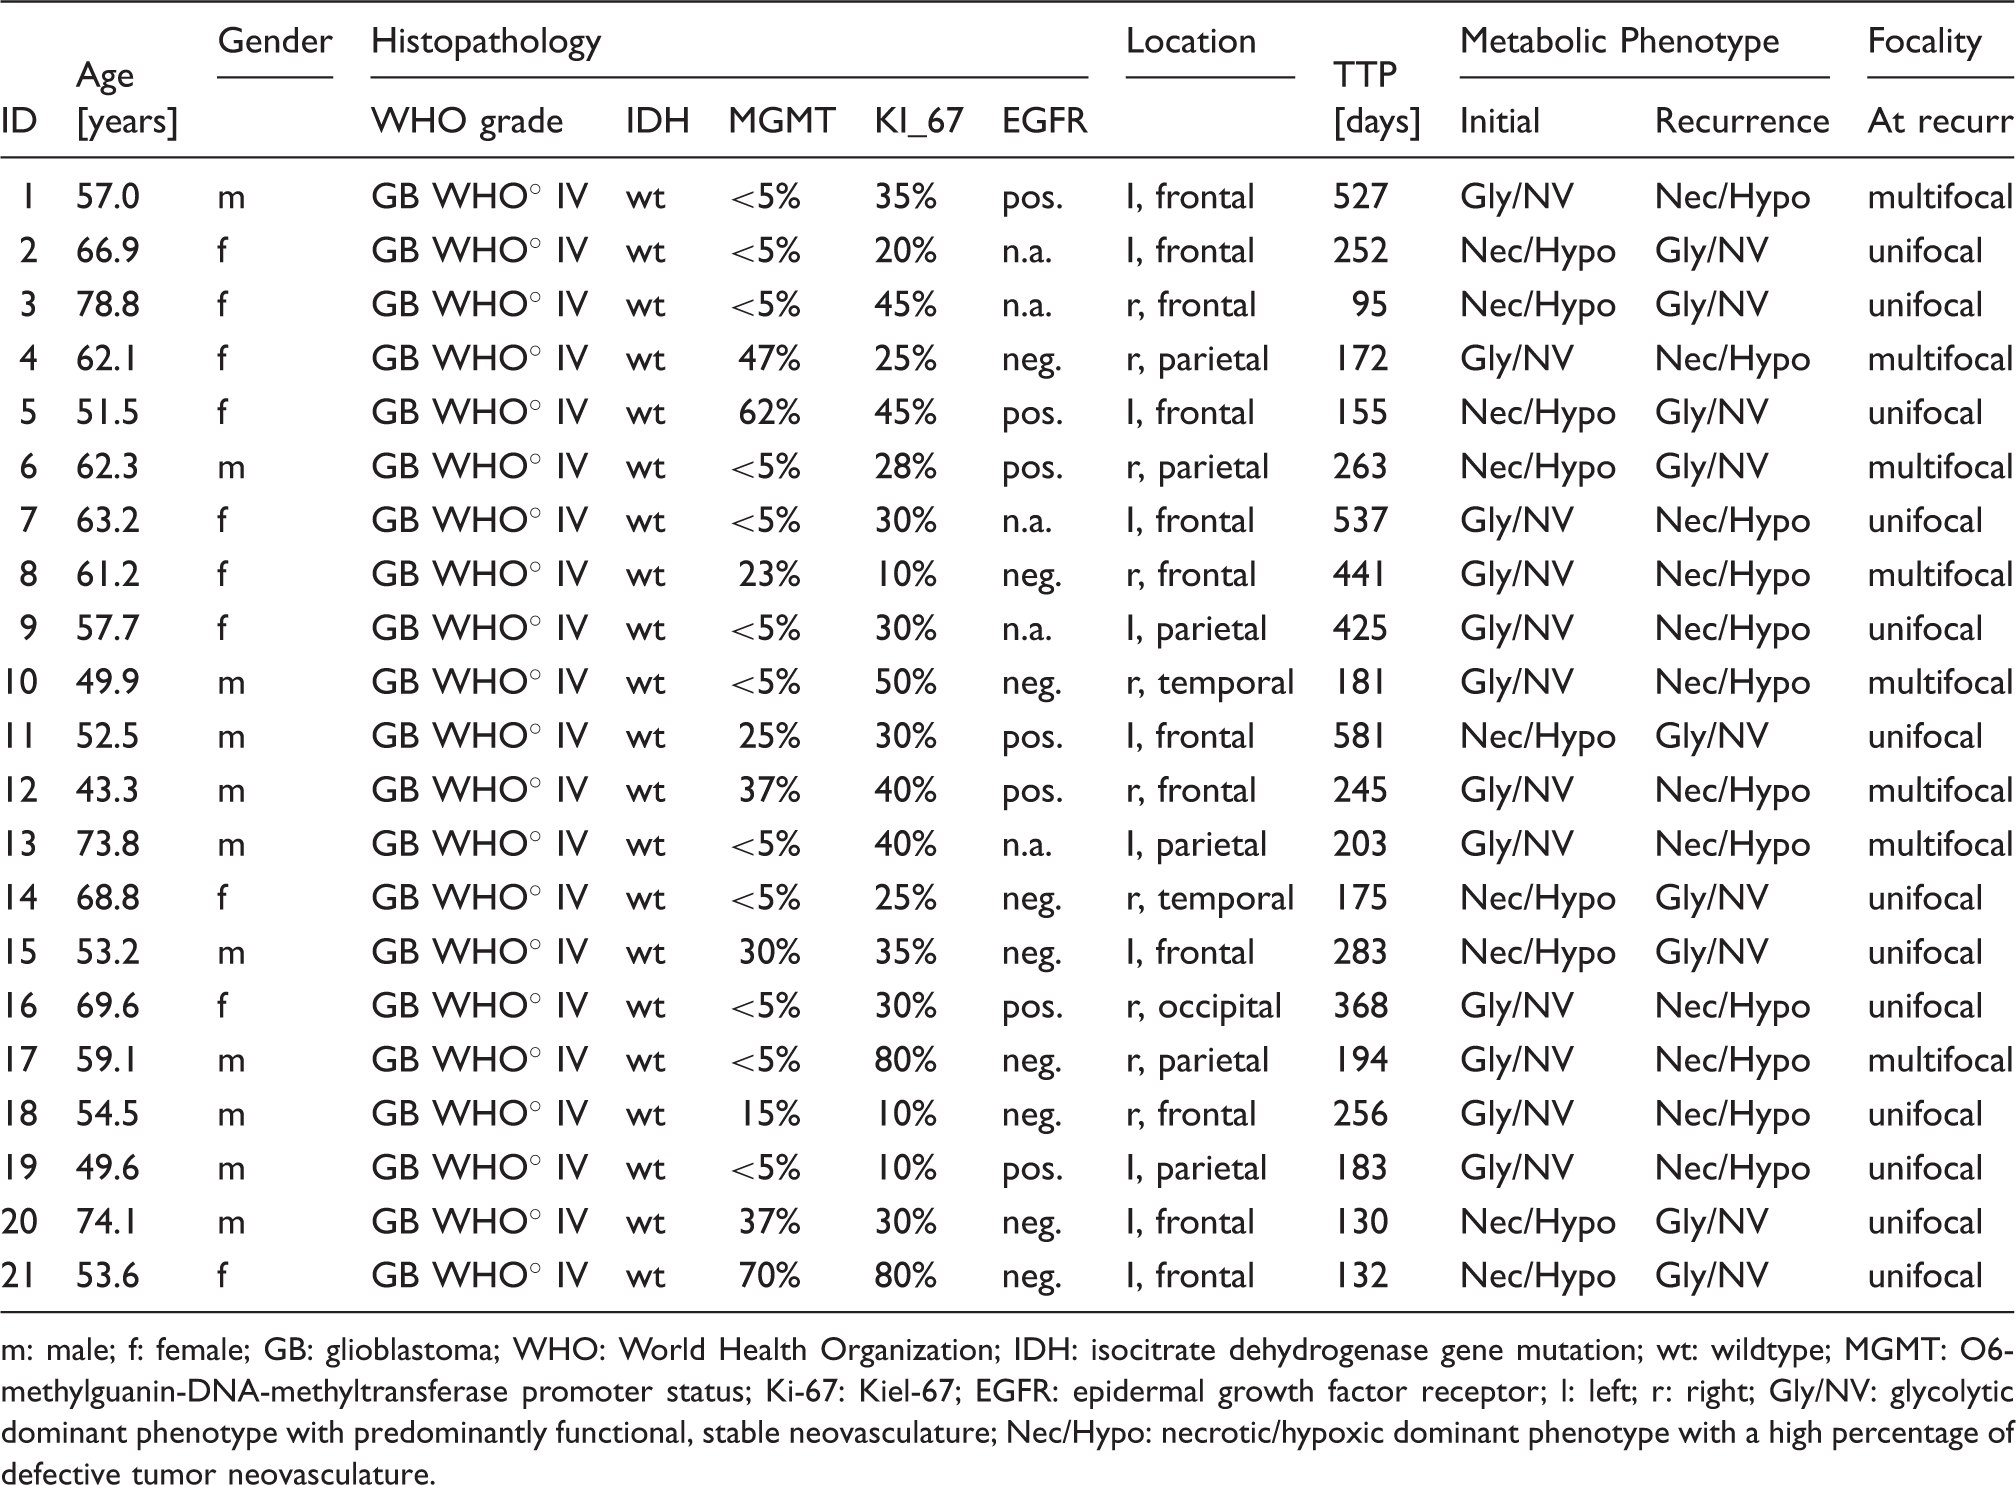
m: male; f: female; GB: glioblastoma; WHO: World Health Organization; IDH: isocitrate dehydrogenase gene mutation; wt: wildtype; MGMT: O6-methylguanin-DNA-methyltransferase promoter status; Ki-67: Kiel-67; EGFR: epidermal growth factor receptor; l: left; r: right; Gly/NV: glycolytic dominant phenotype with predominantly functional, stable neovasculature; Nec/Hypo: necrotic/hypoxic dominant phenotype with a high percentage of defective tumor neovasculature.
Processing of MRI data, i.e. the calculation of MRI biomarker maps of oxygen metabolism (OEF, CMRO2, mitoPO2) and neovascularization (MTI, NU, RU), and TME mapping was successfully performed for all 21 patients. Both, mitoPO2 (oxygen tension) and MTI (neovascularization) provided indications for intratumoral heterogeneity of TME compartments as well as for their alterations at recurrence.
An illustrative case demonstrating this spatial heterogeneity and the physiological changes at recurrence is presented in Figure 1. It is evident that combined interpretation of the MRI biomarker maps of oxygen metabolism and neovascularization is challenging and not straight forward. However, TME mapping, i.e. information fusing oxygen metabolism and neovascularization, resulted in a single and more intuitive map visualizing the heterogeneity, spatial localization, and physiologic features of the TME compartments: necrosis (black), hypoxia without/with neovascularization (red/yellow), OxPhos (green), and glycolysis (blue). The TME maps demonstrate that the treatment-naive TME of this GB (left panel in Figure 1) preferred glycolysis (53.8% of the tumor volume) and functional, stable neovasculature (66.5%) with low percentages of especially hypoxia (3.5% and 2.3%). In the recurrent GB, however, the glycolytic TME compartment was decreased to 19.6%, whereas the hypoxic compartments were increased to 24.8% (without neovascularization) and 18% (with neovascularization), respectively. The percentage of functional, stable neovasculature decreased to 49.4%. In other words, this GB switched from a glycolytic dominant phenotype with predominantly functional, stable neovasculature to a hypoxic dominant phenotype with predominantly defective neovasculature. A further illustrative case suffering from a GB with very similar characteristics is presented in Supplementary Figure 2.
TME mapping of a patient (ID 16) suffering from a GB with a glycolytic dominant phenotype at initial diagnosis (left panel) which showed a switch to a necrotic/hypoxic dominant phenotype upon recurrence (right panel). Top-down: conventional MRI (cMRI) including contrast-enhanced T1-weighted and FLAIR MRI; maps of mitochondrial oxygen tension (mitoPO2) and microvessel type indicator (MTI) representing oxygen metabolism and neovascularization, respectively; result of the tumor microenvironment (TME) mapping; and percentages of TME compartments for the whole tumor volume.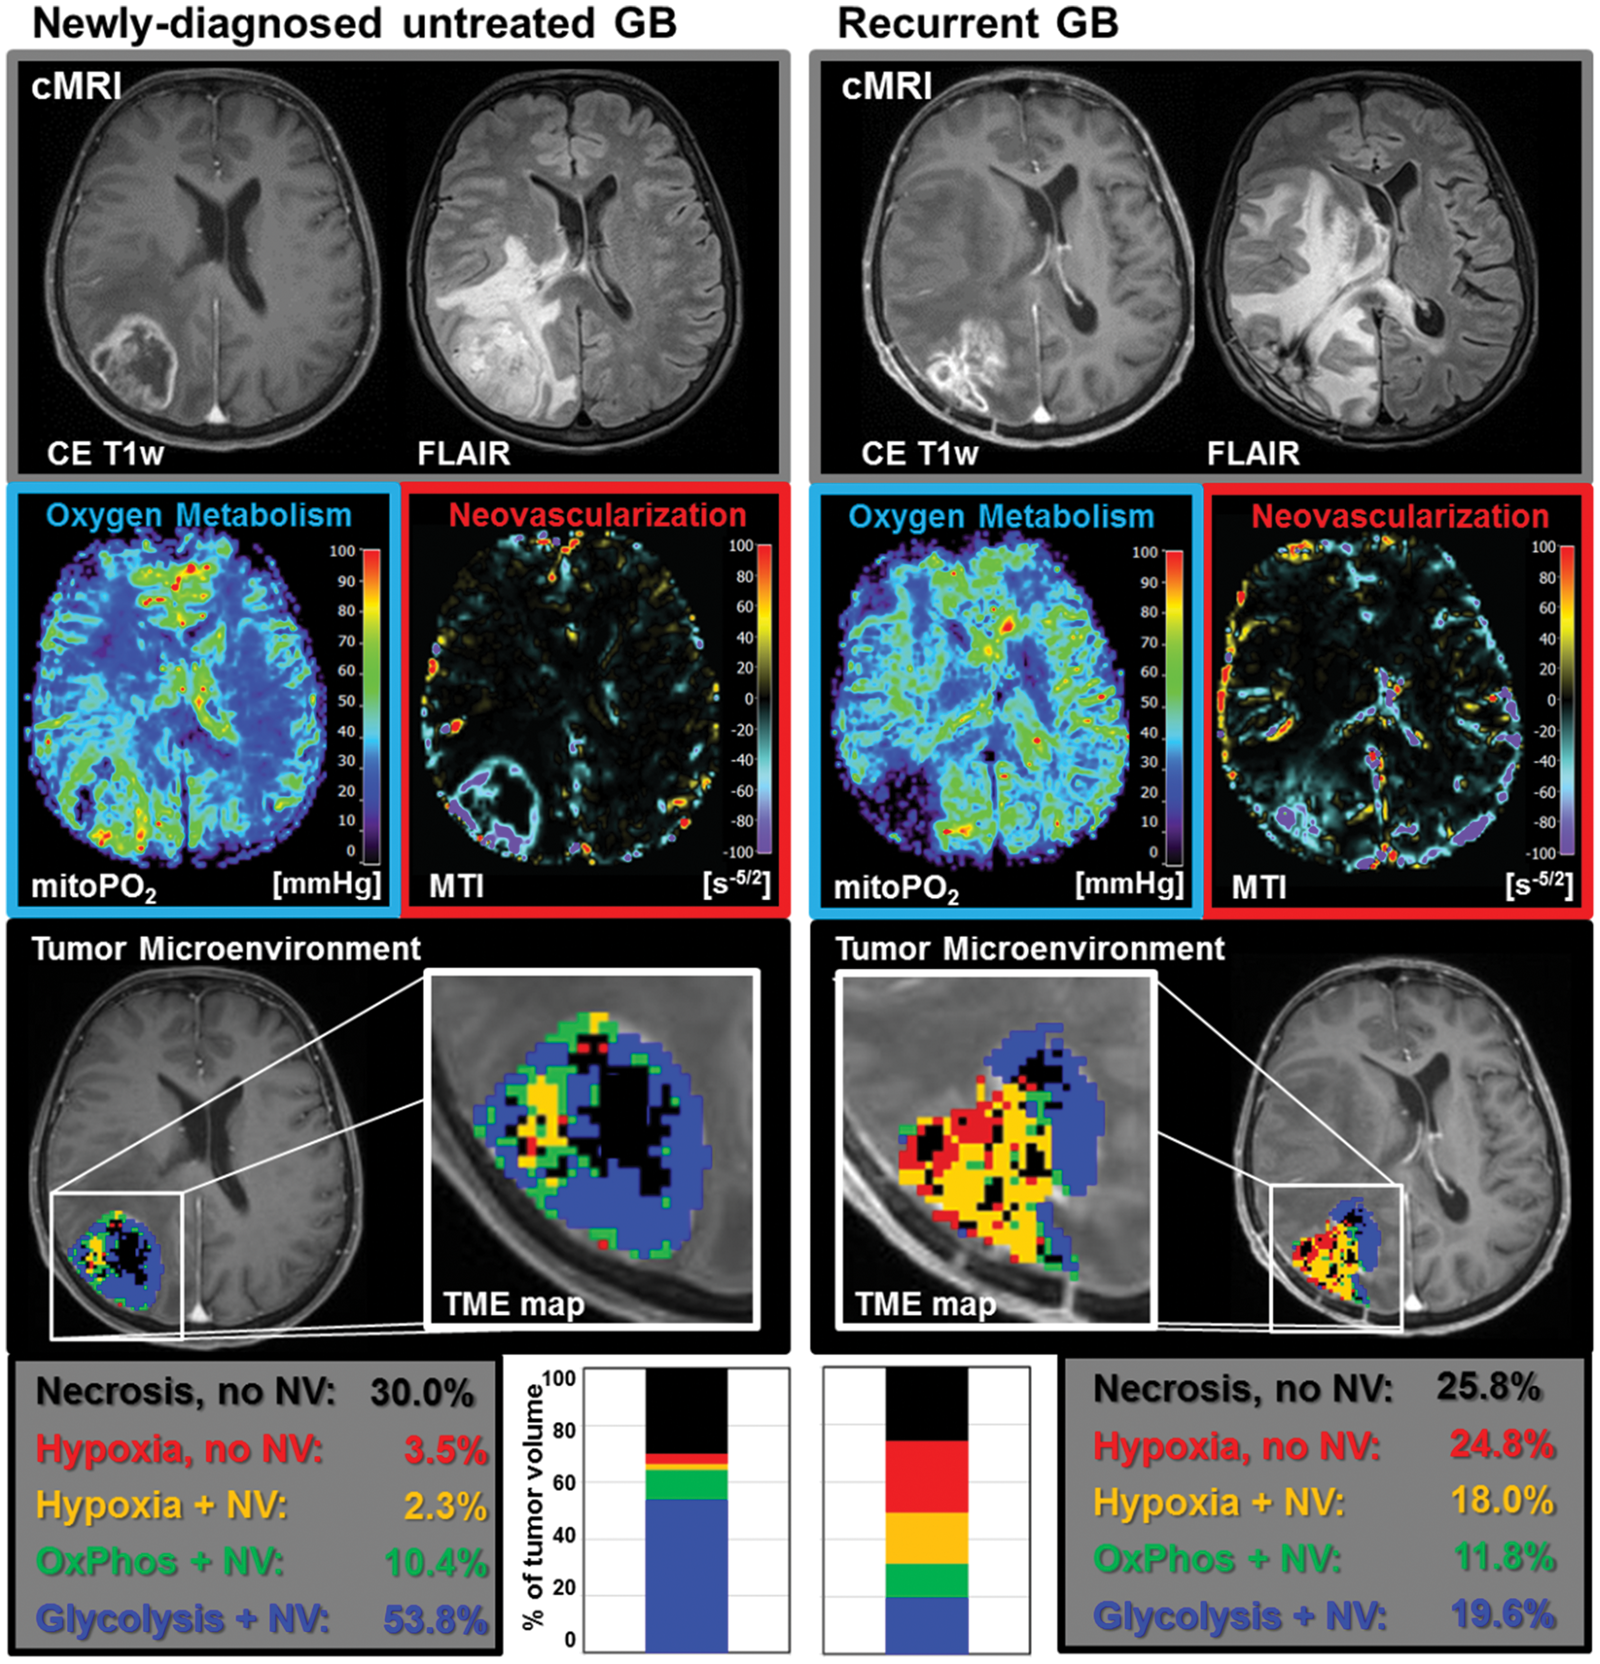
The extent of intratumoral heterogeneity of oxygen metabolism and neovascularization was indeed similar in the patient presented in Figure 2. However, the TME map demonstrated that the newly diagnosed untreated GB was substantially less glycolytic (16.4% of the tumor volume) but more hypoxic (21.9% without and 23.2% with neovascularization, respectively) compared to the patients in Figure 1 and Supplementary Figure 2. At recurrence, this tumor showed a switch to the glycolytic dominant phenotype. Necrotic (from 22.6% to 7.5%) and hypoxic TME compartments (to 2.9% and 12.9%, respectively) decreased strongly, and the tumor volume with neovascularization increased from 55.5% (pre-treatment) to 89.6% (recurrence). Hence, this GB switched from an initially hypoxic dominant phenotype to a glycolytic dominant phenotype at recurrence. Other illustrative cases suffering from a GB with very similar characteristics are shown in Supplementary Figure 3.
TME mapping of a patient (ID 2) suffering from a GB with a necrotic/hypoxic dominant phenotype at initial diagnosis (left panel) which showed a switch to a glycolytic dominant phenotype upon recurrence (right panel). Top-down: conventional MRI (cMRI) including contrast-enhanced T1-weighted and FLAIR MRI; maps of mitochondrial oxygen tension (mitoPO2) and microvessel type indicator (MTI) representing oxygen metabolism and neovascularization, respectively; result of the tumor microenvironment (TME) mapping; and percentages of TME compartments for the whole tumor volume.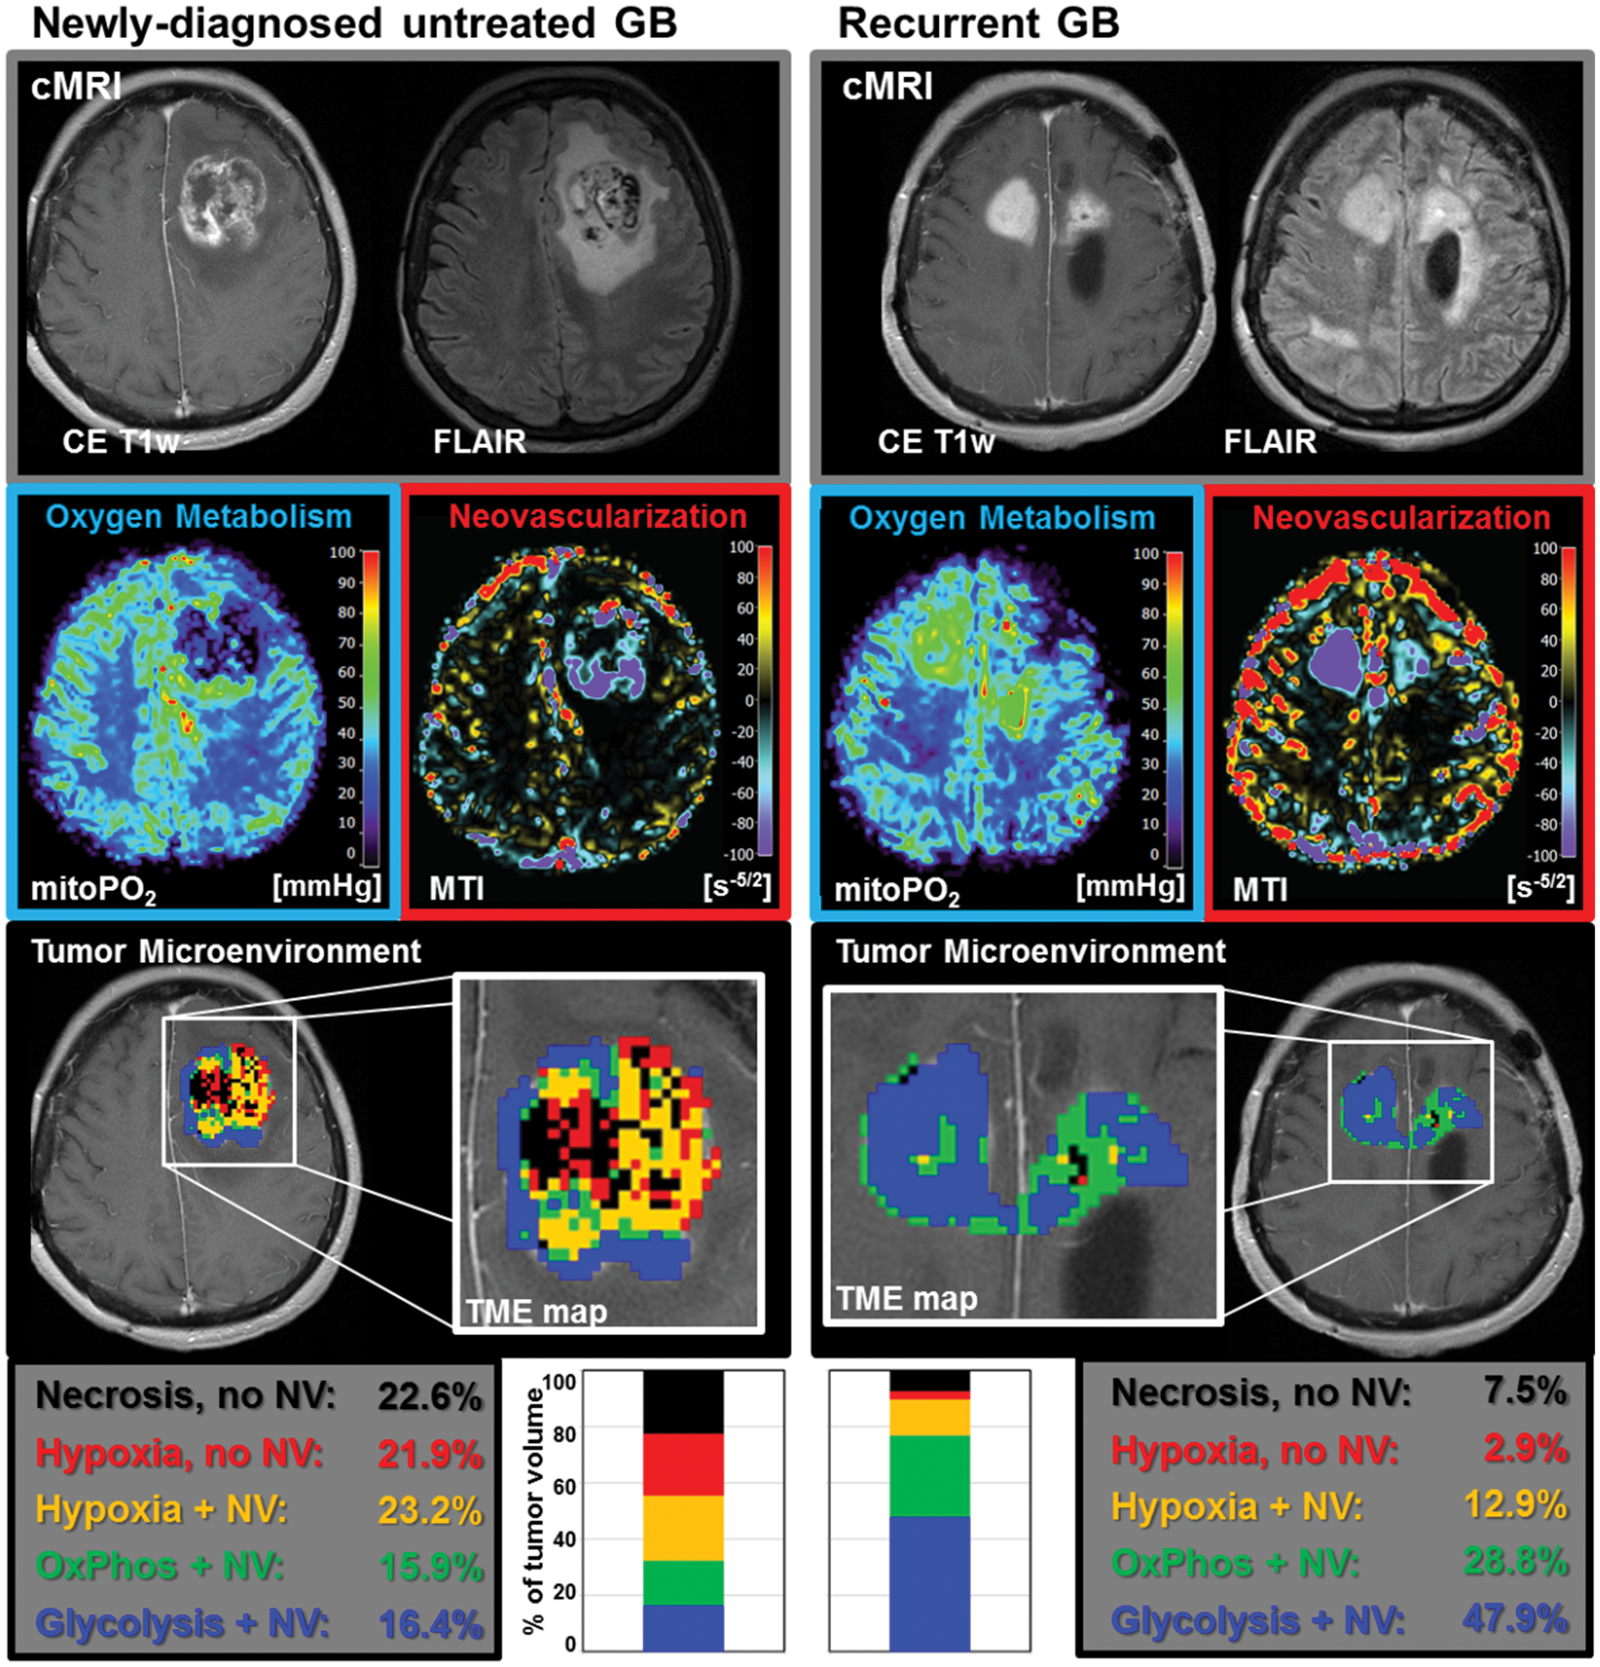
Two metabolic phenotypes of untreated GB
At initial diagnosis, the GB of all 21 patients showed either the features of the glycolytic dominant phenotype (high percentage of “Glycolysis + NV”) with a high percentage of functional neovasculature or a necrotic/hypoxic dominant phenotype (low percentage of “Glycolysis + NV”) with a high percentage of defective tumor neovasculature. Newly diagnosed untreated GB with a glycolytic phenotype was detected in 12 patients (57% of all patients; 7 males; 58.5 ± 8.6 years) and with a necrotic/hypoxic phenotype in 9 patients (43%; 4 males; 62.5 ± 10.2 years). The percentage of the “Glycolysis + NV” TME compartment showed no overlap between the two phenotypes: 40%–65% for the glycolytic dominant phenotype, and 1%–29% for the necrotic/hypoxic dominant phenotype, respectively.
The pie charts on the left-hand side of Figure 3(a) and (b), respectively, reveal an overview of the treatment-naive TME compartments for the two phenotypic subgroups at initial diagnosis (i.e. of untreated GB). The percentages of all TME compartments (glycolysis, hypoxia, and necrosis) were significantly different (Mann–Whitney test; all P ≤ 0.01) between the two phenotypic subgroups at initial diagnosis, except for the OxPhos TME compartment (Mann-Whitney test; P = 0.422), which revealed a similar percentage: 17.3% versus 14.6%, respectively. Additionally, the tumor volume with neovascularization was also significantly different (Mann–Whitney test; P < 0.001) between the glycolytic (75.6 ± 6.7%) and the necrotic/hypoxic phenotype (48.5 ± 6.9%). IDH gene mutation analysis revealed the wild type version of the IDH gene for all 21 tumors. There were no significant differences between the two phenotypic subgroups for the MGMT status (P = 0.309), the EGFR status (P = 0.949), and MIB-1 (P = 0.651) by using the Chi-square test. We found a strong correlation (linear regression; R = 0.945; P < 0.001) between the percentage of necrosis determined with cMRI (CE T1w MRI) and TME mapping. However, we found no significant differences between the phenotypic subgroups for edematous volume on FLAIR MRI (glycolytic phenotype: 53.2 ± 35.7 cm3; necrotic/hypoxic phenotype: 45.2 ± 37.3 cm3; P = 0.629), tumor volume on CE T1w MRI (glycolytic phenotype: 27.8 ± 15.4 cm3; necrotic/hypoxic phenotype: 27.2 ± 20.1 cm3; P = 0.944), and necrotic tumor volume on CE T1w MRI (glycolytic phenotype: 6.3 ± 3.6 cm3; necrotic/hypoxic phenotype: 9.1 ± 6.7 cm3; P = 0.285), respectively, using a Mann–Whitney test.
Switching of metabolic phenotypes upon recurrence in GB patients. (a) Overview for the patient subgroup which revealed a switch from the initial glycolytic phenotype to the necrotic/hypoxic phenotype at recurrence. (b) Overview for the patient subgroup which showed a switch from the necrotic/hypoxic to the glycolytic phenotype phenotype at recurrence, respectively. Top-down: Bar charts of the individual changes for each patient in the TME compartments between initial diagnosis (left bar) and recurrence (right bar); pie charts of the TME compartments averaged over all patients of the subgroup (significant differences between initial diagnoses and recurrence within the subgroup are marked with an asterisk); and bar plots representing the mean of each compartment (diamonds) and the associated standard deviation as error bars.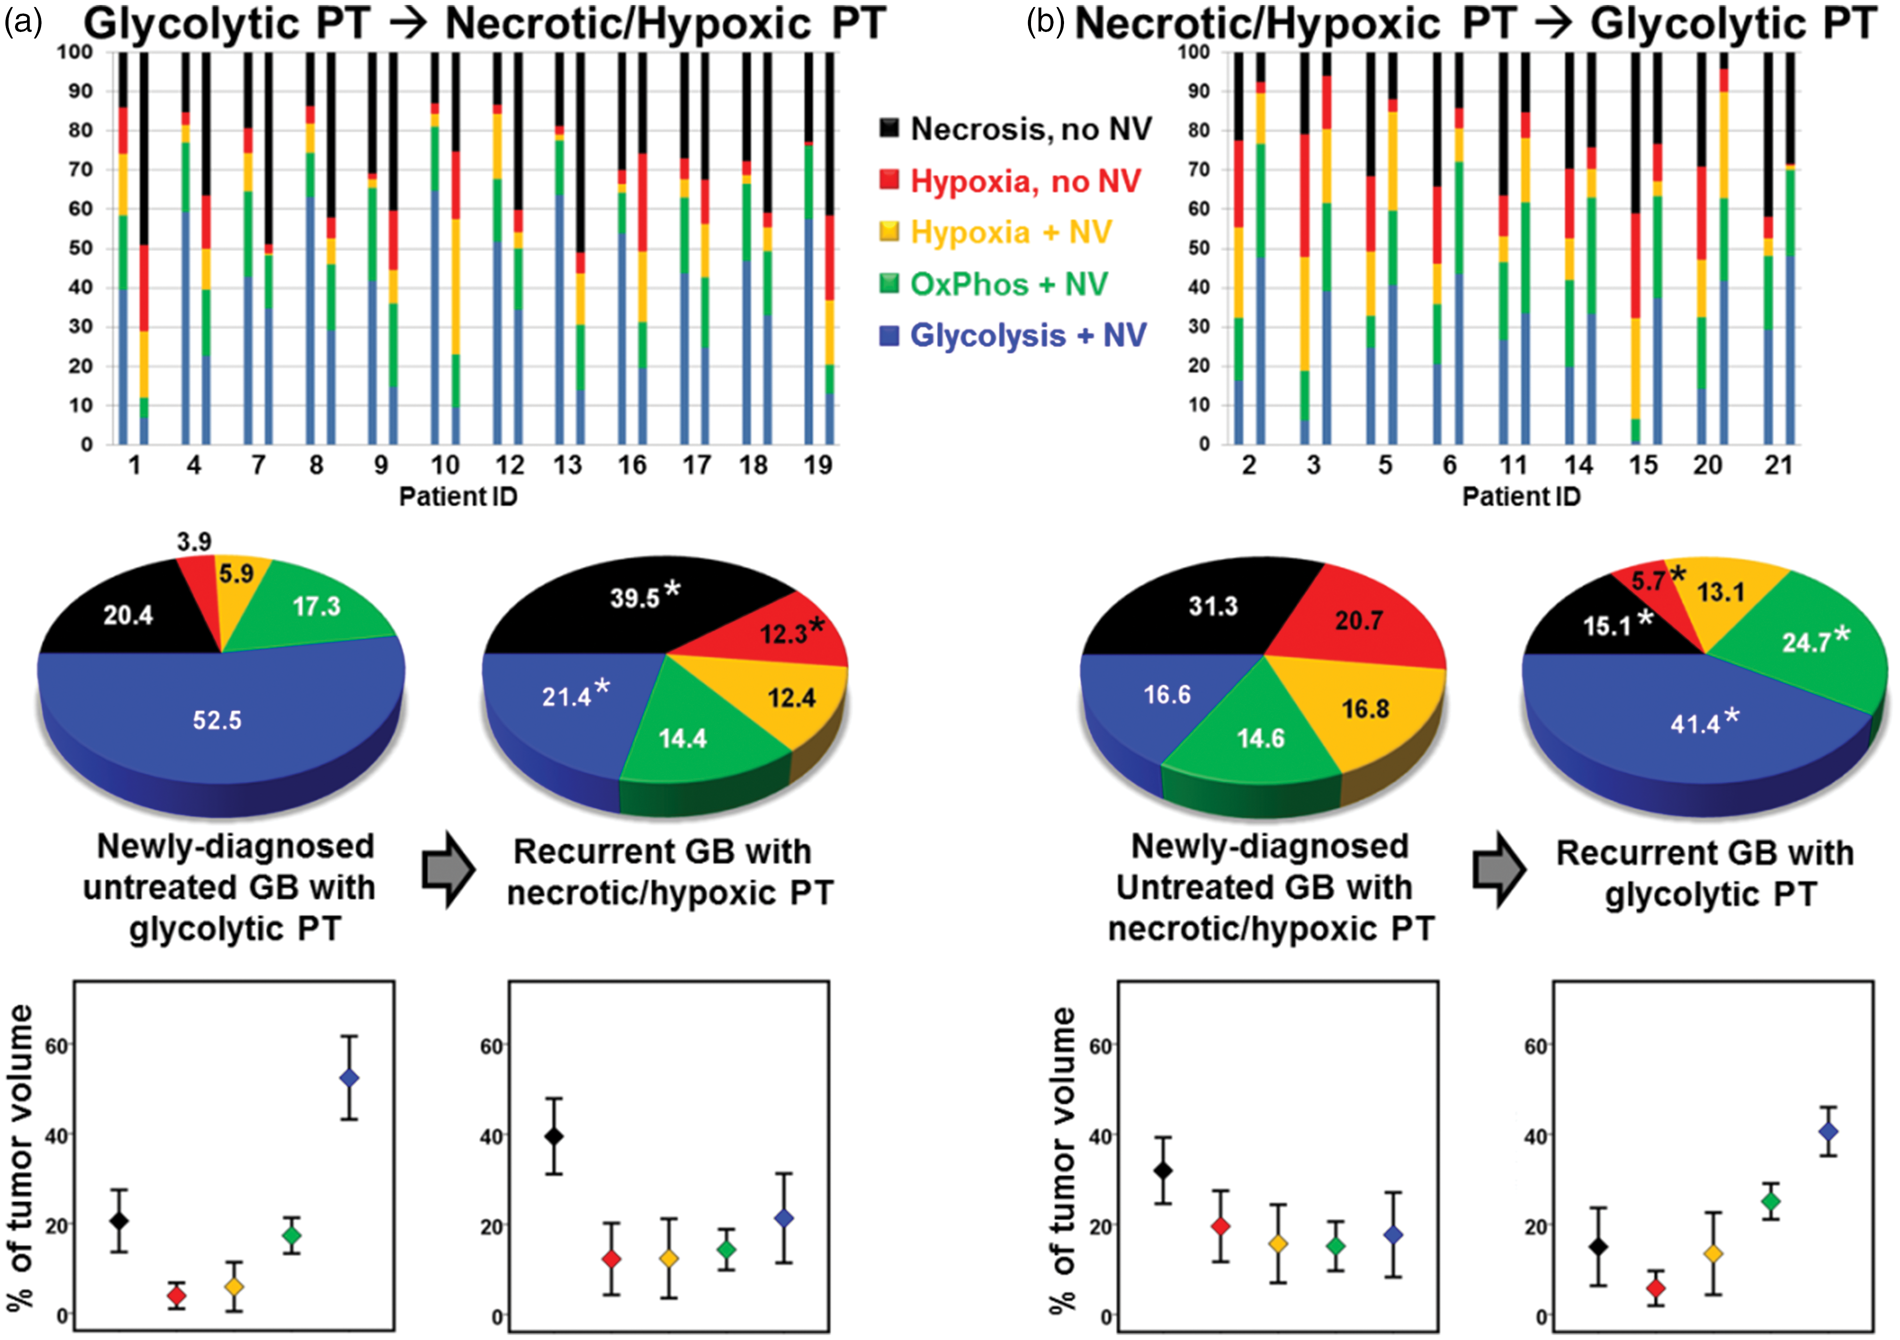
Switching of metabolic phenotype upon recurrence
At recurrence, all 21 patients revealed a switch in the metabolic phenotype of the GB. The individual changes for each patient in the TME compartments between initial diagnosis and recurrence are visualized in the upper parts (bar charts) of Figure 3(a) and (b). For the two subgroups of patients, we found in detail:
(i) All 12 patients with a glycolytic dominant GB at initial diagnosis were predominantly necrotic/hypoxic at recurrence. This subgroup of GB showed a significant decrease in the glycolytic TME compartment (P = 0.002), and a significant increase in both the hypoxic (without NV, P = 0.012) and the necrotic TME compartment (P = 0.003), respectively, using a Wilcoxon signed-rank test. The tumor volume with neovascularization decreased significantly (Wilcoxon signed-rank test; P = 0.002) from 75.6 ± 6.7% (66.5–84.3%) to 48.2 ± 8.5% (28.9–57.5%). (ii) All nine patients with an initial necrotic/hypoxic GB demonstrated a dominant glycolytic TME compartment at recurrence. This subgroup of GB showed a significant increase in both the glycolytic and OxPhos TME compartment (P ≤ 0.008), and a significant decrease in both the hypoxic (without NV) and the necrotic TME compartment (P ≤ 0.008), respectively, using a Wilcoxon signed-rank test. Consequently, the tumor volume with neovascularization increased significantly (Wilcoxon signed-rank test; P = 0.008) from 48.5 ± 6.9% (32.3–55.5%) to 79.1 ± 8.3% (67.1–89.9%).
Two metabolic phenotypes of recurrent GB
At recurrence, the percentage of the “Glycolysis + NV” compartment showed again no overlap between the two (now switched) phenotypes: 35%–48% for the glycolytic dominant phenotype at recurrence and 7%–33% for the necrotic/hypoxic dominant phenotype at recurrence, respectively. The gap, however, was much smaller at recurrence.
The phenomenon of the phenotypic switch was supported by the significant difference for the TME compartments of glycolysis (P < 0.001), OxPhos (P < 0.001), and necrosis (P < 0.001) as well as for the neovascularized tumor volume (P < 0.001) between the two phenotypic subgroups at recurrence using a Mann–Whitney test. Additionally, statistical comparison of distributions of the TME compartment within the same metabolic subtype untreated versus recurrent, i.e. between the initial necrotic/hypoxic phenotype and the recurrent necrotic/hypoxic phenotype, revealed no significant differences (all P > 0.05) by a Mann–Whitney test. Similar results were found using a Mann–Whitney test between the initial glycolytic phenotype and the recurrent glycolytic phenotype (all P > 0.05).
Median TTP was higher (251 days) for the patient subgroup with a glycolytic phenotype of the newly diagnosed untreated GB compared to the subgroup with the initial necrotic/hypoxic phenotype (175 days). This difference in median TTP, however, did not reach statistical significance (Mann–Whitney test; P = 0.148). Interestingly, from the 12 GB that switched from the initial glycolytic phenotype to the necrotic/hypoxic phenotype at recurrence, 7 GB (58%) were also multifocal at recurrence, but only 1 (11%) of the 9 GB in the other subgroup were multifocal at recurrence (Table 2). This difference in focality at recurrence was statistically significant (P = 0.027) by a Chi-square test. All 21 GBs were unifocal at initial diagnosis.
Discussion
In this study, we used TME mapping, a multiparametric MRI approach for noninvasive visualization of pathophysiological features and tumor-supportive niches, to investigate changes in tumor biology and metabolic phenotype upon recurrence of GB within the same patient. We obtained insights into the pathophysiology of GB recurrence which are not accessible even with advanced MRI methods available so far. We detected intratumoral heterogeneity of TME compartments and two different metabolic phenotypes – a glycolytic dominant and a necrotic/hypoxic dominant phenotype – as well as switching between these metabolic phenotypes upon GB recurrence. A necrotic/hypoxic phenotype at recurrence was associated with a significant higher rate of multifocality of the recurrent lesions.
Proliferative and invasive phenotypes of GB have been characterized by Phillips et al. 14 using genotyping and expression profiling of patient samples. The authors classified GB into a mesenchymal, proliferative, and proneural subtype and demonstrated that both the mesenchymal and proliferative subtypes showed shorter survival times compared to the proneural subtype. Based on data from The Cancer Genome Atlas (TCGA), 32 Verhaak et al. 33 further classified GB into four molecular subtypes: proneural, neural, classical, and mesenchymal. The proneural subtype was associated with better prognosis, the neural signature was associated with normal brain tissue in which tumor cells express neuronal markers, the classical signature represented a more proliferative phenotype, and the mesenchymal subtype was a more invasive phenotype. 34 The latter two were associated with worse prognosis. Although TCGA data were established from bulk patient samples, more recent studies have uncovered that a single tumor or even a single cell may be categorized into multiple subclasses.10,35 In this study, we used a different approach performing a metabolic phenotyping of the lesion by classification of metabolic information from the whole tumor. This might provide additional information helpful for GB classification.
The intratumoral heterogeneity with mixtures of genetically subclones enables phenotypic plasticity of the tumor and potentially causes treatment failure and recurrence. Comparison of paired tumor samples from initial resections and recurrence revealed differences in molecular features and a change in subclassification after radiochemotherapy.14,36 GB cells have two survival strategies to escape from a hypoxic TME and starvation: (i) migration to normoxic brain parenchyma or (ii) induction of neovascularization. Biological studies have linked hypoxia with the promotion of invasive and metastatic behavior 37 and the reduction of proliferative activity 38 which support the hypothesis that hypoxia triggers the switch from a proliferative to an invasive phenotype. On the other hand, a hypoxic environment stimulates new blood vessel development via up-regulation of multiple pro-angiogenic factors such as vascular endothelial growth factor (VEGF). This enables proliferating cancer cells to sustain the increased nutrient and energy demands required for tumor growth. The metabolism of proliferating cancer cells in turn is adapted to facilitate the increased uptake and incorporation of nutrients into the biomass (e.g., nucleotides, amino acids, and lipids) needed to produce new cancer cells. For that purpose, cancer cells rely on aerobic glycolysis, a phenomenon termed “the Warburg effect.”
Although both, extensive tumor cell migration and proliferation, are hallmarks of GB, in vitro experiments provided evidence that migration and proliferation appear to be mutually exclusive phenotypes, i.e. GB cells proliferate only when they do not move 39 or migratory GB cells become proliferative and generate a recurrent satellite lesion. 40 This phenomenon is termed the migration-proliferation dichotomy or ‘go or grow’ hypothesis40,41 which is in agreement with our findings: (i) we observed that glycolysis almost exclusively (>99%) occurs in tumor areas with neovascularization; and (ii) that recurrent GB with a predominantly necrotic/hypoxic TME demonstrates a high percentage of multifocality.
However, our study has several limitations. The patient numbers in the subgroups are small (N = 9 respectively 12). Additionally, contrast-enhancing tissue was judged to be recurrence using radiographic rather than histologic assessment. Furthermore, we were not able to include data from more advanced molecular examinations and established phenotyping. Based on this retrospective study analysis analyzing our newly developed physiologic MRI approach, further studies are required using this MRI technique in larger patient populations in combination with more advanced genetic analyses.
In conclusion, treating recurrent GB is one of the major challenges in modern neuro-oncology. Development of therapy designs has to consider the knowledge of the biology of recurrent GB. Our findings enable a better understanding of the metabolic mechanisms that underlie phenotypic shifts of GB. Our MRI approach may be helpful for future studies for the development of targeted therapeutic strategies of recurrent GB.
Supplemental Material
Supplemental material for Physiologic MR imaging of the tumor microenvironment revealed switching of metabolic phenotype upon recurrence of glioblastoma in humans
Supplemental Material for Physiologic MR imaging of the tumor microenvironment revealed switching of metabolic phenotype upon recurrence of glioblastoma in humans by Andreas Stadlbauer, Stefan Oberndorfer, Max Zimmermann, Bertold Renner, Michael Buchfelder, Gertraud Heinz, Arnd Doerfler, Andrea Kleindienst and Karl Roessler in Journal of Cerebral Blood Flow & Metabolism
Footnotes
Authors' contributions
AS, GH, AD, MB, SO, and KR conceived the study. AS, AK, SO, BR, and MZ involved in analysis of data. AS and MZ contributed to the development of the software tools for calculation of MRI biomarkers. AK, AS, GH, AD, SO, BR, and KR involved interpretation of data. AS, GH, and SO contributed to acquisition of data. All authors reviewed the manuscript critically for intellectual content, and read and approved the final manuscript.
Funding
The author(s) disclosed receipt of the following financial support for the research, authorship, and/or publication of this article: This work was supported by the German Research Foundation (Deutsche Forschungsgemeinschaft DFG; Grant Numbers STA 1331/3-1 and DO 721/9-1) and by the ELAN program (Erlanger Leistungsbezogene Anschubfinanzierung und Nachwuchsfó rderung; Grant Number 14-05-21-1-Stadlbauer).
Declaration of conflicting interests
The author(s) declared no potential conflicts of interest with respect to the research, authorship, and/or publication of this article.
References
Supplementary Material
Please find the following supplemental material available below.
For Open Access articles published under a Creative Commons License, all supplemental material carries the same license as the article it is associated with.
For non-Open Access articles published, all supplemental material carries a non-exclusive license, and permission requests for re-use of supplemental material or any part of supplemental material shall be sent directly to the copyright owner as specified in the copyright notice associated with the article.