
Abstract
Alcoholism is associated with widespread brain structural abnormalities affecting mainly the frontocerebellar and the Papez’s circuits. Brain glucose metabolism has received limited attention, and few studies used regions of interest approach and showed reduced global brain metabolism predominantly in the frontal and parietal lobes. Even though these studies have examined the relationship between grey matter shrinkage and hypometabolism, none has performed a direct voxel-by-voxel comparison between the degrees of structural and metabolic abnormalities. Seventeen alcoholic patients and 16 control subjects underwent both structural magnetic resonance imaging and 18F-2-fluoro-deoxy-glucose-positron emission tomography examinations. Structural abnormalities and hypometabolism were examined in alcoholic patients compared with control subjects using two-sample t-tests. Then, these two patterns of brain damage were directly compared with a paired t-test. Compared to controls, alcoholic patients had grey matter shrinkage and hypometabolism in the fronto-cerebellar circuit and several nodes of Papez’s circuit. The direct comparison revealed greater shrinkage than hypometabolism in the cerebellum, cingulate cortex, thalamus and hippocampus and parahippocampal gyrus. Conversely, hypometabolism was more severe than shrinkage in the dorsolateral, premotor and parietal cortices. The distinct profiles of abnormalities found within the Papez’s circuit, the fronto-cerebellar circuit and the parietal gyrus in chronic alcoholism suggest the involvement of different pathological mechanisms.
Introduction
Even in the absence of severe neurological complications, chronic alcoholism is accompanied by widespread structural brain damage that has been previously reported using neuropathological examinations, computed tomography (CT) and magnetic resonance imaging (MRI) paradigms.1–3 Previous studies have shown alcohol-related grey matter (GM) volume deficits predominantly in the frontal cortices.3,4 The dorsolateral cortex showed GM shrinkage, reaching up to 20%. 4 The cerebellum is also vulnerable to alcoholism 4 and especially the cerebellar vermis. 5 In addition, chronic alcohol consumption results in reduction of thalamic volume2–4 that co-occurs with volume reduction in the GM of the cerebellar lobules, posterior inferior vermis and parietal cortex. 2 To a lesser extent, GM shrinkage was found in the cingulate cortex,3,4 hippocampus 6 and mammillary bodies 7 of alcoholic patients.
Most of those regions are nodes of two brain networks especially affected in chronic alcoholism: the fronto-cerebellar circuit and the Papez’s circuit. The fronto-cerebellar circuit includes two parallel closed loops passing through the thalamus and the pons: the motor loop that connects the cerebellar vermis (IV, V, VI) and the motor cortex (BA 6); and the executive loop that involves the cerebellar neocortex (lobules VII, VIII, Crus I and Crus II) and the prefrontal cortex (BA 9 and 46). 8 The Papez’s circuit, involved in episodic memory, includes the cingulate cortex, hippocampus and parahippocampal gyrus as well as the mammillary bodies and the thalamus. The thalamus is therefore shared by the two circuits in which it plays a key role. 9 The alteration of the nodes of the fronto-cerebellar and Papez’s circuits in chronic alcoholism is in agreement with the neuropsychological studies that have shown executive and motor impairments as well as episodic memory deficits in alcoholic patients.5,10
The study of brain glucose metabolism has received limited attention in alcoholism. The few PET investigations using 18 F-2-fluoro-deoxy-glucose (FDG) revealed that alcoholic patients had lower uptake of glucose, reaching up to 20%, 11 when analysed in the global brain.12,13 Hypometabolism was found particularly in the parietal lobe 12 and the frontal cortices extending to the anterior cingulate cortex.1,11,13 In a cross-sectional study, alcoholic patients with clinical diagnosis of alcoholic cerebellar degeneration (ACD) characterised by nystagmus, ataxia of lower limbs and cerebellar atrophy were compared with alcoholic patients without neurological complications and control subjects (CS). 1 Although lower glucose metabolism was found in the medial frontal cortex of both patient groups compared to controls, only those with ACD had hypometabolism in the superior vermis. None of the alcoholic patients without ACD had metabolic abnormalities in cerebellar regions.
The combination of an MRI and PET examination within the same sample of subjects enables the direct comparison of structural and metabolic abnormalities. By putting both imaging modalities on the same measurement scale (z-scores) and adjusting for difference in resolution between modalities (differential smoothing; 14 method described in the ‘Materials and methods’ section), it is possible to compare structural and metabolic deficits, as already done in several other studies15,16 and even in other imaging modalities (AV4516). Such an approach provides a deeper understanding of the different brain alterations and the pathological mechanisms underlying the disease as conducted in Alzheimer’s disease (AD), semantic dementia 15 and Korsakoff’s syndrome. 17 In AD, two distinct profiles were found: (a) atrophy exceeding hypometabolism in medial temporal lobe and hippocampus and (b) more severe hypometabolism than GM atrophy in posterior associative areas that may have precede structural changes. 16 Regional variations in the hierarchy and relationship between atrophy and hypometabolism in AD have been reported to probably reflect the differential involvement of region-specific pathological (or protective) mechanisms. 16 AD-related changes in glucose metabolism are not redundant with GM structural changes: both imaging modalities provide at least partly complementary information about brain integrity.
The few studies that have conducted concomitant MRI and PET examinations in order to assess the relationship between cortical shrinkage and hypometabolism in alcoholic patients revealed discrepancies in the results. Dao-Castellana et al. 11 found that the hypometabolism was not related to cortical shrinkage when considered in the entire brain. This finding could suggest that metabolic dysfunction occurs before GM shrinkage, in agreement with a study showing hypometabolism in alcoholic patients without brain atrophy. 12 Other studies reported a relationship between global brain metabolism and volume in alcoholic patients,1,13 suggesting, according to the authors, a causal relationship between cortical atrophy and brain metabolism or vice versa. 13
Such discrepancies may be explained by several methodological issues. First, the above-mentioned studies used regions of interest (ROI) with different templates. Measures of global brain metabolism and cortical volumetry were obtained by averaging the value of glucose uptake and GM volume for all the ROIs. The quantification of the global hypometabolism and cortical shrinkage was thus influenced by the choice of the ROIs and did not reflect glucose metabolism or brain volume in other areas of the brain-like sub-cortical structures and the cerebellum. These regions cannot be disregarded, especially when they are known to play a key role in the mechanism of the alcohol-related pathology. Second, brain glucose uptake has considerable inter-individual variations that can be corrected using quantitative normalisation. In the previous studies conducted in alcoholism, PET images were normalised using the radioactivity in plasma12,13 or the global brain metabolic uptake when the arterial function was not measured.1,11 Because of the hypometabolism in alcoholic patients, 11 normalising by this global brain metabolic measure can lead to artificially increased metabolism in altered regions. 18 Last, the PET camera has limited resolution and is hence exposed to partial volume effect (PVE) that results in blurring and therefore underestimation of regional activity, particularly in small structures or those with volume deficits where the size is less than twice the full-width half maximum of the scanner’s response to a point source or point spread function. Since the previous FDG–PET studies conducted in alcoholics have not corrected for PVE, the metabolic abnormalities observed in patients could reflect methodological issues rather than pathological effects. The impact of PVE and its correction have been widely reported in the literature, especially in conditions for which the pathology is associated with structural brain changes 19 as it is the case in alcoholism.
To sum up, while previous studies have combined structural MRI and FDG–PET examinations in alcoholics,11,13 none has performed a direct and quantitative comparison between the severity and the regional distribution of the structural and metabolic brain abnormalities. In addition, those studies used an ROI approach that provides a sub-optimal description of brain damage and may have missed abnormalities in structures not a priori considered. One of the advantages of a voxel-based approach is that it makes no a priori assumption regarding the boundaries of an anatomical region and thus offers a less biased way of analysing the whole brain. The goals of the present study are therefore (a) to describe the profile of GM shrinkage and abnormal glucose metabolism in alcoholic patients using a voxel-by-voxel approach and (b) to make a direct comparison between the patterns of GM shrinkage and hypometabolism.
Materials and methods
Participants
Seventeen alcoholic patients and 16 controls subjects were included in the present study. None of the participants had a history of neurological pathology, endocrinal or other infectious (diabetes, HIV and hepatitis as confirmed by the blood analysis), mental illness (psychiatric disorders, depression) Beck Depression Inventory; BDI-II, 20 or other forms of substance misuse or dependence (except tobacco) and none were under psychotropic medication that might have had an effect on their cerebral or cognitive functioning. All participants underwent a neuropsychological examination assessing intellectual abilities, 21 global cognitive function, 18 episodic memory (the French version of the Free and Cued Selective Reminding Test FSCRT, 22 working memory (visuospatial spans of the MEM III, 23 executive functions (Modified Card Sorting Test) (MCST) 24 and ataxia (Walk-a-Line Ataxia Battery 25 ). All participants were informed about the study approved by the local ethics committee of the Caen University Hospital (CPP Nord Ouest III no. IDRCB: 2011-A00495-36) prior to their inclusion and provided their written informed consents. The study was carried out in line with the Declaration of Helsinki (1964).
Main features of the participants.
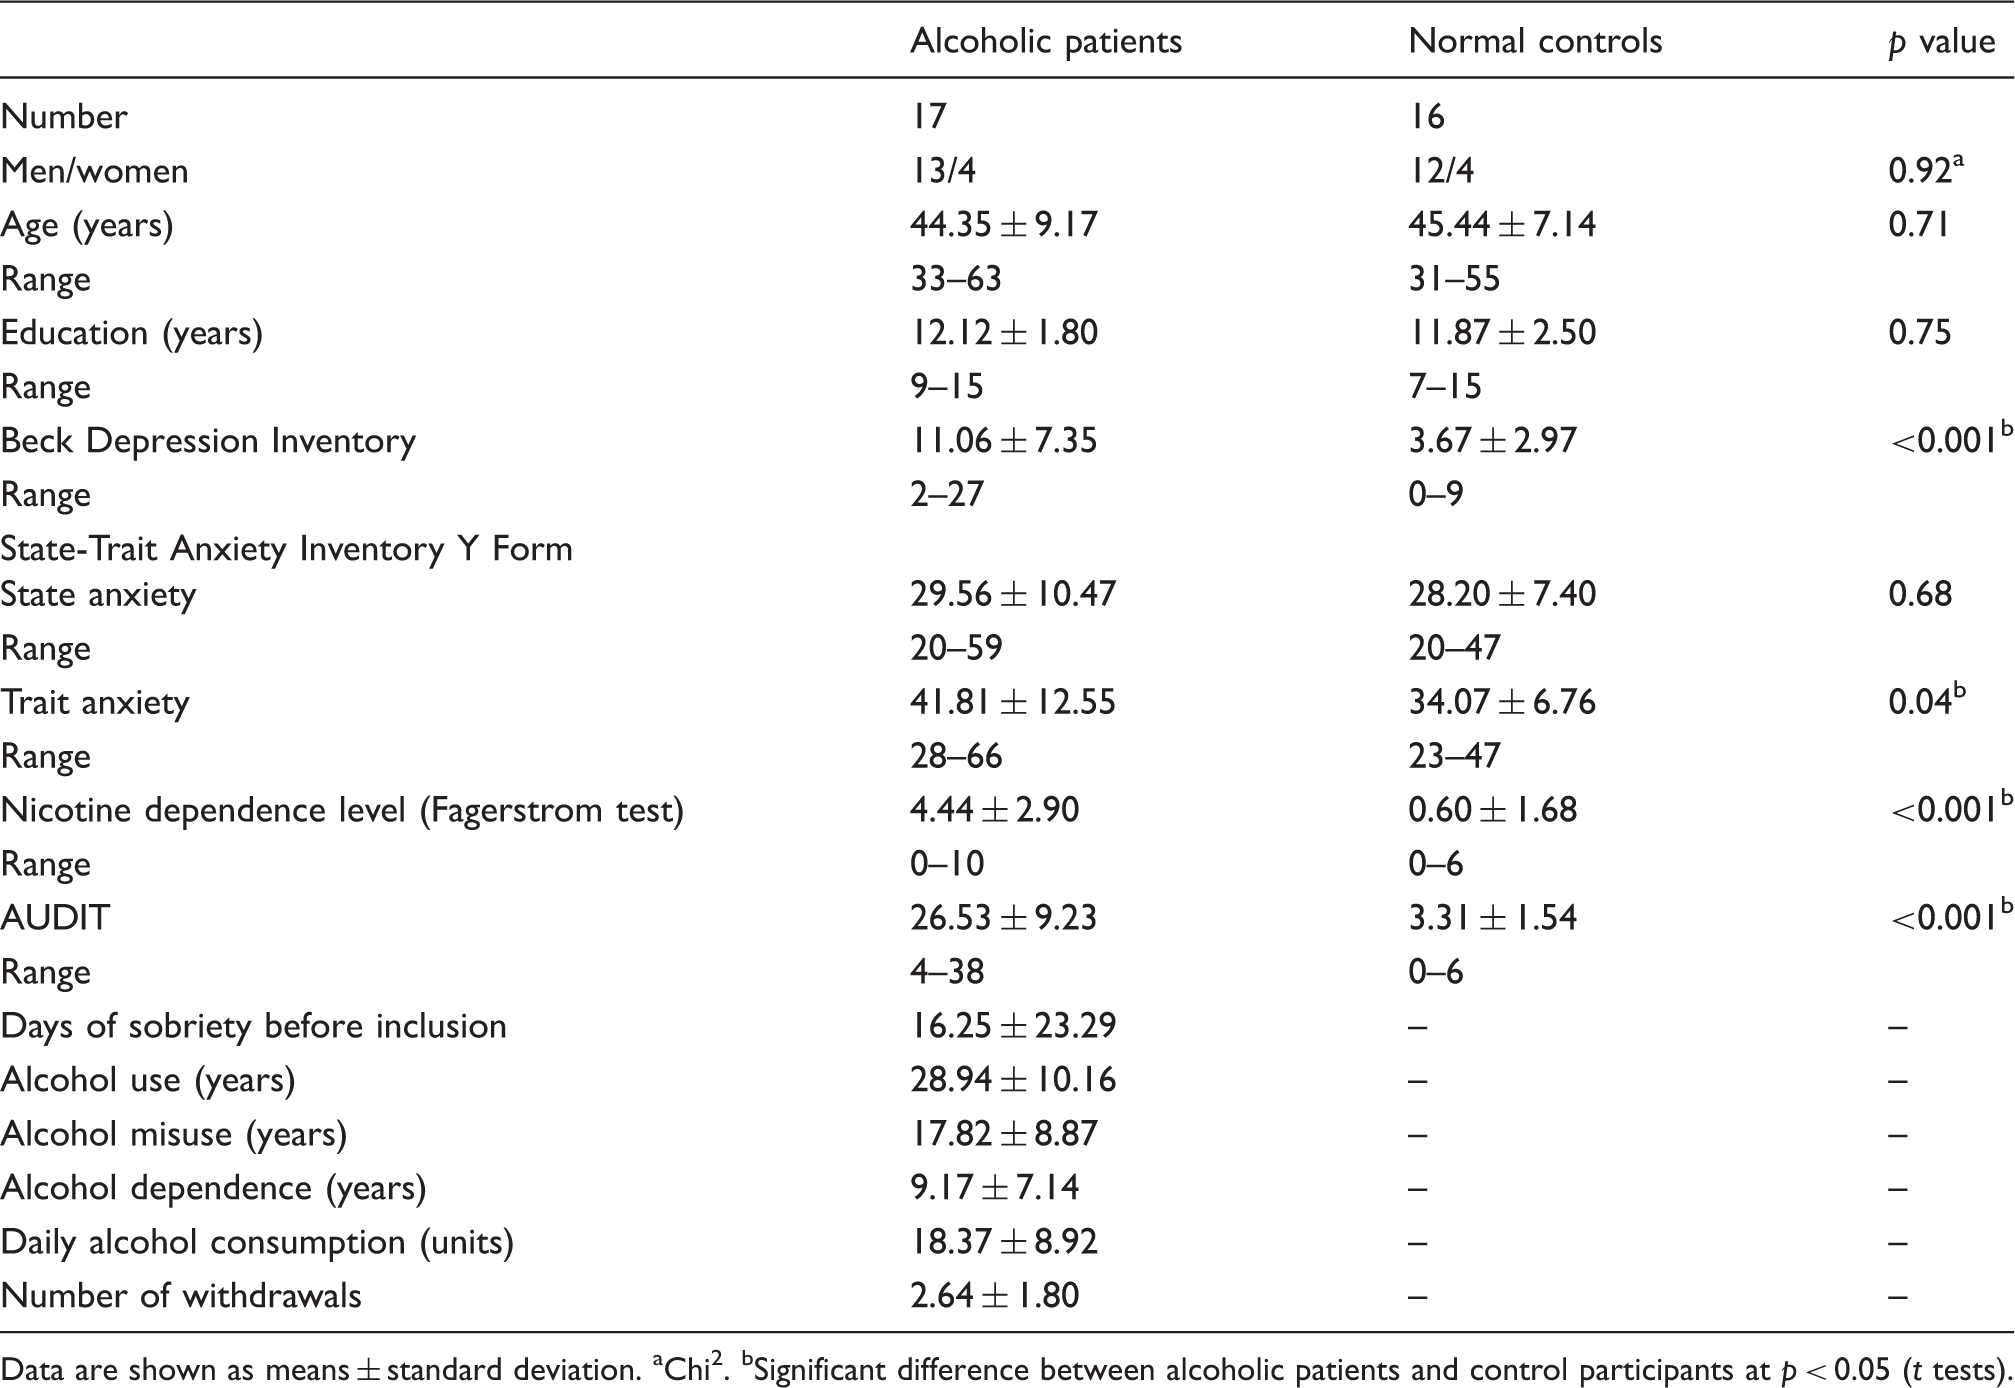
Data are shown as means ± standard deviation.
Chi 2 .
Significant difference between alcoholic patients and control participants at p < 0.05 (t tests).
Cognitive profile of the participants.
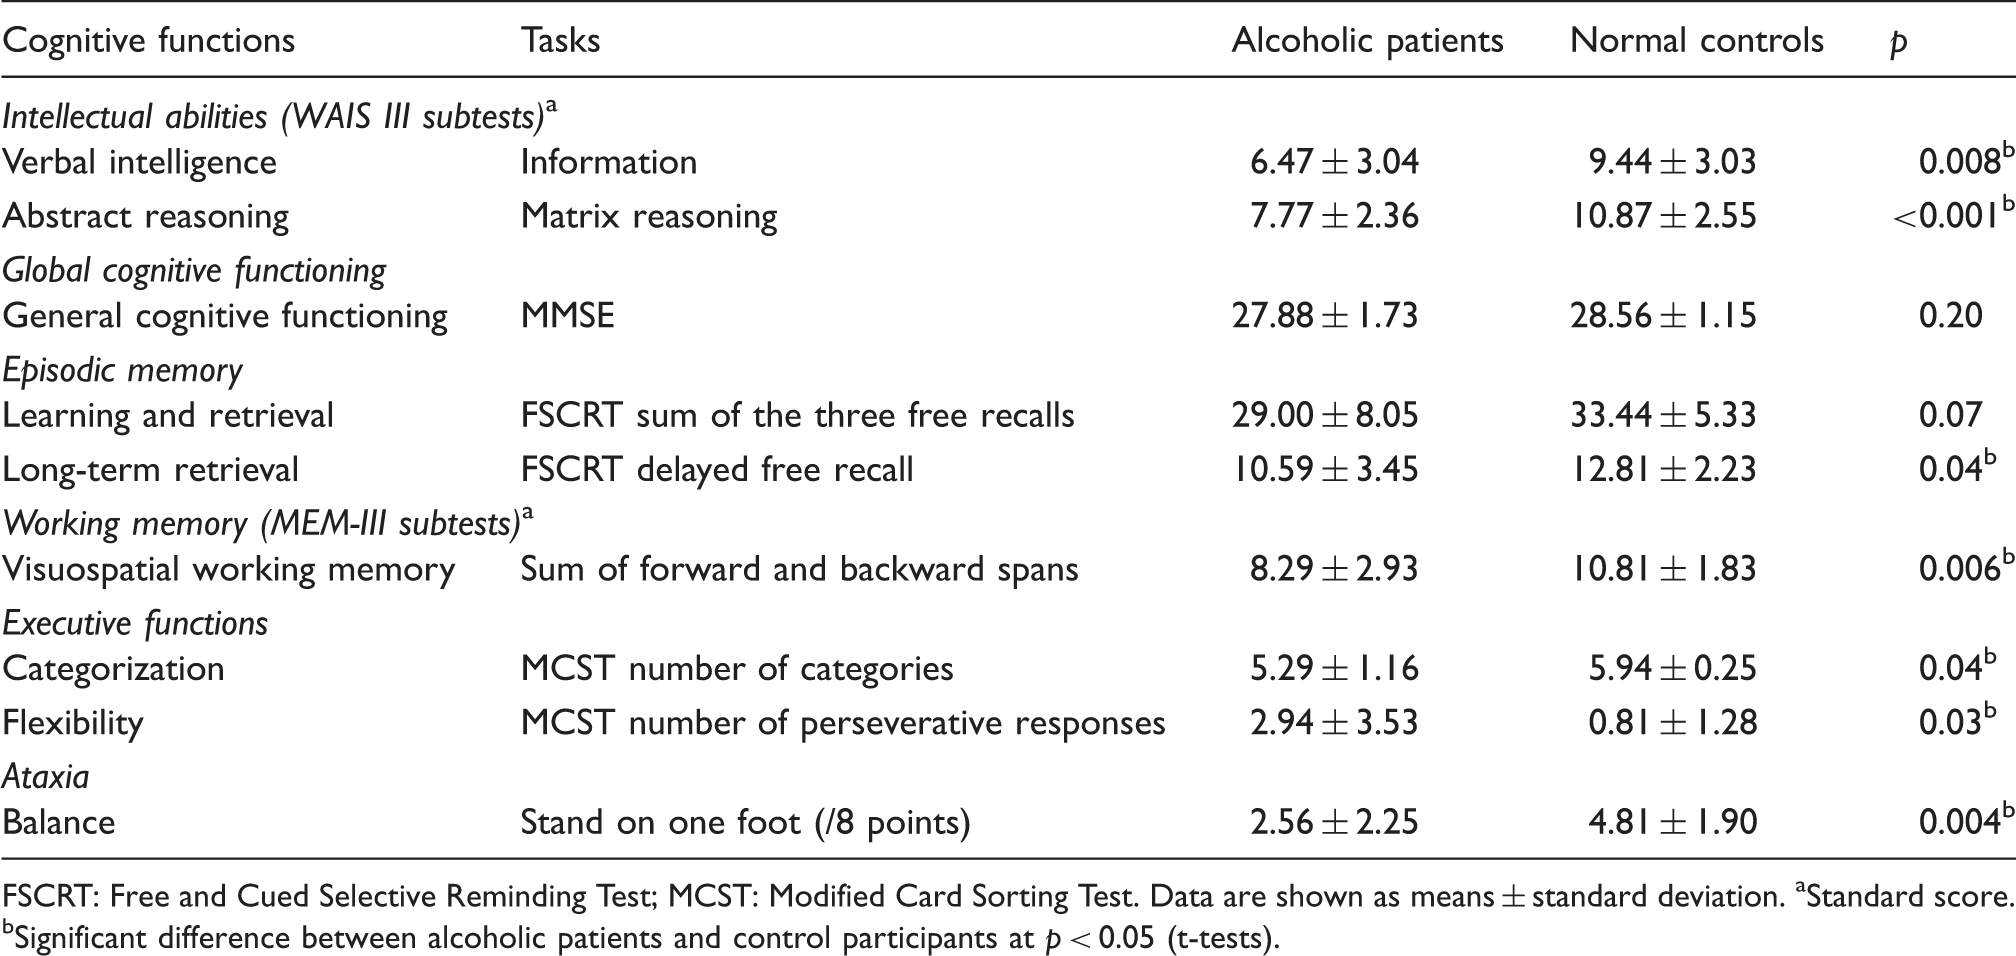
FSCRT: Free and Cued Selective Reminding Test; MCST: Modified Card Sorting Test.
Data are shown as means ± standard deviation.
Standard score.
Significant difference between alcoholic patients and control participants at p < 0.05 (t-tests).
Age, education (years of schooling), depression (Beck Depression Inventory 20 ) and anxiety scores (State-Trait Anxiety Inventory (STAI 27 ) for adults with two forms Y–A for ‘state anxiety’ and Y–B for ‘trait anxiety’) as well as nicotine dependence level (Fagerstrom Test 28 ) are reported in Table 1. The neuropsychological examination (performances reported in Table 2) revealed lower intellectual abilities in alcoholics compared with controls but a preservation of general cognitive functioning, likely due to the lack of sensitivity of the MMSE 18 in chronic alcoholism. Alcoholic patients exhibited deficits in executive functioning, visuospatial working memory, long-term memory and ataxia.5,10 This profile is consistent with that reported in previous studies in which alcoholic patients ranged from mild-to-moderate to severe impairments. 29
Brain imaging data acquisition
MRI data
For each subject, a high-resolution T1-weighted anatomical image was acquired on a Philips Achieva 3T scanner using a three-dimensional fast-field echo sequence (sagittal; repetition time, 20 ms; echo time, 4.6 ms; flip angle, 10°; 180 slices; slice thickness, 1 mm; field of view, 256 × 256 mm2; matrix, 256 × 256).
PET data
Each subject also underwent a PET examination within days of the MRI examination. Data were acquired using a Discovery RX VCT 64 PET-CT scanner (GE Healthcare) with a resolution of 3.76 × 3.76 × 4.9 mm3 and axial field of view of 157 mm. Subjects had fasted for at least six hours before scanning. To minimise anxiety, the PET procedure was explained in detail beforehand. The head was positioned on a headrest relative to the canthomeatal line and gently restrained with straps. FDG uptake was measured in the resting condition, with eyes closed, in a quiet and dark environment. Subjects were told to avoid focusing on any specific mental process during scanning. A catheter was inserted into a vein of the arm to inject the radiotracer. About 3–5 mci of FDG were injected as a bolus at time 0, and a 10-min data acquisition period started 50-min post-injection that was preceded by the acquisition of a low-dose CT transmission scan (140 kV, 10 mA). Forty-seven planes were acquired with septa out (3D listmode data acquisition), and the image reconstructed with Ordinary Poisson—Ordinary Subset Expectation Maximisation algorithm (OP–OSEM, 21 subsets, 2 iterations) using a voxel size of 1.95 × 1.95 × 3.2 mm (xyz). During data acquisition, head motion was continuously monitored with, and whenever necessary corrected according to, laser beams projected onto ink marks drawn on the forehead. Under the current clinical setup, and in the absence of a motion detection and quantification device, movements could not be corrected for at sinogram level. Only one 10-min frame was acquired, and manufacturer’s software and limitations did not allow further splitting of the listmode data for potential frame-by-frame realignment.
Pre-processing of brain imaging data
The data pre-processing and transformation procedures are illustrated in Figure 1.
Schematic representation of the procedures for MRI and PET data transformations and analyses: (a) procedures for assessing GM structural abnormalities and glucose hypometabolism in the alcoholic patients; (b) procedure for the direct comparison between these two patterns of abnormalities.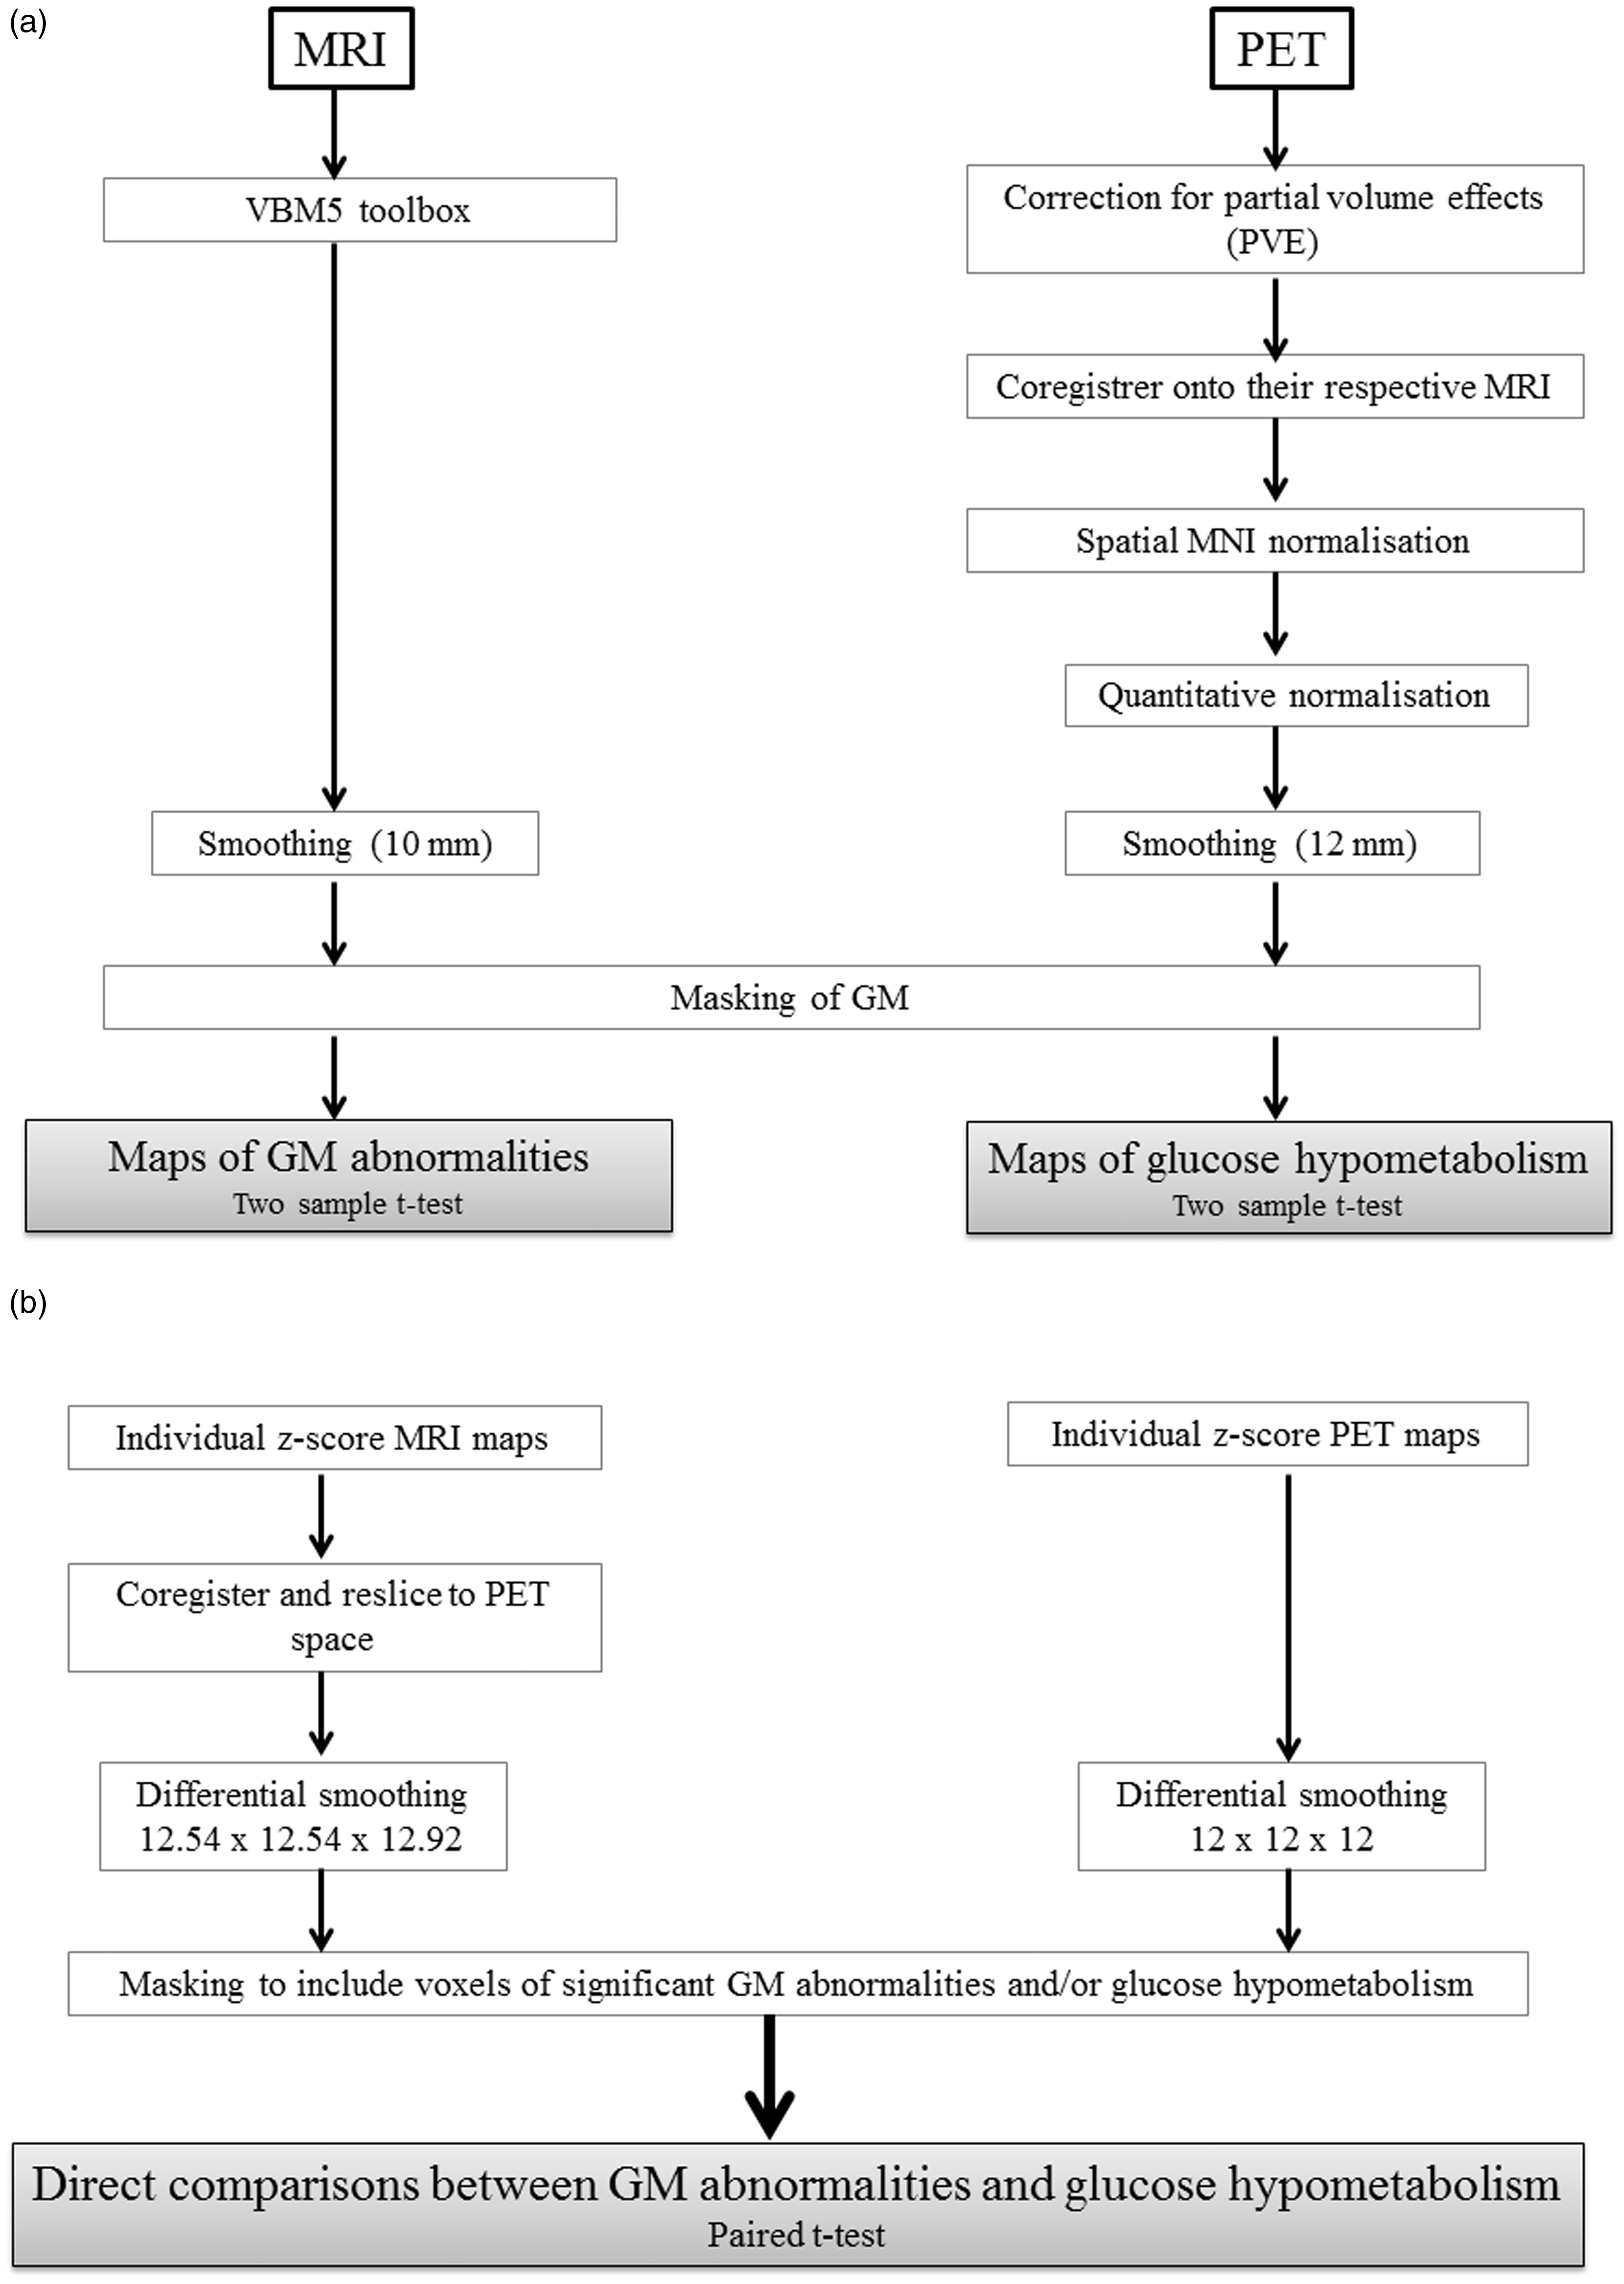
MRI data
MRI datasets were pre-processed using the VBM5 toolbox (http://dbm.neuro.uni-jena.de/vbm/vbm5-for-spm5/) implemented in Statistical Parametric Mapping 5 software (SPM5; Wellcome Department of Cognitive Neurology, Institute of Neurology, London, UK). Briefly, raw MRI data were spatially normalized into the Montreal Neurological Institute (MNI) space (voxel size = 1 mm3; matrix = 156 × 189 × 157) and segmented into GM, white matter (WM) and cerebrospinal fluid (CSF). The normalised GM images were modulated by the Jacobian determinants to correct for non-linear warping only, so that the resulting brain volumes were corrected for brain size.
PET data
The PET data were first corrected for CSF and WM PVEs, using the voxel-by-voxel ‘modified Müller-Gartner’ method described in detail in Quarantelli et al. 30 and already used in our laboratory.16,17 Using SPM5, the PVE-corrected PET data set were then co-registered (rigid-body co-registration) onto their respective native MRIs and normalised into the MNI space by reapplying the normalisation parameters estimated from the VBM protocol described above (final voxel size: 2 mm3; matrix = 79 × 95 × 79).
When the direct and absolute quantification of glucose metabolism cannot be conducted due to the absence of arterial function measurement, as in the present study, a reference region must be chosen to control the inter-individual variations in PET measurements 31 (i.e. for semi-quantitative normalisation). As detailed in the ‘Introduction’ section, previous FDG–PET studies conducted in alcoholic patients have normalised PET datasets using the global brain metabolic uptake as a reference.1,11 The choice of an inappropriate region may cause an artificial increase of metabolism in altered regions. 32 According to Yakushev et al., 33 an appropriate reference area should fulfil several criteria: activity in the reference region should be (a) unaffected (or least affected) by the disease of interest, (b) minimally susceptible to external physiological stimuli and (c) stable both in controls and patients, i.e. regional tracer uptake should not vary significantly across healthy subjects.
Regarding criteria 1, we thus first identified the brain region with the best-preserved FDG uptake value compared with CS. In accordance with Gilman et al.,
1
metabolism in most of the cerebellum (lobules III, IV, V and VII, VIII, IX, X and vermis I, II, III and VIII, IX, X) was not affected in alcoholic patients. Because FDG uptake was measured in the resting condition, with eyes closed, in a quiet and dark environment, one cannot expect metabolism in the cerebellum to have been affected by external physiological stimuli (criteria 2). The present study aimed at examining metabolism in the fronto-cerebellar circuit, which includes specific cerebellar regions (vermis IV, V, VI and cerebellar neocortex VII, VIII, Crus I and Crus II).
8
In order not to bias the results of our subsequent analyses, we excluded those cerebellar from the reference region and only included the cerebellar lobules III, IX and X for the semi-quantitative normalisation. Since the variability of the tracer uptake in the reference area (in both patient and healthy subjects) is the one of the key factors that determines the power of statistical tests on scaled images,
33
coefficients of variation (COV = standard deviation/mean) were computed for metabolism in the GM whole brain,1,11 the post-central gyrus as used in previous studies conducted in Korsakoff’s patients
34
and in our proposed cerebellar reference region for semi-quantitative normalisation (cerebellum lobules III, IX and X). The two groups (alcoholic patients vs CS) × three masks (GM whole brain, post-central gyrus and cerebellum) ANOVA conducted on the coefficients of variation revealed significant effects of group (F(1,31) = 18.18; p < 0.001), mask (F(2,62) = 66.32; p < 0.001) and interaction between group and mask (F(2,62) = 10.45; p < 0.001). Tukey’s post hoc indicated (a) smaller COV in CS than alcoholic patients whatever the mask, (b) smaller COV in the cerebellum than in both the GM whole brain and post-central gyrus that did not differ between each other and (c) similar variability in alcoholic patients and CS in the cerebellum (but between group differences for the two others masks, p < 0.05, criteria 3). Supplementary analyses confirmed that the choice of the cerebellum (lobules III, IX and X) reference region yielded more reliable results than GM whole brain or post-central gyrus (Figure 2).
Histograms showing the distribution of FDG uptake in the whole brain for all subjects with controls in red and patients in blue (a) without quantitative normalisation; normalised with (b) grey matter whole brain, (c) post-central gyrus as used in KS patients using the method of Yakushev et al.
33
and (d) our proposed cerebellar region. X-axis represents the voxel intensities within the image and is in kBq/ml for (a) and arbitrary units for (b), (c) and (d). Y-axis represents the frequency (the number of voxels) at which those intensities occur within the image. It seems that normalising using the GM whole brain causes an artificial increase in the area under the blue curves compared to the red ones. The same trend is observed for the post-central gyrus. A general increase in FDG signal in patients goes against what has been observed in previous studies where absolute metabolic values were calculated, suggesting that these quantitatively normalised measurements are artefactual. When using the proposed cerebellar mask as a reference region, the area under the blue curves is smaller than under the red ones. The intensity peaks are also more shifted to the right in the red curves, indicating a better separation between patients and controls when using this proposed reference region.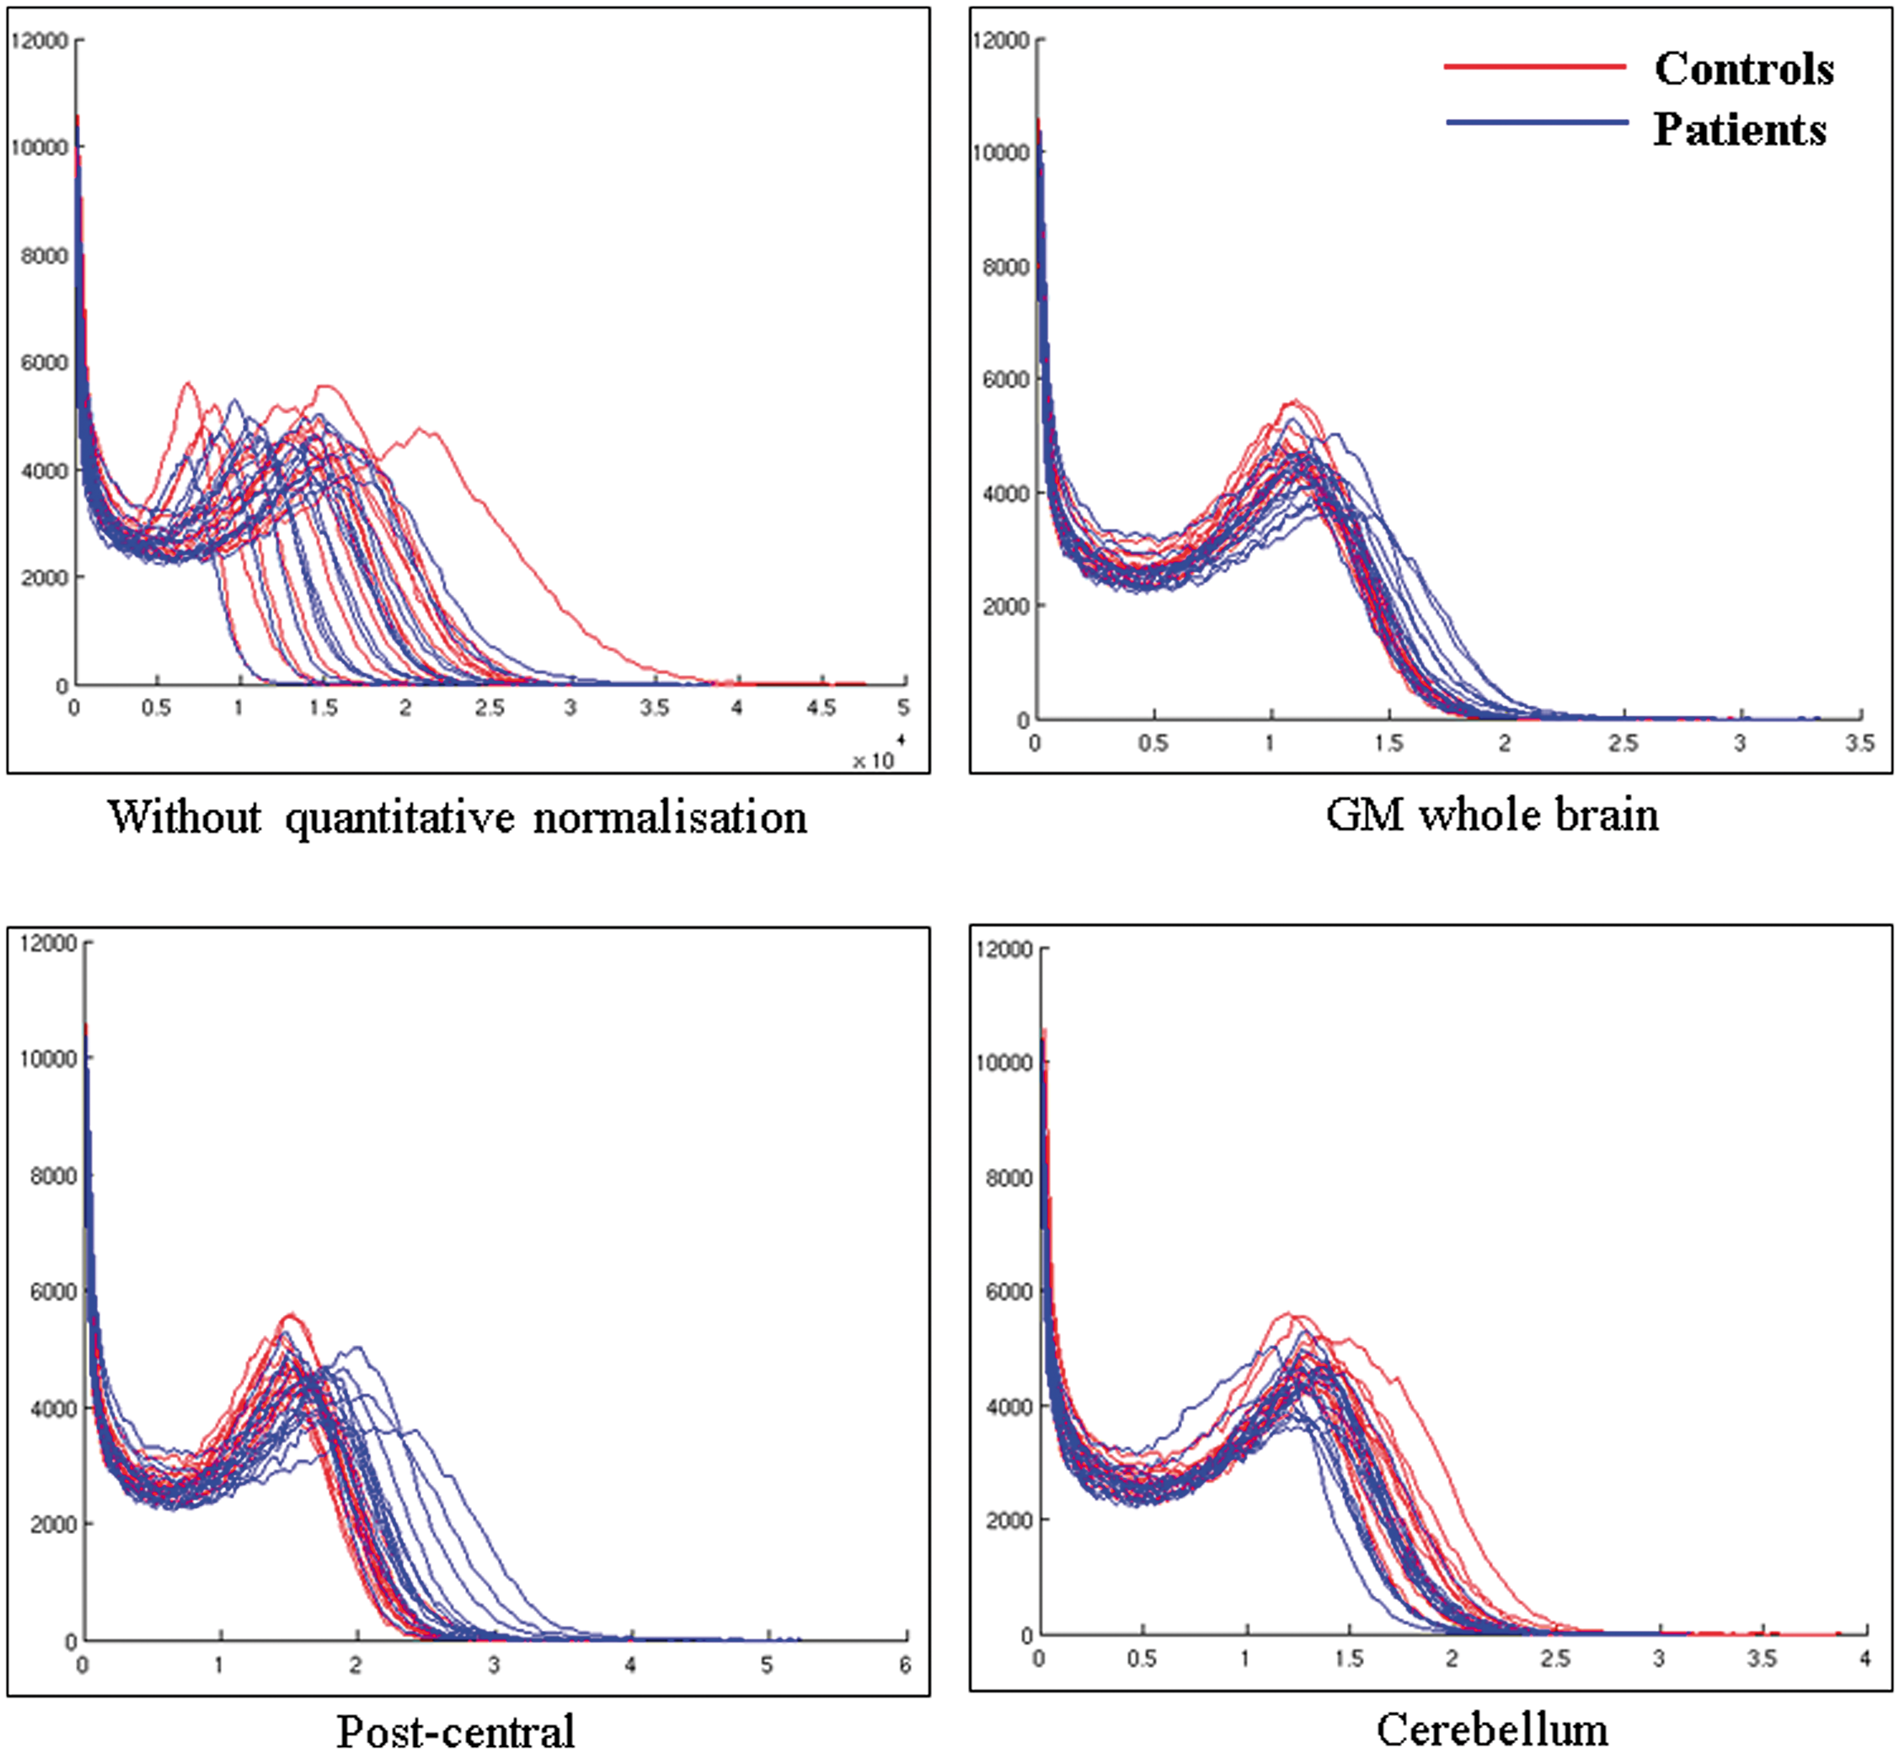
Masking of MRI and PET data
The mask of GM tissue was obtained by averaging the GM images in MNI space of the CS and setting all voxels where GM was greater than both WM and CSF to 1 (i.e.
Direct comparison between GM abnormalities and glucose hypometabolism
The masked GM and PET images were used to create z-score maps
Since the two data sets had different original spatial resolutions, the MRI data were coregistered and resliced to PET space in order to obtain images with the same dimensions.
Statistical analysis
Two complementary statistical analyses were performed: (a) between-group comparisons of GM volume and glucose metabolism (Figure 1(a)); (b) direct comparisons between GM structural abnormalities and glucose hypometabolism in alcoholic patients (Figure 1(b)).
Between-group comparisons
In order to determine the pattern of GM structural abnormalities and glucose hypometabolism in the alcoholic group, two independent analyses with the SPM5 two-sample t-test were performed. Two resulting maps of statistically significant GM structural and metabolic abnormalities in patients relative to controls were obtained.
Direct comparison between GM abnormalities and glucose hypometabolism
Direct comparisons between the degree of GM structural abnormalities and glucose hypometabolism were performed using the individual MRI and PET z-score maps. Our analyses included only voxels with significant GM shrinkage and/or FDG abnormalities observed from the two-sample t-tests performed above. The masked z-score images were then entered in an SPM paired t-test analysis with one group (alcoholic patients) and two images per subject, i.e. the masked MRI and PET z-score maps. Both contrasts were assessed (z PET > z MRI and z MRI > z PET) to generate statistical maps reflecting predominant structural abnormalities or glucose hypometabolism.
Smoothing
For the between-group comparisons and in order to blur individual variations in gyral anatomy and increase the signal-to-noise ratio, the MRI and PET data sets were smoothed with a Gaussian kernel of 10 mm and 12 mm, respectively, full width at half maximum.
Regarding the direct comparison, since the two data sets had different original spatial resolutions, a differential smoothing was performed to obtain images of equivalent effective smoothness and thus of identical effective resolution. 35 To this end, a 12.54 × 12.54 × 12.92-mm3 Gaussian kernel was used for the MRI GM data, resulting in an effective smoothness identical to PET data smoothed at 12 mm. 14
Statistical threshold and anatomical localization
All statistical maps were thresholded using a FDR-corrected p < 0.005 with an extend threshold of k = 200 voxels for the MRI data and k = 25 voxels for the PET data (both corresponding to 200 mm3). An FWE-corrected p < 0.05 was also applied in order to highlight the regions that remained significant with a more stringent threshold.
GM anatomical localisation was carried out using the Brodmann atlas, and the automated anatomical labelling software was implemented in SPM5. The findings were verified using the Harvard-Oxford cortical and subcortical structural atlases implemented in FSL (http://fsl.fmrib.ox.ac.uk/fsl/fsl4.0/fslview/atlas-descriptions.html#ho).
Effects of confounding clinical variables
Since clinical (depression, smoking and trait anxiety) and alcohol variables (AUDIT, days of sobriety before inclusion, alcohol use, misuse and dependence as well as daily alcohol consumption and number of withdrawal) differ between the two groups, we assessed the potential effects of these variables on brain macrostructure and metabolism with correlation analyses. To this end, in alcoholic patients, we conducted multiple regression analyses in SPM5 between the clinical and alcohol variables on one hand and MRI and PET data masked to include only voxels with significant abnormalities on the other hand (p < 0.001 uncorrected and k = 200 mm3).
Results
GM abnormalities in alcoholic patients
Compared to CS, alcoholic patients had lower GM volumes in the frontal cortices (particularly orbitofrontal and dorsolateral prefrontal cortex i.e. BA 9 and 46), premotor cortex (BA 6), cingulate cortex (anterior, middle and posterior parts), cerebellum (lobules and vermis IV, V, VII as well as lobules VIII, IX, Crus I and II), temporal gyrus including the hippocampus and parahippocampal gyrus, thalamus, precuneus and parietal gyrus (FDR-corrected, p < 0.005; Figure 3(a)). GM shrinkage in the dorsolateral cortex (BA 9), premotor cortex (BA 6), cingulate cortex (anterior, middle and posterior parts), left thalamus, cerebellum (vermis VII and lobules IV and V) and parahippocampal gyrus remained significant when a more stringent threshold was applied (FWE-corrected, p < 0.05).
Patterns of grey matter structural abnormalities (a) and glucose hypometabolism (b) in alcoholic patients compared to CS. Results are presented using a threshold of FDR-corrected p < 0.005. An insight of the results in the thalamus and cerebellum is provided separately. CS: control subjects.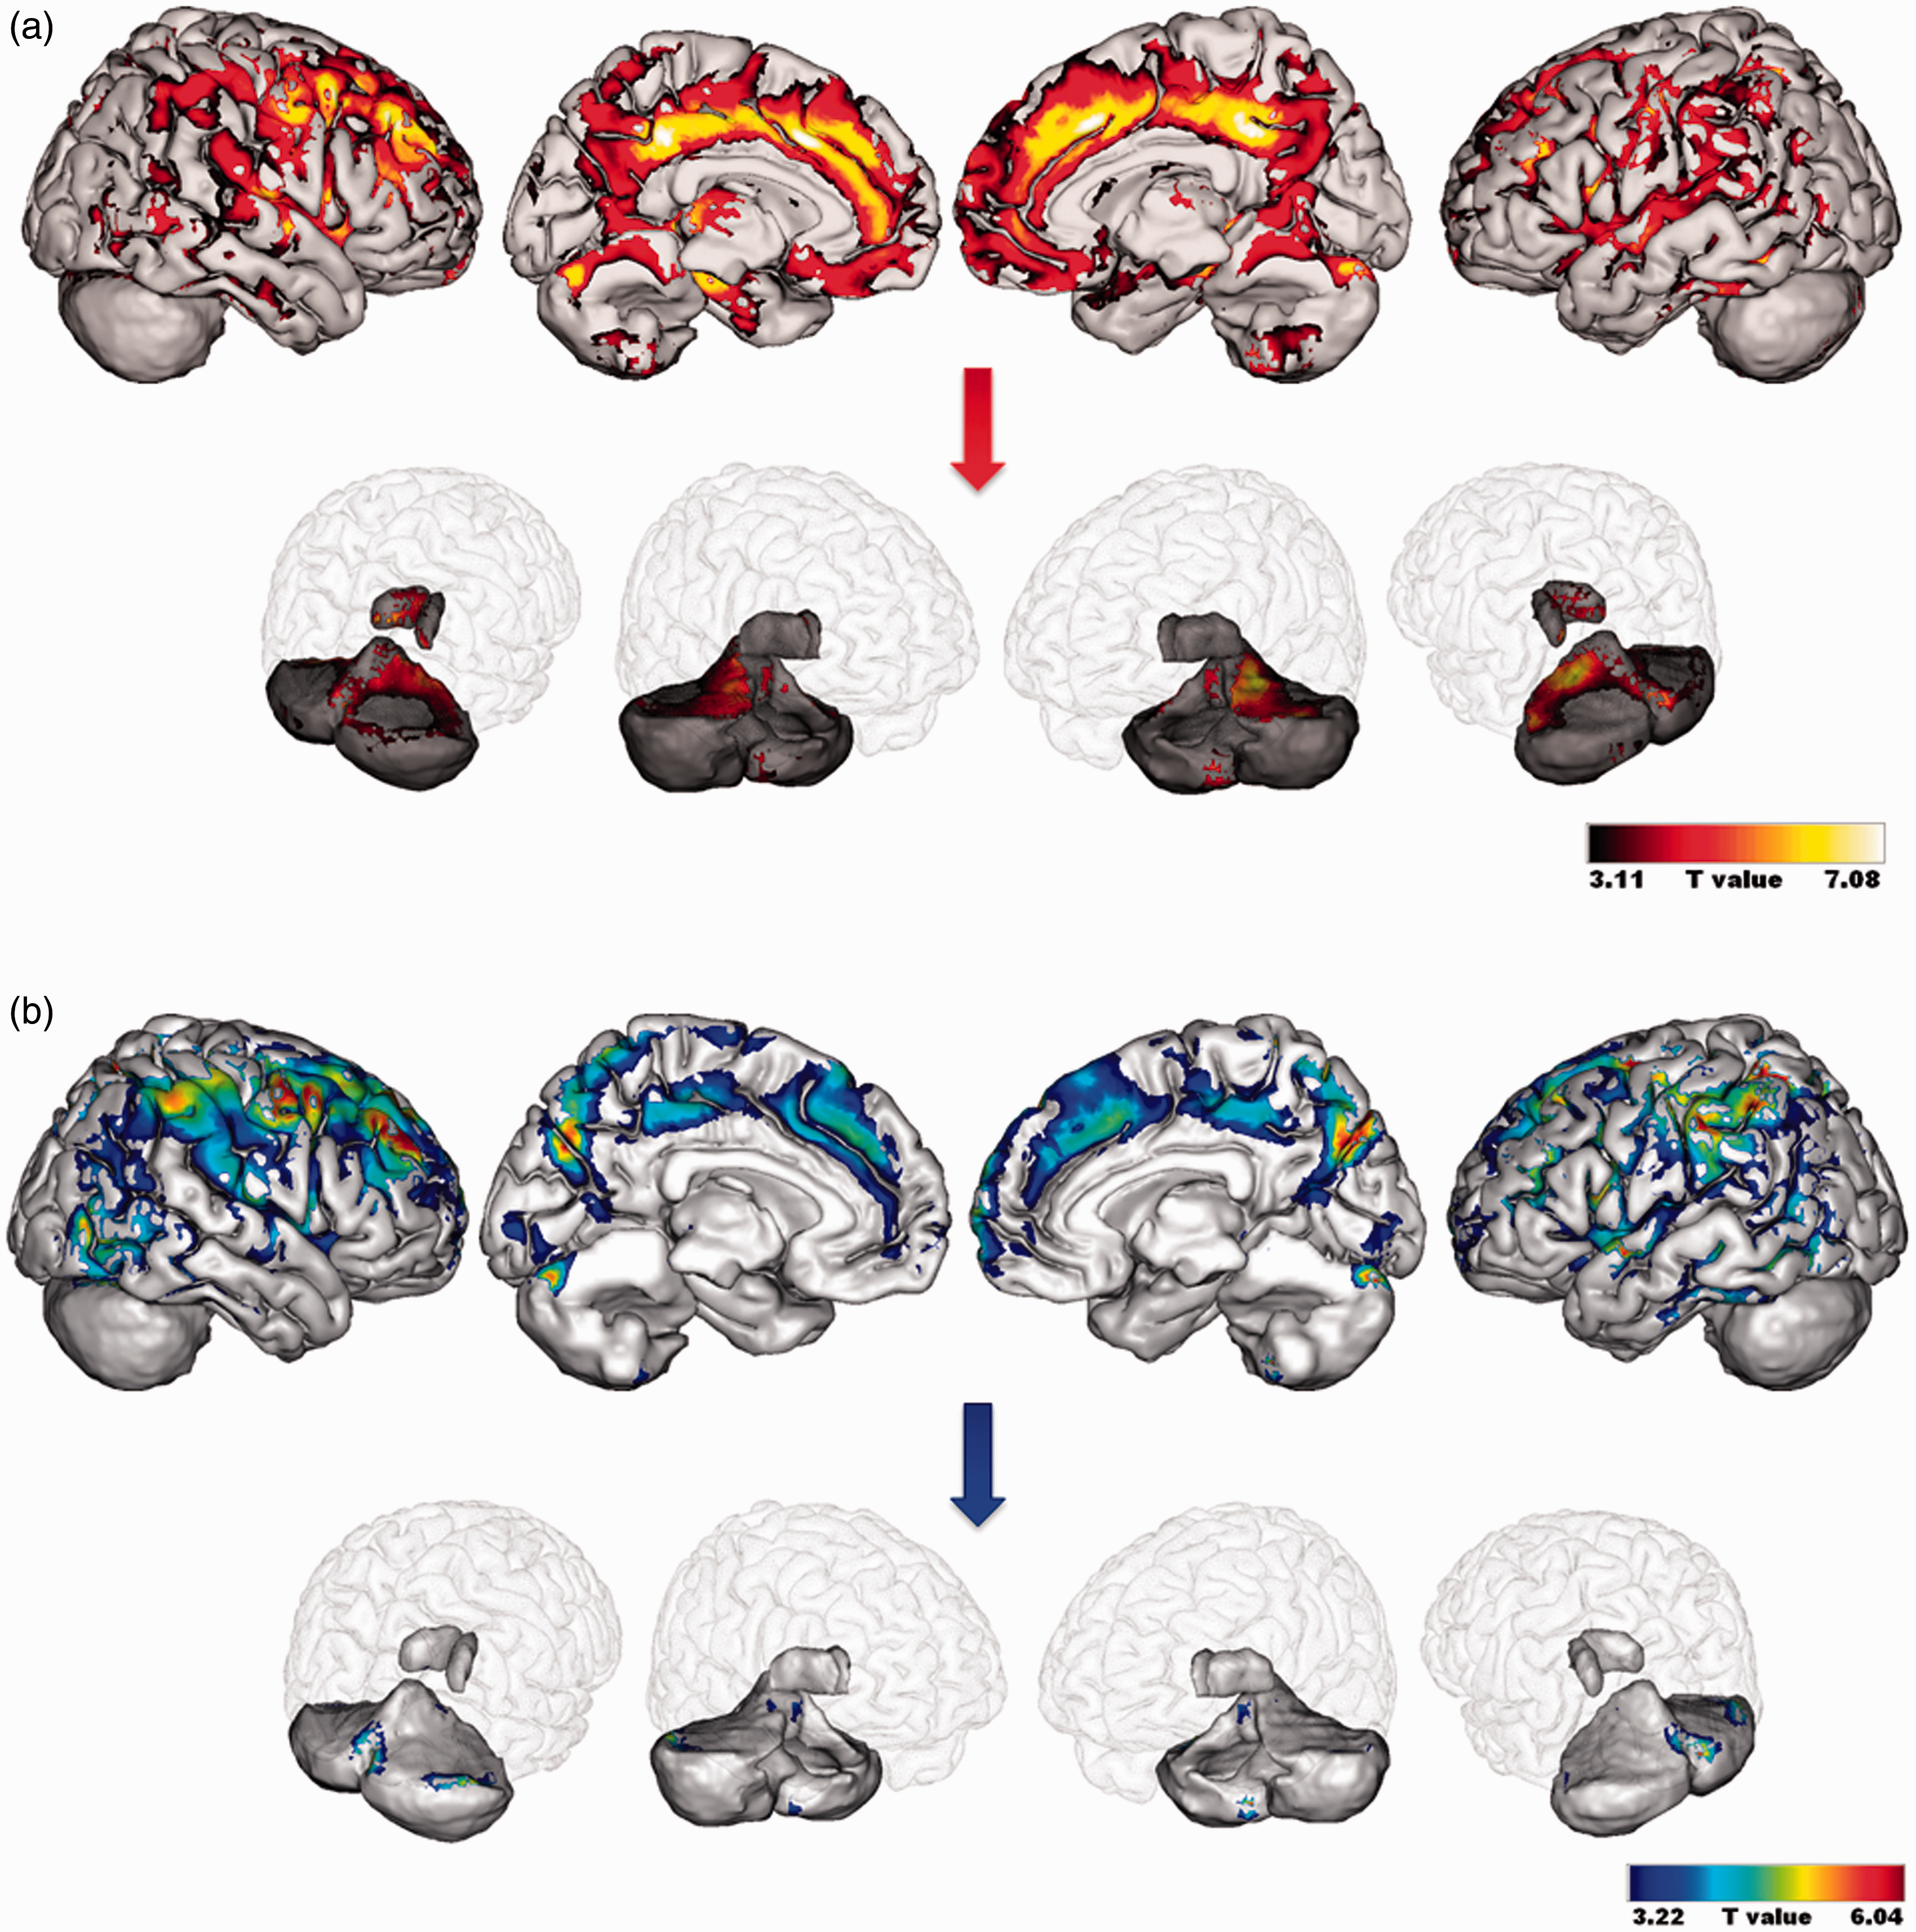
GM hypometabolism in alcoholic patients
Regarding FDG uptake, hypometabolism was found in the premotor cortex (BA 6), dorsolateral prefrontal cortex (BA 9 and 46), cingulate cortex (anterior, middle and posterior parts), cerebellum (vermis III and VII, lobules VI and Crus I), inferior and middle temporal gyri and parietal cortex including cuneus and precuneus (BA 5 and 7) (FDR-corrected, p < 0.005; Figure 3(b)). Lower FDG uptake in the premotor cortex (BA 6), dorsolateral prefrontal cortex (BA 9 and 46) and parietal cortex including cuneus and precuneus (BA 7) was still observed at FWE-corrected p < 0.05.
Direct comparison between GM abnormalities and hypometabolism in alcoholic patients
Anatomical labeling, cluster size, z-score values and MNI coordinates for the direct comparisons between GM abnormalities and hypometabolism in alcoholic patients.
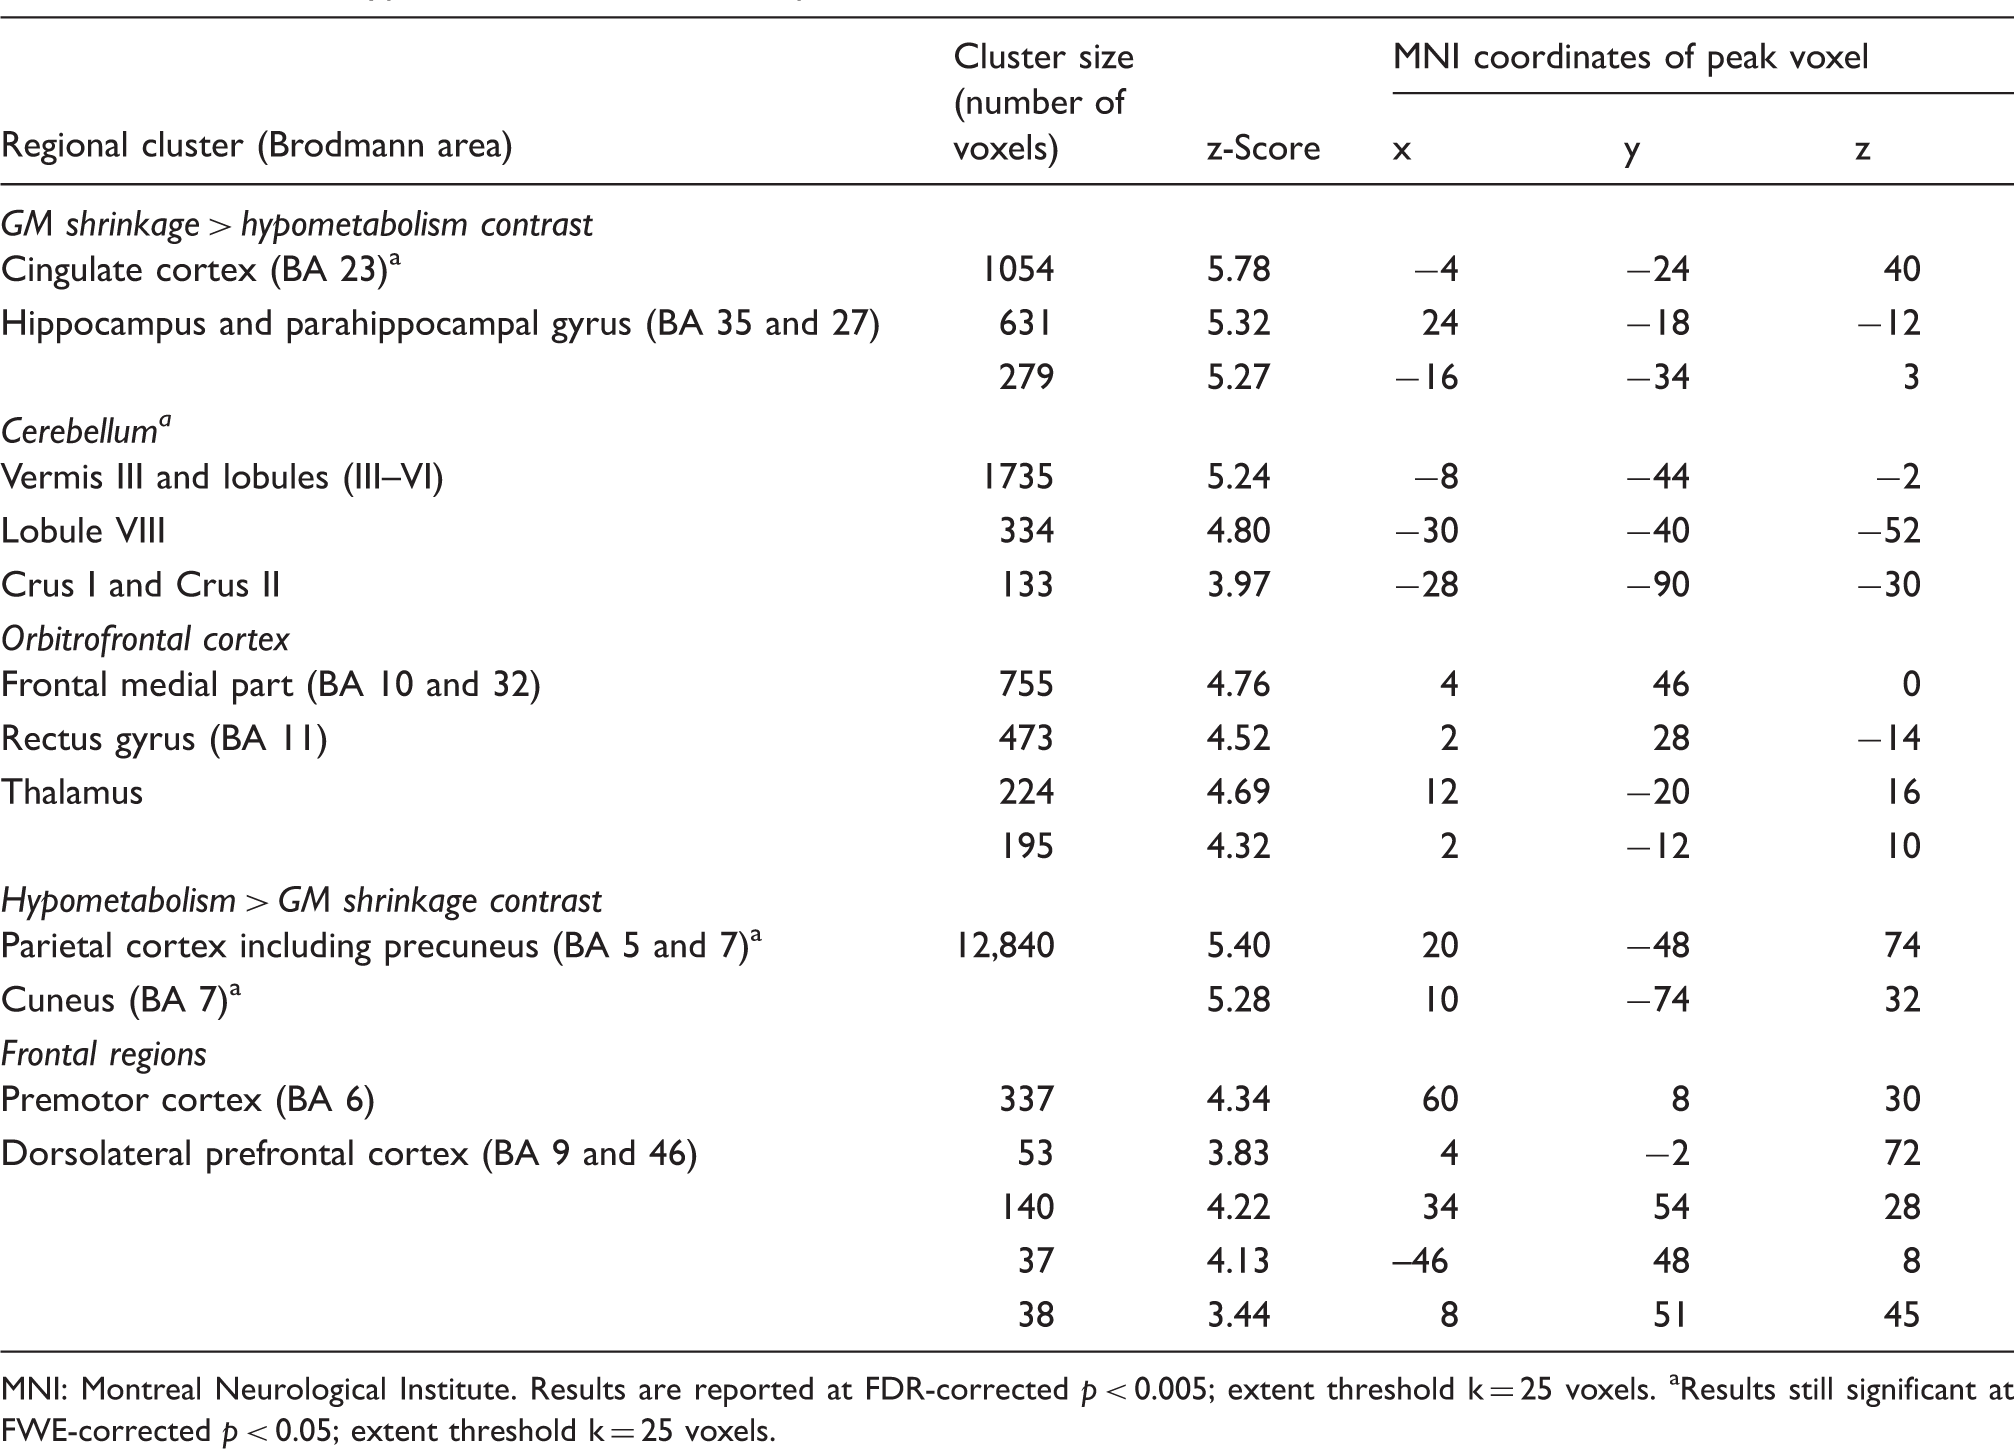
MNI: Montreal Neurological Institute.
Results are reported at FDR-corrected p < 0.005; extent threshold k = 25 voxels.
Results still significant at FWE-corrected p < 0.05; extent threshold k = 25 voxels.
The hypometabolism > GM shrinkage contrast highlighted the parietal gyrus including the cuneus and precuneus (BA 5 and 7), premotor cortex (BA 6) and dorsolateral prefrontal cortex (BA 9 and 46) (Table 3). The hypometabolism remained significantly more severe than the shrinkage in the parietal gyrus (BA 5 and 7) at FWE-corrected (p < 0.05).
To go further, we used the significant clusters from the above voxel-by-voxel comparisons between MRI and PET data (Table 3) to illustrate the profiles of structural abnormalities and hypometabolism. Several profiles were found: more severe GM shrinkage than hypometabolism, GM shrinkage without hypometabolism and more severe hypometabolism than GM shrinkage (see Figure 4). We limited that presentation of the findings to the clusters that belong to the parietal cortex, the fronto-cerebellar circuit and the Papez’s circuit. Thus, the mean z-scores reflecting the volumetric (MRI) and metabolic (PET) values of the clusters within those regions were extracted. Since all the clusters included within each of the following regions (hippocampus and parahippocampal gyrus, cerebellum and frontal regions of the fronto-cerebellar circuit (BA 6, BA 9 and 46); see Table 3) had similar profiles of GM shrinkage and glucose hypometabolism, they were pulled together and plotted under the above-mentioned labels. As depicted in Figure 4(a) and reported in the results above, GM shrinkage was more severe than glucose hypometabolism in the cingulate cortex and the cerebellum (vermis III, lobules III, IV, V, VI, VIII, Crus I and II). In the thalamus, hippocampus and parahippocampal gyrus, GM shrinkage was disproportionately severe compared to a relative preservation of glucose metabolism. Conversely, as depicted in Figure 4(a) and reported in the results above, glucose hypometabolism was more severe than GM shrinkage in the frontal cortices (BA 6, 9 and 46) and the parietal gyrus (BA 5 and 7).
a) Extracted mean z-scores of volumetric and metabolic values of significant clusters from the voxel-by-voxel comparisons between MRI and PET data that belonged to the cerebellum (vermis III and lobules III, IV, V, VI, VIII, Crus I and II), the cingulate cortex, the thalamus, the hippocampus and parahippocampal gyrus as well as to the frontal regions (BA 6, 9 and 46) and parietal cortex (BA 5 and 7). (b) Plots showing correlations between volumetric and metabolic measures (z-scores) within the frontal cortices (left) and parietal cortex significant clusters (right, significant rBP correlations at p < 0.008 after Bonferroni correction).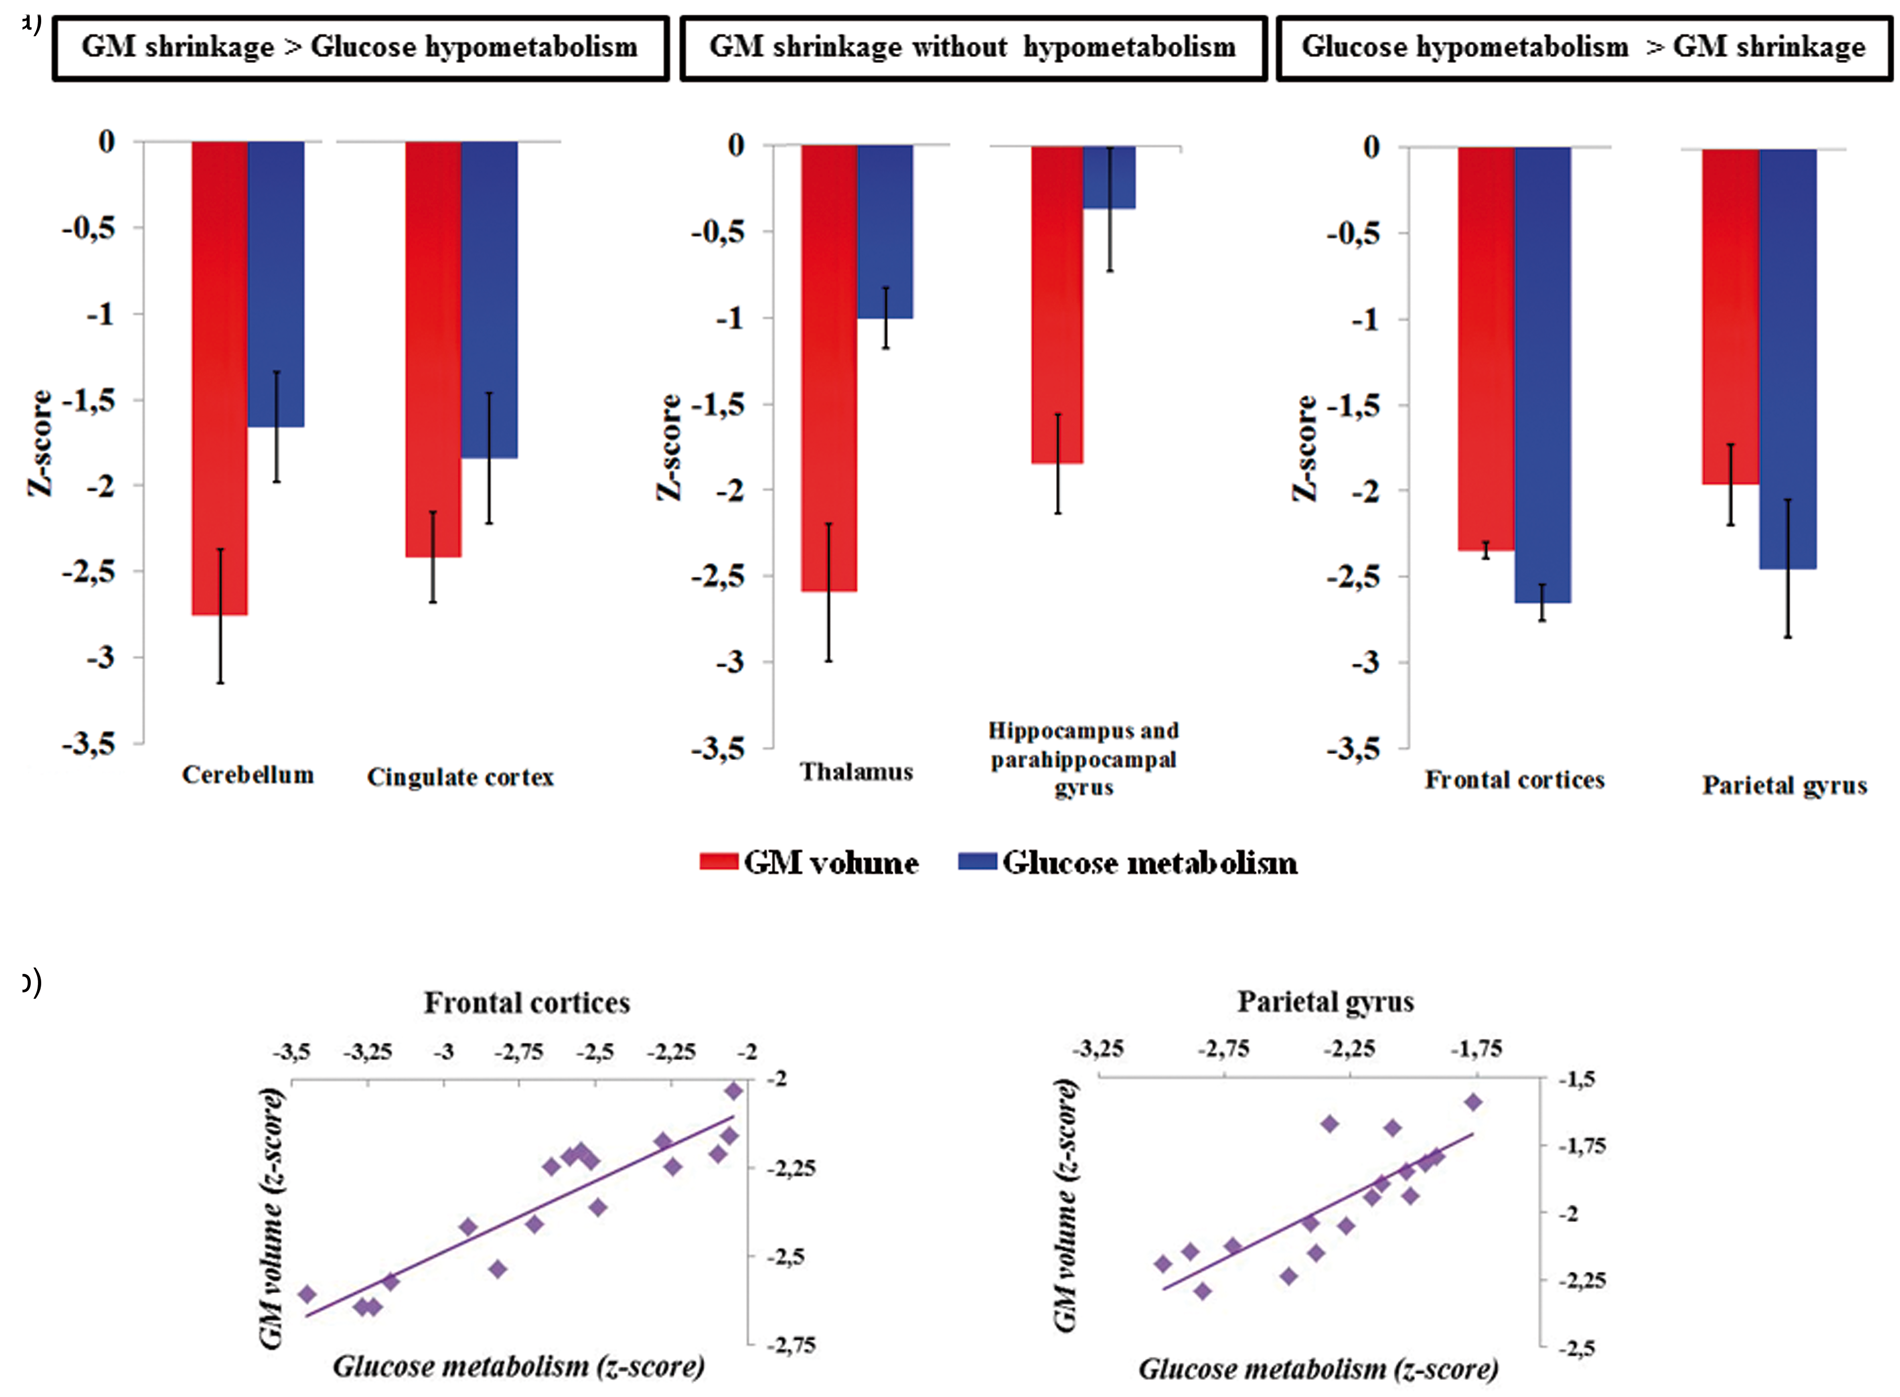
Relationship between GM volume and glucose metabolism in alcoholic patients
Pearson’s correlation analyses (rBP) were performed to assess the relationship between GM volume and glucose metabolism within each of these regions derived from the clusters mentioned in Table 3 (significant correlation at p < 0.008 after Bonferroni correction). No correlation was found between GM volume and metabolism in the cerebellum, cingulate cortex, thalamus, hippocampus and parahippocampal gyrus. Conversely, within the frontal and parietal cortices, hypometabolism was correlated with GM abnormalities (frontal cortices rBP = 0.92; parietal gyrus rBP = 0.81; p < 0.008; Figure 4(b)).
Effect of potential confounding variables
None of the clinical (depression, smoking and trait anxiety) or alcohol variables (AUDIT, days of sobriety before inclusion, alcohol use, misuse and dependence as well as daily alcohol consumption and number of withdrawal) correlated with either GM abnormalities or hypometabolism in alcoholic patients.
Discussion
The goal of the present study was twofold: (a) to describe the profile of GM structural and metabolic abnormalities in alcoholic patients and (b) to conduct a direct voxelwise comparison of these two patterns of brain alteration. The main novelty of the study lies in the latter part, as no study in the literature of alcohol-dependence has systematically compared, on a voxel-by-voxel basis (that is, without a priori regional assumptions) structural and metabolic alterations within the same cohort of patients. Our study offers a concrete global picture of the relationships between volumetric and metabolic measurements and the differential changes between them that contribute to the better understanding of the pathophysiological mechanisms in alcohol-dependence. Moreover, we made sure that our methodological procedures were optimized through correction for PVEs and calculation of a robust reference region to intensity-normalize PET data. These methodological procedures have not been done explicitly in studies in chronic alcoholism where arterial blood sampling cannot be obtained. Thus, methodologically, it can be concluded that our results are not artefactual as a result of PVEs or the selection of a wrong reference region.
The profile of GM structural abnormalities in the alcoholic patients included in our study is in agreement with previous studies reporting GM shrinkage in the frontal, parietal and cerebellar cortices,3,4 cingulate gyrus, 4 thalamus2–4 and hippocampus. 6 The more robust findings were found in the dorsolateral prefrontal and premotor cortices as well as in regions of the cerebellum involved in the executive and motor loops of the fronto-cerebellar circuit. The thalamus, cingulate cortex and parahippocampal gyrus remained also significant with a more stringent threshold. Those findings support the existence of alterations of the nodes of the fronto-cerebellar and Papez’s circuits in alcoholic patients.
The pattern of metabolic abnormalities found in our alcoholic sample is consistent with previous studies that had used an ROI approach. Compared to controls, lower glucose uptake was found in the parietal cortex 12 extending to the cuneus and precuneus, cerebellum, 1 cingulate gyrus and frontal cortex1,11,13 including the premotor (BA 6) and dorsolateral prefrontal cortices (BA 9 and 46). Those findings confirm that a VBM approach is relevant to examine metabolic abnormalities in alcoholics.
There is an extensive overlap between the GM structural and metabolic abnormalities in alcoholic patients, involving particularly two networks: the Papez’s circuit and the fronto-cerebellar circuit. Despite the apparent similarity between these patterns, which would suggest common pathological mechanisms and/or a causal relationship between brain shrinkage and hypometabolism, 13 only the direct and quantitative comparison can highlight regional discrepancies between those brain alterations. The absence of relationship between alcohol history of the patients and both GM and glucose abnormalities4,11,12 suggests that these brain alterations could not be directly related to the deleterious effects of alcohol consumption but rather explained by indirect mechanisms. Brain metabolism was previously reported to be correlated with GGT, 11 an index of alcoholic liver disease, whereas atrophy of the cerebellum 36 and mammillary bodies that are node of the Papez’s circuit 37 was related to thiamine deficiency. Thus, harmful effects of alcohol consumption on liver and nutritional status may be more deleterious on brain macrostructure and metabolism than the pattern of alcohol consumption itself.
Papez’s circuit
The direct comparisons between brain shrinkage and hypometabolism have revealed greater GM structural abnormalities than hypometabolism in the cingulate cortex, hippocampus and parahippocampal gyrus. Those findings indicate that, within the Papez’s circuit, the macrostructure was more severely damaged than the glucose metabolism. Chronic alcoholism may lead to structural alteration of the nodes of this circuit 3 that, in turn, would result in synaptic dysfunctions that would explain the hypometabolism observed in the cingulate and medial temporal gyri. 38 This cascade of events suggests that local atrophy might induce local hypometabolism. The absence of correlations between GM volume and metabolism within brain regions showing this profile does not exclude this cascade of events, in which hypometabolism could occur only when severe GM shrinkage, without linear relationship (see below section ‘Thalamus’). This hypothesis can be reinforced by a study conducted in alcoholic Korsakoff’s syndrome, i.e. the later and the more severe complication of chronic alcoholism, in which a similar magnitude of structural and metabolic abnormalities was found in the Papez’s circuit. 17
The metabolic preservation of the atrophied hippocampus and parahippocampal gyrus contrasting with the concomitant GM abnormalities and hypometabolism found in the cingulate cortex suggests a different vulnerability of the glucose metabolism within the different nodes of the Papez’s circuit in alcoholism.
Fronto-cerebellar circuit
In the fronto-cerebellar circuit, the cerebellar vermis III and lobules III–VIII, Crus I and II showed more severe GM shrinkage than hypometabolism in alcoholic patients. The same result found in Korsakoff’s patients 17 and the absence of relationship between GM abnormalities and hypometabolism in these regions suggest that the cerebellum is metabolically more resistant than other brain regions to the harmful effects of chronic alcoholism. Furthermore, these cerebellar regions, which are included in the motor and the executive loops of the fronto-cerebellar circuit, have been reported as involved in compensatory mechanisms in alcoholic patients who performed on par with controls on executive tasks (for review, see Chanraud and Sullivan 39 ). Although these fMRI studies have highlighted the role of the cerebellum in compensating for the functional deficits due to dysfunction of the frontal cortex, further studies are needed to investigate whether cerebellar glucose metabolism may be the substrate of such compensatory mechanism and even compensate for GM volume deficits or metabolic abnormalities in other brain regions.
Contrary to what we found in the cerebellum, correlations were observed between GM shrinkage and glucose hypometabolism in the frontal cortices and the parietal gyrus (Figure 4(b)). In those regions, brain abnormalities revealed by MRI and PET may thus result (at least partially) from common pathological mechanisms. This hypothesis regarding the pathophysiological mechanism involved in alcohol dependence in these brain regions has also been suggested in Alzheimer’s disease for the amyloid theory in which Aβ deposition leads to synaptic and neuronal degeneration and subsequent GM abnormalities. 40 In alcoholics, the direct comparison between MRI and PET data also revealed greater hypometabolism compared to GM shrinkage in the dorsolateral prefrontal (BA 9 and 46) and premotor cortices (BA 6), suggesting distinct additional mechanisms leading to atrophy and hypometabolism within these brain regions. Since glucose metabolism reflects synaptic activity, 38 the detrimental effects of chronic alcoholism on multiple systems of neurotransmission 41 could explain why metabolic dysfunction precedes GM shrinkage in the frontal lobes that receives many neurotransmitter-specific projections. 41 Such profile of atrophy and hypometabolism, previously reported in other brain regions in Alzheimer’s disease, 16 may also be interpreted as a diaschisis phenomenon, reflecting the distant (rather than local) effects of other altered nodes within the fronto-cerebellar network. Finally, abnormal brain structural connectivity described in alcoholism 42 may result in a ‘disconnection syndrome’, in which the interruption of connection between the nodes could be as deleterious as structural and/or metabolic alteration of the nodes themselves. Such dysfunction of the frontal cortices that may have preceded atrophy and be present above the chronic alcohol consumption could be related to the neurobiological model of addiction in which drug dependence results from imbalance between different neural systems. Alteration of the reflective system, involving mainly prefrontal cortices, leads to poor inhibitory control and thus elevated addition risk and relapse. 43 The neurobehavioral significance of this metabolic dysfunction within brain regions previously reported to underlie executive impairments in alcoholic patients11,13 requires further studies.
Although the parietal cortex has not been reported as a region of the fronto-cerebellar circuit, connections between the precuneus (BA 7) and the frontal lobe (BA 9 and 46), motor cortex (supplementary motor area) and thalamus have been highlighted. 44 A correlation study conducted in alcoholic patients showed that volume deficits in the parietal cortex correlated with those in the thalamus and superior vermis. 2 The GM structural abnormalities and metabolic dysfunction of the multiple brain regions connected to the parietal cortex, regarded as an important brain hub of the Default-Mode Network notably, 45 may explain the disproportionate hypometabolism compared with shrinkage and the severe dysfunction found in the cuneus and precuneus in alcoholic patients (Figure 4(a)).
Thalamus
The thalamus plays a key role in both the Papez’s circuit and the fronto-cerebellar circuit but different thalamic nuclei are involved in each one of the brain network (for review, see Pitel et al. 9 ). The thalamic nuclei were reported to be differentially affected by alcoholism 9 but the resolution of the MRI sequence (1 mm3) and PET images (3.76 × 3.76 × 4.9 mm3) does not allow specifying which nucleus is impaired. In the alcoholic patients included in our study, the thalamus showed a severe deficit of GM volume compared to a relatively preserved metabolism (Figure 4(a)). Given the severe alteration of the thalamus in patients with Korsakoff’s syndrome,3,17 this structure seems to be vulnerable to both the effects of chronic alcoholism and thiamine deficiency. Glucose metabolism involves energy production, which is provided, in part, by thiamine phosphorylation. Thus, the relative metabolic preservation of the thalamus in our study is likely due to the absence of severe thiamine depletion in the alcoholic patients. Moreover, as reported in a previous MRI study, 3 alcoholic patients with thalamic volume less than 2 standard deviations from controls were considered at risk of developing Korsakoff’s syndrome. Metabolic abnormalities in the thalamus occurred only in patients with severe GM volume deficits in this structure. An ANOVA conducted on the metabolism of the thalamus revealed significant effects of group (F(1,30) = 39.18; p < 0.001): alcoholic patients with an atrophied thalamus (<2 standard deviations from CS) had hypometabolism in this structure compared with the two other groups of subjects (alcoholic patients with preserved volume of the thalamus and CS) who did not differ between each other (p < 0.001).
In summary, our findings revealed three distinct profiles of brain abnormalities. First, some brain regions (cerebellum, cingulate cortex, thalamus, hippocampus and parahippocampal gyrus) had more severe GM shrinkage than hypometabolism. This result can be considered as being the rule of pathological mechanisms pertaining to the neurotoxicity of chronic alcohol consumption, in which local atrophy induces local hypometabolism. Second, there was a relative metabolic preservation of the atrophied thalamus, hippocampus and parahippocampal gyrus contrasting with both GM abnormalities and hypometabolism in the cingulate cortex. This profile suggests a variable vulnerability of the nodes of the Papez circuit, which could be due to compensatory mechanisms within this brain circuit. Third, in some brain regions, hypometabolism exceeded atrophy (frontal regions of the frontocerebellar circuit and parietal gyrus), suggesting that loss in function may be the leading factor also contributing to the overall pathological mechanism. Our study therefore potentially shows the interaction of different pathological mechanisms across different brain circuits in alcoholism. Our study highlights the need to consider not only local GM abnormalities but also other mechanisms (neurotransmission) and distant phenomena (structural connectivity and/or diaschisis syndrome) that contribute to the overall pathophysiological mechanism of chronic alcoholism. It paves the way towards longitudinal studies to study the natural history of alcoholism and to confirm the chronological position of all these possible mechanisms. Further studies are required to assess the relationships between these profiles of structural and metabolic abnormalities and the behavioral performances of the alcoholic patients in order to determine which dysfunction underlies such neuropsychological impairments.
Footnotes
Funding
The author(s) disclosed receipt of the following financial support for the research, authorship, and/or publication of this article: This work was supported by the French National Institute for Health and Medical Research (INSERM), the French National Agency for Research (ANR) Postdoc Return (Retour Post-Doctorants, PDOC) program, the Regional council of Lower-Normandy, and the Mission Interministérielle de Lutte contre les Drogues Et les Conduites Addictives (MILDECA).
Declaration of conflicting interests
The author(s) declared no potential conflicts of interest with respect to the research, authorship, and/or publication of this article.
Authors’ contributions
Ludivine Ritz was actively involved in this study from design to drafting. She significantly contributed to the recruitment of participants and data acquisition. She conducted all the statistical analyses and played a central role in interpreting the results and writing the article. Shailendra Segobin greatly contributed to the setup of the design and the statistical analyses. He revised the manuscript and made essential improvements mainly to the ‘Materials and methods’ section.
Coralie Lannuzel, Céline Boudehent, and François Vabret played a key role in data acquisition, especially in the careful screening of our cohort. As the director of the laboratory, Francis Eustache ensured that we had all the material resources we needed to bring this study to a successful conclusion. He revised the manuscript and provided relevant advice regarding the rational organization of the ideas. Hélène Beaunieux and Anne Lise Pitel supervised and coordinated the teamwork from start to finish. Their knowledge and expertise in neuropsychology, neuroimaging, and alcohol dependence were crucial for the design, analysis, and interpretation of the results of this project. They were also particularly involved in the revising of the manuscript.