
Abstract
We used 18F-FDG-PET to investigate the frequency of crossed cerebellar diaschisis (CCD) in 197 patients with various syndromes associated with neurodegenerative diseases. In a subset of 117 patients, we studied relationships between CCD and cortical asymmetry of Alzheimer’s pathology (β-amyloid (11C-PIB) and tau (18F-Flortaucipir)). PET images were processed using MRIs to derive parametric SUVR images and define regions of interest. Indices of asymmetry were calculated in the cerebral cortex, basal ganglia and cerebellar cortex. Across all patients, cerebellar 18F-FDG asymmetry was associated with reverse asymmetry of 18F-FDG in the cerebral cortex (especially frontal and parietal areas) and basal ganglia. Based on our operational definition (cerebellar asymmetry >3% with contralateral supratentorial hypometabolism), significant CCD was present in 47/197 (24%) patients and was most frequent in corticobasal syndrome and semantic and logopenic variants of primary progressive aphasia. In β-amyloid-positive patients, mediation analyses showed that 18F-Flortaucipir cortical asymmetry was associated with cerebellar 18F-FDG asymmetry, but that cortical 18F-FDG asymmetry mediated this relationship. Analysis of 18F-FDG-SUVR values suggested that CCD might also occur in the absence of frank cerebellar 18F-FDG asymmetry due to symmetrical supratentorial degeneration resulting in a bilateral diaschisis process.
Keywords
Introduction
Crossed cerebellar diaschisis (CCD), defined as a decrease in hemispheric cerebellar perfusion or metabolism contralateral to a supratentorial lesion, was described nearly forty years ago on positron emission tomography (PET) by Baron et al.1,2 This phenomenon is thought to be due to neuronal deactivation secondary to damage to glutamatergic excitatory neurons in the cortico-ponto-cerebellar tracts.3–6 A large body of literature has studied cerebellar diaschisis in patients with stroke2,3,7–11 and other conditions such as epilepsy,12–15 encephalitis,16–18 head trauma, 19 and malignant brain lesions.20–24 However, in spite of CCD being, in our experience, a common incidental finding upon visual assessment of 18F-Fluorodeoxyglucose (FDG) brain PET studies, reports in patients with neurodegenerative diseases are limited.25–29 Recently, in a case series of four patients with Alzheimer’s disease (AD), Reesink et al. found no relationship between the accumulation of β-amyloid on 11C-Pittsburgh compound B (PIB) and contralateral cerebellar hypometabolism on 18F-FDG, suggesting that CCD is a β-amyloid-independent process. 25 The relationship between CCD and pathologic aggregation of tau measured in vivo using 18F-Flortaucipir PET 30 has never been investigated. Based on the known relationship between 18F-Flortaucipir signal and local neurodegeneration31–39 in AD, we hypothesized that cortical asymmetry of 18F-Flortaucipir will be associated with the presence of contralateral cerebellar hypometabolism on 18F-FDG in β-amyloid positive subjects. We also hypothesized that CCD would be more frequent in clinical syndromes that are typically associated with asymmetric presentations and neurodegeneration, such as corticobasal syndrome (CBS), 40 semantic variant primary progressive aphasia (svPPA) 41 and logopenic variant primary progressive aphasia (lvPPA).41,42 Finally, while there have been some reports of CCD as a potential prognostic biomarker in stroke and in tumors,43–46 the clinical significance of this finding in neurodegenerative syndromes remains unknown.
The objectives of this study were to (1) assess the prevalence of CCD in a large cohort of cognitively impaired patients with suspected neurodegenerative diseases and across different clinical diagnoses; (2) to investigate the relationship between CCD and cortical asymmetries of glucose metabolism (18F-FDG), β-amyloid deposition (11C-PIB) and tau burden (18F-Flortaucipir) on brain PET studies; and (3) to evaluate the correlation between CCD and measures of clinical disease severity.
Materials and methods
Study design and participants
We retrospectively included 197 consecutive patients enrolled in research studies at the Memory and Aging Center, University of California San Francisco (UCSF), who had undergone 18F-FDG PET between 2012 and 2019 on the same PET/CT scanner, and had structural MRI available. Patients underwent a complete clinical evaluation including a structured caregiver interview, neuropsychological and neurological assessment (described in detail elsewhere31,47) Tests of cerebellar function were performed for most patients and assessed by retrospective chart review, including assessment of tremor in the upper and lower limbs, pronation-supination test, finger-to-nose test, heel-to-shin test, tandem walk and assessment for ataxic gait. Clinical diagnosis was based on consensus research criteria following multi-disciplinary evaluation, blinded to biomarker results. In short, patients were assigned a diagnosis of mild cognitive impairment, 48 dementia due to Alzheimer’s disease, 49 behavioral variant frontotemporal dementia, 50 variants of primary progressive aphasia, 51 corticobasal syndrome 52 or progressive supranuclear palsy. 53 Patients who did not meet criteria for these diagnoses were assigned “other” (detailed in Table 1).
Patient characteristics.
Note: For continuous variables, mean ± SD [min-max] are shown.
MMSE: Mini-mental status exam; CDR-SB: Clinical dementia rating scale sum of boxes; HC: healthy controls; MCI: mild cognitive impairment; tAD: Alzheimer’s disease dementia (typical); PCA: posterior cortical atrophy; lvPPA: logopenic variant primary progressive aphasia; bvFTD: behavioral variant frontotemporal degeneration; nfvPPA: non-fluent variant primary progressive aphasia; CBS: corticobasal syndrome; svPPA: semantic variant primary progressive aphasia; PSP: progressive supranuclear palsy.
†Other: 5 with traumatic brain injury/chronic traumatic encephalopathy syndrome, 2 with no specific diagnosis, one with bipolar disorder and cognitive impairment not meeting criteria for neurodegenerative syndrome, one with Parkinson’s disease with cognitive impairment.
We also retrospectively included 76 cognitively unimpaired controls from the Berkeley Aging Cohort Study (BACS) who underwent 18F-FDG PET on the same scanner as patients and had structural MRI available. Controls were recruited by advertisement from the community, endorsed no significant cognitive problems, and scored within the normal range on a battery of neuropsychological tests. 54
Written informed consent was obtained from all subjects or their surrogates. The study was approved by the University of California San Francisco, University of California Berkeley and Lawrence Berkeley National Laboratory institutional review boards for human research. All procedures performed were in accordance with the ethical standards of the institutional research committee and with the 1975 Helsinki declaration and its later amendments.
PET acquisition
All patients and controls underwent 18F-FDG brain PET (∼5–10 mCi dose, acquired at 30–60 minutes post-injection) on a Siemens Biograph 6 Truepoint PET/CT (Siemens, Erlangen, Germany) at the Lawrence Berkeley National Laboratory in 3 D acquisition mode. 117 patients also underwent scanning with 11C-PIB (∼15 mCi, minimum of four 5-min frames acquired at 50–70 minutes post-injection) and 18F-Flortaucipir (∼10 mCi, minimum of four 5-min frames acquired at 80–100 minutes post-injection) on the same scanner. Mean intervals between scans are shown in Supplementary Table 1. For all brain PET studies, a low-dose CT was performed for attenuation correction. PET data were reconstructed using an ordered subset expectation maximization algorithm and smoothed with a 4-mm Gaussian kernel with scatter correction. All subjects also underwent MRI (T1-weighted MRI sequence, on a 3-T Siemens Tim Trio (n = 127) or a 3-T Siemens Prisma FIT (n = 70) scanner for patients, and on a 3-T Siemens Tim Trio (n = 29) or a 1.5-T Siemens Magnetom Avanto (n = 47) for controls (Siemens, Erlangen, Germany)). Detailed acquisition parameters are described elsewhere.34,55 MRI was used for PET processing only.
PET processing
All the PET data presented in this paper are based on tissue-to-reference ratio values. PET images were coregistered to corresponding T1-weighted MRIs in native space. Each subject’s MRI was segmented using FreeSurfer version 5.3 (https://surfer.nmr.mgh.harvard.edu/) to define regions of interest. PET SUVR images were generated using tracer specific reference regions (pons for 18F-FDG, cerebellar gray matter for 11C-PIB, and inferior cerebellar gray matter for 18F-Flortaucipir, as detailed elsewhere34,54,56) Non-partial volume corrected data were used.
For all three radiotracers, SUVR values were extracted from each FreeSurfer-derived ROI and aggregated into large left and right composite regions using a size-weighted average: cerebral cortex (all cortical areas), cerebellar cortex, and basal ganglia (composite of caudate, putamen and globus pallidus). Inferior cerebellar gray matter was used instead of full cerebellar cortex for 11C-PIB and 18F-Flortaucipir to avoid spillover from supratentorial signal. To analyze the relationship between CCD and cerebral cortex asymmetries in more detail, we also extracted left and right SUVRs for composite regions representing the frontal, parietal, temporal and occipital lobes.
For each tracer and composite region, indices of asymmetry (IA) were calculated using the formula: (right SUVR – left SUVR)/bilateral SUVR.22,57 As such, a positive IA in the cerebral cortex on 18F-FDG corresponds to more severe hypometabolism in the left hemisphere, whereas a positive IA in the cerebral cortex on 11C-PIB/18F-Flortaucipir indicates greater β-amyloid/tau burden in the right hemisphere. For some analyses (see below), we used the absolute value of IA, reflecting the intensity of asymmetry regardless of laterality.
Definition of β-amyloid (A) and tau (T) status for patients
Based on the AT(N) research framework proposed by Jack et al. 58 to define AD in vivo with (imaging and/or fluid) biomarkers, β-amyloid (A) status was defined by independent visual assessment of 11C-PIB. 59 Tau (T) status was defined using the bilateral weighted temporal meta-ROI SUVR threshold of 1.27, as previously described by Ossenkoppele et al. 60
Operationalization of CCD
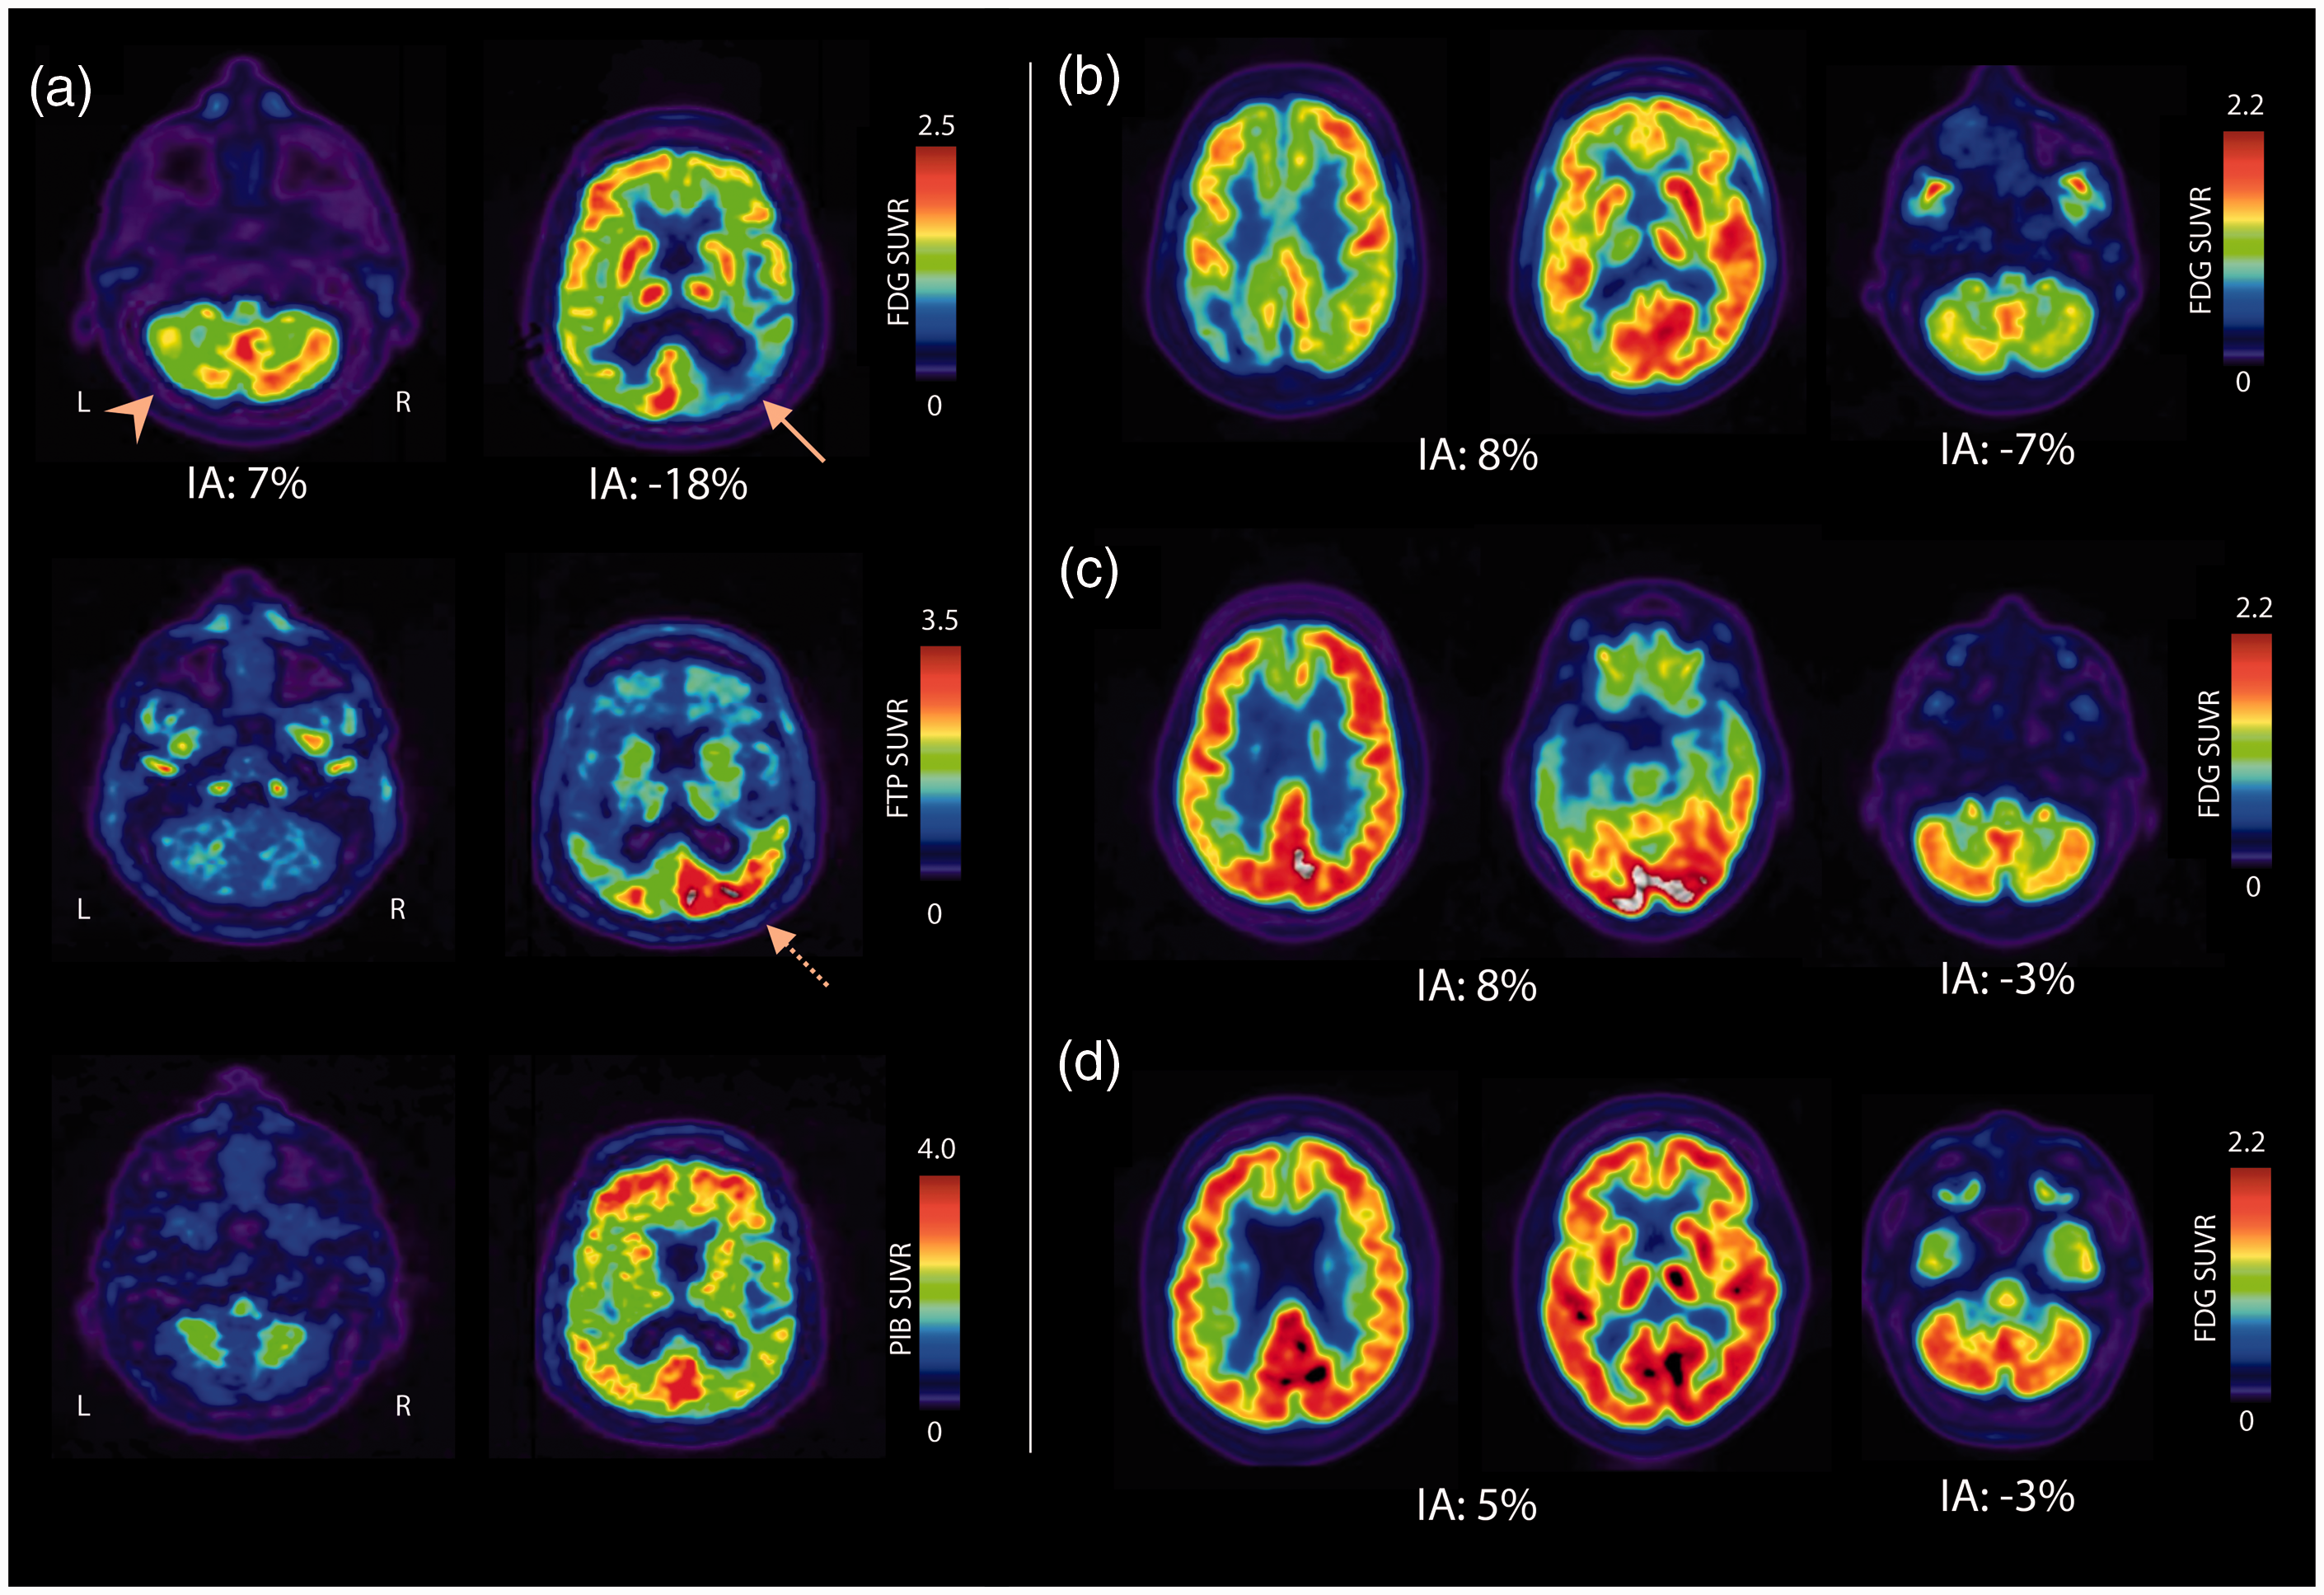
Although most of the analyses presented in this manuscript considered 18F-FDG cerebellar asymmetry as a continuous variable using the IA described above, we also aimed to identify patients with significant CCD, i.e. patients with both significant 18F-FDG cerebellar asymmetry and contralateral supratentorial asymmetry. We operationalized this definition as follows. First, we analyzed 18F-FDG asymmetry in the control group to establish the normal range of 18F-FDG IA values for each ROI (cerebellar cortex, basal ganglia, frontal, parietal, temporal, and occipital lobe). The distribution of each region’s IA was visually inspected, and scans with extreme IA values were visually checked by a nuclear medicine physician (K.P.), resulting in 2 individuals being excluded from the control group: one had CCD (hypometabolism in the right cerebellar cortex and hypometabolism in the left cerebral hemisphere, Supplementary Figure 1(b), left panel), and another had significant asymmetry in the basal ganglia, likely due to vascular disease (Supplementary Figure 1(b), right panel). Second, we identified patients with significant 18F-FDG cerebellar asymmetry. A threshold of absolute 18F-FDG cerebellar IA > 3% was used, based on the distribution of values in the 74 healthy controls: this threshold corresponded to mean + 2 standard deviations (SD) of the distribution of 18F-FDG cerebellar IA in the controls (2.98%), none of which were suprathreshold. Third, we identified patients with significant 18F-FDG asymmetry in at least one supratentorial region using a threshold corresponding to the mean + 2SD of the 74 controls (2% for basal ganglia, 3% for frontal, 5% for parietal, 5% for temporal and 6% for occipital lobe). Last, we considered patients to have significant CCD when we observed both a significant cerebellar IA and a significant but reverse asymmetry in at least one of the supratentorial regions (basal ganglia, frontal, parietal, temporal, or occipital lobe). The presence of CCD was further confirmed by visual assessment.
Statistical analyses
To assess for normality of data, Shapiro-Wilk tests were performed on all variables, in addition to assessing distribution on density plots. Pearson correlations were conducted to assess the relationship between 18F-FDG cerebellar IA and 18F-FDG, 11C-PIB and 18F-Flortaucipir cortical IA, as well as measures of clinical disease severity (Mini-Mental Status Exam (MMSE) and Clinical dementia rating scale – sum of boxes (CDR-SB)). For non-normally distributed variables, nonparametric tests based on ranked data were performed to confirm robustness of the results. Mediation analyses were performed between 18F-FDG cerebellar IA and 18F-Flortaucipir cortical IA, MMSE and CDR-SB, reflecting indirect (i.e. mediated) and direct pathways. A forward procedure for variable selection in a multiple linear regression was used to assess regional 18F-FDG IA (frontal, parietal, temporal, occipital and basal ganglia) as predictors of cerebellar IA. General linear models were used to assess interactions between 18F-FDG cerebellar IA, clinical diagnosis, MMSE and CDR-SB. Note that for all analyses including multi-tracer PET data, we focused on cerebral cortex PET signal and did not consider basal ganglia PET SUVR, due to the intense “off-target binding” observed on 18F-Flortaucipir-PET.61,62
Statistical analyses were performed using SPSS (version 25, IBM, Armonk, NY). Jamovi (version 1.20, www.jamovi.org) 63 was used to conduct mediation analyses and general linear models.
Results
Demographics for all subjects are shown in Table 1. Average patient age was 64 years (range 32-95), with a slight male predominance (54%). The vast majority of patients self-identified as White/Caucasian (86%, n = 171). Others were African American (n = 3), Asian (n = 6), Asian Indian (n = 1); 2 patients endorsed multiple categories while 14 did not disclose this information. The patient sample was heterogeneous with clinical diagnoses of mild cognitive impairment, non-AD disorders (see breakdown of clinical diagnoses in Table 1), as well as both typical and atypical variants of AD dementia, including patients meeting diagnostic criteria for logopenic variant primary progressive aphasia (lvPPA) 51 and posterior cortical atrophy syndrome (PCA). 64
Frequency of CCD across clinical syndromes
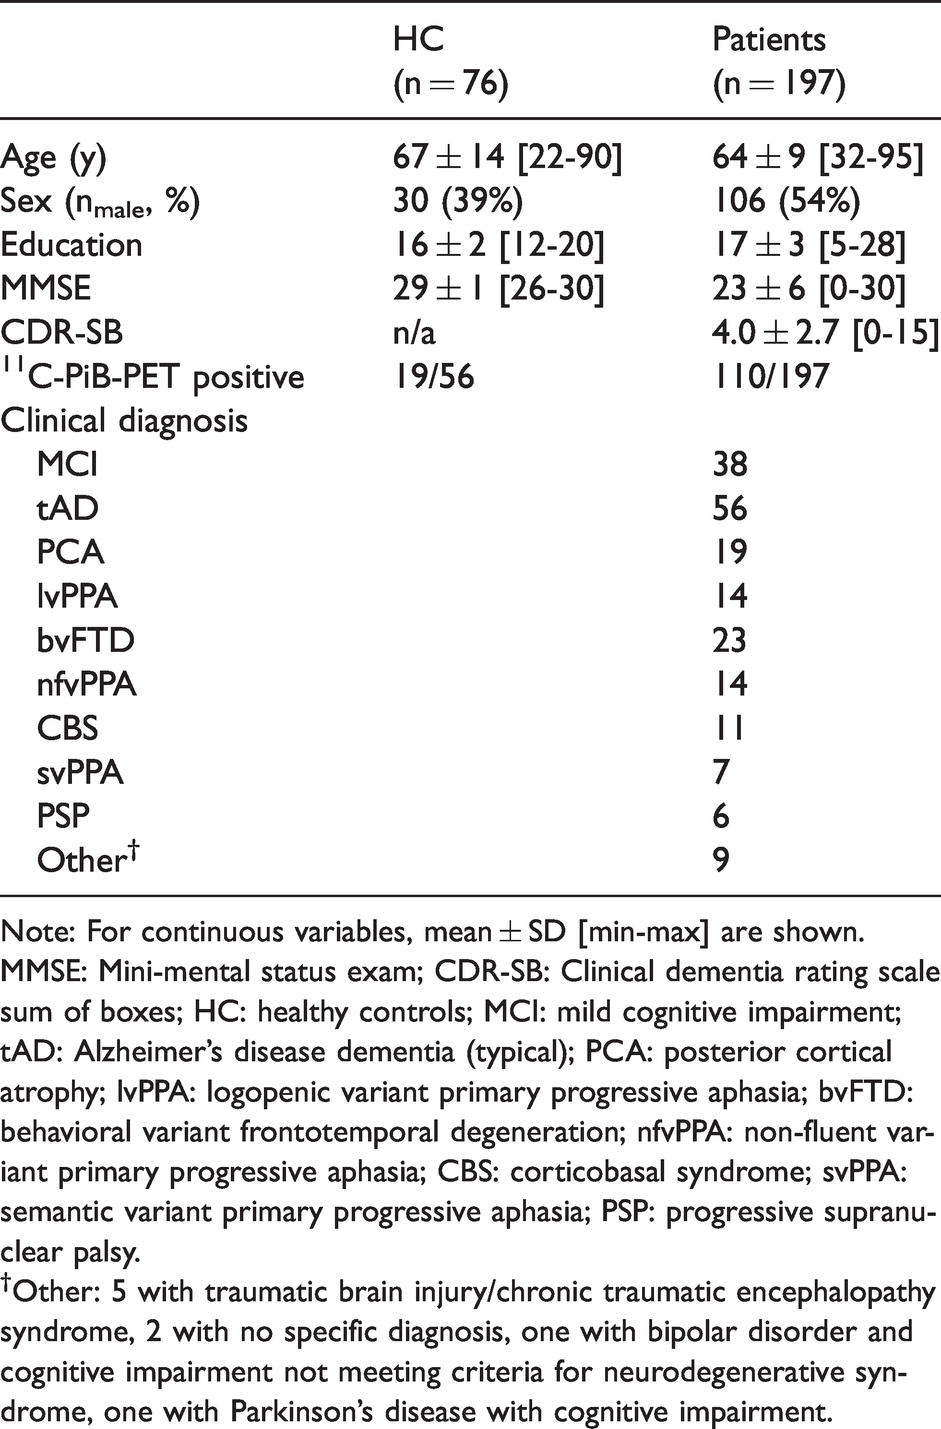
Representative cases of CCD in patients with posterior cortical atrophy, corticobasal syndrome (CBS), semantic variant primary progressive aphasia (svPPA), and progressive supranuclear palsy are shown in Figure 1. Significant asymmetry of cerebellar metabolism was present in 51/197 patients (26%). Only four of these 51 subjects did not reach quantitative criteria for CCD (Figure 2(a)) as they showed only minimal supratentorial asymmetry upon visual assessment, therefore possibly representing cases of isolated asymmetry of cerebellar glucose metabolism. The remaining 47 subjects exhibited significant CCD on both quantitative and visual assessment. The highest frequency of CCD was observed in patients with clinical diagnoses of CBS, svPPA, lvPPA, PCA and non-fluent variant primary progressive aphasia, though most diagnostic subgroups were too small to conduct statistical analyses (Figure 2(b)). When grouping clinical diagnoses into typical AD (i.e. amnestic AD and MCI, n = 94), atypical AD (i.e. lvPPA and PCA, n = 33), or non-AD disorders (n = 70), there was a statistically significant difference in 18F-FDG cerebellar IA between diagnostic groups (Kruskal-Wallis H p= .008). Post-hoc pairwise comparisons showed that the 18F-FDG cerebellar IA was significantly higher in the atypical AD group compared to typical AD (Bonferroni corrected p= .007), while differences with the non-AD diagnostic group did not reach statistical significance (Bonferroni corrected p= .33 and p= .26).
Representative cases of CCD.
Study workflow and operationalization of crossed cerebellar diaschisis (CCD) (a) and frequency of CCD by clinical diagnosis (b).
Relationships between cerebellar and supratentorial 18F-FDG asymmetry
The distribution of cortical IA for each modality is shown in Supplementary Table 2. 18F-FDG cerebellar IA showed a significant inverse correlation with both 18F-FDG basal ganglia IA (r = −.617, p < .001) and cortical IA (r= −.739, p< .001) (Figure 3). This relationship was present in both β-amyloid negative (n = 87; r = −.567 for the basal ganglia, r = −.643 for the cerebral cortex, both ps< .001) and β-amyloid positive subgroups (n = 110; r = −.654 for the basal ganglia, r= -.792 for the cerebral cortex, both ps< .001). Correlations tended to be stronger in the β-amyloid positive group, and this difference was significant for the relationship with the cerebral cortex (based on Fisher r-to-z transformation: Z = 2.15, p = .03) but not the basal ganglia (Z = 0.95, p = .34).
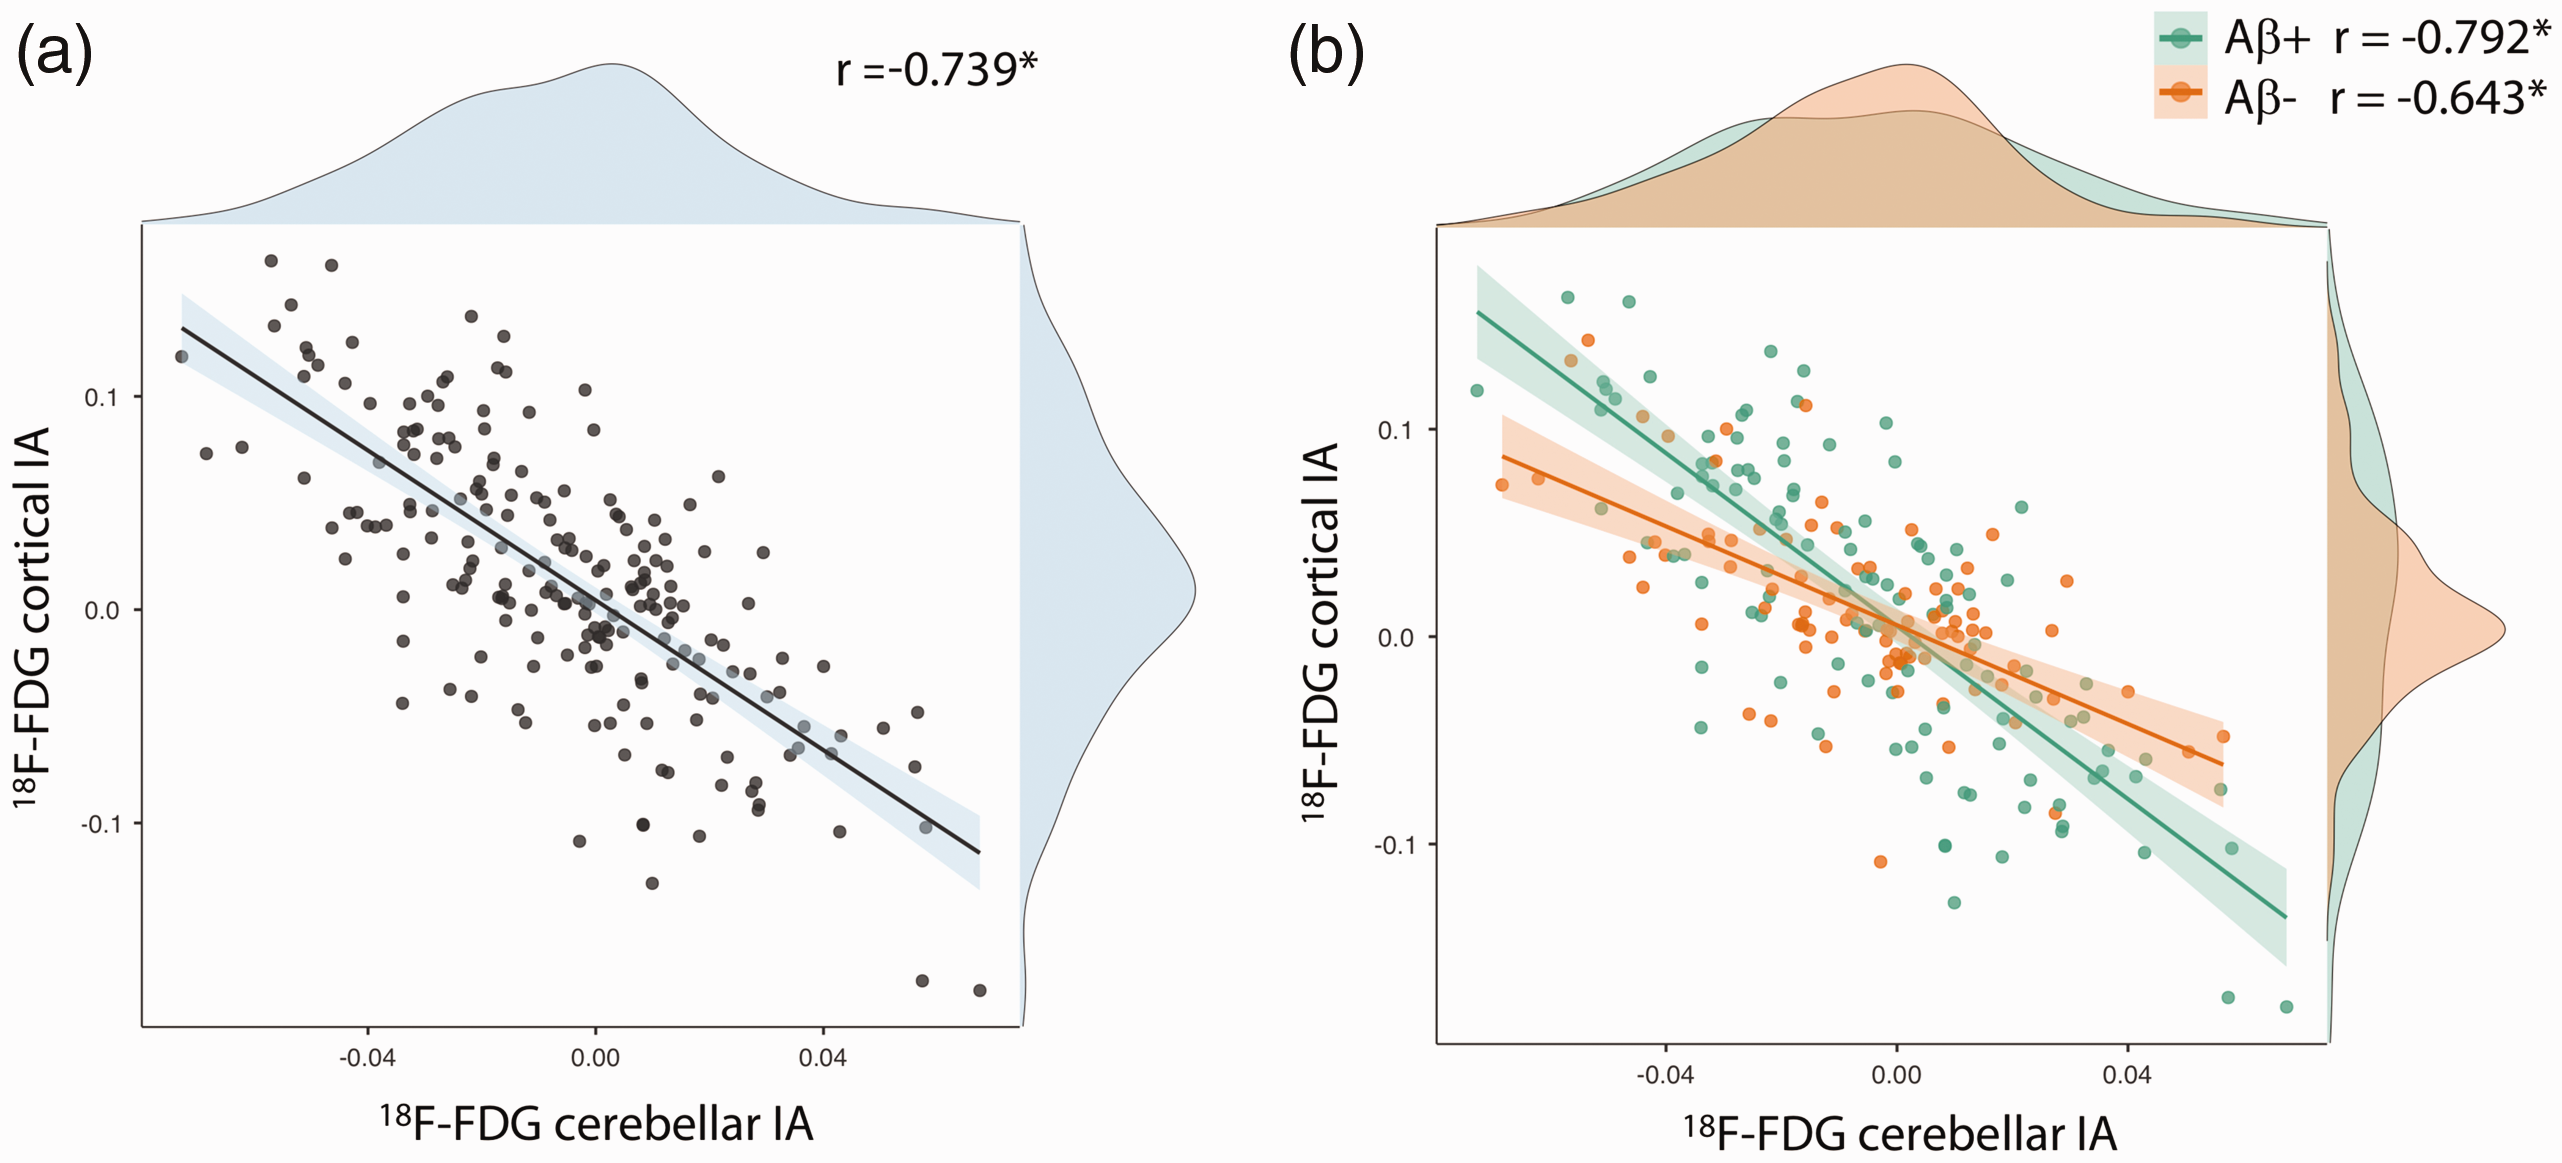
Association between 18F-FDG cortical and cerebellar indices of asymmetry.
To determine whether the relationship was driven solely by subjects with significant cerebellar asymmetry, we analyzed separately subjects with absolute cerebellar IA of less than 3% (n = 146). The relationship between cerebellar IA and cortical IA remained significant (r = −.566, p< .001). No significant relationship was found in healthy controls, however (r= .018, p= .88).
When dividing cortical glucose metabolism into lobar (frontal, parietal, temporal, occipital) ROIs, correlation analyses showed that in patients, asymmetry in each lobe was associated with inverse asymmetry in the cerebellum (rs < −.50, ps< .001, Supplementary Table 3), while no significant correlation was found in controls. In patients, IA between supratentorial lobes were highly inter-correlated (rs > .43, all ps < .001, Supplementary Table 3). Accordingly, we ran a stepwise regression model with a forward procedure to select the best predictors of cerebellar 18F-FDG IA. The resulting model accounted for 61.1% of total variance in cerebellar 18F-FDG IA (F(4,192) = 75.45, p < .001) and included frontal (β= -0.410, p< .001), parietal (β= -0.503, p< .001), temporal (β = 0.243, p= .01) and basal ganglia (β= -0.147, p= .03) IA as independent predictors.
Relationships between cerebellar 18F-FDG asymmetry and PET imaging of AD pathology
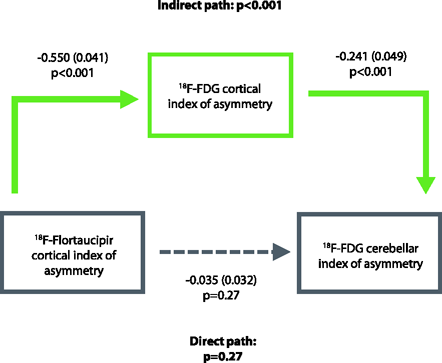
Next, we assessed whether CCD could reflect asymmetry of underlying β-amyloid and tau pathology in AD. We restricted the following analyses to patients with biomarker evidence of AD (A + T+, n = 74)). Regarding β-amyloid, there was no relationship between 18-F-FDG cerebellar IA and cortical 11C-PIB IA (r = −.074, p = .53; Spearman’s rho= .039, p= .74, Figure 4(a)). Regarding tau, we found that higher cortical 18F-Flortaucipir in one hemisphere was associated with decreased 18F-FDG in the contralateral cerebellum (r= .701, p< .001; Spearman’s rho= .664, p< .001, Figure 4(b)). Supratentorial cortical IA of 18F-FDG and 18F-Flortaucipir were also highly correlated (r= -.844, p< .001). Mediation analyses showed that the relationship between 18F-Flortaucipir asymmetry in the cortex and 18F-FDG asymmetry in the cerebellum was highly mediated (79%) by the relationship between 18F-Flortaucipir and 18F-FDG cortical IA (Figure 4(c)).
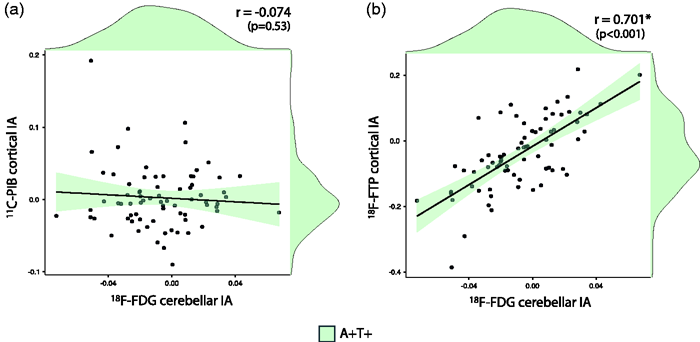
Association between 18F-FDG cerebellar index of asymmetry and cortical index of asymmetry of 11C-PIB (a) and 18F-Flortaucipir (b) Mediation analyses between 18F-FDG cerebellar IA and 18F-Flortaucipir cortical IA (C).
To ensure that results were not biased by long delay between scans, analyses were replicated in the subgroup of 49 A + T+ patients who underwent 18F-FDG, 11C-PIB, and 18F-Flortaucipir within a month (maximal delay between first and last PET scan = 30 days); all results remained unchanged. Briefly, 18F-FDG cerebellar IA was correlated with 18F-Flortaucipir cortical IA (r = 0.611, p< .001) but not 11C-PIB IA (r = −.030, p = .84). 18F-FDG cortical IA was associated with 18F-Flortaucipir cortical IA (r = −.824, p < .001), and mediated the relationship between18F-Flortaucipir cortical IA and 18F-FDG cerebellar IA (indirect path: p < .001, direct path: p = .99, percent mediation = 99.9%).
Since mild to moderate 18F-Flortaucipir signal has occasionally been reported in non-AD neurodegenerative disorders,55,65,66 we sought to confirm that the relationship observed in A + T+ subjects was specific to Alzheimer’s pathology, and not merely reflecting off-target binding of 18F-Flortaucipir to neurodegeneration or other pathology. We confirmed that there was no significant relationship between 18F-Flortaucipir cortical IA and 18F-FDG cerebellar IA in β-amyloid negative subjects (n = 35, r= .230, p= .18).
Lastly, we investigated whether asymmetry in cerebellar metabolism on 18F-FDG was indeed due to diaschisis from supratentorial areas, rather than local cerebellar amyloid or tau pathology, by analyzing the relationships between the cerebellar IA of 18F-FDG, 18F-Flortaucipir and 11C-PIB in the 74 A + T+ subjects. No significant relationship was found for 11C-PIB (r= .077, p= .51) or for 18F-Flortaucipir (r= -.202, p= .09).
Relationship between CCD, clinical disease severity and cerebellar function
We investigated whether there was a correlation between the presence of significant asymmetry in cerebellar glucose metabolism on 18F-FDG, and measures of clinical disease severity (MMSE and CDR-SB). In the whole cohort (n = 197), there was a weak negative correlation between absolute 18F-FDG cerebellar IA and MMSE score (r= -.260, p< .001, r2= .067; Spearman’s rho= -.214, p = 0.003) and a weak positive correlation with CDR-SB (r= .152, p= .04, r2= .023; Spearman’s rho= .236, p = 0.001). These associations remained significant in models taking into account clinical diagnosis (typical AD, atypical AD, non-AD); no MMSE*diagnosis or CDR*diagnosis interaction was significant (Supplementary Figure 2). These results provide evidence that 18F-FDG cerebellar asymmetry is higher in more severely impaired patients across diagnostic groups (Figure 5). Mediation analyses revealed that for both MMSE and CDR-SB, greater disease severity explained more asymmetric cortical hypometabolism, which in turn was associated with more asymmetric cerebellar 18F-FDG signal (Supplementary Figure 3). In contrast to measures of clinical severity, demographics such as age (r= .106, p= .14), sex (t = 0.46, p= .65) or education (r= -.030, p= .68) were not significantly associated with 18F-FDG cerebellar IA.
Relationship between 18F-FDG cerebellar IA, MMSE (a) and CDR-SB (B), n = 197.
Finally, we assessed whether there was a difference in tests of cerebellar function on neurological examination in subjects with and without CCD. Details of physical examination findings can be found in Supplementary Table 4. There was no statistically significant difference in any of the cerebellar function tests between the two groups. Furthermore, the vast majority of patients with CCD did not display signs of cerebellar dysfunction on physical examination. Of the few patients who did exhibit asymmetric signs on neurological examination, they tended to be isolated and were most likely due to severe supratentorial neurodegeneration (e.g.: isolated impairment in right limb supination/pronation in a patient with left hemisphere predominant corticobasal degeneration).
Beyond asymmetry: Bilateral CCD?
While all aforementioned analyses were based on the assessment of cerebellar and supratentorial PET asymmetries, consistent with the CCD literature in focal lesions, the neurodegenerative diseases included in the present study usually affect both cerebral hemispheres with various degrees of asymmetry. It is therefore possible that a “double CCD” phenomenon could occur in patients with bilateral cerebral degeneration: in such cases, glucose metabolism would be decreased in both cerebellar hemispheres without significant asymmetry. To test this hypothesis, we analyzed cerebellar and cerebral 18F-FDG SUVR values (using the pons as a reference region) rather than IA values in the group of 146 patients with no cerebellar asymmetry, i.e. an absolute 18F-FDG cerebellar IA of less than 3% (see Figure 2).
When comparing these patients (n = 146) to the control group (n = 74), we observed a major decrease in cerebral 18F-FDG SUVR (t = 6.38, p<.001 in an analysis of covariance controlling for age), and a mild decrease of cerebellar 18F-FDG SUVR (t = 2.36, p=.02) (Figure 6(a)). In patients, cerebellar and cerebral 18F-FDG SUVR values were correlated (r=.510, p<.001). When hemispheres were considered separately, all four 18F-FDG SUVR values were intercorrelated (all rs ≥ .467, ps < .001) but correlations between cerebral and cerebellar SUVRs were stronger when assessed contra-laterally (e.g. left cerebral cortex and right cerebellum: r= .506) rather than ipsi-laterally (e.g. left cerebral cortex and left cerebellum, r= .467; Fisher r-to-z transformation: Z = 2.36, p = 0.02; Figure 6(b)). Finally, multiple regression analyses were run separately to explain left and right cerebellar 18F-FDG SUVR using both left and right cerebral cortex 18F-FDG SUVR. In both models, the best predictor for cerebellar SUVR was the contralateral cerebral cortex SUVR (p = 0.002 for the left cerebellum SUVR model, p = 0.068 for the right cerebellum SUVR model, see Figure 6(c)).
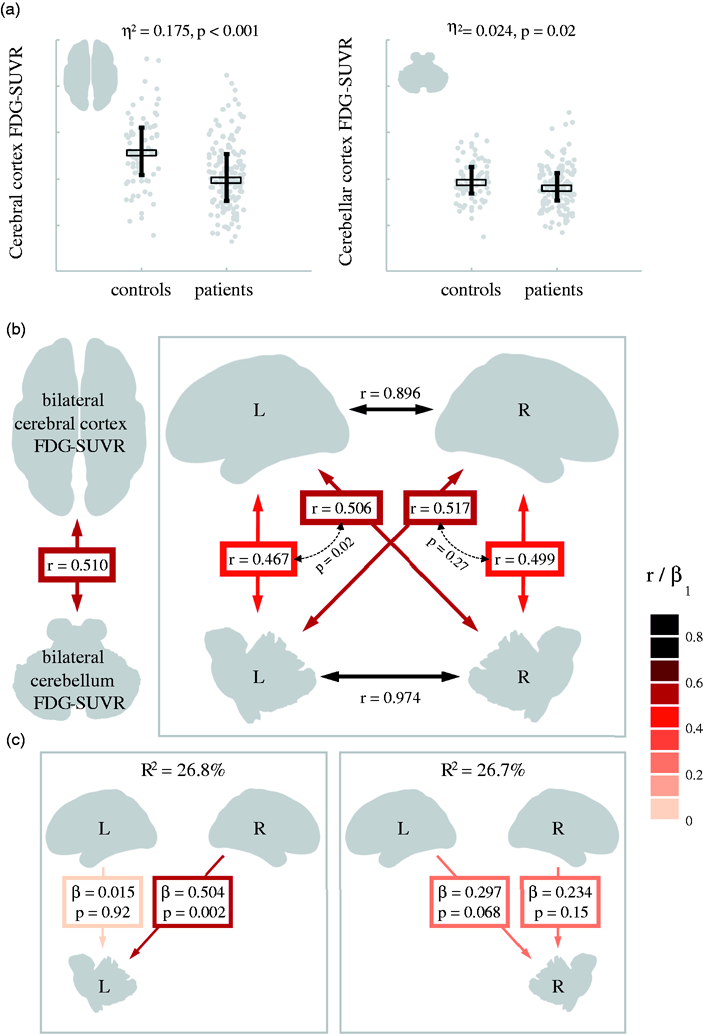
Relationships between cerebral and cerebellar cortex 18F-FDG-SUVR values in patients without significant cerebellar asymmetry.
Results were comparable, although more strongly significant, when considering all 197 patients instead of the subsample with symmetrical cerebellar 18F-FDG signal (Supplementary Figure 4).
Discussion
Our results provide novel insight on the phenomenon of CCD in neurodegenerative diseases. CCD, defined as a left/right asymmetry in cerebellar 18F-FDG signal in the presence of reverse supratentorial asymmetry, was relatively frequent in our patient sample, especially in patients with more severe dementia severity. There was an association between cerebellar asymmetry of glucose metabolism, cortical asymmetries of 18F-FDG and 18F-Flortaucipir, but not 11C-PIB. Data also suggested that a bilateral CCD process might occur in patients without significant cerebellar 18F-FDG asymmetry, consistent with the bilateral involvement of supratentorial areas in most neurodegenerative diseases included in our cohort.
The prevalence of (asymmetric) CCD in our cohort, as defined by thresholds derived from normative 18F-FDG asymmetry in cognitively unimpaired older adults, was relatively high. Twenty-six percent of patients were found to have absolute cerebellar IA greater than 3%, and the vast majority (92%) of those also met our operational definition of CCD (i.e. asymmetry in cerebellar metabolism with contralateral asymmetry in supratentorial glucose metabolism) as confirmed by quantitative and visual assessment. In comparison, a higher prevalence of CCD has been reported in patients with other conditions. The prevalence of CCD with stroke was reported to be as high as 50% on perfusion SPECT by Kim et al., 8 58% on 15O2 PET oxygen consumption 3 and as high as 40% in patients with head trauma on 18F-FDG PET by Alavi et al. 19 The operational definition of CCD differs from study to study, however, and the results aren’t directly comparable. The fact that stroke and head trauma tend to be relatively focal and often unilateral while neurodegenerative diseases are usually more widespread may also in part explain the difference in prevalence between these conditions. In spite of this, the relatively high prevalence in our population suggests that the phenomenon of CCD is under-reported and understudied in neurodegenerative syndromes. Interestingly, we found that the frequency of CCD was higher in specific clinical phenotypes, particularly in typically asymmetric presentations such as svPPA, CBS and nfvPPA. Patients with atypical presentations of AD (lvPPA and PCA syndromes) also had a higher frequency of CCD compared to the typical amnestic presentation. It is known that hypometabolism and tau pathology are often asymmetric in the cortex of atypical AD patients32,55,67–69; therefore, it is unsurprising that these phenotypes would be associated with a higher frequency of CCD in our data.
The significant inverse relationship between cortical and cerebellar IA on 18F-FDG is in line with the pathophysiologic mechanism of CCD, i.e. a supratentorial lesion causing downstream hypometabolism in the contralateral cerebellum.1,2 One interesting finding in our cohort was the presence of this relationship even in patients with subthreshold asymmetry in cerebellar metabolism, while no significant relationship was found in the control group. This suggests that CCD is a continuum, and patients with neurodegenerative diseases may have subtle manifestations of diaschisis even before it is perceptible on visual assessment.
Our analyses of patients without notable cerebellar 18F-FDG asymmetry showed that, at the group level, patients had decreased 18F-FDG SUVR values in the cerebellum compared to controls. In addition, 18F-FDG SUVR values within each cerebellar hemisphere were more strongly correlated with 18F-FDG SUVR in the contralateral, rather than ipsilateral cerebral hemisphere. Altogether, these data suggest that bilateral CCD might occur in some patients and that a definition of CCD purely based on left/right asymmetries, in line with the literature on focal supratentorial lesions, might lack sensitivity in the context of neurodegenerative diseases that most often affect both hemispheres.
In stroke, it has been proposed that lesions localized in the frontal lobes or thalamus are associated with CCD, 7 ,22,70,71 while temporal lesions alone did not seem to be associated with this phenomenon. 3 Lesions caused by malignant brain tumors localized in the frontal lobe were also found to be associated with CCD. 21 Mechanistically, these observations are consistent with the fact that the densest cortico-ponto-cerebellar projections arise from the frontal lobes. 72 In our cohort, metabolic asymmetry in the frontal and parietal lobes was most strongly associated with cerebellar asymmetry on 18F-FDG. Furthermore, results of our multivariate regression model show that, though 18F-FDG asymmetry in the frontal, parietal, temporal and basal ganglia regions were all significant predictors of asymmetry in cerebellar glucose metabolism, cortical asymmetry in the frontal lobes alone explained 55% of the variance (r= -0.743). Of note, the inverse calculated β value for the temporal lobe in the multivariate model may be due to collinearity between all predictors in the model, given that a strong negative correlation was found between 18F-FDG IA in the temporal cortex and cerebellum in the pairwise correlations (Supplementary Table 3). Our results are consistent with previously described findings in a small sample of 26 AD patients, which found significant regional correlations between cerebellar and cortical asymmetry of glucose metabolism in the frontal, parietal and temporal, but not occipital, lobes. 26
A small case series of 4 patients with AD had previously reported no association between CCD and cortical accumulation of β-amyloid as imaged by 11C-PIB, 25 which was confirmed in our cohort of 74 A + T+ patients. This supports the hypothesis that in subjects with AD, CCD is due to neurodegeneration that is unrelated to local amyloid pathology. This finding is in line with previous reports on neurodegeneration in AD being related to topographical distribution of tau more strongly than β-amyloid.32,33,73–76 The fact that in our cohort, the relationship between tau and CCD was mediated by cortical hypometabolism in A + T+ subjects suggests that tau pathology drives the diaschisis in AD. This is not surprising, given the known relationship between topographical distribution of 18F-Flortaucipir and neurodegeneration.32,33,75,76 The absence of an association between tau and CCD in β-amyloid negative patients further supports this hypothesis, since in most cases these subjects present negligible or very mild 18F-Flortaucipir binding in the cortex compared to AD patients. 55
The lack of association between the cerebellar IA of 18F-FDG, 18F-Flortaucipir and 11C-PIB in our biomarker-confirmed AD patients supports the hypothesis that cerebellar asymmetry of glucose metabolism is truly reflecting diaschisis from supratentorial involvement rather than contribution from local AD pathology. We cannot exclude, however, local factors that may play a role in some specific cases, such as in subjects with advanced disease or autosomal dominant AD, since amyloid does accumulate in the cerebellum in very late stages of the disease, 77 even leading to increased signal on 11C-PIB in very rare cases.78,79 Furthermore, it is known that persistent CCD can be associated with irreversible degeneration6,10 and even atrophy perceptible on structural imaging in severe cases.80,81 This may explain recent findings of a higher rate of cerebellar atrophy in Alzheimer’s disease and frontotemporal dementia.82,83
Finally, regarding the clinical significance of CCD, in stroke, some studies have suggested an association of CCD with stroke severity, infarct volume and worse clinical outcome. However, Pappata et al. found no clinical correlates, 84 hence, prognostic value and clinical significance of this phenomenon remain controversial.6,7,11,43–45,57,85 In glioma, CCD was shown to be associated with shorter survival. 46 Similar to the correlation between the degree of CCD and clinical scale of stroke severity demonstrated by Szilagyi et al., 86 we found that cerebellar IA on 18F-FDG showed a weak correlation with clinical measures of dementia severity. Although the p values were statistically significant for these associations, the small r2 values suggest that these correlations may not be clinically meaningful. Furthermore, our mediation analysis suggests that this association is primarily driven by greater supratentorial asymmetry in patients with more severe disease. Larger longitudinal studies would be needed to investigate the relationship between CCD, disease progression and cognition.83,87–89 The presence of CCD did not seem to impact cerebellar function as measured on neurological exam in our patient cohort, although the retrospective nature of this study limits the validity of these findings, especially our sensitivity to identify clinical correlates.
One technical consideration arising from our results is that supratentorial neurodegeneration can have a functional impact on cerebellar metabolism and therefore affect uptake in a cerebellar ROI. This should be considered when choosing a reference region for PET processing, as previously suggested by other authors. 83 Similarly, abnormalities in cerebellar metabolism, even in the absence of frank asymmetry, should be considered during clinical interpretation of FDG PET scans, especially when considering the cerebellum as a “reference” for evaluation of supratentorial activity.
The present study has several limitations. Although the patient cohort was large (n = 197) compared to previous reports of CCD in neurodegenerative conditions, the relationship between 18F-FDG, 11C-PIB and 18F-Flortaucipir could only be studied in a relatively limited number of participants (n = 74). In addition, the relationship between proteinopathies underlying non-AD disorders (such as non-AD tauopathies, TDP-43, FUS) and CCD could not be assessed since no PET tracer is currently available to measure non-AD proteinopathies. Furthermore, our cohort is a convenience sample that is not representative of a typical clinical population given the relatively young mean patient age and high prevalence of atypical Alzheimer’s disease phenotypes and non-AD disorders. The current findings, therefore, may not be generalizable to older, more typical AD populations. We must also recognize that the present study did not consider other causes of cerebellar hypometabolism, which, although rare, could cause false positive CCD on PET, such as cerebellar infarcts or other vascular lesions, spinocerebellar degeneration, ataxia syndromes, cerebellitis, and congenital malformations.90–92 These cases, however, if presenting with isolated cerebellar asymmetry on 18F-FDG in the absence of contralateral supratentorial asymmetry, would not be considered to have CCD according to our operational definition, and such abnormalities would be identified on visual inspection of structural MRI. Additional limitations include the interval between PET scans using all 3 tracers which was relatively long in some patients, although results did not change when restricting analyses to patients with an interval between scans of less than a month. Finally, the retrospective nature of the study led to variation in between scan intervals and missing data in some participants. For instance, tests of cerebellar function were assessed retrospectively in patients’ charts and were not available in all subjects. Prospective studies with a more detailed assessment of cerebellar function would be pertinent.
In summary, CCD is common in patients with neurodegenerative syndromes, and is more prevalent with certain clinical phenotypes, especially those with typically asymmetric presentations such as CBS, svPPA and lvPPA. In patients with AD, as demonstrated by 11C-PIB and 18F-Flortaucipir, the association between cerebellar asymmetry on 18F-FDG and cortical 18F-Flortaucipir suggests a tau-related disruption of cortico-ponto-cerebellar pathways, while amyloid does not seem to play a direct role. Further studies are required to elucidate the prognostic value and clinical correlates of CCD.
Supplemental Material
sj-pdf-1-jcb-10.1177_0271678X211001216 - Supplemental material for Crossed cerebellar diaschisis on 18F-FDG PET: Frequency across neurodegenerative syndromes and association with 11C-PIB and 18F-Flortaucipir
Supplemental material, sj-pdf-1-jcb-10.1177_0271678X211001216 for Crossed cerebellar diaschisis on 18F-FDG PET: Frequency across neurodegenerative syndromes and association with 11C-PIB and 18F-Flortaucipir by Karine Provost, Renaud La Joie, Amelia Strom, Leonardo Iaccarino, Lauren Edwards, Taylor J Mellinger, Julie Pham, Suzanne L Baker, Bruce L Miller, William J Jagust and Gil D Rabinovici in Journal of Cerebral Blood Flow & Metabolism
Footnotes
Funding
The author(s) disclosed receipt of the following financial support for the research, authorship, and/or publication of this article: This study was supported by National Institute on Aging grants (R01-AG-045611 to G.D.R.; P30-AG062422 to B.L.M. and G.D.R.; P01-AG19724 to B.L.M, K99AG065501 to R.L.J.), Rainwater Charitable Foundation (Tau Consortium) (to G.D.R. and W.J.J.), the Alzheimer’s Association (AARF-16-443577 to R.L.J.), State of California Department of Health Services Alzheimer’s Disease Research Centre of California grant (04-33516 to B.L.M.) and a gift from Edward and Pearl Fein (to G.D.R.).
Acknowledgements
We would like to acknowledge all patients and caregivers for their time and participation in this study. Avid Radiopharmaceuticals enabled use of the precursor for 18F-Flortaucipir but did not provide direct funding and was not involved in data analysis or interpretation.
Declaration of conflicting interests
The author(s) declared the following potential conflicts of interest with respect to the research, authorship, and/or publication of this article:
Authors’ contributions
K.P.: study conception and design, acquisition of data, analysis, interpretation, drafting and revision of manuscript; R.L.J.: study conception and design, acquisition of data, analysis, interpretation, drafting and revision of manuscript; A.S.: study conception and design, acquisition of data, analysis, interpretation, critical revision of manuscript; L.I.: study conception and design, data analysis, interpretation, critical revision of manuscript; L.E.: study conception and design, acquisition of data, analysis, interpretation, critical revision of manuscript; T.J.M.: acquisition of data, critical revision of manuscript; J.P.: acquisition of data, critical revision of manuscript; S.L.B.: data acquisition, analysis, critical revision of manuscript. B.L.M.: acquisition of data, critical revision of manuscript; W.J.J.: study conception and design, acquisition of data, interpretation, critical revision of manuscript; G.D.R.: study conception and design, acquisition of data, interpretation, critical revision of manuscript. All authors have approved the final version of the manuscript.
Supplementary material
Supplemental material for this article is available online.
References
Supplementary Material
Please find the following supplemental material available below.
For Open Access articles published under a Creative Commons License, all supplemental material carries the same license as the article it is associated with.
For non-Open Access articles published, all supplemental material carries a non-exclusive license, and permission requests for re-use of supplemental material or any part of supplemental material shall be sent directly to the copyright owner as specified in the copyright notice associated with the article.