
Abstract
Blood oxygenation level-dependent fMRI contrast depends on the volume and oxygenation of blood flowing through the circulatory system. The effects on image intensity depend temporally on the arrival of blood within a voxel, and signal can be monitored during the time course of such blood flow. It has been previously shown that the passage of global endogenous variations in blood volume and oxygenation can be tracked as blood passes through the brain by determining the strength and peak time lag of their cross-correlation with blood oxygenation level-dependent data. By manipulating blood composition using transient hypercarbia and hyperoxia, we can induce much larger oxygenation and volume changes in the blood oxygenation level-dependent signal than result from natural endogenous fluctuations. This technique was used to examine cerebrovascular parameters in healthy subjects (n = 8) and subjects with intracranial stenosis (n = 22), with a subgroup of intracranial stenosis subjects scanned before and after surgical revascularization (n = 6). The halfwidth of cross-correlation lag times in the brain was larger in IC stenosis subjects (21.21 ± 14.22 s) than in healthy control subjects (8.03 ± 3.67), p < 0.001, and was subsequently reduced in regions that co-localized with surgical revascularization. These data show that blood circulatory timing can be measured robustly and longitudinally throughout the brain using simple respiratory challenges.
Introduction
Compromised blood flow velocity (measured in cm/s) and regional cerebral blood flow (CBF; measured in ml/100 g/min) are two of the primary targets of hemodynamic imaging in patients with cerebrovascular disease, and these parameters also have broader relevance as surrogate markers of neuronal activity or microvascular compliance. Detecting and monitoring the extent of these hemodynamic metrics is critical for optimizing medical management and triaging patients with cerebrovascular disease to appropriate surgical intervention, as well as in evaluating parenchymal response to pharmacological or surgical interventions, disease progression, lifestyle modifications, or task performance (e.g. in response to functional stimuli).
There are several existing methodologies for measuring macrovascular blood flow and inferring blood flow velocity and/or arrival time, including digital subtraction angiography (DSA), CT perfusion (CTP), transcranial Doppler ultrasound (TCD), MRI time-of-flight (TOF) and phase contrast angiography (PCA) techniques. CBF can additionally be measured using single photon emission computed tomography (SPECT), positron emission tomography (PET), dynamic susceptibility contrast imaging (DSC-MRI), or more recently noninvasive arterial spin labeling (ASL) MRI. With the exception of TCD and PCA, which measure local blood velocity directly, these techniques derive flow information by “TOF” measurement of either an exogenous or endogenous contrast agent. More specifically, a bolus of blood is tagged at a known location, either by injecting an exogenous material that changes the imaging signal properties, or by exogenously or endogenously altering properties of the blood in situ. The tagged blood then travels through the vasculature and is detected at a distal location. It is worth noting that blood velocity and arrival time, while related, are distinct quantities, as the former is a local quantity, and the latter reflects the velocity of blood along the entire path to the location. The time it takes for the bolus to travel to the region of interest, and the distance travelled, can be used to infer flow properties, and upon application of appropriate models, estimate CBF.
While this basic procedure is straightforward, existing clinical implementations of TOF flow measurements have two major drawbacks. First, techniques that rely on intravenous contrast agents or radiation exposure generally have limits on how frequently or how many times they can be repeated, owing to dose restrictions; this limits the utility of these methods for assessing treatment response or disease progression longitudinally. Second, low blood flow velocity can be difficult to quantitate for a variety of reasons: ASL MRI, which uses no exogenous contrast, relies on inverted magnetization, which has a relatively short tag lifetime (arterial blood water T1 at typical field strengths of 1.5 T–3.0 T is only 1.2 s–1.7 s), and therefore delays between blood water labeling and arrival of the label at the tissue exchange site are difficult to measure when blood arrival time is delayed much longer than a few seconds, which occurs quite commonly in patients with flow-limiting steno-occlusive cerebrovascular disease. Additionally, measuring long delay times using CTP or DSA requires technical planning to prolong or delay the timing of the acquisition, or additional radiation to increase the number of imaging sampling points after contrast injection. As such, the ideal blood flow imaging method would (1) have no injected contrast (2) require no ionizing radiation, and (3) permit quantitative measurement of blood flow parameters over the full range of possible flow rates.
Recently, endogenous blood oxygenation fluctuations in susceptibility-weighted blood oxygenation level-dependent (BOLD) MRI signals have been explored using simultaneous BOLD fMRI and Near Infrared Spectroscopy (NIRS), an optical method to measure changes in hemoglobin. Endogenous, non-neuronal fluctuations in hemodynamic parameters account for up to 30% of the variance in gray matter BOLD. 1 Utilizing this information, a method has been proposed to determine relative blood arrival times by using a NIRS measurement to quantify these fluctuations, and to calculate the time delay with BOLD using a procedure analogous to cross-correlation.1–5 This method makes use of the fact that much of the “noise” in the BOLD signal timecourse arises from endogenous fluctuations of blood oxygenation and volume; this noise varies across the brain owing to the fact that blood arrives at each voxel at a time determined by the characteristics of the local parenchyma and vasculature serving that region of the brain.
While this NIRS cross-correlational fMRI data processing method has been demonstrated, the current implementation requires specialized equipment (NIRS) that is not yet widely available. This regressor can be estimated from the BOLD data itself, for example by extracting data from the superior sagittal sinus, 6 and this has recently been demonstrated for imaging delays in patients with moyamoya disease. 7 An alternative to using endogenous oxygenation fluctuations in blood is to create blood oxygenation increases using a hyperoxic or hypercapnic hyperoxic (i.e. carbogen) gas challenge. Manipulations of inhaled gases via breath holding or experimenter-administered exogenous gases are frequently used in MR imaging to enhance contrast or to calibrate the BOLD signal for quantitative measurement of cerebral oxygen metabolism.8–14 Gas challenge experiments are performed to determine now near musculature is to exhausting reserve capacity by quantifying changes in blood flow and volume in response to a vascular challenge (e.g. hypercapnia).15–18 This intervention has three advantages. First, the only additional supplies required are gases and MR compatible gas administration equipment, which are easily utilized in clinical neurovascular imaging suites.19,20 Second, the oxygenation change that can be induced with alternating normoxic and hypercarbic gas is large compared to endogenous fluctuations, so the amplitude of the hemodynamic signal used for time delay estimation is even higher, leading to more stable measurement. The changes in endogenous blood oxygenation may additionally be amplified by adding a hyperoxic component to the hypercarbic gas mixture, as in the case of carbogen.21,22 It is also important to note that since the “tag” is a waveform of chemical concentration, rather than a transient state of magnetic excitation, it has essentially unlimited lifetime, which allows quantification of extremely long time delays on the order of many seconds or even minutes. Third, hyperoxic gas mixtures can produce reproducible cerebrovascular effects.23,24 A recent study in 92 patients with symptomatic cerebrovascular disease found no immediate stroke-related complications in response to hypercapnic hyperoxic administration, and longer-term neurological events fell within the range of expected events in this population. 25
The overall goal of this work was to apply time delay processing of hypercapnic hyperoxic gas stimuli in a cohort of healthy control volunteers with no cerebrovascular disease and in patients with symptomatic intracranial stenosis. Results are intended to provide a quantitative framework for applying this procedure in vivo, report control values that can serve as an exemplar for the normative ranges of hypercapnia/hyperoxia-induced transit times in healthy tissue, and finally to demonstrate how these metrics adjust following surgical revascularization in a subset of patients with intracranial stenosis. Regional differences in time delay metrics are further contrasted with symptomatology and angiographically confirmed vasculopathy extent in patients to demonstrate the potential clinical relevance of the procedure.
Materials and methods
Data acquisition
Functional data were recorded from healthy control subjects (n = 8; 5 M; 3 F 32.8 ± 9.0 years) and a cohort of consecutively referred subjects with cerebrovascular vasculopathy who were enrolled in the Vanderbilt Assessment of Multi-Modal MRI in Patients at-Risk for Stroke with Intracranial Stenosis (VAMMPRIS) study (n = 21). The subjects with cerebrovascular disease were heterogeneous with respect to diagnoses: 13 had moyamoya disease, 7 had atherosclerosis, and one subject had a resected occipital tumor, and was excluded from further analysis. Of the subjects with atherosclerosis, one had a prior overt stroke, and is considered separately. Control subjects were studied to evaluate protocol feasibility and determine the range of hemodynamic parameters in healthy volunteers. The cohort of patients was studied to assess how hemodynamic impairment implied by delayed blood transit time correlated with known clinical measurements of impairment as quantified by vasculopathy. Additionally, in the subset of moyamoya patients undergoing indirect surgical revascularization, correlations between hemodynamic impairment and angiographic findings were evaluated before and after revascularization. All subjects provided informed, written consent. Vanderbilt University’s Institutional Review Board approved the research protocol, which was conducted in accordance with the ethical principles of the Belmont Report.
MR images were acquired on a 3 T Philips Achieva MR (Philips, Best, the Netherlands) scanner using body coil transmission and an 8-channel SENSE head coil for reception. Participants were fitted with a custom non-rebreathing gas delivery mask and asked to lie quietly in the scanner during the image acquisition. Reproducibility and sensitivity of this gas delivery setup were assessed in previous work. 26 After acquisition of localizers and a T1-weighted high spatial resolution anatomic scan, a BOLD acquisition was performed during a transient hypercarbia challenge (gradient echo EPI, flip angle = 90°, matrix = 80 × 80 on a 220 × 220 mm FOV, 30 5 mm slices parallel to the AC-PC line extending down from the top of the brain TR = 2 s, 450 timepoints. Medical grade room air (∼21%O2/∼79% N2/ < 1% trace elements) and carbogen (5% CO2/95% O2) were alternately delivered through the mask in three-minute blocks (air-carbogen-air-carbogen-air) during the scan. Carbogen, rather than CO2 or pure oxygen, was chosen as the probe gas for safety reasons (as pure oxygen can cause constriction in cerebral vessels) and its known ability to elevate both arterial and venous blood oxygenation (the primary contrast of interest) more significantly than hypercapnic normoxic gas stimuli. 25
Analysis
Data were analyzed using an iterated RIPTiDe procedure (described in literature3,6,27 and below) to isolate and refine the moving hemodynamic component of the BOLD signal by examining the temporal cross-correlations the BOLD data and a probe regressor derived from the timecourse of hypercarbia.
Preprocessing
All data were preprocessed using FSL 5.0.4 (slice time correction, motion correction, temporal highpass filtering at 360 s (one cycle of the gas administration), spatial smoothing with a 3 mm kernel). Functional data were registered to the subject’s own high spatial resolution anatomic T1 data, which was in turn transformed to a standard neuroanatomical reference space, the Montreal Neurological Institute (MNI) atlas space MNI ICBM152, 28 which allows registration and alignment of imaging data between subjects.
RIPTiDe processing
Data were processed using an accelerated implementation of the RIPTiDe method based on oversampled cross-correlation (RapidTiDe), which is several orders of magnitude faster than previous techniques that use multiple runs of fsl_glm. All timecourses (the preprocessed BOLD data and the probe regressor) were resampled in time to increase the effective time resolution by a factor of 8, then bandlimited to 0.01 to 0.15 Hz, prior to cross-correlation. While this does not increase the actual temporal resolution of the data, it simplifies the determination of the peak cross-correlation lag time. A voxelwise weighted cross-correlation was performed, and the cross-correlation function was extracted over a specified time lag range (−20 to +90 s of delay between the probe regressor and the BOLD data.) A Gaussian function was fit to the peak of the cross-correlation to derive the peak time delay, width, and the correlation coefficient (R) at every location. This allowed stable estimation of sub-TR time delays. These parameters, (peak delay, width, and R value), as well as the correlation function over the specified time lag range were output as NIFTI files for further analysis. This procedure is shown schematically in Figure 1.
Schematic depiction of the refined RIPTiDe analysis procedure.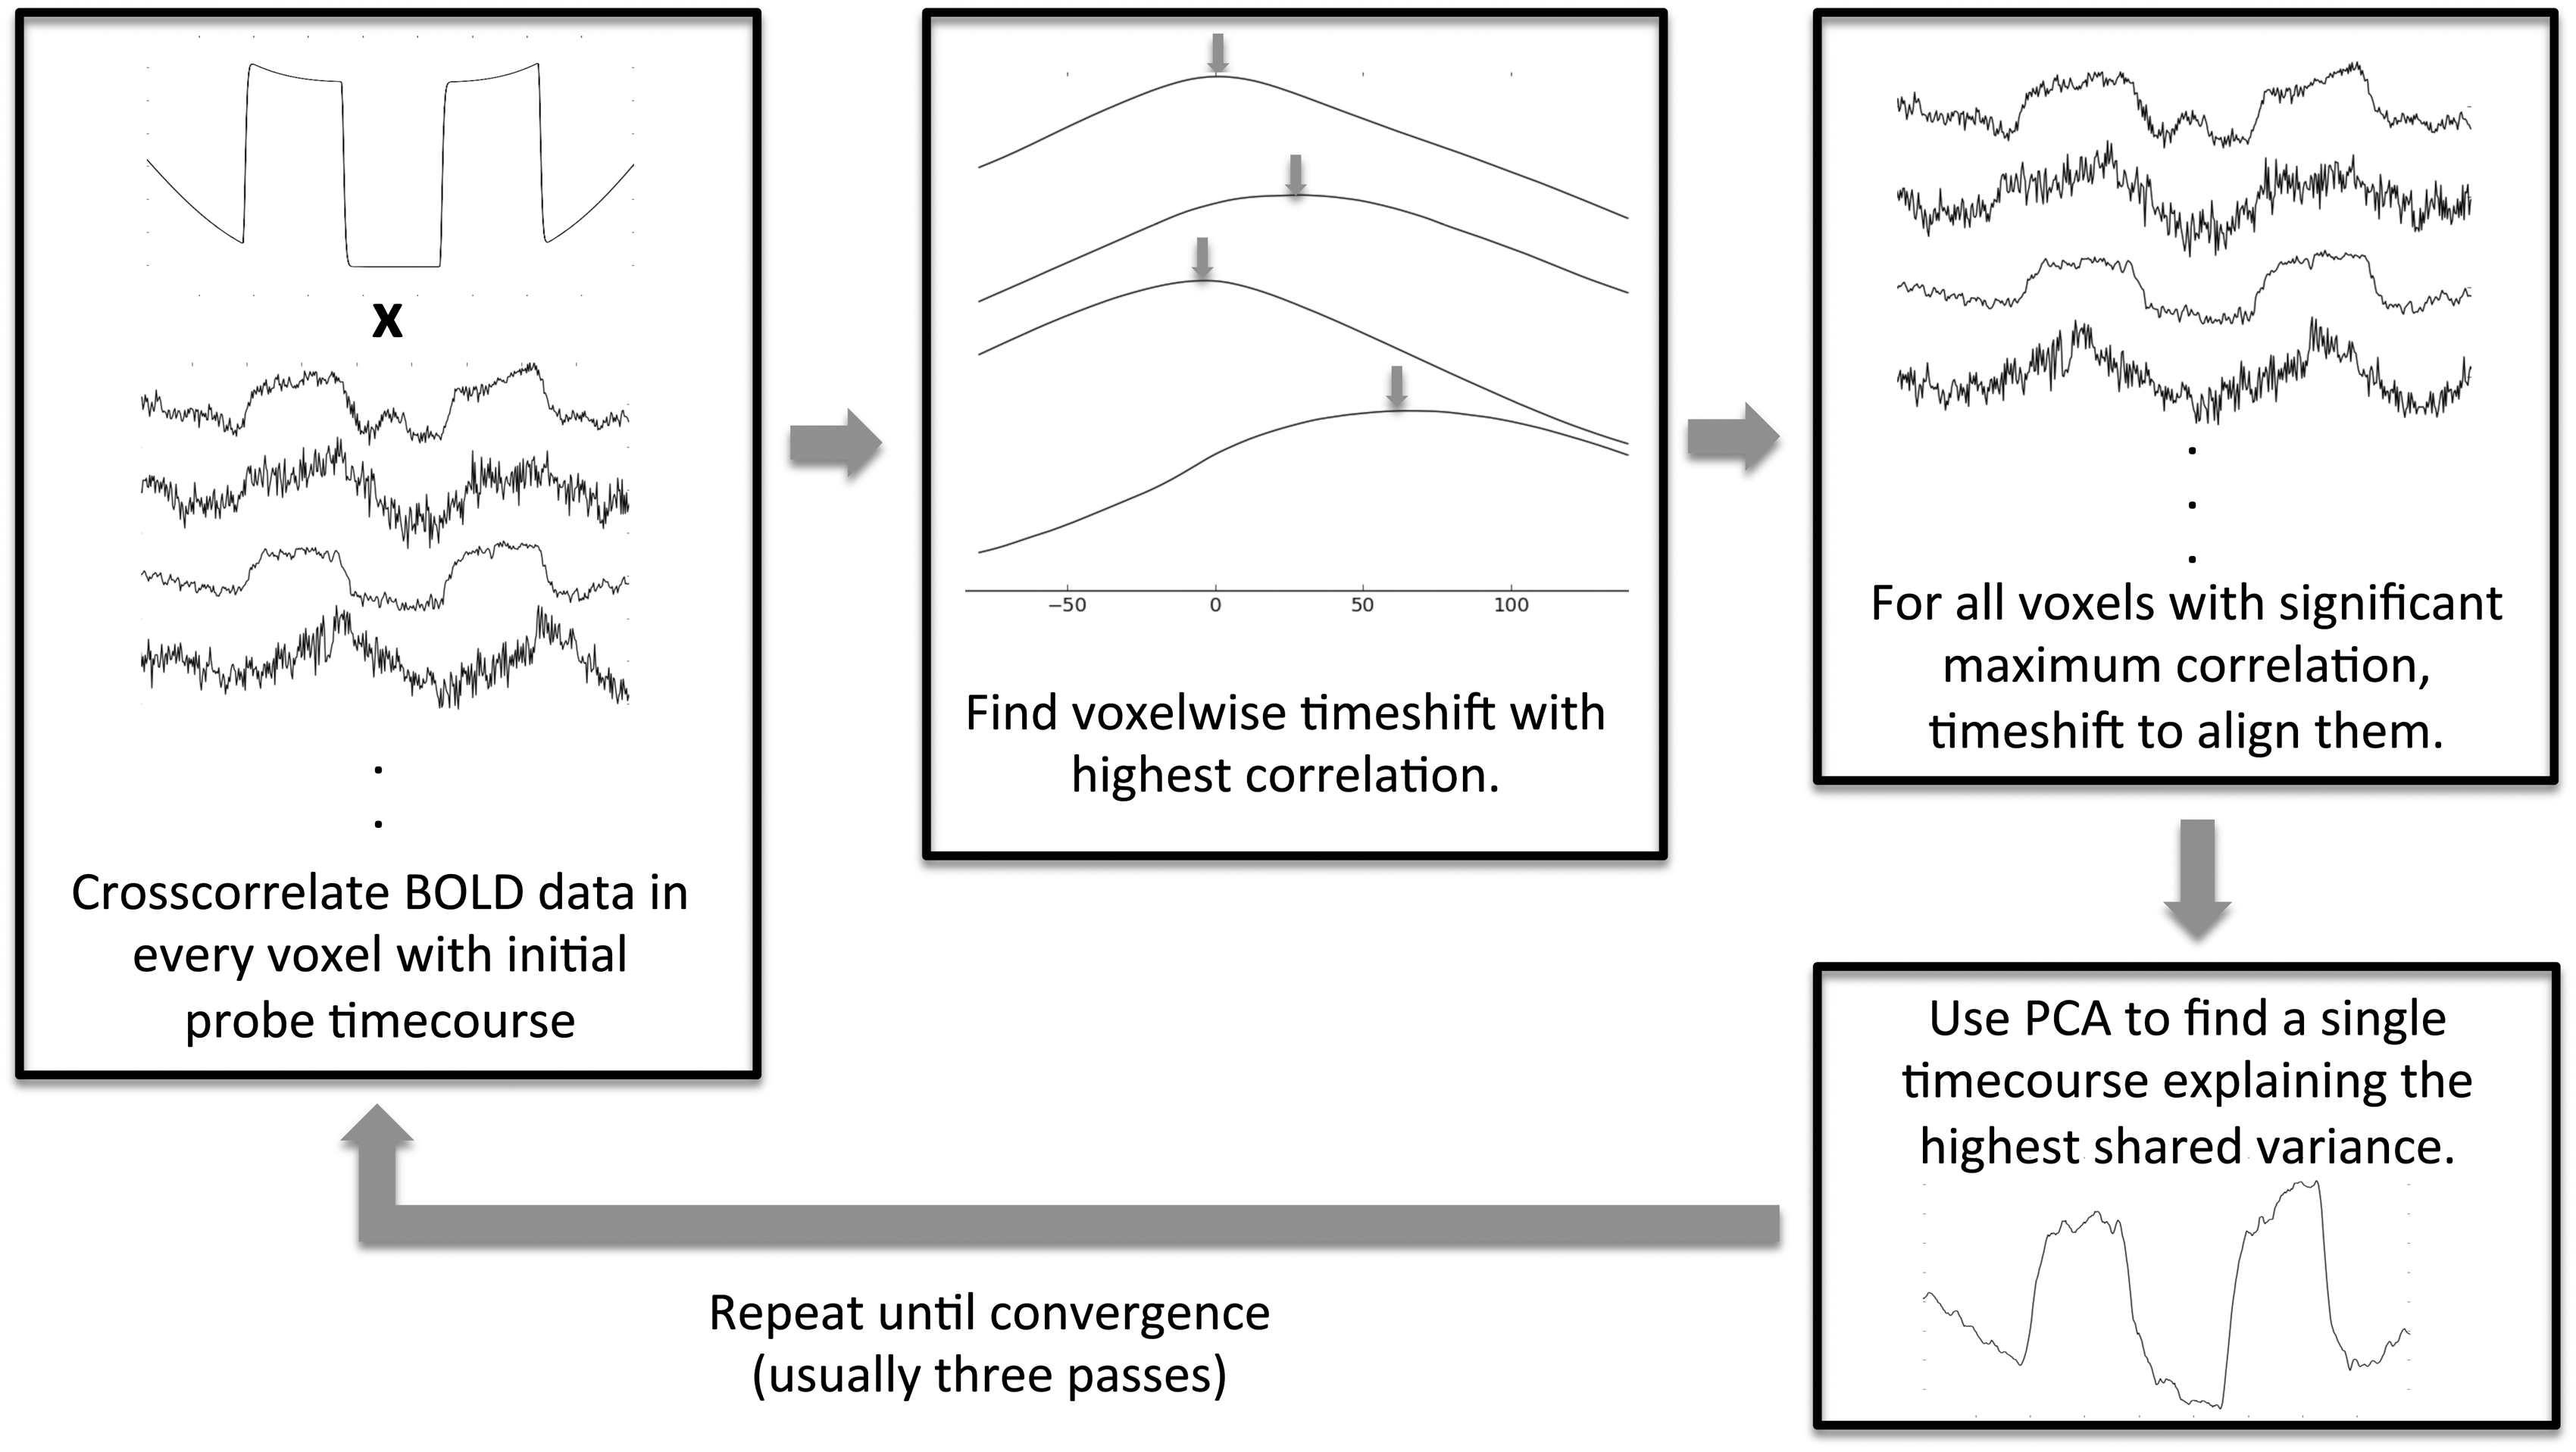
The timecourse of gas administration (the epochs of room air versus carbogen) was correlated with the BOLD data using the RIPTiDe procedure to find the voxel specific time shift and correlation with the BOLD signal throughout the brain. The BOLD signal from each voxel was then time shifted so that the common component was in phase. A principal component analysis of the weighted, aligned timecourses was used to generate a refined estimate of the global hemodynamic signal. The procedure was repeated with the new regressor until convergence (3 iterations). This refinement procedure aims to account for the fact that individual subjects’ blood oxygenation waveforms, while similar to the block diagram of the gas administration, are in fact a complicated function of factors such as gas absorption in the lungs; respiratory phase, respiratory depth and rate; and other perhaps unknown factors which are difficult to model a priori. By using a data-based refinement procedure, knowledge of this transfer function is unnecessary.
Once the regressor converged, the maximum correlation strength, peak time delay and correlation peak width maps was examined to determine circulatory function. Because of variability in gas propagation to the mask, due to differences in breathing patterns between subjects and between scanning sessions, the absolute time shift of the correlation peak was specific to individual physiology. In order to compare data between subjects and between runs of the same subject, time delays were normalized to a reference voxel in the cerebellum. The blood arrival time was set to zero in a reference voxel in the center of the cerebellum (MNI coordinate 0, −57, −27). In patients with bilateral steno-occlusive disease, as is the case in moyamoya disease, there may be no true reference region. However, as moyamoya is known to affect the posterior circulation less than the anterior and medial circulation, and also, as our patients had largely intracranial disease, supratentorial regions were avoided as a possible reference. The cerebellum has been validated as a reference region for oxygen extraction fraction PET studies of moyamoya disease and atherosclerotic steno-occlusive disease in the absence of crossed cerebellar diaschisis, and the circulation in this region is less affected in the patients in this study. 29 We therefore selected it as the reference region for normalizing temporal delay maps.
Correlation parameter maps
The data-refined hypercarbia timecourse probe regressor is strongly temporally correlated with the BOLD data over a wide range of time delays in almost every voxel of the brain. Four types of parameter maps can be generated that are useful in understanding cerebral blood flow: three independent parameters, and one summary measure. We start with a brief explanation of these parameters, followed by examples of their normative values and how they are affected by pathology.
R2 map
The R2 Map reflects the spatial distribution of the blood signal in the brain, and represents the distribution of blood modulated by vascular reactivity in response to the gas challenge. The maximum squared correlation coefficient in a given voxel gives a measure of the degree to which the blood signal contributes to the BOLD signal in the voxel, specifically, it is the proportion of the signal variation explained by the refined timecourse of gas administration; a larger correlation value indicates a stronger contribution from the blood signal. Pathologies affecting vascular reactivity will yield decreased R2 in the affected voxels compared to normal control data. This magnitude is related to relative cerebral blood volume (rCBV), hematocrit, and baseline blood oxygenation.
Correlation time to peak map
The TTP map displays the spatial distribution of delay in brain blood flow. The peak of the correlation function occurs at the time when the probe signal and the BOLD data are optimally synchronized, which depends directly on the time when the blood carrying the waveform passes through the voxel. By comparing arrival times between voxels either within brain regions or across brain regions by normalizing to a reference region (in our case the cerebellum), an absolute parameter of the vasculature supplying blood to the voxel can be measured reliably, and over a broad range of times (relative tissue arrival delays of over 100 s have been observed in this dataset). This parameter can be compared between subjects and between timepoints in the same subject longitudinally to assess changes in blood propagation through the brain.
Correlation peak width
This parameter is proportional to the mean transit time (MTT) of blood through a voxel. The slower blood flows within a voxel, the broader the correlation peak with the probe waveform. However, converting this parameter to an actual MTT measurement comparable with that measured with DSC-MRI or CTP would require deconvolution with the probe waveform, which is not practical with a square wave gas challenge protocol. As a result, the measure was not a primary metric in this work.
Full correlation function
By presenting changes in the correlation function over space as a movie at the rate they occur in real time, maximum correlations (R2), blood arrival times, and transit times are revealed as blood-borne signals traveling with different delays through different brain regions. This provides a compact representation of CBF parameters described above that allow assessment of hemodynamic impairment.
Data registration and averaging
For volumetric comparison or averaging of datasets, individual subject’s parameter maps were transformed into MNI152 standard space using FLIRT (FSL 5.0.4, FMRIB). For comparison on surfaces, individual subject’s data were registered to the target subject’s surface using mri_vol2surf (part of Freesurfer 5.3.0).
Cortical visualization
Correlation data were analyzed using both volumetric and surface based image tools. Volumetric data were aligned to the MNI152 reference brain for comparison between timepoints using FLIRT and FSLview (FSL 5.0.4, FMRIB). The high spatial resolution T1 anatomic images were also processed in Freesurfer 5.3.0 (REF).30–39 Delay parameters were registered to the Freesurfer volumes using reg-feat2anat and projected onto the surface halfway between the gray-white boundary and the cortical surface, and surface smoothed with a 3 mm kernel so that data could be mapped to each subject’s cortex.
Clinical imaging and assessment
For structural imaging, whole-brain T1-weighted MPRAGE images were acquired with TR/TE/TI = 8.1/3.8/818.7 ms, flip angle = 8
Results
Normative values
In order to establish normative values for correlation measures, healthy control subjects underwent the same gas challenge imaging experiment used on the patient population. Data were processed using the same methodology later used on the patient data, and averaged both volumetrically over the whole brain, and on the cortical surface. Figure 2 shows the average R2 and TTP maps for seven healthy controls, after exclusion of one subject for poor data quality. The halfwidth of the delay times in the brain was determined as the difference of the 25% and 75% percentiles of the delay histogram (this calculation method is robust even for the non-Gaussian delay distributions observed in IC subjects). The majority of the voxels (over the whole brain) are clustered in a peak with a halfwidth of 8.03 ± 3.67 s.
Normative data in healthy control subjects. (a) Shows the groupwise R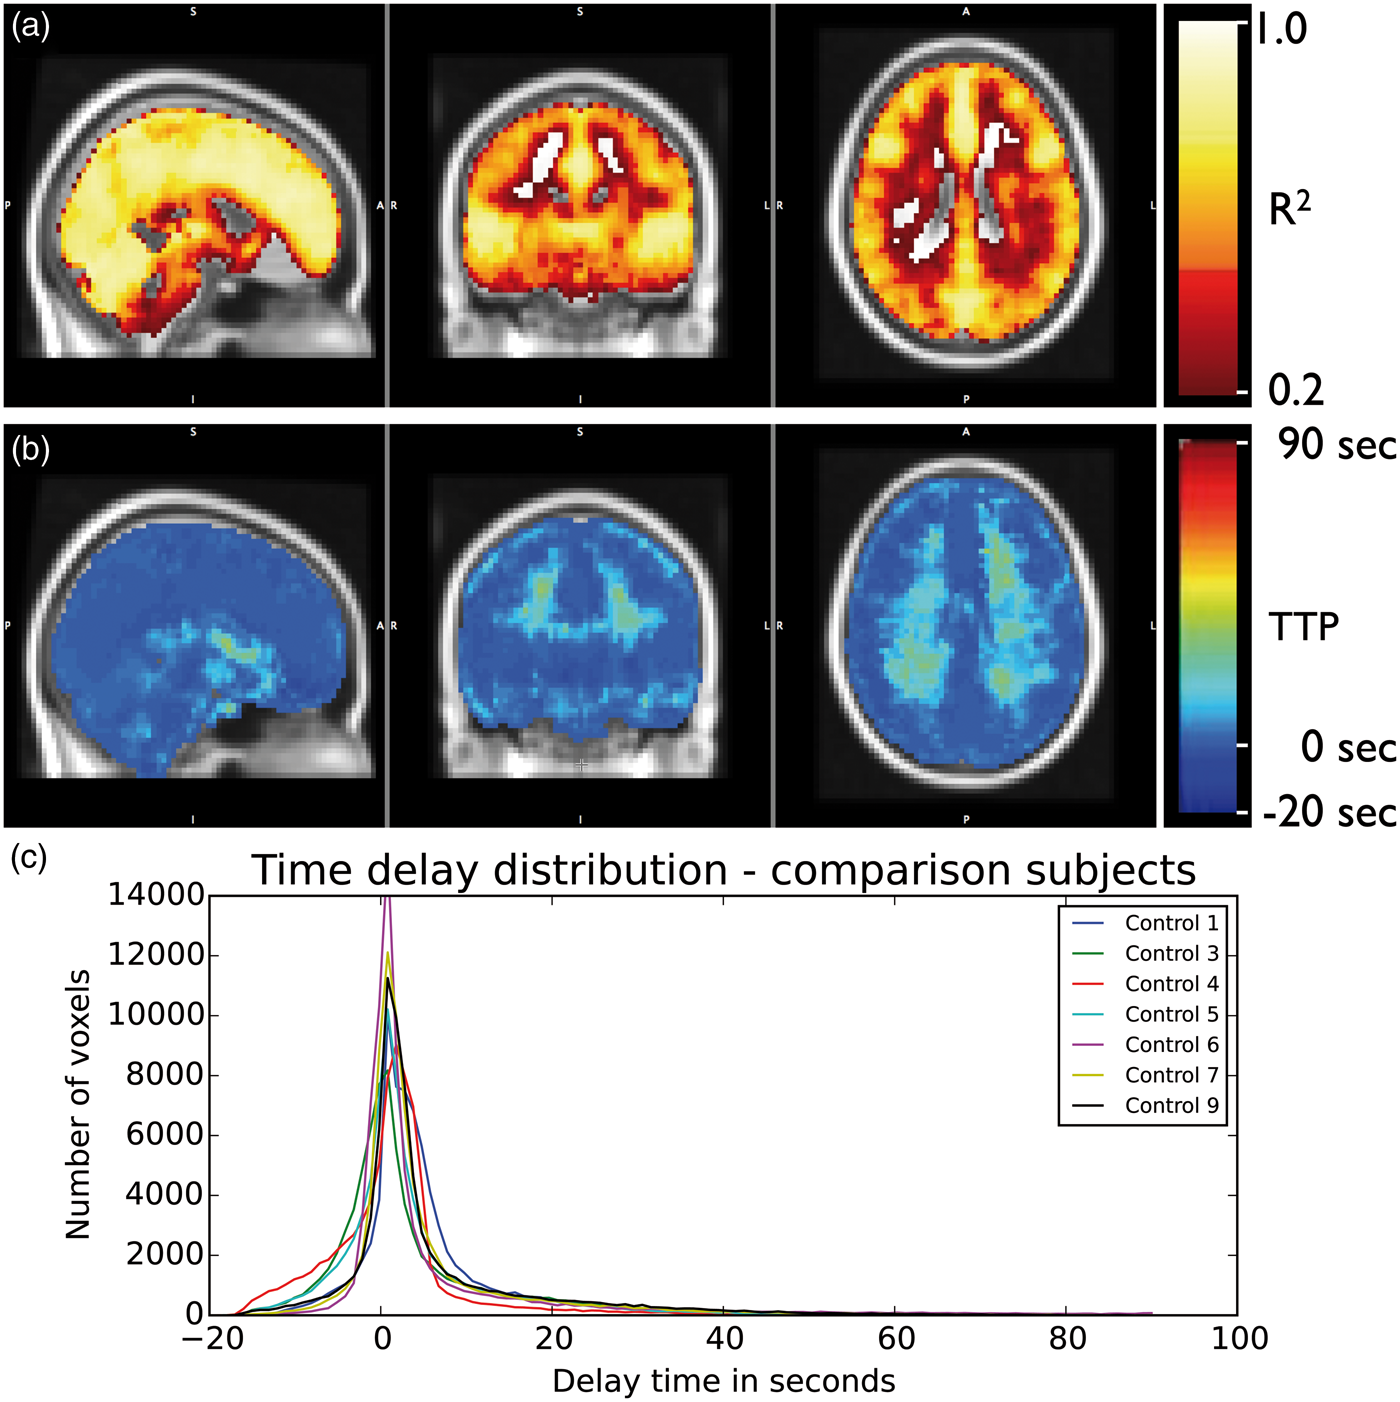
Moyamoya disease
Of the 22 intracranial stenosis subjects studied, 13 had idiopathic moyamoya disease. Images from a representative moyamoya patient in Figure 3 demonstrate parenchymal hemorrhage in the right centrum semiovale (Figure 3(a)). Moyamoya disease is a progressive arteriopathy characterized by terminal ICA stenosis due to intimal thickening. With disease progression, ACA and M1 vessels are often involved, with less frequent PCA involvement. The characteristic “puff of smoke” identified with DSA (Figure 3(c)) represents the dilated perforating network of abnormal moyamoya vessels, which form as the distal ICA occludes. This is clearly manifested as delayed TTP in the right hemisphere (Figure 3(e)). Interestingly, this pronounced effect is not readily visible in the R2 map (Figure 3(d)), indicating that the CVR in this regions, while extremely delayed, is still of relatively normal magnitude. The delay time distributions for all moyamoya subjects are shown in Figure 3(f). All subjects show a large number of voxels with atypically long delay times compared to controls.
Circulatory changes in moyamoya disease. Axial T2*- (a) and FLAIR-weighted (b) MR images show right centrum semiovale hemorrhage in a 31-year-old female with moyamoya disease. AP projection from right common carotid injection during DSA (c) 19 months following indirect revascularization shows neoangiogenesis from superficial temporal artery bypass (arrow). (d) Shows R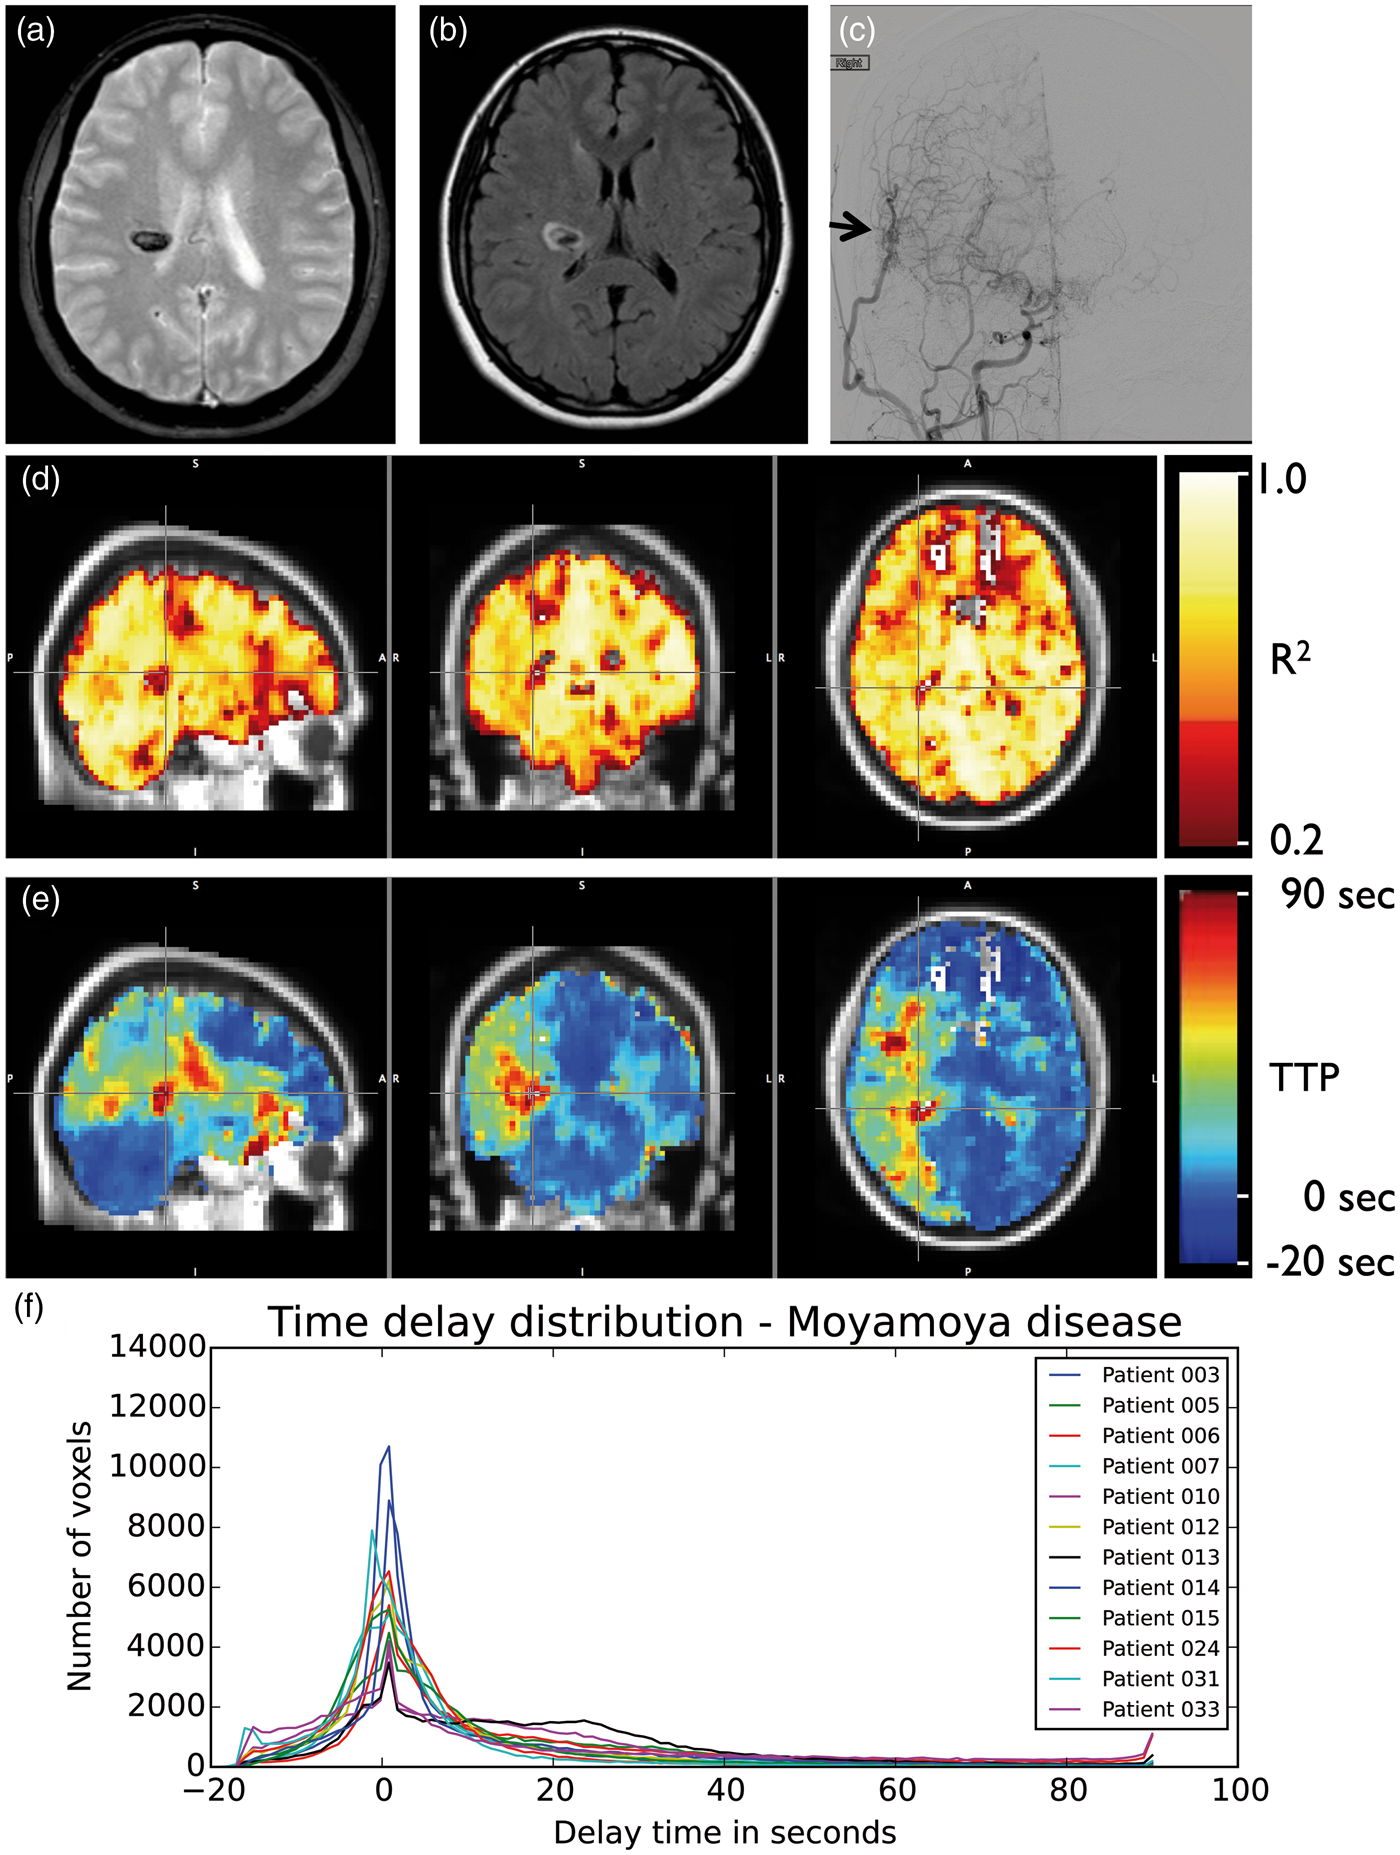
The distribution of delay times in the affected vascular territory in subjects with moyamoya disease (Figure 3(f)) can be clearly differentiated visually from those in control subjects (Figure 2(c)). In statistical terms, this can be summarized through the distribution’s halfwidth (22.06 ± 14.72 s in moyamoya vs. 8.03 ± 3.67 in controls) and kurtosis. Kurtosis is a measurement of “peakiness”; the steeper and narrower the distribution is, the higher the kurtosis. The healthy controls delay distributions have high kurtosis, while in moyamoya patients, more voxels are further distributed over a larger range of lag times due longer delays in the regions in which the blood supply is slower (affected area), and kurtosis is reduced.
To account for the lateralization of affected regions in moyamoya patients we split our voxels into three vascular territories: those served by the left and right middle anterior carotid artery respectively, and those served by the posterior carotid artery. We calculated the kurtosis for each subject (both control as well as moyamoya patients) by territory. The region with the lowest kurtosis was selected for each subject and taken as their ‘most affected side’. In all moyamoya patients, the ‘most affected side’ had lower kurtosis than the ‘most affected side’ of any control subject. A typical example of the distribution for both control subject and moyamoya patient of their ‘most affected side’ is shown in Figure 4.
Depiction of delay time distribution in the most affected hemisphere in moyamoya patients (measured using kurtosis). Panel A shows an example of a typical time delay distribution and its corresponding kurtosis as seen in the affected vascular territory of a moyamoya patient (kurtosis of 5.96) and in the more-kurtotic hemisphere of a control participant (kurtosis of 35.14). Panel B shows the difference in delay times between controls and moyamoya patients. Panel C shows pre- and post-treatment differences in the kurtosis of the delay times of the most affected hemisphere (as determined by modified Suzuki score) in five moyamoya patients who were evaluated before and after EDAS revascularization. Postsurgically, kurtosis values tend to increase toward normal levels.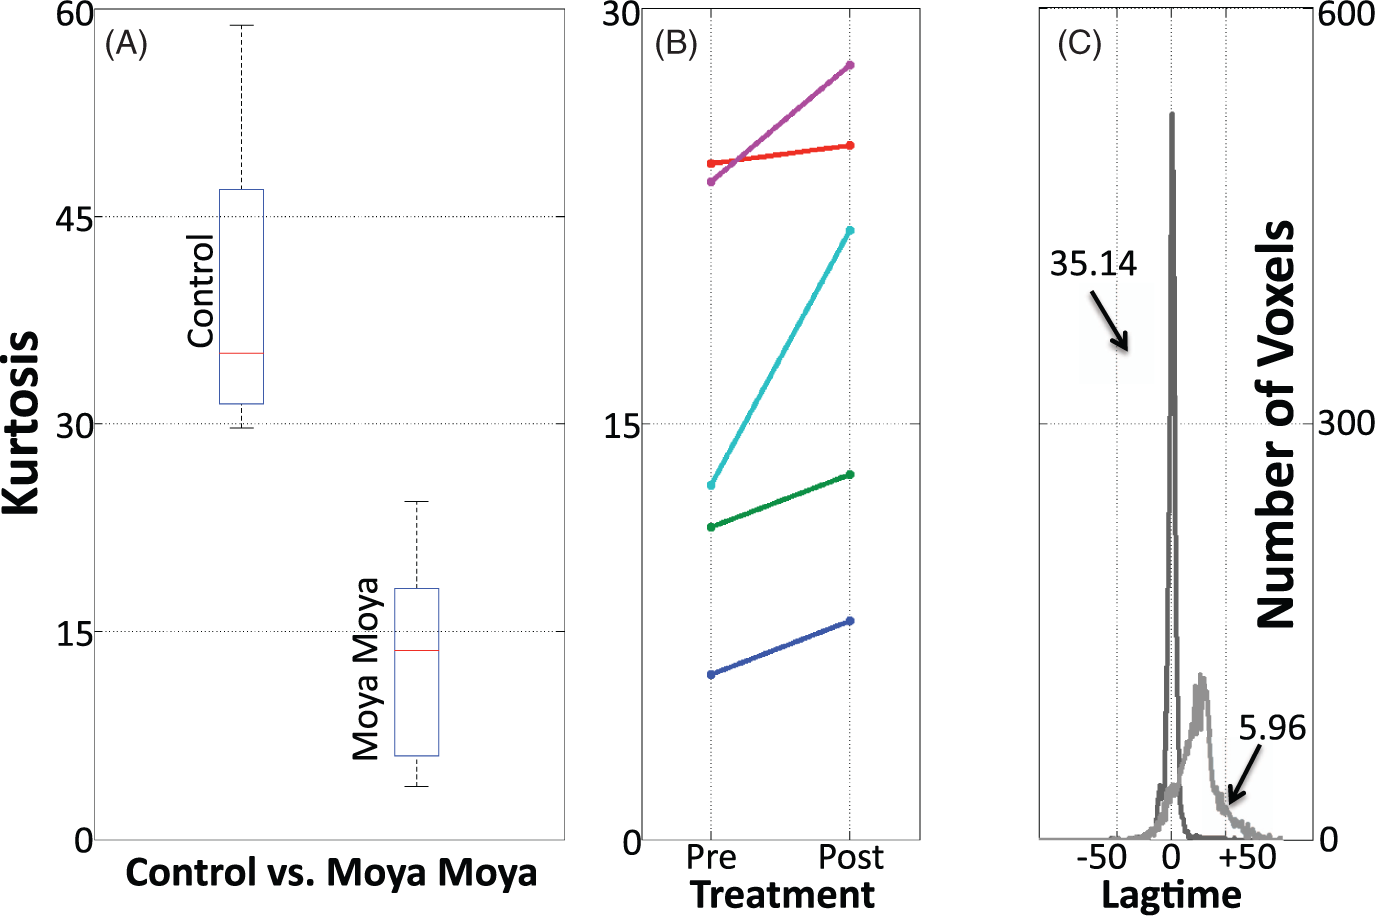
Time delay processing may also have relevance for tracking revascularization response after surgical intervention. In moyamoya subjects scanned before and after indirect revascularization (n = 6), changes in TTP correlated with reperfusion. In Figure 5, TTP maps acquired in a representative moyamoya patient show delays of up to 90 s in blood arrival at the cortical surface in the compromised right hemisphere compared to the left hemisphere. This delay decreased at 6 and 22 months following revascularization by as much as 50 s, a finding that correlated with neovascularity on DSA. A video of the full correlation function, showing the hemodynamic time course before and after revascularization, is included in the supplementary material.
Moyamoya hemodynamic changes following revascularization. Panel A shows the cortical time to peak (TTP) maps in a 57-year-old female subject with severe bilateral moyamoya disease are shown before and after right indirect revascularization. Notice the markedly improved cortical time to peak in the right hemisphere following surgery, whereas the non-operative hemisphere improvement is small. The average time to peak in healthy controls is included for comparison. TTP values are color-coded on the cortical surface in seconds relative to arrival at the center of the cerebellum (MNI coordinate 0,–57,–27). Panel B shows an axial MIP MRA image acquired 6 months post-revascularization. The caliber of the right superficial temporal artery (yellow arrow), which was utilized for revascularization, is larger than the left superficial temporal artery (gray arrow). The right internal carotid and middle cerebral arteries are occluded, with the right anterior cerebral artery opacified from the left internal carotid artery, which is patent (white arrow). The left middle cerebral artery is also occluded.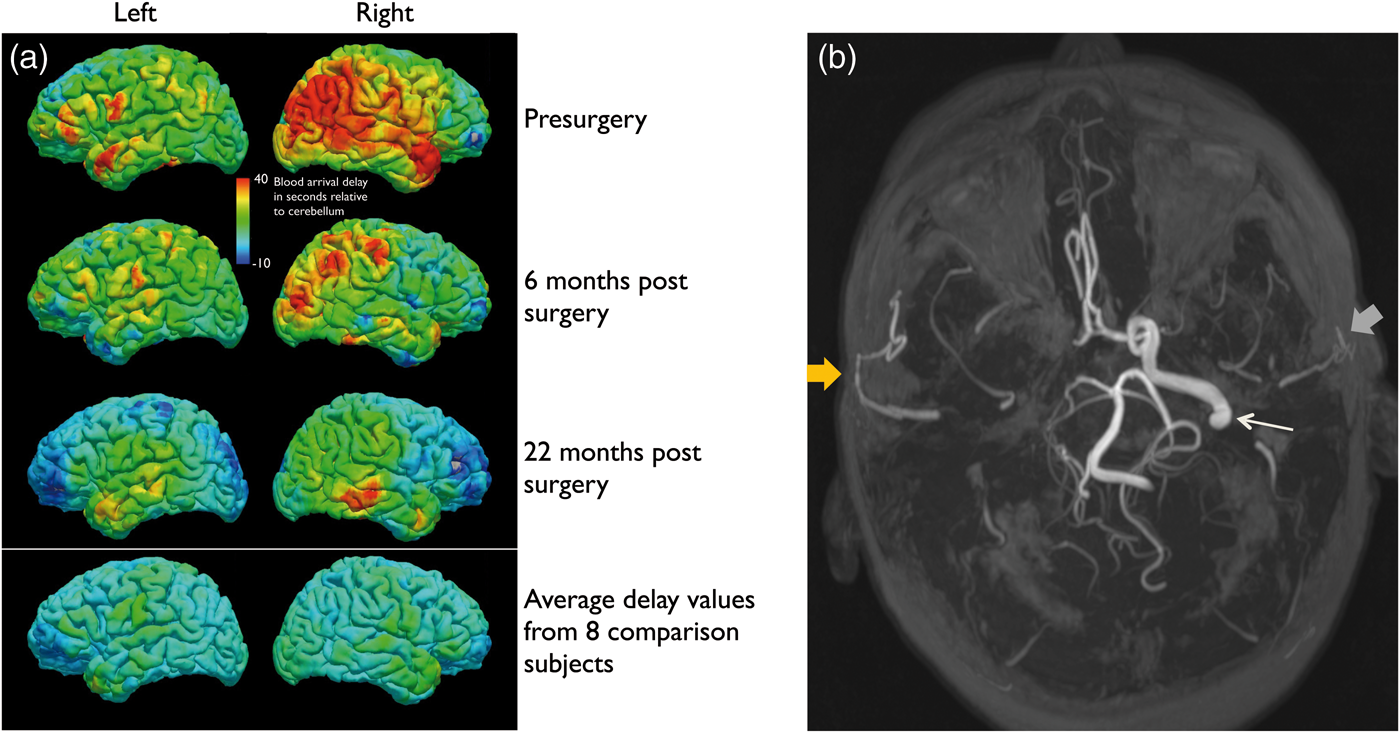
Atherosclerosis
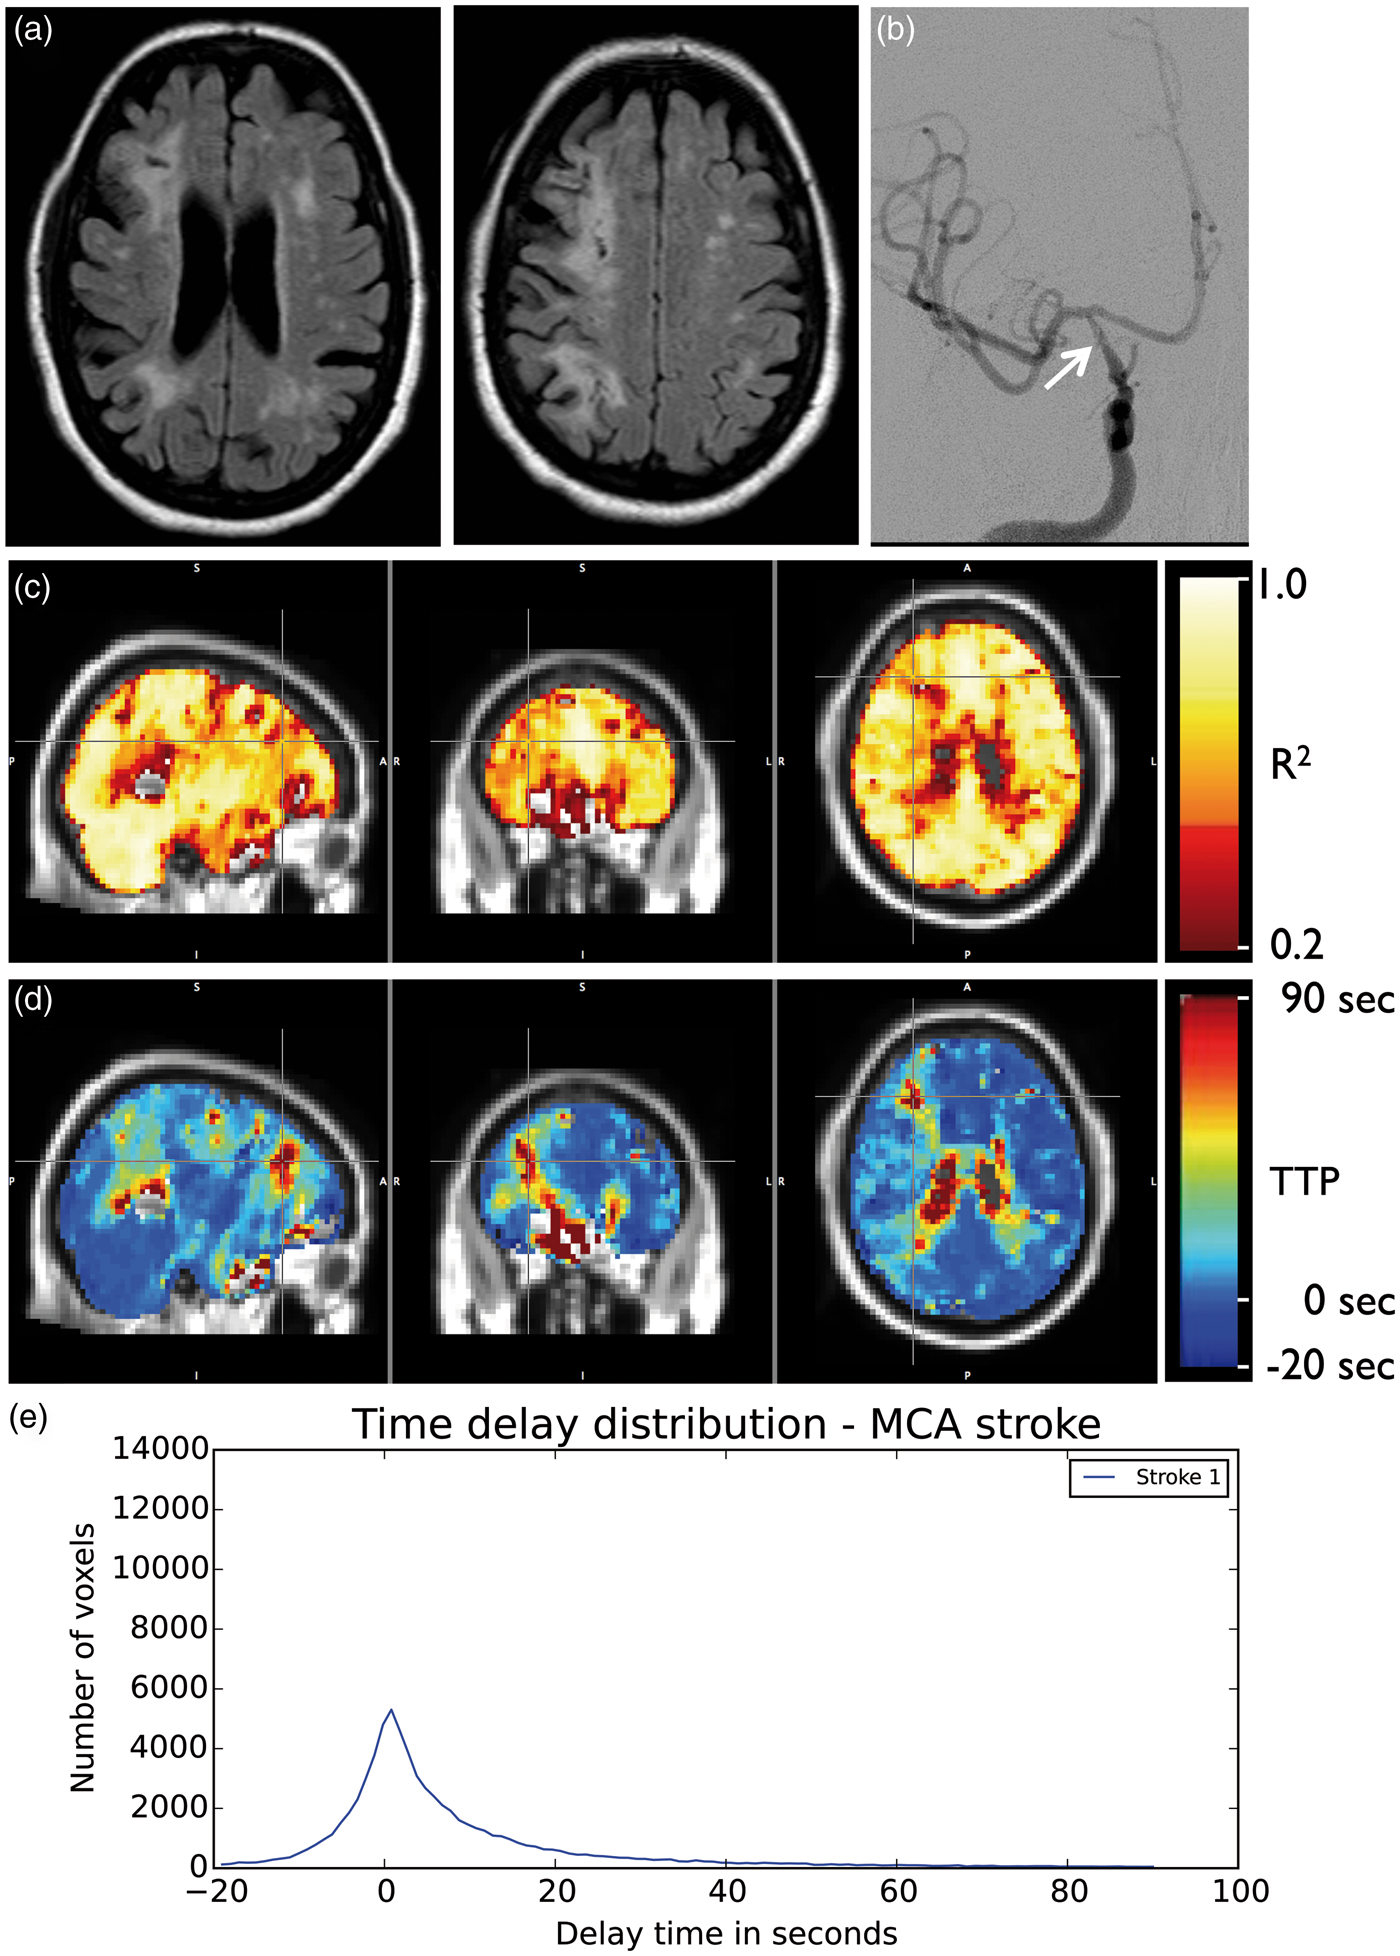
The six subjects diagnosed with atherosclerosis had diffuse, bilateral delay of blood arrival times (halfwidth = 21.35 ± 16.27 s). The delay maps did not differ substantially from those in the moyamoya group with the exception of the lack of laterality. Figure 6 shows parameter maps from a representative atherosclerosis patient, and the delay histograms from all the atherosclerosis patients in the cohort. Figure 7 shows delays related to a long-segment right ICA stenosis (delay halfwidth 16.28 s) with decreased right frontal lobe perfusion.
Atherosclerosis. Coronal (a) and sagittal (b) MIP images from CTA show severe (>90%) left ICA atherosclerotic stenosis in 64-year-old female. Maximum squared correlation (c) and time to peak (d) maps show diffuse delayed time to peak in the both hemispheres. (e) Shows the histograms of TTP values throughout the brain for all subjects with atherosclerotic cerebrovascular disease (n = 7). Stroke. Axial FLAIR-weighted images (a) in a 65-year-old- female show encephalomalacia from bilateral chronic infarcts in the corona radiata. Right hemisphere encephalomalacia reflects a watershed etiology related to long segment tapered stenosis (arrow) of the right ICA ((b), AP projection from right ICA injection during DSA). The maximum squared correlation (c) and time to peak (d) maps show blood arrives at the voxels within the infarct up to 90 s after arriving at the contralateral side. The histogram of delay values is shown (e). MCA: Middle Cerebral Artery.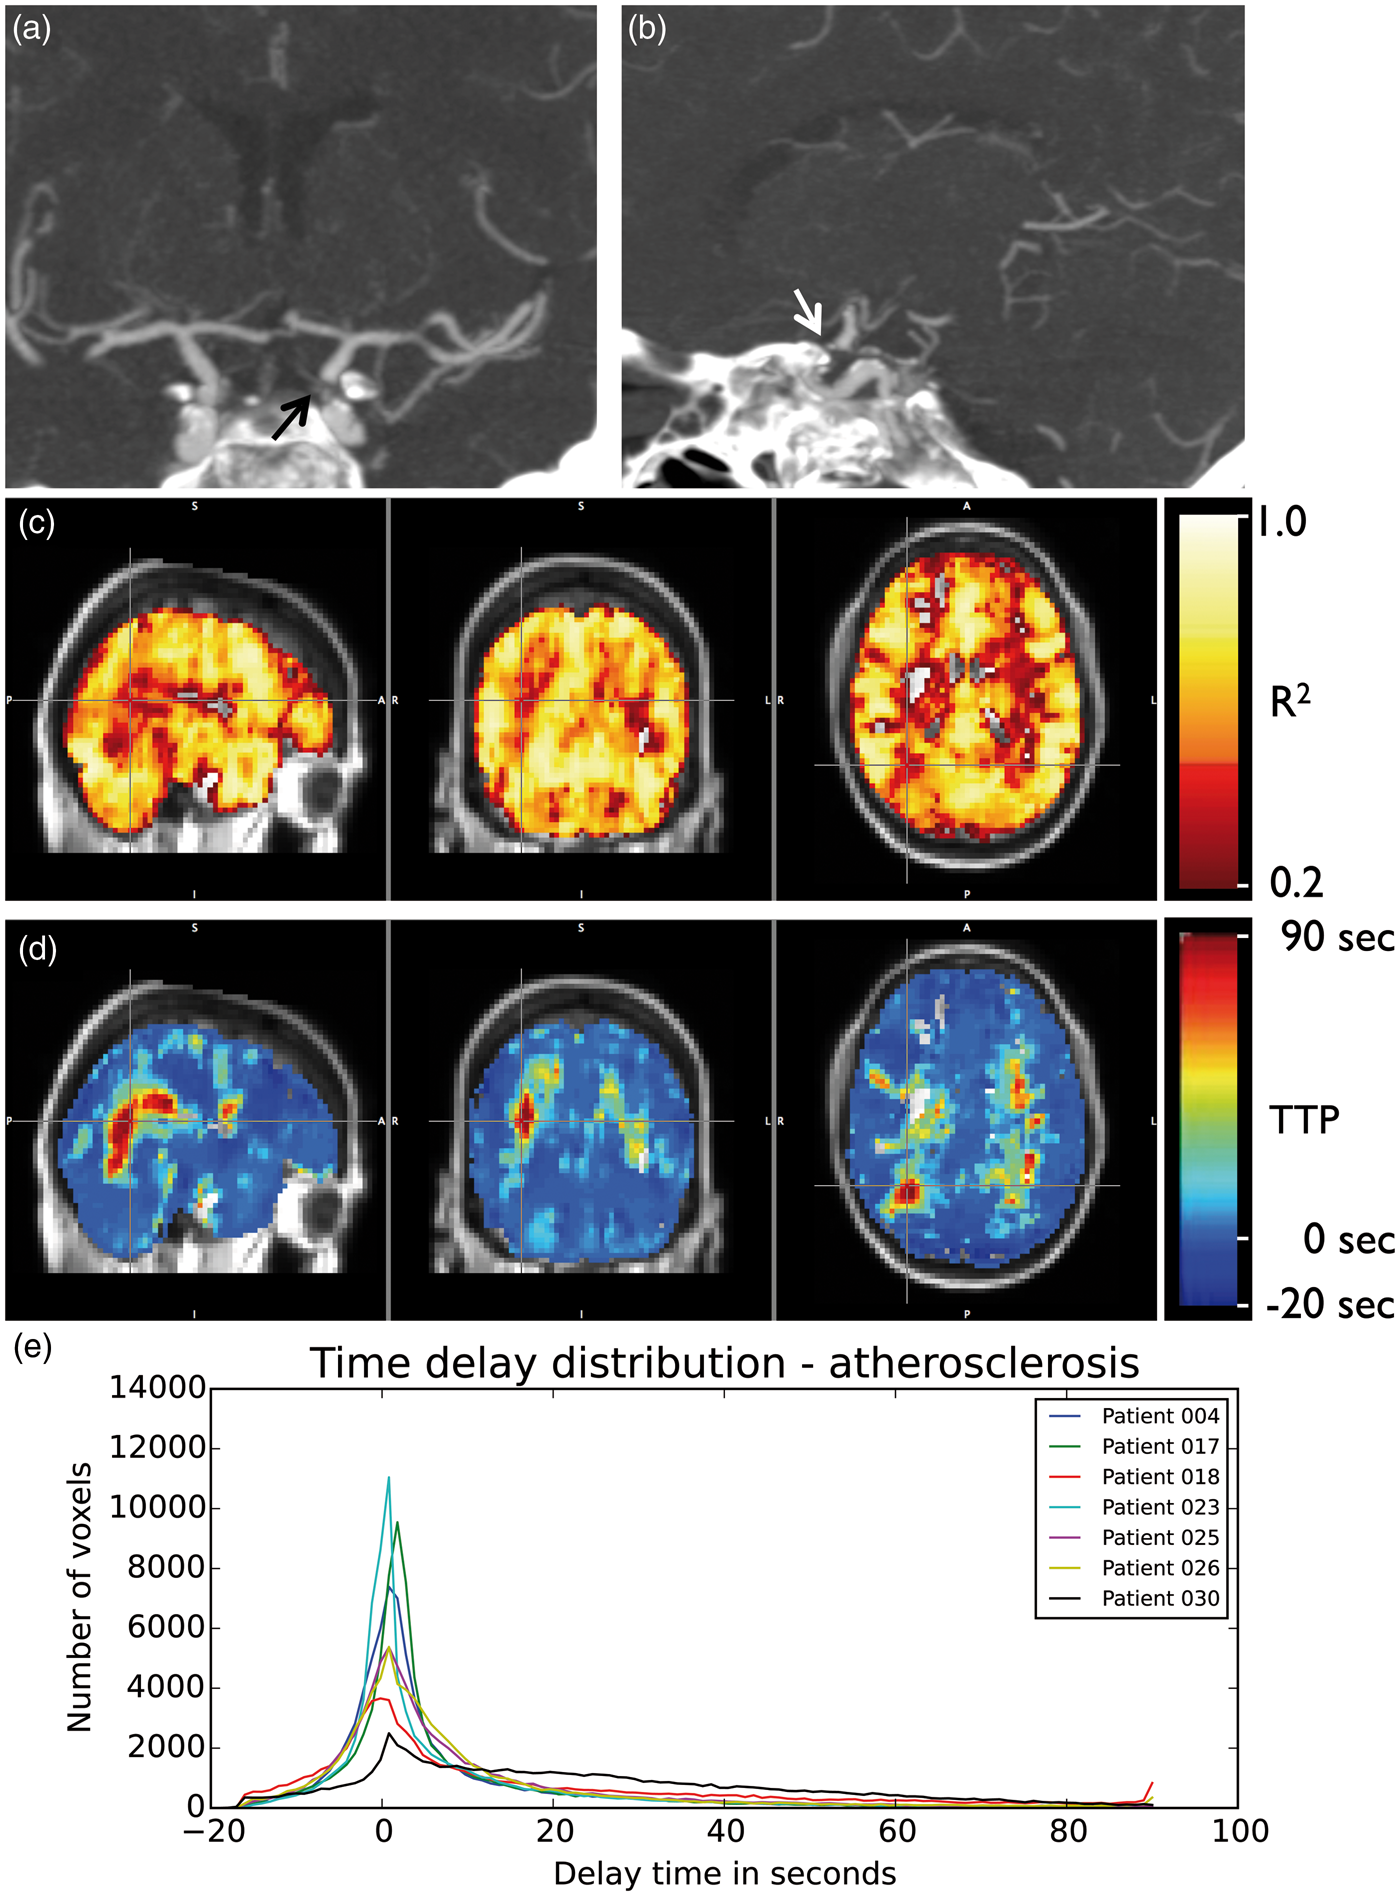
Discussion
The maximum correlation value maps are roughly similar in appearance to ASL maps. However, because the oxygenation “tag” used by the RIPTiDe method has a very long lifetime compared to a radiofrequency pulse tag, areas with substantially delayed blood flow which would appear entirely devoid of blood in an ASL image are easily visible and quantifiable in the RIPTiDe correlation maps, which quantify delay time and correlation size independently. ASL is known to systematically underestimate CBF in areas with prolonged arterial arrival delays.41,42 This is especially problematic when measuring impairment and response to treatment in diseases such as moyamoya disease, where collaterals which form in response to progressive stenosis and occlusions may have significantly delayed transit times. Since circulatory delays in these patients both before and after surgery are longer than the maximum delay detectable using ASL, our findings are consistent with the previously reported finding that “Revascularization surgery was found to have no significant effect on differences in ASL values”.41 However, utilizing the RIPTiDe method, which has a longer detection window, allows us to confirm that revascularization surgery does have significant delay-reducing effects on local blood flow.
One limitation of the method presented is the inability to unambiguously separate blood arrival delay from delayed vessel reactivity. Cerebrovascular reactivity is a more complex phenomenon than simple blood arrival time; the timing of arteriolar response to hypercapnia depends both on when blood arrives at the arteriole and how long the arteriole takes to respond. While these appear to be tightly coupled in healthy subjects, this relationship may be complex in patients with prolonged blood arrival times, thickened arteriolar vessel walls, elevated resting cerebral blood volume, or compromised cellular function. While we believe that the blood arrival time is the dominant component of the delay time, as we know that the circulatory compromise in these patients will delay flow significantly (as has been seen using a BOLD-only delay measurement, 7 we cannot discount the possibility that response delay may also a factor. In the future, we will incorporate simultaneous measurement of peripheral NIRS data and fMRI to characterize blood arrival delays.1–5 This method, which relies only on small endogenous oxygenation and blood volume changes, will allow us to separate the effects of blood flow and vessel reactivity. Alternative strategies could be to utilize different gas mixtures, for example such as hyperoxia vs. hypercapnic hyperoxia, to isolate transit time and reactivity timing differences.
Conclusions
RIPTiDe processing of hypercarbia challenge data yields rich information on perfusion timing. The analysis method uses fluctuations in hemodynamic parameters (oxygenation and volume) that travel with the blood relatively unchanged, relieving limits on the length of delays detectable, limits on exposure to exogenous contrast agents, and consequent limits on longitudinal monitoring of both changes in vascular reactivity and blood flow delay that might occur as a consequence of disease progression or treatment. The technique is especially useful when perfusion is significantly delayed, and may be a useful clinical tool for assessing cerebrovascular pathology and treatment response.
Footnotes
Funding
The author(s) disclosed receipt of the following financial support for the research, authorship, and/or publication of this article: This work was supported by NIH/NIDA 1R21DA032746, NIH/NINDS 5R01NS078828, and American Heart Association 14GRNT20150004.
Acknowledgements
The authors wish to thank Lisa Nickerson for helpful discussions regarding this work.
Declaration of conflicting interests
The author(s) declared no potential conflicts of interest with respect to the research, authorship, and/or publication of this article.
Authors’ contributions
Manus J. Donahue designed the study that collected all the data for this manuscript, supervised the collection of all data, performed all the initial analyses of the MR data, assisted in designing the follow-up analysis, and provided clinical interpretation of the results of the time delay metrics. Megan K. Strother assisted in the design of the experiment, was the study physician, performed all of the neurological assessments of the subjects included in the study and provided clinical interpretation of the results of this study. She also selected, prepared, and annotated all the clinical figures. Kimberly P. Lindsey determined the organization of the manuscript and interpretation of this study in the context of the literature. She also performed the majority of the editing and preparation of the manuscript. Lia M. Hocke performed the statistical analysis and characterization of the delay measurements within and between subject groups, developed the kurtosis metric of delay characterization, and generated ![]() . Yunjie Tong assisted in the design of the time delay processing methodology and the retrospective analysis strategy. Blaise deB. Frederick conceived of the project to reanalyze the Vanderbilt data, designed and performed all the time delay analyses, generated all of the figures (other than Figure 4, and the clinical scans of individuals), and wrote the initial draft of the manuscript.
. Yunjie Tong assisted in the design of the time delay processing methodology and the retrospective analysis strategy. Blaise deB. Frederick conceived of the project to reanalyze the Vanderbilt data, designed and performed all the time delay analyses, generated all of the figures (other than Figure 4, and the clinical scans of individuals), and wrote the initial draft of the manuscript.
References
Supplementary Material
Please find the following supplemental material available below.
For Open Access articles published under a Creative Commons License, all supplemental material carries the same license as the article it is associated with.
For non-Open Access articles published, all supplemental material carries a non-exclusive license, and permission requests for re-use of supplemental material or any part of supplemental material shall be sent directly to the copyright owner as specified in the copyright notice associated with the article.