
Abstract
Cerebrovascular reserve (CVR) reflects the capacity of cerebral blood flow (CBF) to change. Decreased CVR implies poor hemodynamics and is linked to a higher risk for stroke. Revascularization has been shown to improve CBF in patients with vasculopathy such as Moyamoya disease. Dynamic susceptibility contrast (DSC) can measure transit time to evaluate patients suspected of stroke. Arterial spin labeling (ASL) is a non-invasive technique for CBF, CVR, and arterial transit time (ATT) measurements. Here, we investigate the change in hemodynamics 4-12 months after extracranial-to-intracranial direct bypass in 52 Moyamoya patients using ASL with single and multiple post-labeling delays (PLD). Images were collected using ASL and DSC with acetazolamide. CVR, CBF, ATT, and time-to-maximum (Tmax) were measured in different flow territories. Results showed that hemodynamics improved significantly in regions affected by arterial occlusions after revascularization. CVR increased by 16 ± 11% (p < 0.01) and 25 ± 13% (p < 0.01) for single- and multi-PLD ASL, respectively. Transit time measured by multi-PLD ASL and post-vasodilation DSC reduced by 13 ± 7% (p < 0.01) and 9 ± 5% (p < 0.01), respectively. For all regions, ATT correlated significantly with Tmax (R2 = 0.59, p < 0.01). Thus, revascularization improved CVR and decreased transit times. Multi-PLD ASL can serve as an effective and non-invasive modality to examine vascular hemodynamics in Moyamoya patients.
Keywords
Introduction
Cerebrovascular reserve (CVR) reflects the capacity of cerebral blood flow (CBF) to meet physiological demands.1.2 CVR can be obtained using various medical imaging modalities such as PET, MRI, and transcranial Doppler (TCD) ultrasound induced by a vasodilation challenge.3–5 While TCD enables CVR measurements of specific arteries of interest, PET and MRI techniques allows regional CVR measurements of the brain. 2 Clinical evidence suggests that patients with lower CVR, such as those with vasculopathy, have a higher risk for acute and recurrent stroke due to impaired vascular hemodynamics. 6
Moyamoya disease is a progressive cerebrovascular disease characterized primarily by occlusion and/or stenosis of internal carotid arteries, anterior cerebral arteries (ACA), and middle cerebral arteries (MCA). The formation of diminutive vascular networks (Moyamoya vessels) produces collateral flow at the base of the brain. 7 The risk for stroke in Moyamoya patients can be alleviated by revascularization procedures that stabilize the blood supply and hemodynamics in the regions affected by vasculopathy, leading to stroke prevention and consequently improved neurological and neurocognitive outcomes. 8 Furthermore, a randomized controlled trial on Japanese adult hemorrhagic Moyamoya patients demonstrated reduced risk for both recurrent hemorrhagic and ischemic stroke after direct bypass. 9
CVR can be measured as the relative change in CBF induced by a vasoactive stimulus in a brain stress test,10.11 whereby CBF measurements are obtained before and after the administration of vasodilators such as acetazolamide. Arterial spin labeling (ASL) is a non-invasive and quantitative MRI technique that can measure CBF using magnetically labeled blood. 12 While pseudo-continuous arterial spin labeling (PCASL) with a single post-labeling delay (PLD) has been the recommended clinical application for CBF and CVR measurements, 13 multi-PLD PCASL is an advanced ASL technique that enables more robust and accurate CBF and CVR measurements.14.15 For example, several studies have demonstrated that multi-PLD PCASL achieved a higher accuracy in CBF and CVR measurements than single-PLD PCASL in Moyamoya patients using the 15O-water PET as the gold standard.16–18 Additionally, multi-PLD PCASL can measure arterial transit time (ATT), which is defined as the time for the labeled blood to arrive at the brain voxel, enabling the characterize blood circulation and hemodynamics in stroke patients. 19 Unlike the Gadolinium-based DSC derived Time-to-Maximum of the residue function (Tmax), measuring ATT from multi-PLD PCASL does not require contrast agents, making it more accessible to patients as a contrast-free modality. 18 A previous study has demonstrated a strong and positive correlation between Tmax and ATT in Moyamoya patients before revascularization. 18 The relationship between these two parameters after bypass surgeries remains to be elucidated.
In this work, we investigated the hemodynamic changes in 52 Moyamoya patients less than a year after their initial bypass (superficial temporal artery to middle cerebral artery, STA-MCA) surgeries. We compared the CVR, CBF, and ATT measured by single- and multi-PLD PCASL with acetazolamide as the vasodilator. We also examined the potential of multi-PLD PCASL to replace DSC MRI to measure transit time by examining the relationship between ATT and Tmax.
Materials and methods
Study overview
We included 52 consecutive Moyamoya disease patients (7 males and 45 females, between 16 and 70 years old) with both unilateral and bilateral vasculopathy undergoing evaluation and treatment for extracranial to intracranial revascularization surgery at our institution between January 2018 and April 2021. Inclusion criteria were a confirmed diagnosis of Moyamoya disease (untreated by bypass) based on at least one of the following diagnostic evaluations: digital subtraction angiography, MR angiography, and/or computed tomography angiography; and the performance of direct STA-MCA bypass on at least one hemisphere, and the presence of both initial and 4 – 12 months follow-up clinical MR imaging. Exclusion criteria included kidney function impairment (glomerular filtration rate < 40 ml/min), pregnancy, history of brain injury, and contraindications to MRI or ACZ. Patients were instructed to refrain from food and beverage containing caffeine at least 6 hours before the MRI procedure. 20 Each patient had two imaging sessions: less than a week before the surgery (pre-surgery) and less than a year (ranged between 4 and 12 months) after the surgery (post-surgery). The surgical procedure has been described in detail previously. 21 For patients unable to return for the post-surgery MRI scans, they would have a local MRI scan (without ACZ) forwarded and reviewed by the surgeon (GKS) with clinical follow up performed by telephone or video visit by our team. However, these MRI scans were excluded in this study because CVR was not measured, and the scanning protocol was different from their pre-surgery scans. In short, STA-MCA bypass was achieved by connecting the frontal or temporal branch of STA and the M4 segment of MCA under mild hypothermia (33–35°C). For patients requiring bypass on both sides of the brain, two separate surgeries were performed separated by at least a week but less than three months. At the time of each imaging session, the patients had no acute infarction, hemorrhage, or acute stroke. Table 1 shows the demographic and vascular information of the patients enrolled in this study.
Demographic information of the Moyamoya patients and classification of vasculopathy.
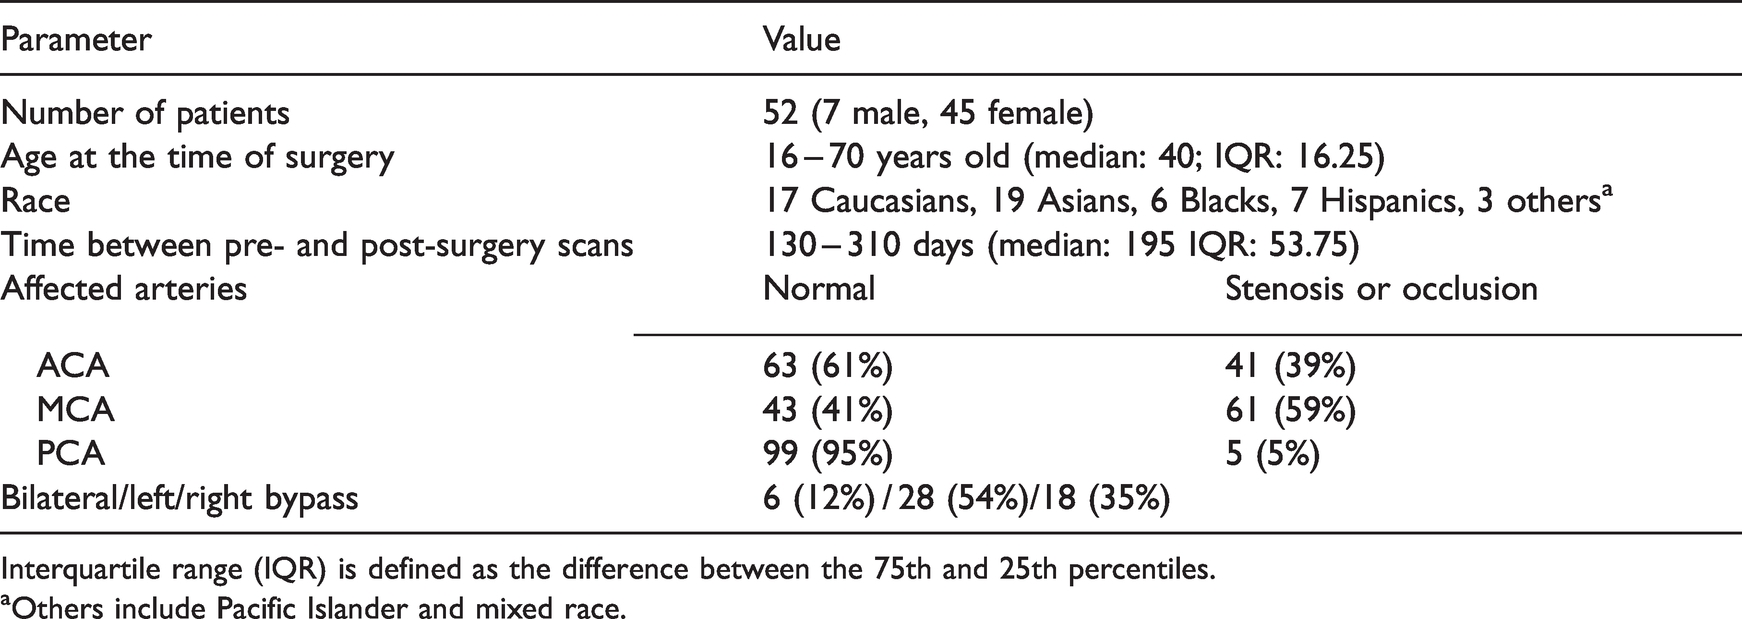
Interquartile range (IQR) is defined as the difference between the 75th and 25th percentiles.
aOthers include Pacific Islander and mixed race.
MR imaging details
All subjects provided written informed consent. MRI experiments were conducted using 3 T MRI systems (Discovery MR 750, GE Healthcare, Waukesha, WI, USA). All procedures were performed according to the regulations of the institutional review board (IRB) of Stanford University and the Declaration of Helsinki. Figure 1 shows the timeline of the imaging experiments performed. During the imaging exam, each patient received ACZ administration at a dose of 15 mg/kg of body weight (with a maximum dose of 1000 mg) over a 30-second interval. For all the imaging exams before and after the bypass surgery, we acquired the same set of MR sequences including MR angiography (MRA), diffusion-weighted imaging (DWI), single-PLD and multi-PLD PCASL, DSC, T1-weighted, and T2-FLAIR anatomical images. The coverage of MRA was a region of 40 mm that covered the circle of Willis. 3 D PCASL with single-PLD (labeling duration = 1450 ms; PLD = 2025 ms) and multi-PLDs (labeling duration = 2000 ms; PLD = 700, 1325, 1950, 2575, 3200 ms) were acquired from each patient before and 15 minutes after vasodilation. 22 DSC MRI was performed at the end of each imaging session using 0.1 mmol/kg of gadobenate dimeglumine (Multihance, Bracco, Milan, Italy) injected at a rate of 4 mL/s and a pre-delay of 18 s. The detailed scanning parameters are listed in Table S1 in Supplementary Materials.
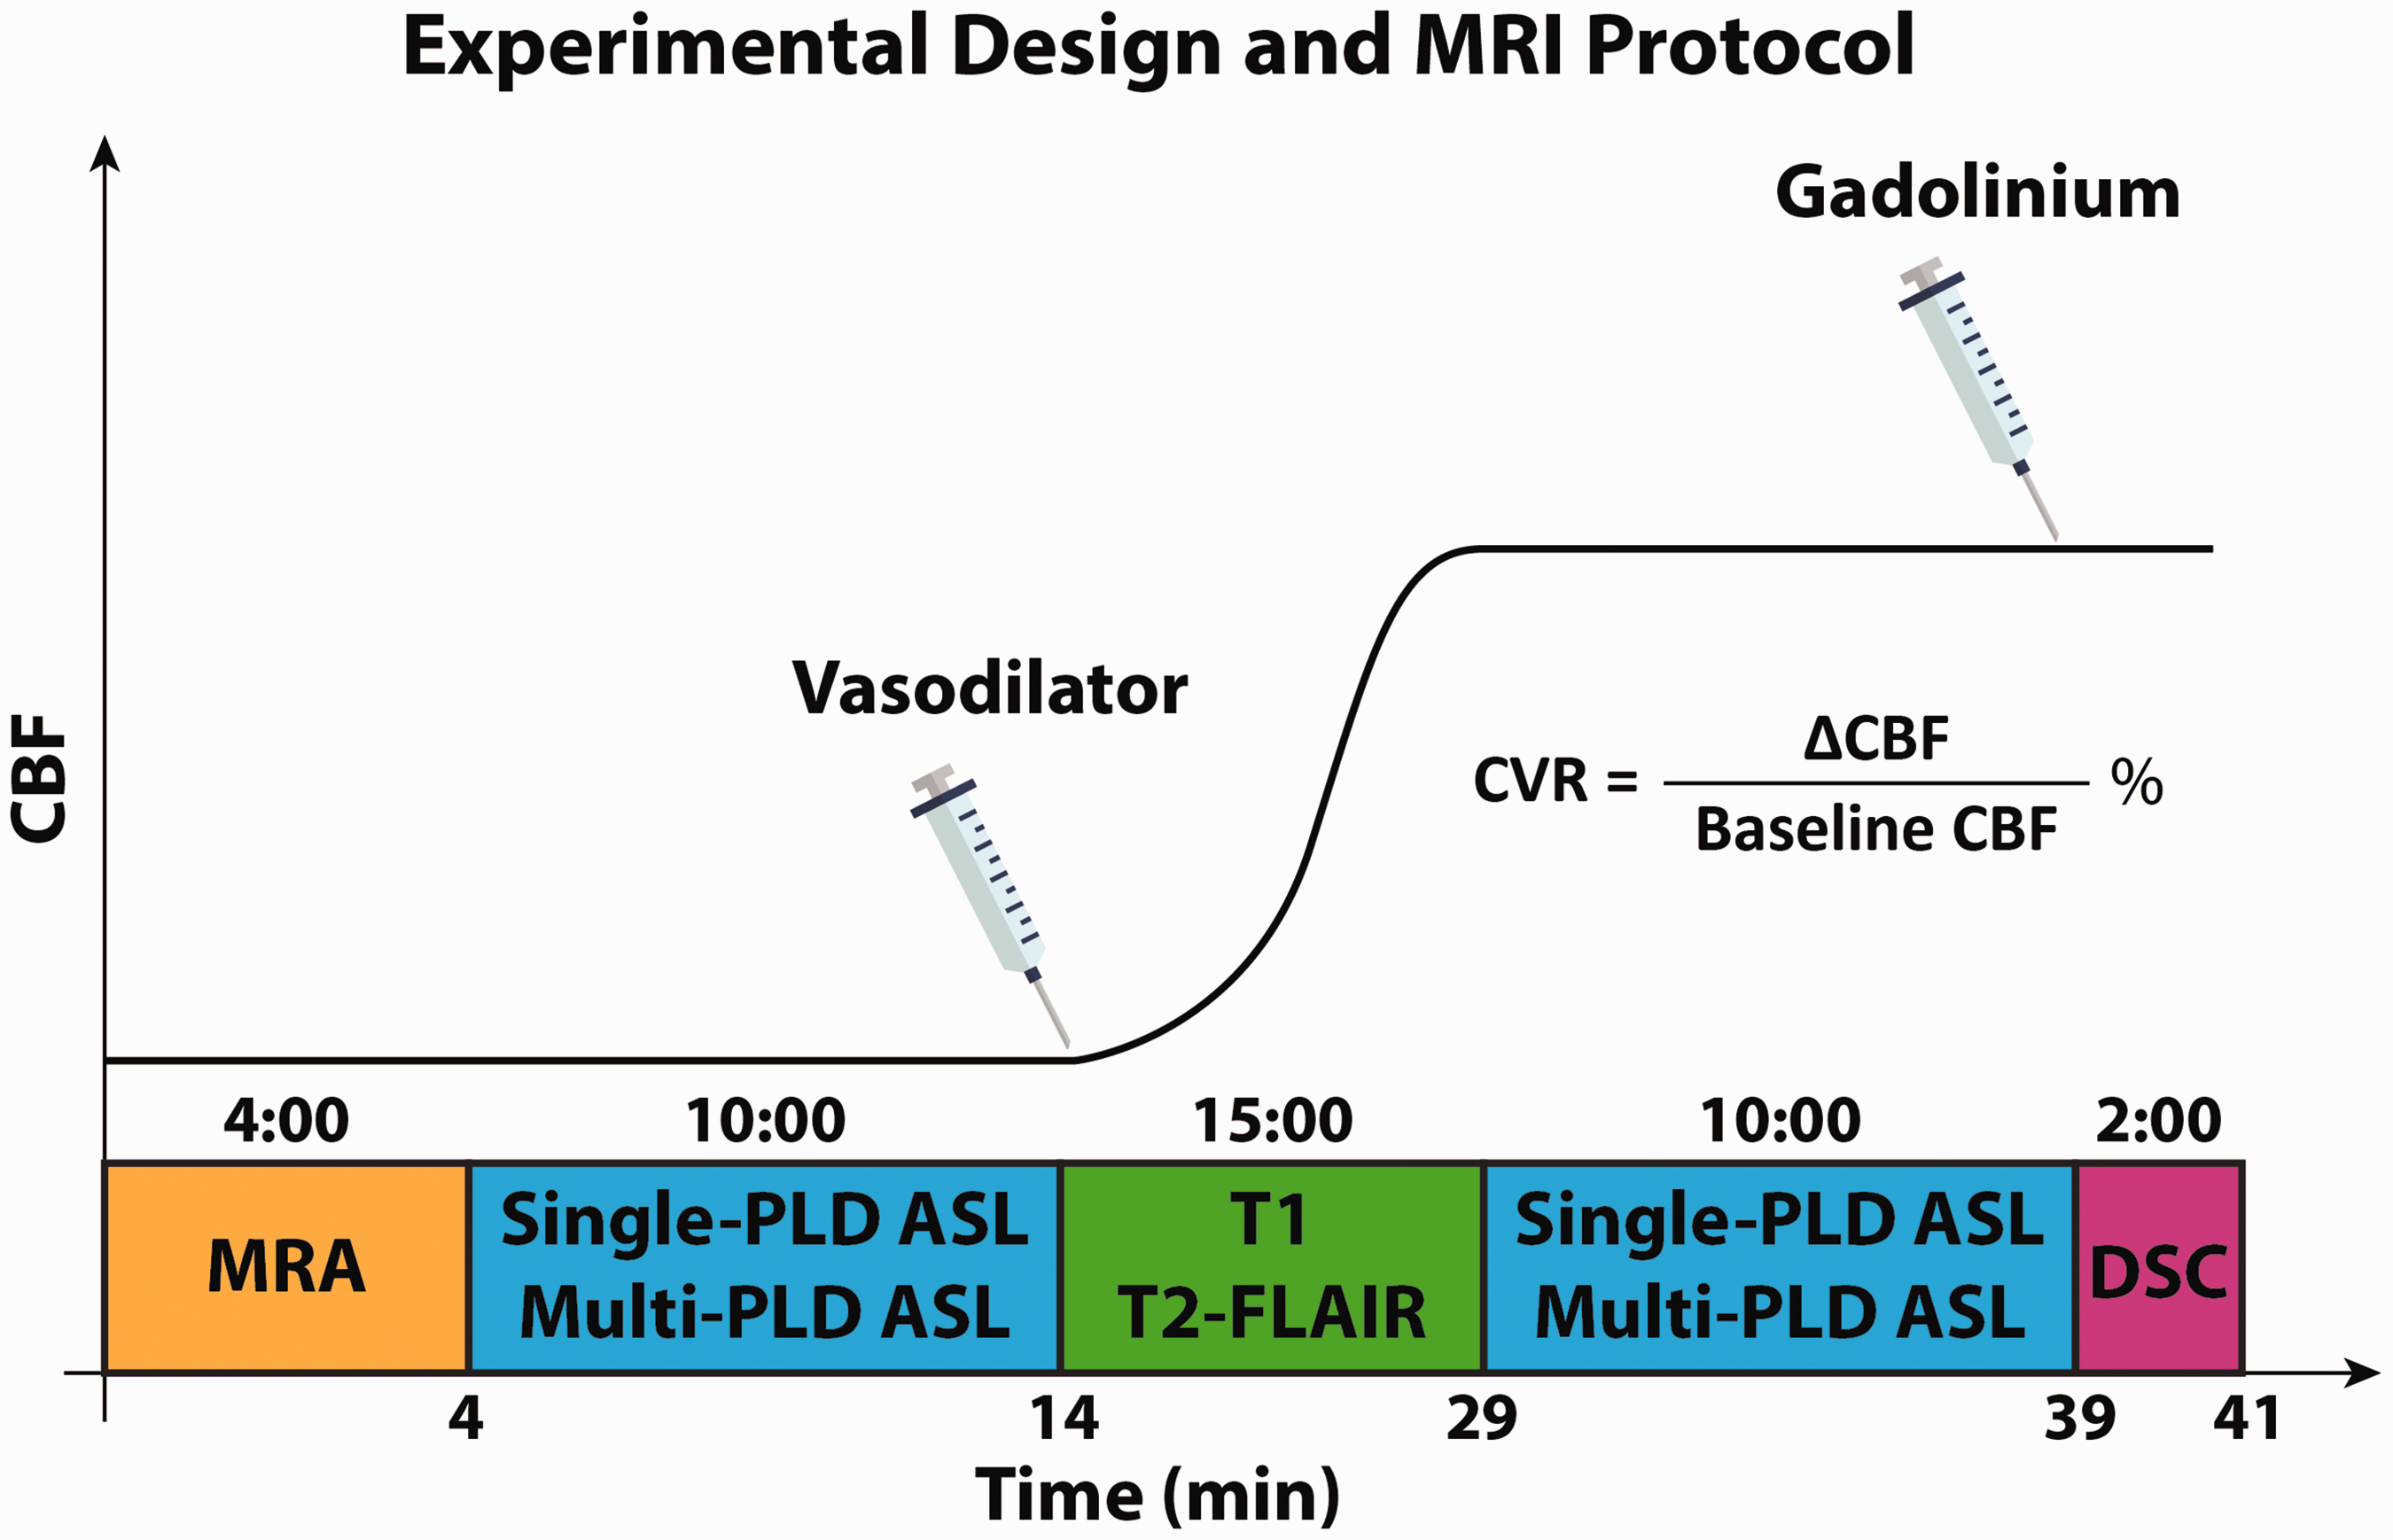
Experimental design for characterizing the hemodynamics of Moyamoya patients before and after revascularization. MRA was acquired to determine the location and condition of vasculopathy. Single-PLD and Multi-PLD ASL were acquired to measure CVR, CBF, and ATT. T1-weighted images were collected to facilitate image registration and group analysis. DSC images were acquired to compute Tmax. ASL data were acquired before and 15 minutes after the administration of the vasodilator (acetazolamide, ACZ). Other MRI sequences (not shown in this figure) included GRE and DWI acquired before vasodilation and post-contrast T1.
Vascular hemodynamic measurements
CBF and ATT from pre- and post-vasodilation ASL data were computed by fitting the ASL difference data to the general kinetic model using the FSL tool BASIL using a spatially regularized Bayesian inference technique. 23 In all ASL data analysis, the labeling efficiency was assumed to be 85% and a blood-brain partition coefficient to be 90%. 14 Partial volume effects on the edge of the brain were corrected using the erosion and extrapolation method. 24 CVR was computed as the percentage change in CBF induced by the vasodilator, as shown in the equation in Figure 1. DSC data were used to compute Tmax using RAPID software (RapidAI, Redwood City, CA, USA). 25
CVR, CBF, ATT, and Tmax maps were transformed to the Montreal Neurological Institute (MNI) 152-2mm space to facilitate group comparison and statistical analysis using both linear and non-linear registration using FSL. 26 Six flow territories (left ACA, right ACA, left MCA, right MCA, left PCA, and right PCA) were defined based on the Harvard-Oxford cortical and subcortical structural atlases. 27 After registration, the mean values of ΔCBF, CVR, ATT, and Tmax in each flow territory were computed. The location and grade of vasculopathy (occlusion or severe stenosis) of each patient were identified in consensus by two board-certified radiologists (RDA and GZ).
Statistical analysis
Two-tailed paired t-tests were conducted to compare the mean values of CVR, ATT, and Tmax before and after revascularization in regions affected by vasculopathy under the null hypothesis that the value of these parameters was the same. The normality of the CVR and ATT data was checked using Kolmogorov-Smirnov tests before conducting the t-test. 28 Regional voxel-wise CVR differences before and after revascularization were also compared after the CVR maps (in MNI 2 mm template space) of each patient were smoothed using an isotropic Gaussian kernel (FWHM = 3 mm). For the voxel-wise comparison, permutation-based nonparametric tests were performed using the threshold-free cluster enhancement method that has shown better sensitivity over a wide range of data types and SNR values. 29 The nonparametric tests were conducted using the FSL tool RANDOMIZE with 100,000 permutations under the null hypothesis that the voxel-wise CVR values were the same. The family-wise error rate due to multiple comparisons was corrected using the method developed by Holmes et al, 30 and the corrected p-value was recorded and thresholded at 0.05 for significance.
Results
Patient information
Table 1 shows the patient information of this study. Among the 172 Moyamoya patients who were treated with bypass surgery between January 2018 and April 2021, 52 returned for the follow-up MRI between 4 and 12 months and were enrolled in this study. The primary reason for patients not returning for follow-up was the distance from their principal residence. Other factors included availability of the patients and travel restriction due to COVID-19 pandemic. The post-surgery scan with acetazolamide was performed as part of the study protocol, instead of due to new symptoms. Patients unable to attend their follow-up scans were contacted via telephone or video visit. The majority of the patients had severe stenosis or occlusion in their ACA and/or MCA, accounting for more than 90% of cases. There were 17 patients with ICA occlusion at the supraclinoid segment. These patients also had ACA and/or MCA occlusions or severe stenosis. The percentage of the patients receiving bilateral/left/right surgeries was 12%/28%/35% respectively.
Hemodynamic maps
Figure 2 shows the MRA, CBF, and CVR maps of a Moyamoya patient with left ACA and MCA occlusion 1 week before and 9 months after left STA-MCA bypass. Overall, the bypass surgery improved perfusion and circulation in the left ACA and MCA territories affected by vasculopathy. Specifically, the images in Figure 2(b) and (d) demonstrate vascular steal in the MCA territory after vasodilation, as shown by the red arrows. The bypass restored normal perfusion augmentation (positive ΔCBF and CVR) after vasodilation, as shown by the yellow arrows in Figure 2(c) and (e). Specifically for this patient, The CVR of multi-delay ASL were computed in the left ACA and MCA territories, and the values were 0.3% and 23% in pre- and post-surgery conditions respectively. Comparing the hemodynamic maps between the two ASL techniques in Figure 2, CBF measured by multi-PLD PCASL was higher than that measured by single-PLD PCASL in both pre- and post-vasodilation conditions. This finding was present for the ΔCBF and CVR results in all regions of the brain.
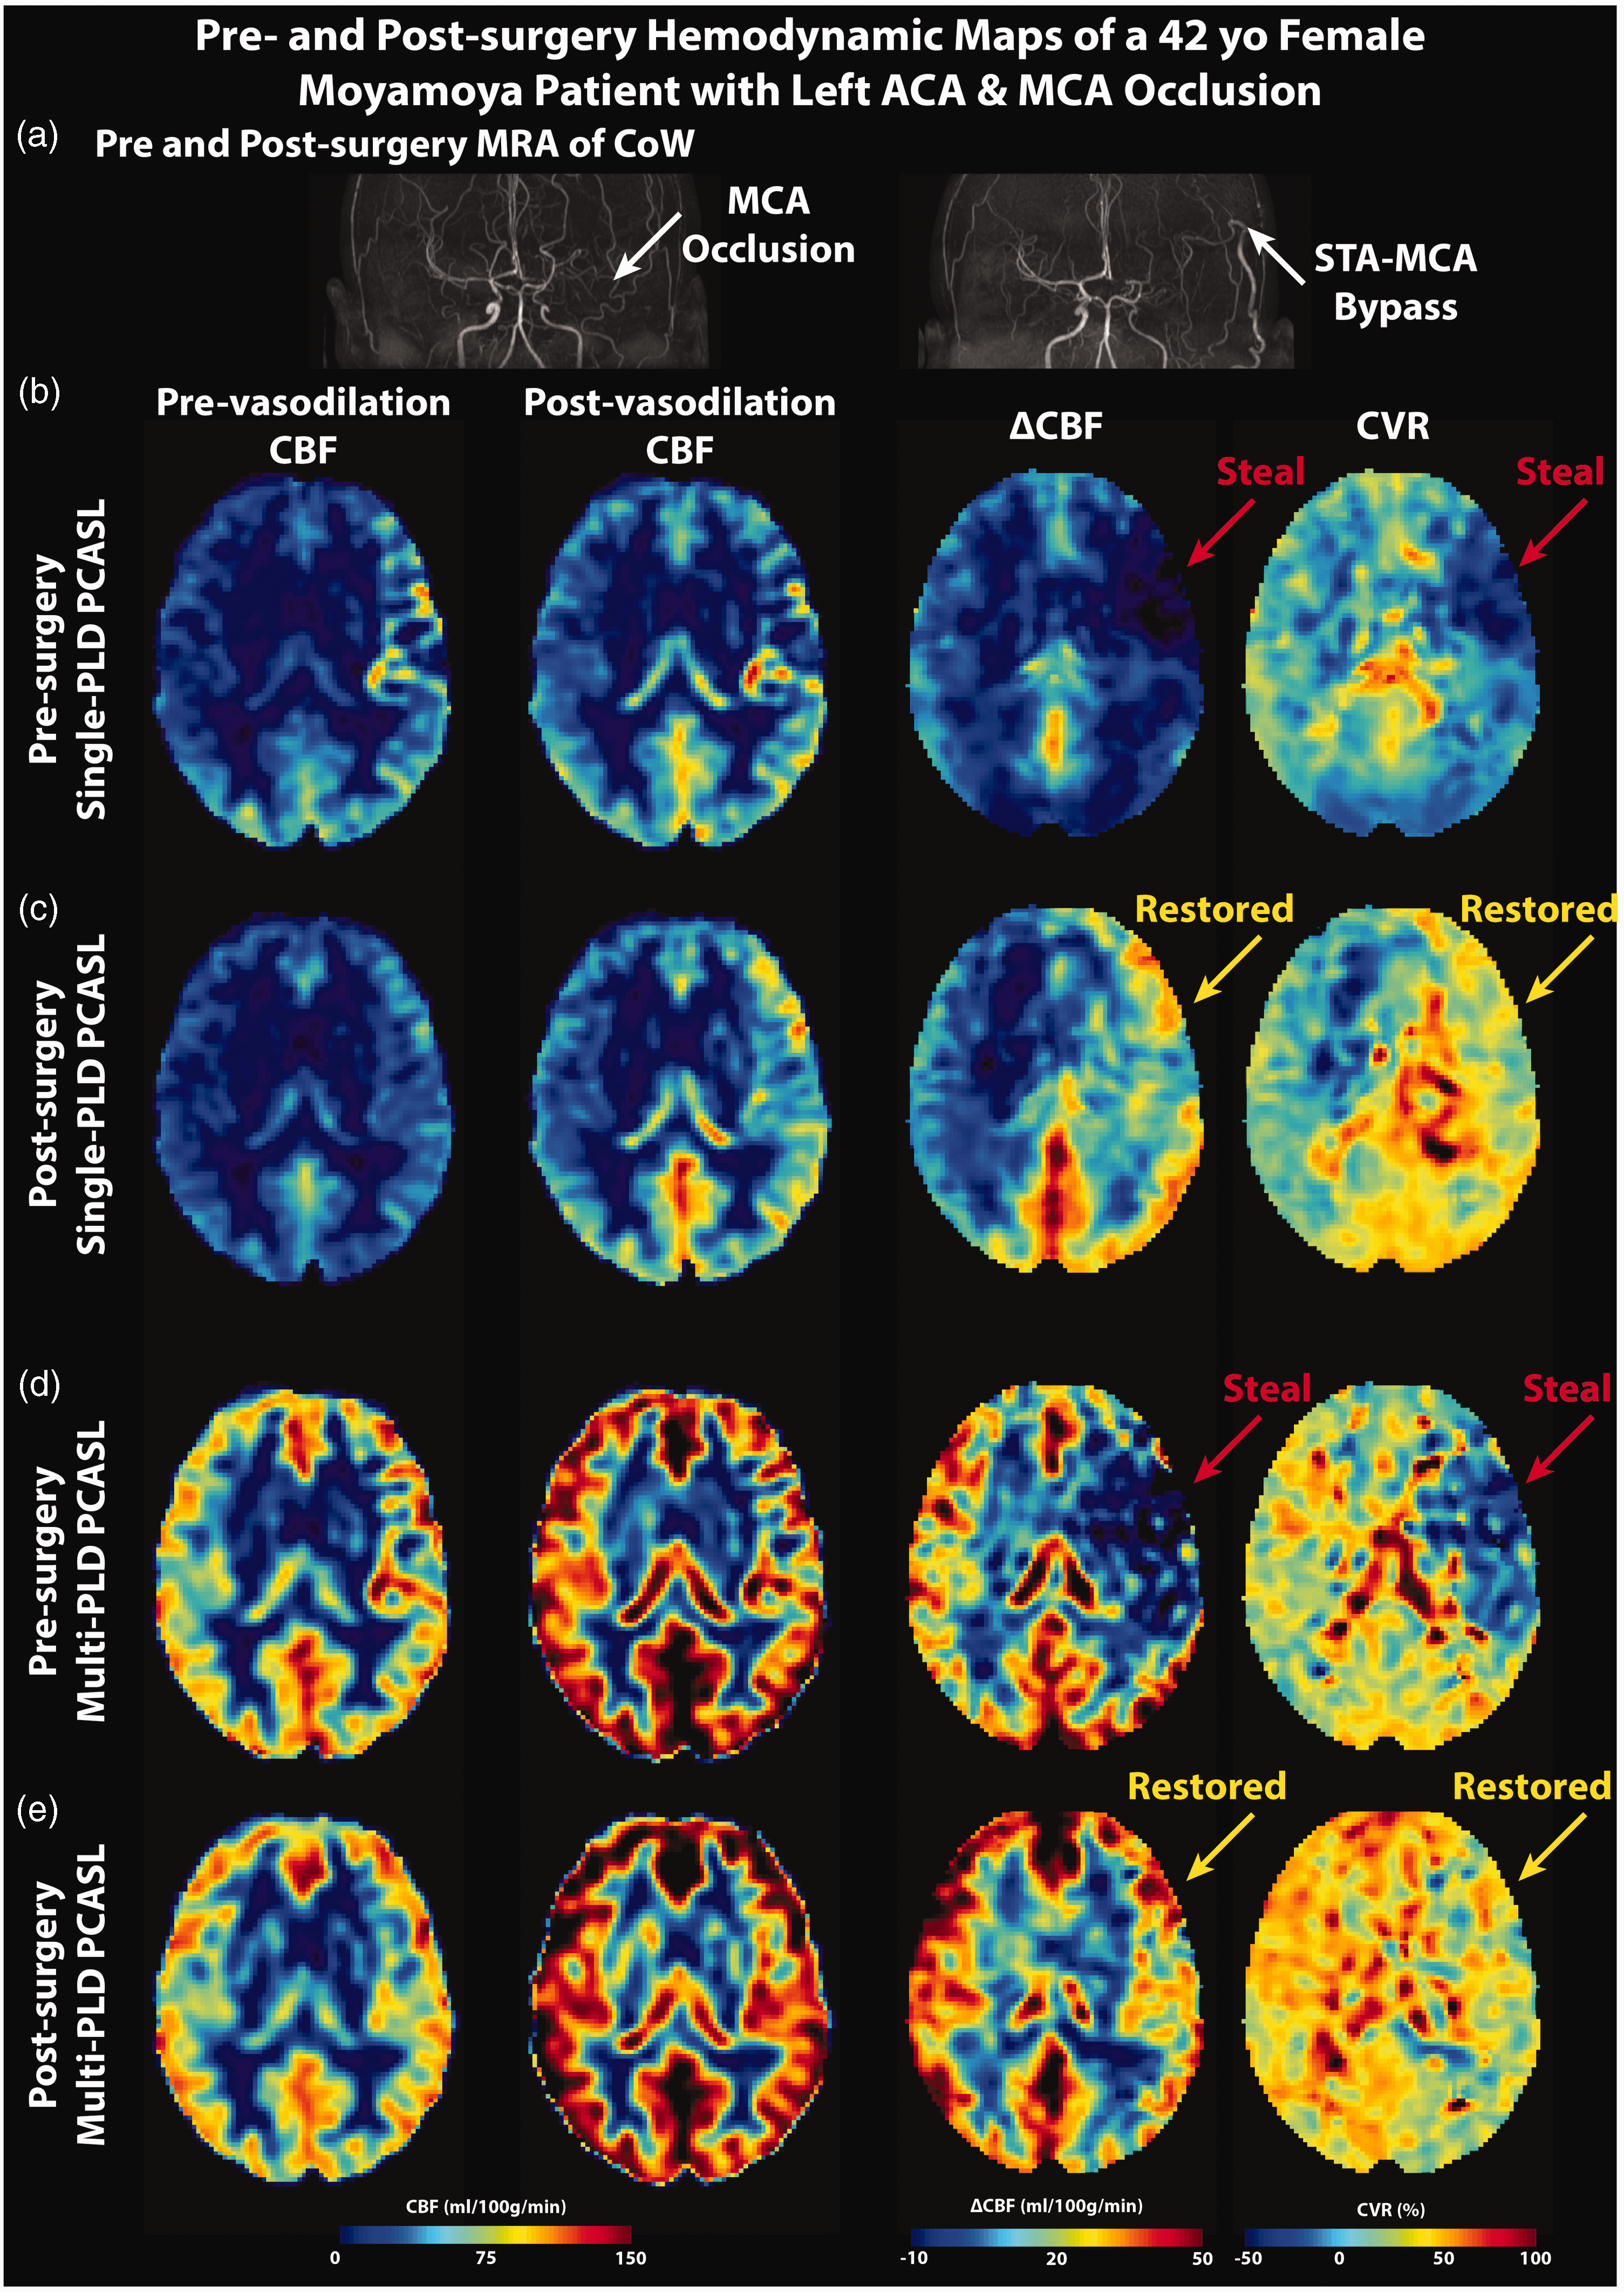
MRA, CBF, and CVR maps of a 42-year-old female Moyamoya patient. In the pre-surgery images, the unilateral (left-sided) occlusion of the MCA and ACA affected perfusion and vasodilation, causing vascular steal (negative ΔCBF and CVR, red arrows). After the surgery, the perfusion and CVR of these regions were restored to normal levels. CBF and CVR maps measured by multi-PLD PCASL were higher than those measured by single-PLD PCASL in all conditions. (a) MRA before and after the surgery. (b and c) CBF, ΔCBF, and CVR measured by single- and multi-PLD PCASL before the surgery. (d and e) CBF, ΔCBF, and CVR measured by single- and multi-PLD PCASL after the surgery.
Figure 3 shows the pre- and post-surgery ASL-ATT and DSC-Tmax maps from the same patient. In terms of the transit time maps, delayed transit time (both ATT and Tmax) can be found in the left ACA and MCA territories affected by vasculopathy, as shown by the red arrows in Figure 3(b). Additionally, vasodilation decreased the ATT by multi-PLD PCASL in brain regions without vasculopathy. By contrast, the pre-surgery ATT in the occluded region increased slightly after vasodilation, which was spatially associated with the vascular steal observed in Figure 2(d). Nine months after bypass, the transit time of these regions was lower, as shown by the yellow arrows in Figure 3(c), although they were still longer than the normal regions in the right hemisphere. Specifically for this patient, the mean pre-surgery ATT within the affected territories were 1.65 s and 1.63 s in pre- and post-vasodilation conditions respectively. Such changes in ATT were subtle, which resulted in vascular steal (negative CVR) shown in Figure 2. The mean post-surgery ATT in the same territories were 1.46 s and 1.34 s. The same pattern can be found in Tmax maps; the STA-MCA bypass resulted in a decreased Tmax in regions affected by vasculopathy.
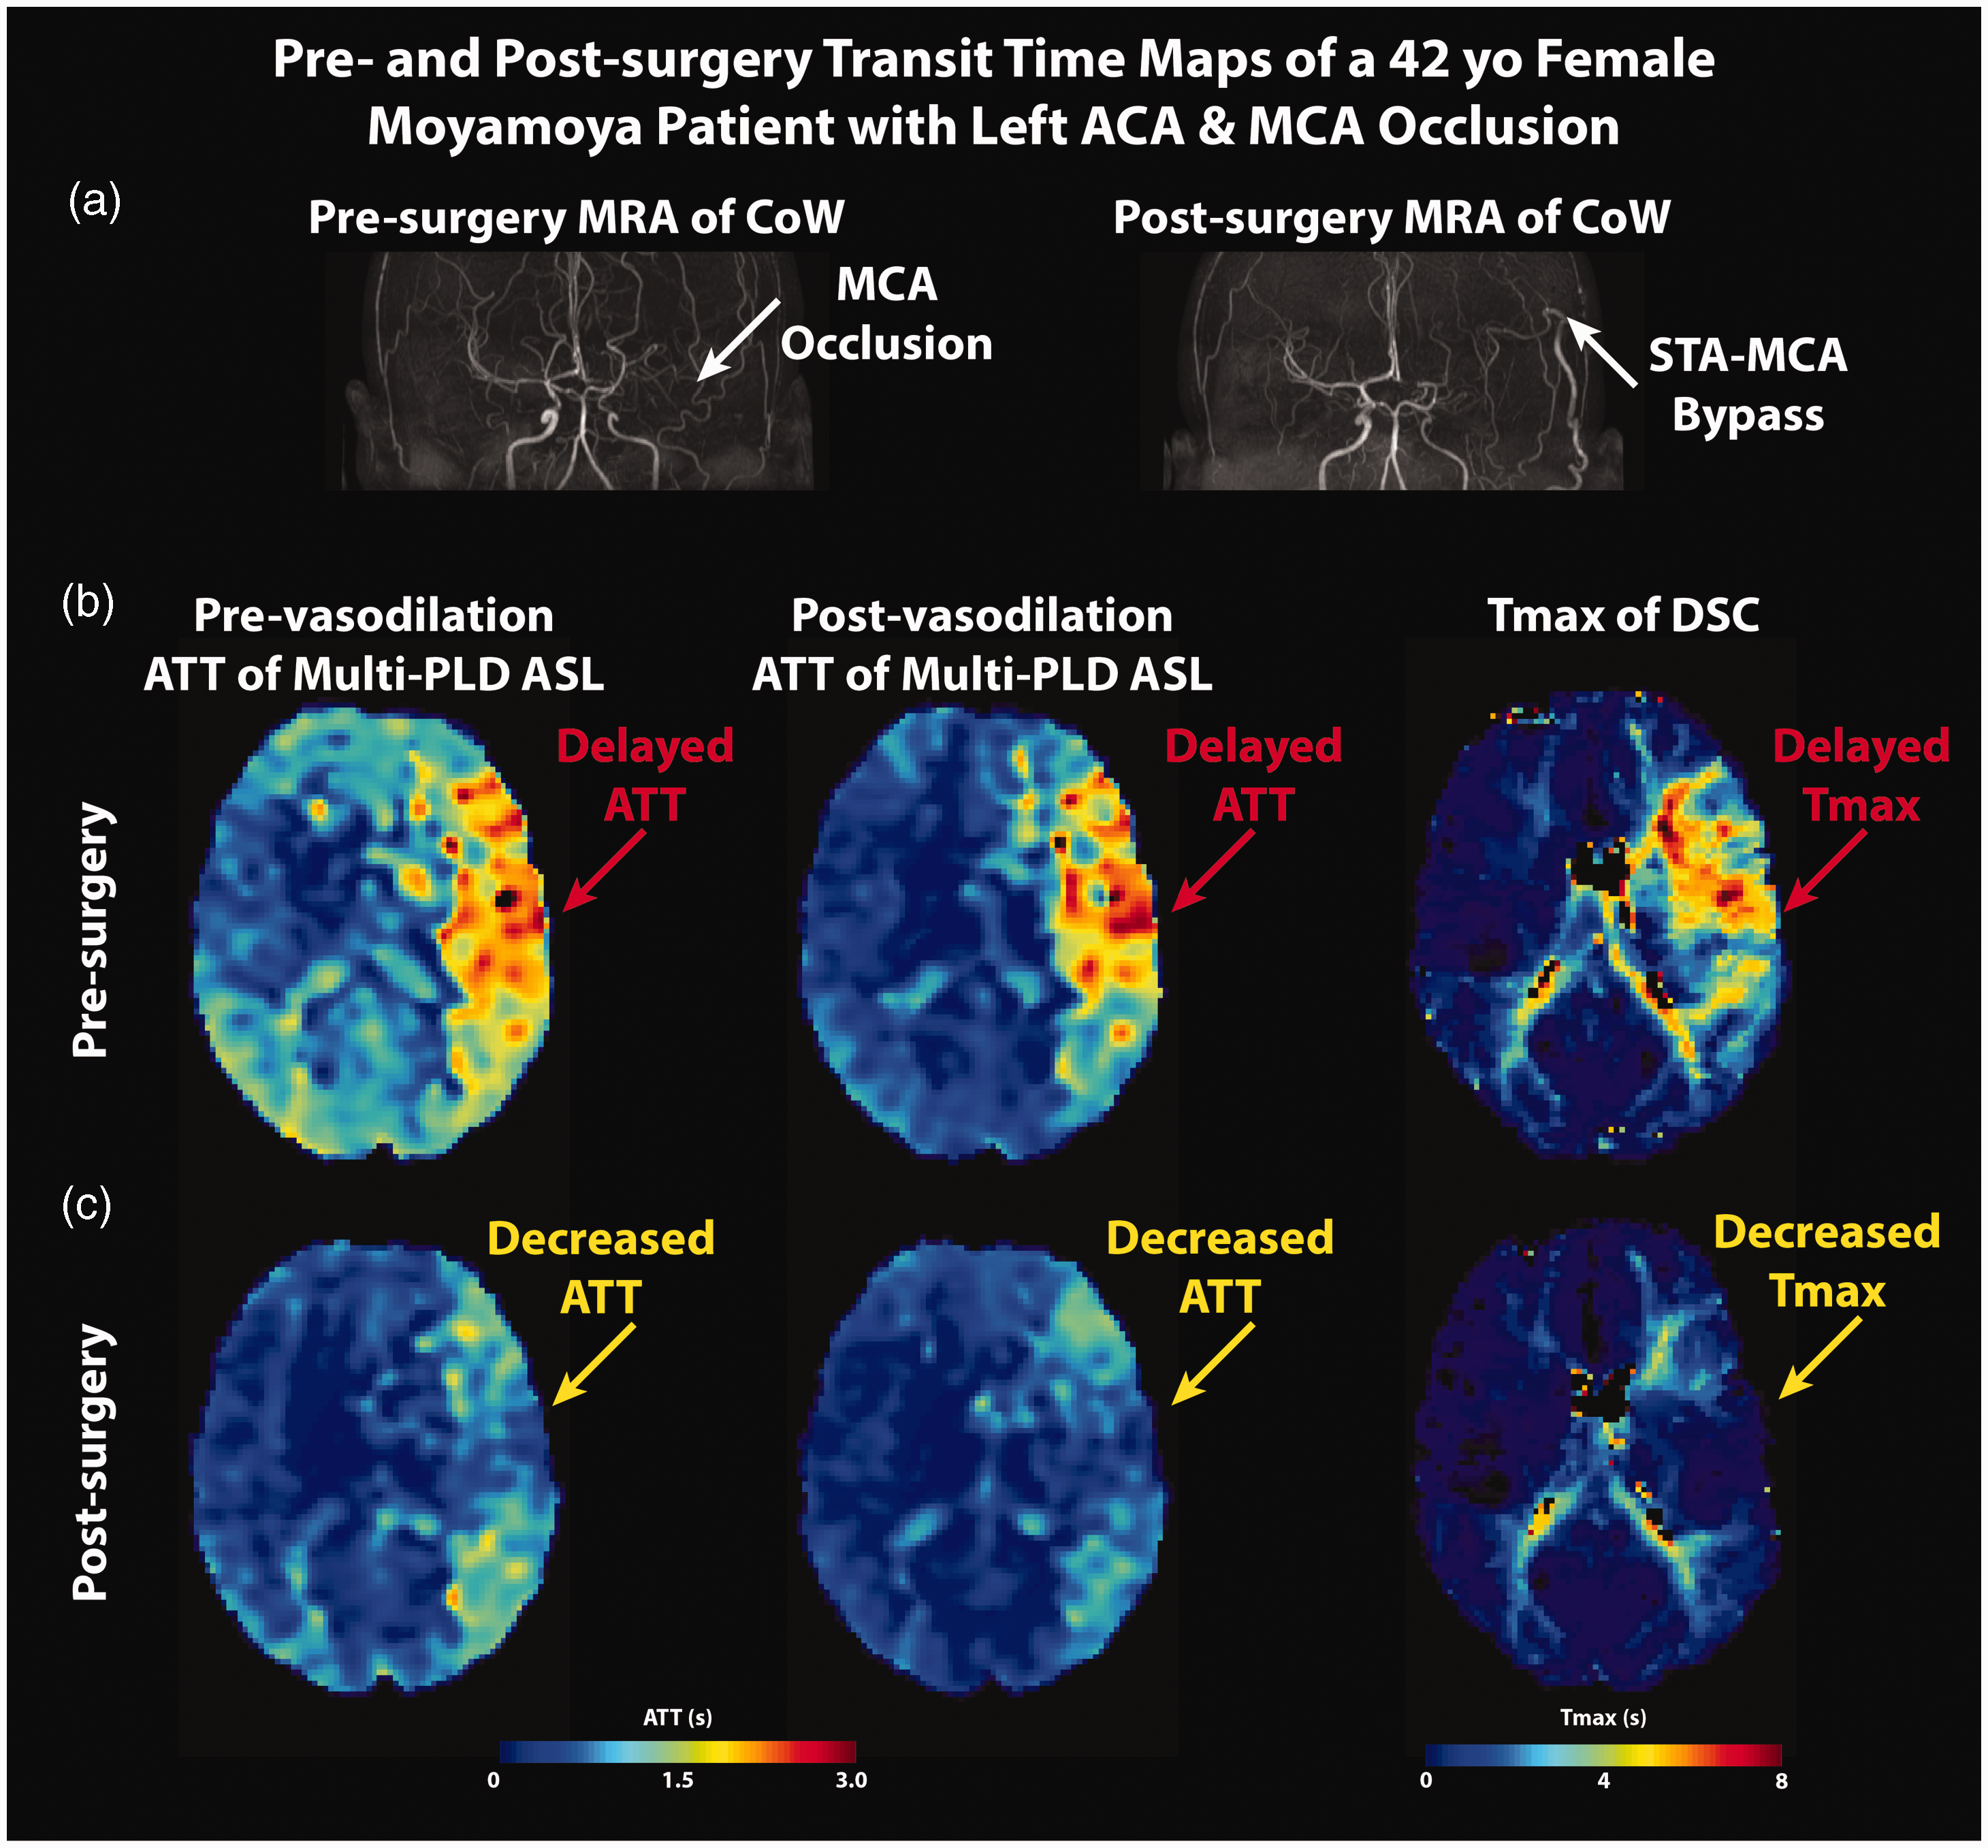
MRA, CBF, and CVR maps of a 42 year-old female Moyamoya patient (same patient as in Figure 2). In the pre-bypass images, the occlusion of the left MCA and ACA (subplot a) caused delayed transit time (both ATT and Tmax, red arrows in subplots b and c). ATT increased slightly after vasodilation in the same regions where vascular steal was seen on CBF maps. After the surgery, both ATT and Tmax decreased, and ATT declined after vasodilation.
CVR and CBF changes after revascularization
Figure 4 shows the changes in CVR and CBF after bypass surgeries within the regions affected by vasculopathy. CVR in the affected regions increased significantly (by 16 ± 11% [p < 0.01] and 25 ± 13% [p < 0.01] for single- and multi-PLD PCASL) after bypass surgeries. A similar trend was observed in the absolute CBF augmentation (ΔCBF) after vasodilation, whereby a significant increase (by 13 ± 10% [p < 0.01] and 19 ± 12% [p < 0.01] for single- and multi-PLD PCASL) can be found after bypass, as shown in Figure 4(b). The effect size measured by multi-PLD PCASL was higher than that of single-PLD PCASL (p < 0.05 for all comparisons between CBF measured by single- and multi-PLD PCASL). In terms of the CBF measurements, revascularization caused CBF to increase before and after vasodilation, as shown in Figure 4(c). Specifically, for single-PLD PCASL, CBF increased by 13 ± 12% (p < 0.01) and 39 ± 11% (p < 0.01) after bypass surgeries for pre- and post-vasodilation, respectively. The increase was by 16 ± 12% (p < 0.01) and 39 ± 14% (p < 0.01) for multi-PLD PCASL after bypass surgeries. The trend was consistent with the CVR and ΔCBF data whereby multi-PLD PCASL captured a larger effect size than single-PLD PCASL. Figure S1 in Supplementary Materials shows the CVR changes in ACA/MCA/PCA.
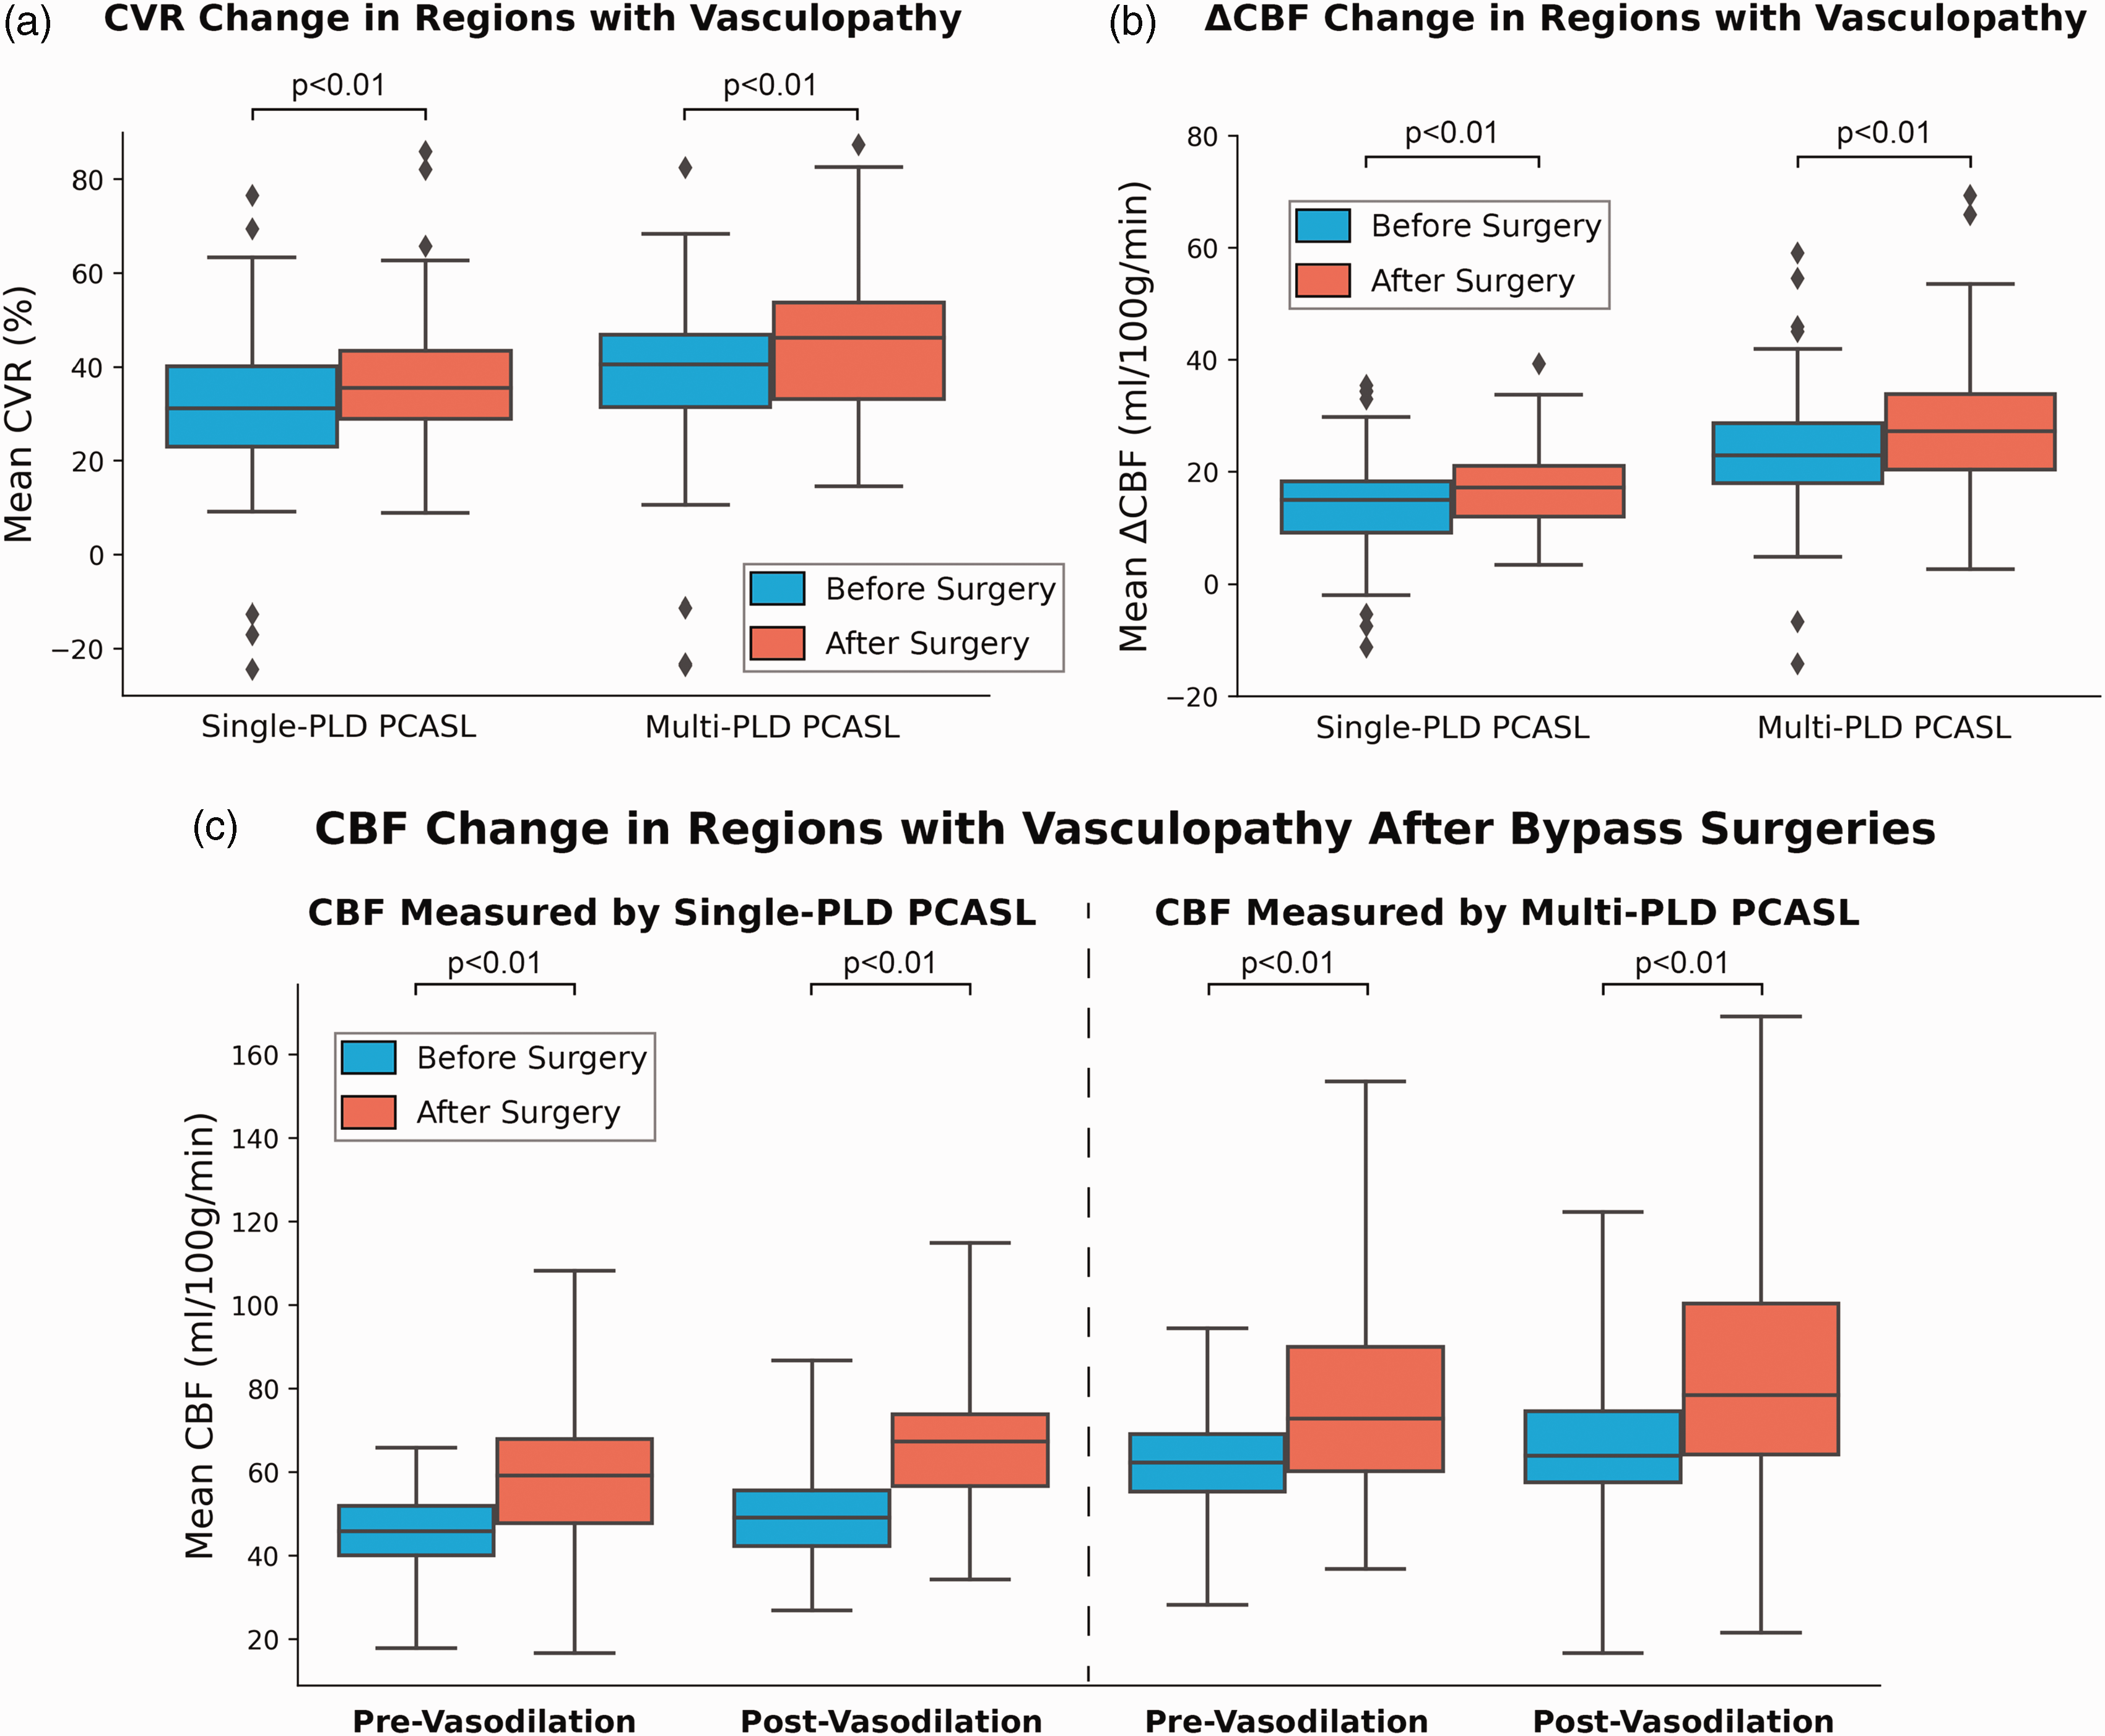
CVR, ΔCBF, and pre- and post-vasodilation CBF in regions affected by vasculopathy. (a and b) CVR and ΔCBF in the affected regions increased significantly after bypass surgery. The effect size of multi-PLD PCASL was higher than that of single-PLD PCASL and (c) CBF within the affected regions increased significantly in both pre- and post-vasodilation conditions after bypass surgeries. The effect size of the post-vasodilation CBF change was larger than the pre-vasodilation condition. CBF measured by multi-PLD PCASL were higher than the values measured by single-PLD PCASL in all conditions (p < 0.05 in all cases). Each box plot indicates, from top to bottom, the maximum, 75th, 50th, 25th percentiles, and minimum not considering outliers, and the outliers represented by diamonds.
Figure 5 shows the significant voxelwise CVR differences (with corrected p-value <0.05) before and after bypass surgeries. Bilateral MCA and ACA territories are the primary regions with significant CVR differences, reflecting the sites of the vasculopathy and bypass. In these regions, the CVR change ranged from 2.3% to 27% for this cohort after surgery.
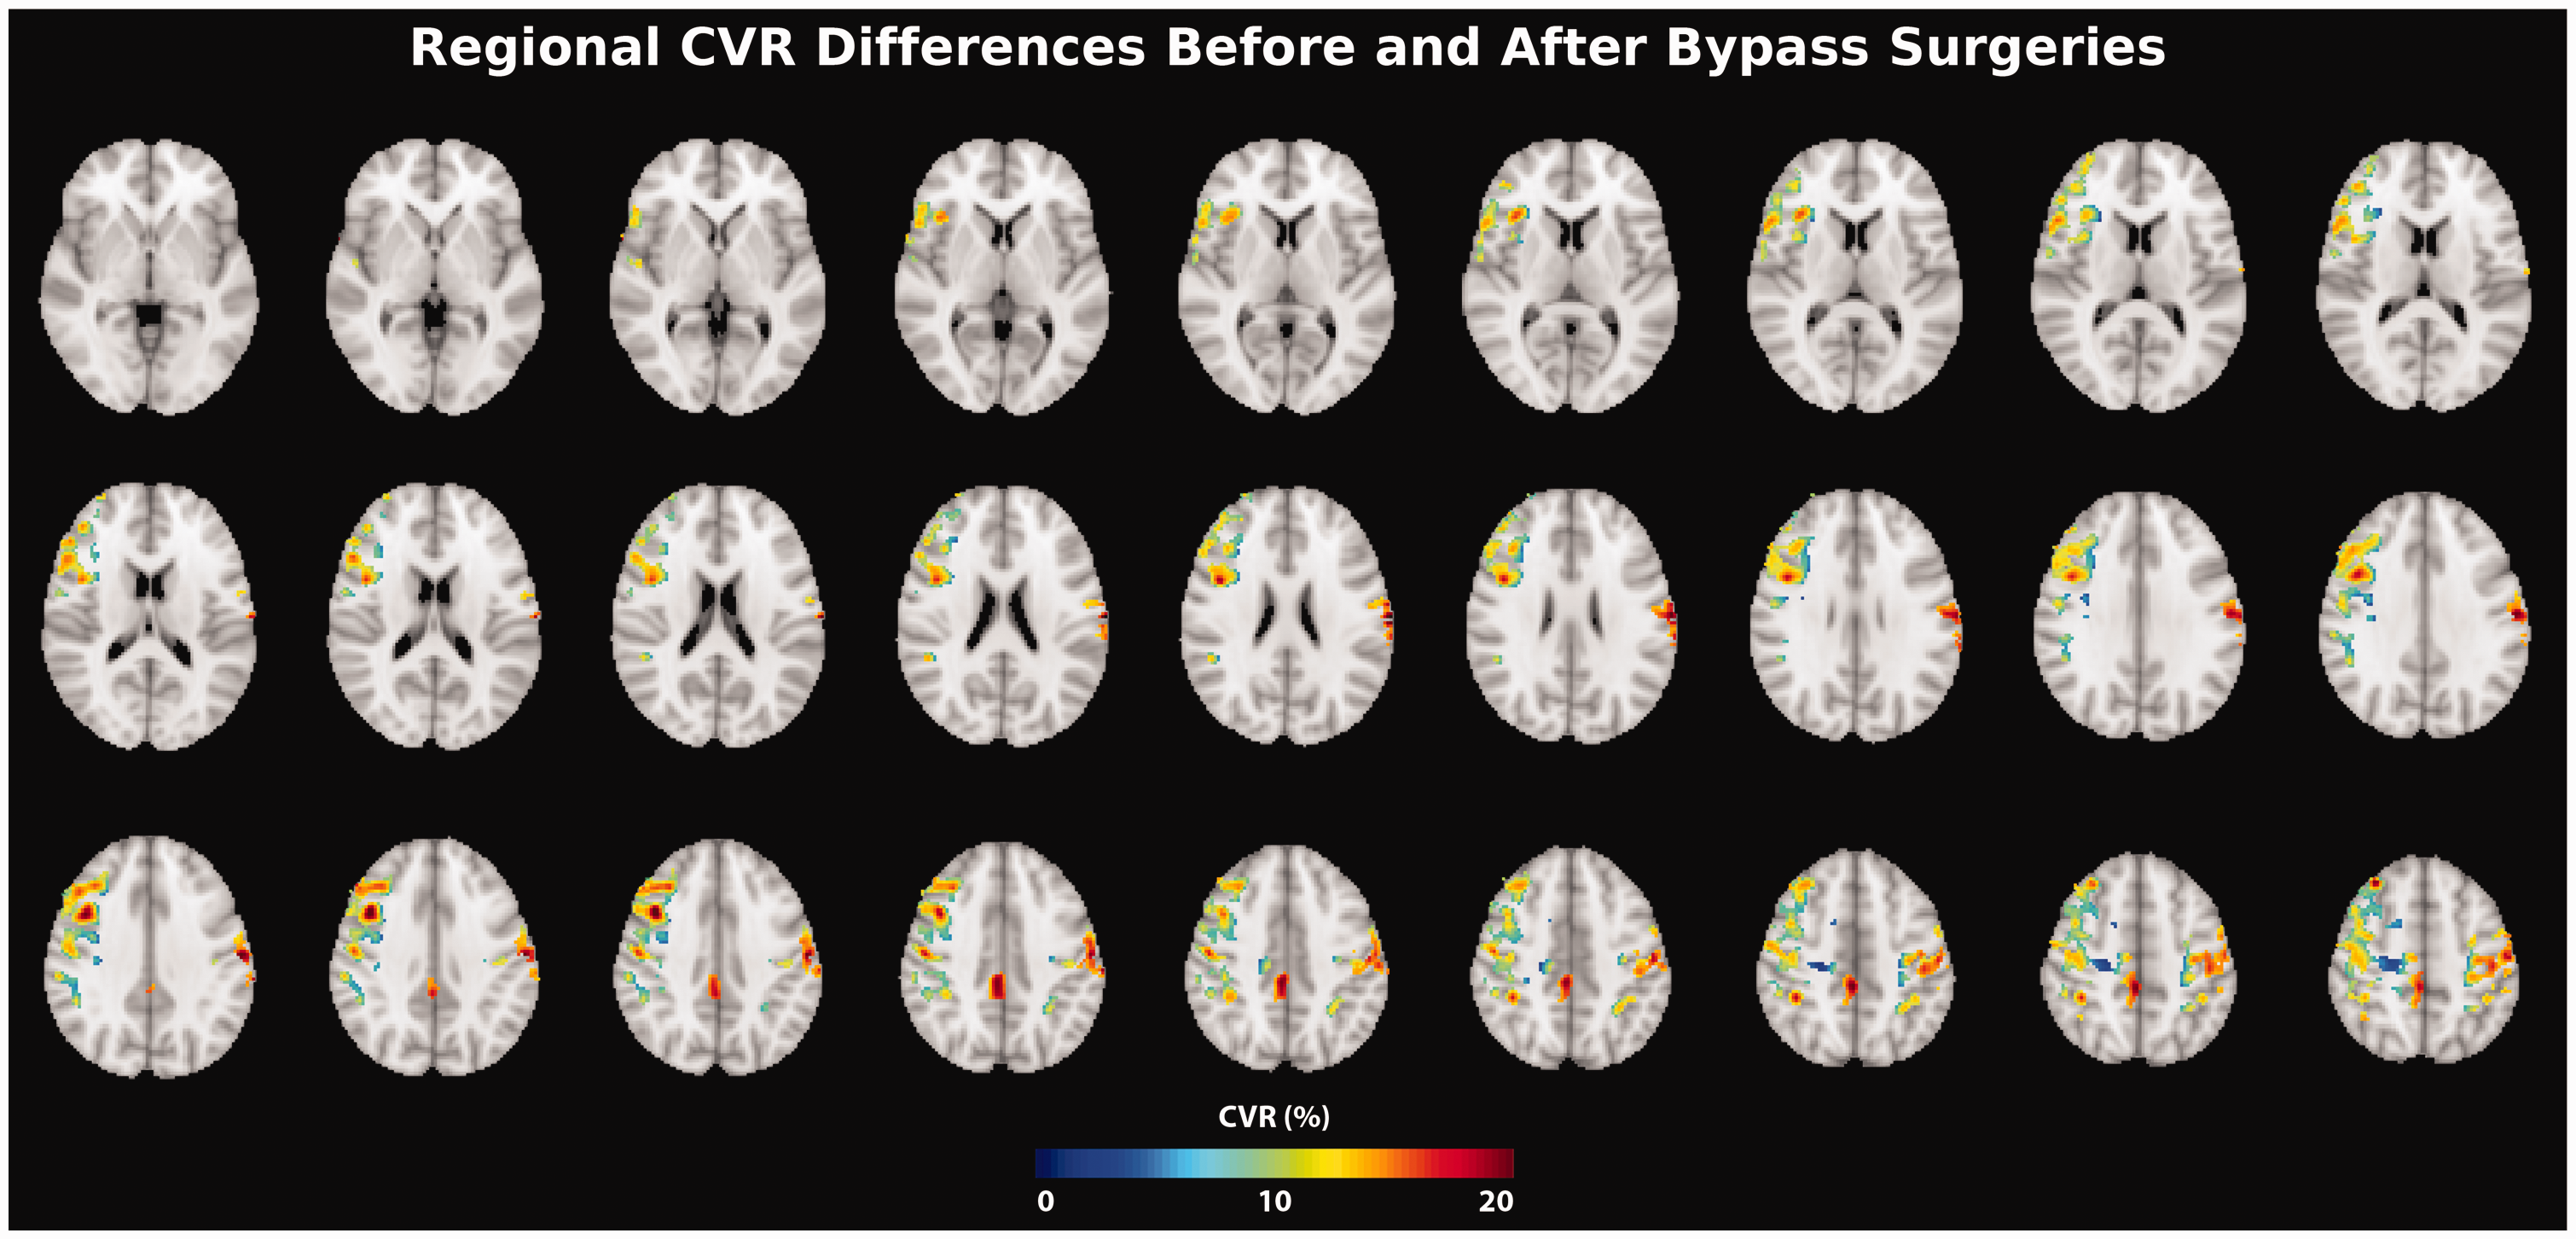
Regions of significant CVR differences (paired t-test; corrected p-value <0.05) before and after surgery. Overall, the CVR difference between before and after surgery was between 2.3% and 27% in these regions.
Transit time changes after revascularization
Figure 6(a) and (b) shows the ATT and Tmax change in the regions affected by vasculopathy after bypass surgeries. Revascularization caused ATT to reduce significantly by 11 ± 7% (p < 0.01) and 13 ± 7% (p < 0.01) pre- and post-vasodilation, respectively. Similarly, Tmax in the regions affected by vasculopathy reduced significantly by 9 ± 5% (p < 0.01) after bypass surgeries, indicating improved vascular hemodynamics and blood circulation. Figure 6(c) and (d) show the correlation between ATT measured by multi-PLD PCASL and Tmax measured by DSC. Overall, a strong and positive correlation is observed between these two techniques. Figure S2 in Supplementary Materials shows the Bland Altman plots of transit time measured by multi-PLD PCASL and DSC.
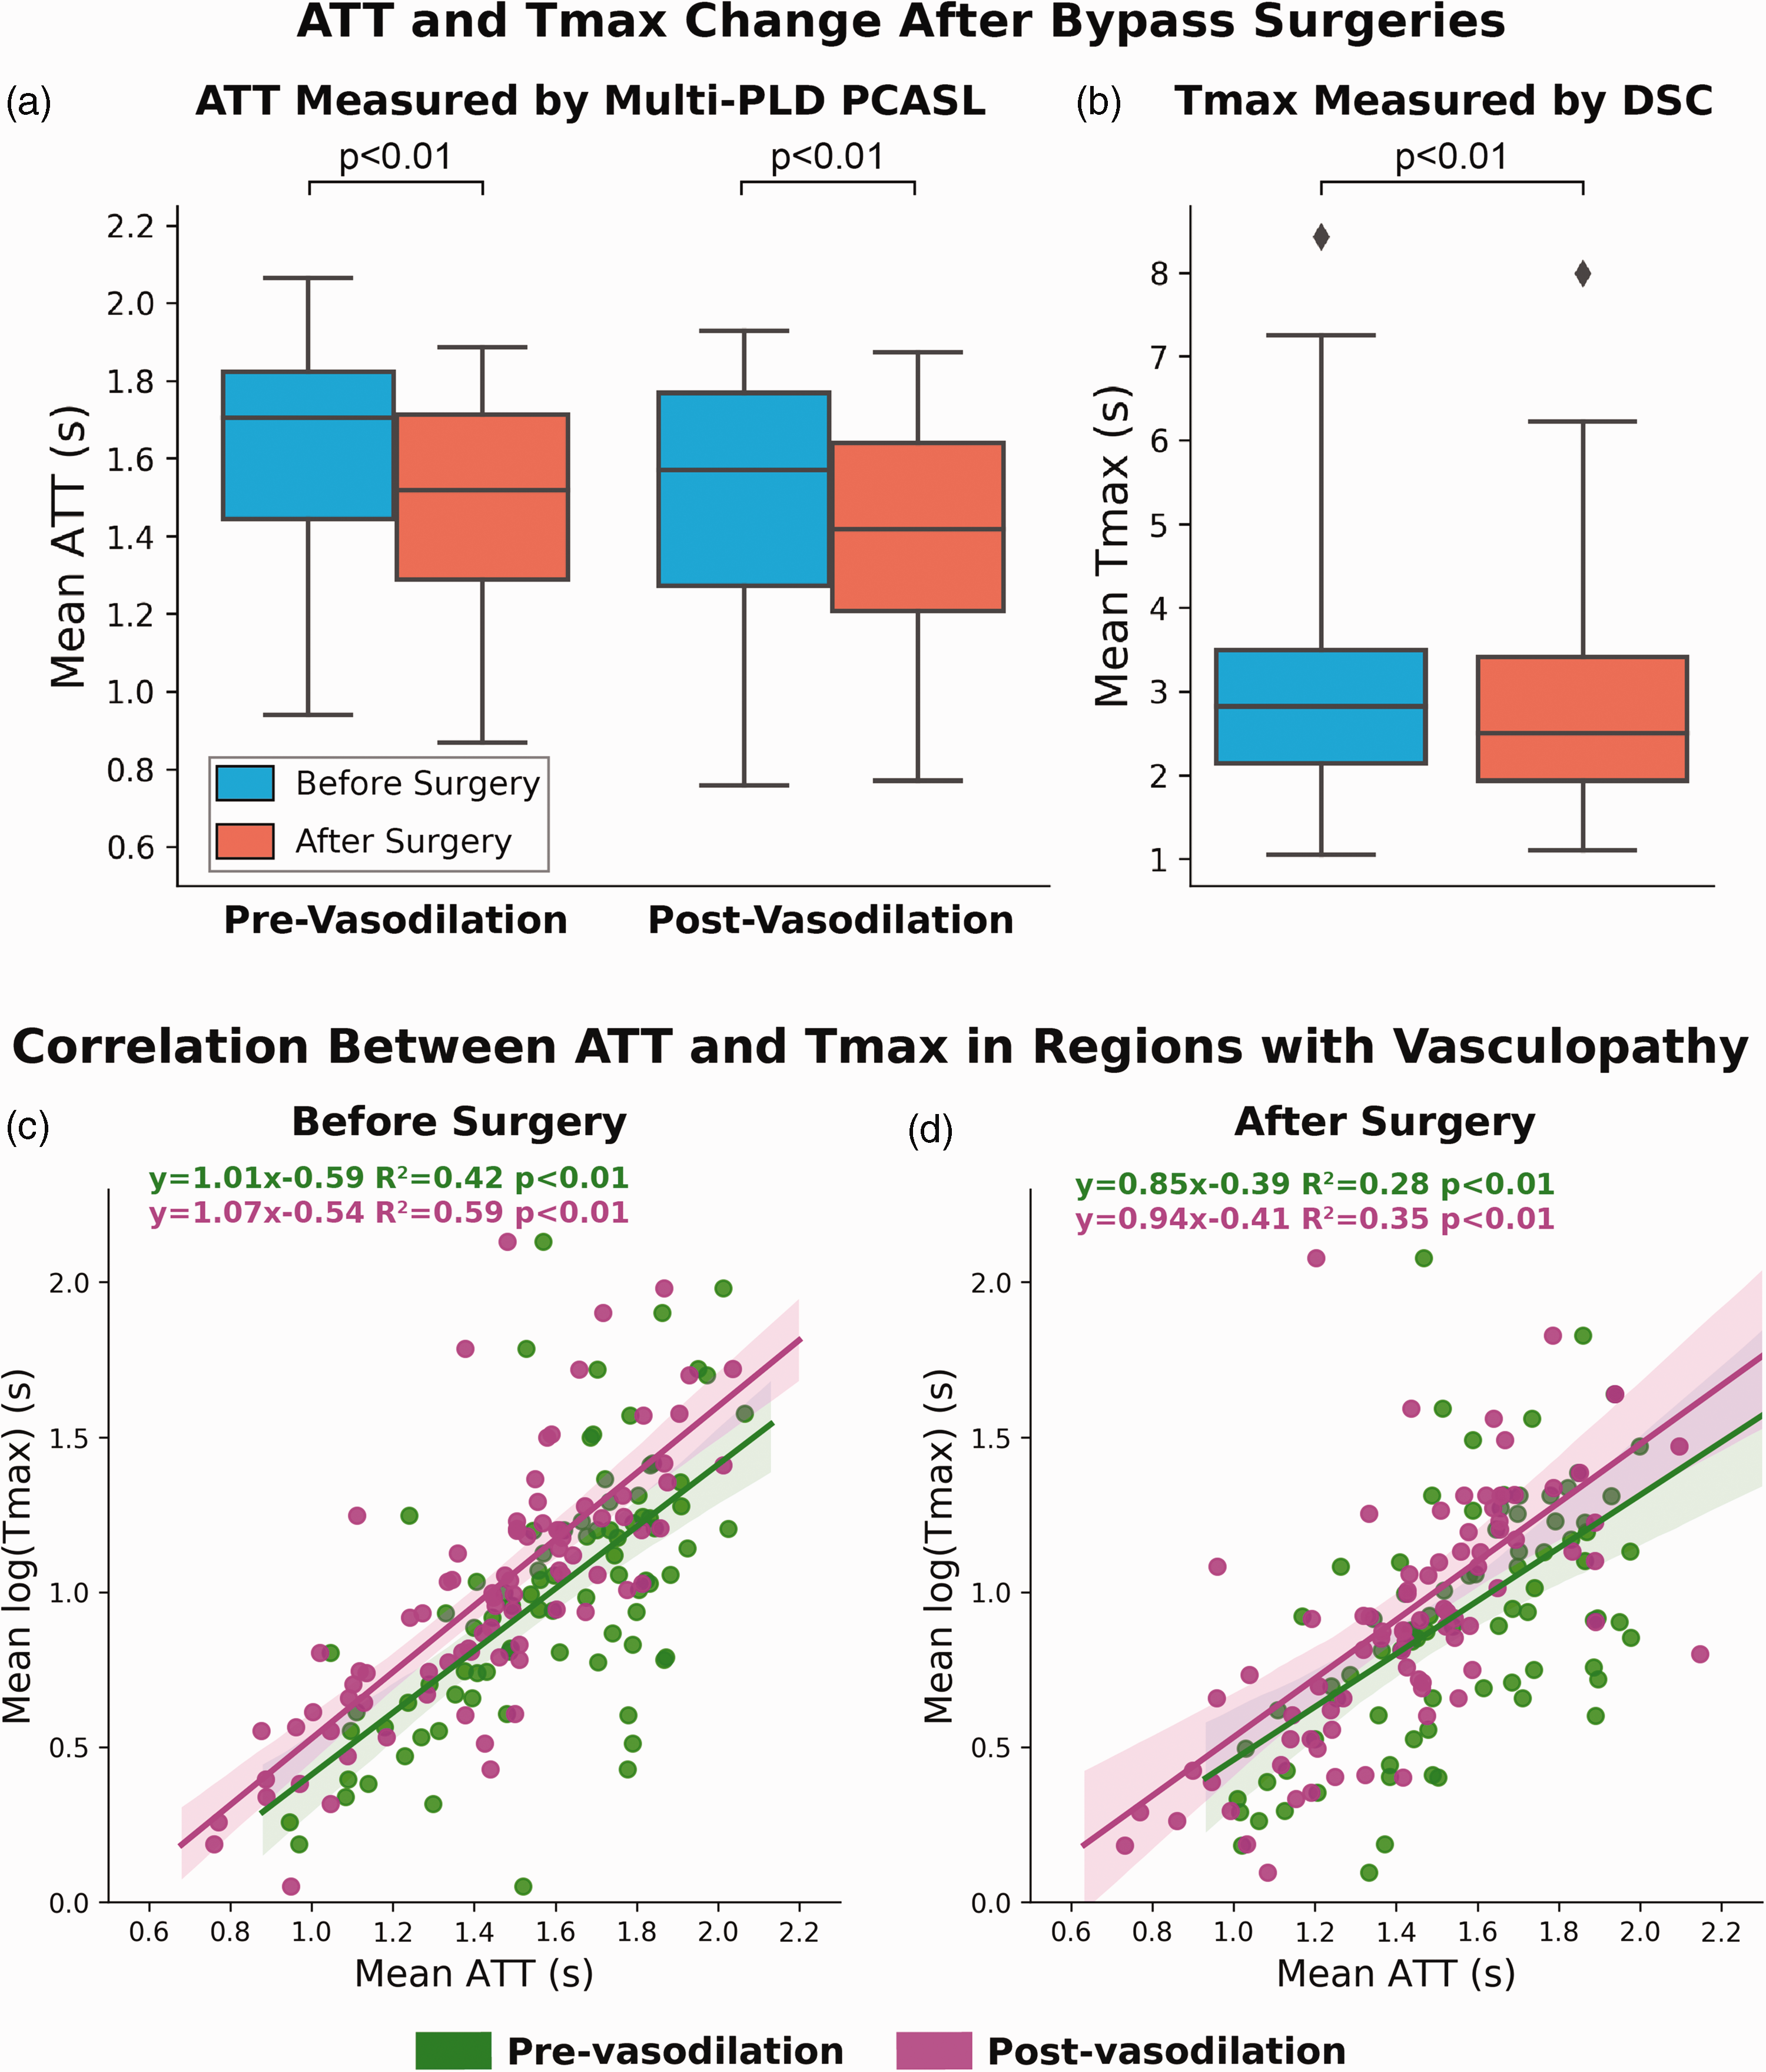
(a and b) ATT and Tmax change in regions with vasculopathy after bypass surgeries. Both ATT and Tmax decreased significantly after bypass surgeries pre- and post-vasodilation and (c and d) correlation between mean ATT (measured by multi-PLD PCASL) and Tmax (measured by DSC) before and after bypass surgeries in regions with vasculopathy. The correlation reduced slightly after bypass surgeries in both pre- and post-vasodilation conditions. The correlation was higher post-vasodilation. Each box plot indicates, from top to bottom, the maximum, 75th, 50th, 25th percentiles, and minimum without considering outliers, and the outliers represented by diamonds. The shaded area represents the 95% confidence interval.
Discussion
In this study regarding the impact of revascularization on the vascular hemodynamics of Moyamoya patients, we investigated CBF and CVR measurements using single- and multi-PLD PCASL and transit time metrics derived by ASL and DSC MRI. We quantified the changes in these imaging biomarkers before and after bypass surgeries in a large cohort and demonstrated improved hemodynamics. The clinical value of ATT derived from multi-PLD PCASL in characterizing transit delay was assessed using its correlation with Tmax of DSC MRI. The primary findings of this work were: (1) revascularization improved hemodynamic parameters (increased CVR and CBF) significantly in regions previously affected by vasculopathy; (2) multi-PLD PCASL achieved a higher effect size in measuring these parameters than single-PLD PCASL; (3) ATT demonstrated a positive and strong correlation with Tmax before and after bypass surgeries. The novelty of our work includes: (1) we demonstrated the benefit of bypass surgeries using CVR and CBF data measured using different ASL techniques; (2) we quantified regional CVR improvement and its effect size after revascularization using permutation-based nonparametric tests; (3) we validated our hypothesis that transit time measured by multi-delay ASL can assess transit delay before and after bypass surgeries.
Revascularization improved vascular hemodynamics
In comparing the CVR results before and after revascularization, we demonstrated that both single-PLD and multi-PLD ASL detected a significant increase in CVR in regions affected by vasculopathy. These data implied an enhanced capacity for CBF to react to vasodilation and presumably this represents a lower risk for subsequent acute stroke. Consequently, our data suggested a potential role for ASL and ACZ as a non-invasive and quantitative surrogate for assessing vascular hemodynamic changes after bypass. Similar CVR results have been reported in a cohort of 32 pediatric Moyamoya patients, in whom the CVR in the MCA territory measured by single-PLD PCASL increased by 13% after direct bypass surgeries whereas no significant CVR increase was found in the ACA territory. 31 Our study provides additional evidence of absolute CBF and CVR increases when measured by multi-PLD compared to single-delay PCASL, which has been shown to provide more accurate CBF and CVR measurements in patients with vasculopathy in prior studies.16–18 The impact of revascularization on the hemodynamics of Moyamoya patients has been reported previously using 123I-iodoamphetamine Single-photon emission computed tomography (SPECT).32.33 For example, Saito et al. showed that the mean ACZ-induced CVR measured with SPECT perfusion imaging improved by 11-24% in Moyamoya patients with bilateral ACA and MCA occlusions after direct bypass. 32 Our ASL data not only supported these previous findings but also indicated that routine CVR assessment is feasible using ACZ as the vasodilator in ASL perfusion exams. This procedure can be widely applied to imaging centers with MRI without the need for ionizing radiation. Furthermore, our non-parametric test results identified the regions in which significant CVR changes were found after revascularization. Since most of the vasculopathy of our study cohort occurred in the ACAs and MCA territories, our analysis confirmed the benefit of revascularization in restoring CVR in the regions supplied by these vessels. To identify the regions with significantly CVR changes, we employed a permutation-based nonparametric test that has shown high robustness in imaging data, 34 making an important methodology contribution to investigating vascular hemodynamics in cerebrovascular disorders. Since there were more patients who received bypass in the left hemisphere than on the right side, more CVR changes occurred in the left side of the brain.
For both single-PLD and multi-PLD ASL analyses, we demonstrated that both pre- and post-vasodilation CBF of this cohort increased significantly after revascularization. Specifically, baseline CBF in regions with vasculopathy increased significantly for single-PLD and multi-PLD PCASL respectively while the post-vasodilation CBF increased by a larger effect size, 16% and 39% for single-PLD and multi-PLD PCASL respectively. These data suggest that despite ASL being a quantitative and noninvasive modality for perfusion assessment, there may be a systematic bias in the CBF measurements when different ASL techniques are applied. Thus, comparing CBF values between different ASL methods should be done with care and data harmonization may be needed. Although these two techniques have been compared in patients with different cerebrovascular diseases before, including our previous work, we showed novel results from post-surgery conditions, which itself is a unique contribution to making multi-PLD PCASL a standard clinical application. Together with the observed increase in CVR in these regions, our data suggested that revascularization caused improved baseline perfusion as well as reserve, possibly leading to a lower risk for acute strokes. The improvement in both absolute and relative baseline CBF after revascularization has been reported in several prior studies using different perfusion modalities including CT, SPECT, and single-delay ASL.35–38 Here, we provided novel insights to examine the post-surgical CBF using multi-PLD PCASL and our data suggested that the actual change in CBF may be greater than the values derived by single-PLD PCASL. Several prior studies have demonstrated that multi-PLD PCASL are more accurate in CBF measurement than single-PLD PCASL in patients with cerebrovascular diseases.17.18.39 Additionally, no hyperperfusion was identified in our data collected 6 months after revascularization, although it has been reported that acute hyperperfusion sometimes occurred shortly after bypass in patients with severe ICA stenosis with poor CVR. 40 Since the CVR measured will be as the percentage change between pre- and post-vasodilation CBF (shown in Figure 1), which cannot distinguish between flow arising from the bypass or native circulation, no correction was made to adjust the CBF or CVR values. The vascular resistance occurs at arteriolar level primarily, which is well distal to the bypass location (STA-MCA), so the resistance is still mostly defined by the endogenous circulation. Any dilation of the bypass should not result in a significant change in resistance because of this.
In evaluating the impact on blood circulation, we compared the arterial transit time measured by ASL-ATT and DSC-Tmax before and after revascularization. Tmax derived from DSC MRI has been widely used to determine transit delay in stroke imaging.41.42 Since Tmax was measured post-vasodilation and ATT was measured both pre- and post-vasodilation, the correlation between ATT and Tmax was higher in the post-vasodilation conditions both before and after bypass surgeries. Our data showed that Tmax in affected regions reduced significantly after revascularization. This suggested that revascularization enabled blood circulation in regions affected by stenosis and/or occlusion to be restored towards the normal level. The only prior report of Tmax reduction following bypass was a case study whereby Tmax in a Moyamoya patient with bilateral ICA occlusions decreased from over 6 seconds to less than 4 seconds that was evaluated 18 months after revascularization. 43 In the present work, ATT measured by ASL with 5 PLDs showed a positive and strong correlation with Tmax in regions affected by vasculopathy before and after revascularization. Furthermore, ATT in the affected regions declined significantly before and after the administration of ACZ, which indirectly reflected an improved baseline circulation and response to vasodilation. These findings complemented our previous work in which we demonstrated the correlation between Tmax and ATT measured by a slightly different multi-PLD PCASL technique with 3 PLDs in Moyamoya patients before revascularization. 18 Although ATT and Tmax cannot be directly compared, their strong correlation suggests that ATT can replace Tmax to evaluate transit delays. The different change in the reduction in ATT and Tmax after revascularization was likely due to the distinct nature of the tracers in ASL and DSC MRI. In ASL, the labeled blood water is used as the endogenous tracer, which is fully diffusible and can move from intravascular space to the brain tissue. On the contrary, DSC uses gadolinium-based contrast agents as non-diffusible tracers that pass directly from arteries to veins without entering the tissue. 44 ASL and DSC also differ in that ASL can be acquired in a 3 D spin echo acquisition while DSC is typically acquired as a 2 D gradient echo acquisition, making ASL images less prone to susceptibility artifacts.
In the current experimental design, we only acquired DSC data post-vasodilation, which limited the assessment of pre-vasodilation DSC parameters. Since vasodilation increases blood flow in general, we believe that it is feasible to infer that the pre-vasodilation transit time measured by DSC was longer than the post-vasodilation values. This is consistent with the findings of ASL ATT pre- and post-vasodilation, which tend to show only a very small reduction, on the order of 0.2 sec. One study showed that the range of Tmax in 18 Moyamoya patients was between 4 and 10 seconds without vasodilation, 45 but this is a very wide range and such evidence should be interpreted with care due to the differences in the location of the vasculopathies. Thus, exploring the pre-vasodilation DSC parameters and the association with transit time measured by ASL remains to be an interesting open question to explore in future studies.
Based on the CVR, CBF, transit time data, and the non-parametric test results, we conclude that revascularization significantly enhances the vascular hemodynamics of Moyamoya patients and multi-PLD ASL may be preferred to DSC MRI to evaluate cerebral hemodynamics in these patients.
ASL enabled direct and quantitative comparison of hemodynamics after revascularization
In this cohort study, we demonstrated one of the key advantages of ASL MRI over other perfusion imaging modalities (such as BOLD and DSC MRI). In essence, ASL allows non-invasive and quantitative CBF measurements in absolute units (ml/100g/min), 46 enabling direct assessment of CBF and vascular hemodynamics in longitudinal studies. In previous work that applied ASL on stroke patients, single-PLD ASL demonstrated consistent results with DSC MRI in detecting hypo- and hyper-perfusion lesions in patients with acute ischemic stroke over a 6-month follow-up period. 47 In evaluating the arterial circulation of 33 Moyamoya patients after revascularization, Hwang et al. showed that non-invasive, superselective ASL depicted changes in vascular supplying territories using DSA as the reference. 48 Our data provided quantitative assessments of both perfusion and transit time in Moyamoya patients after revascularization. The CBF results were similar to a recent study showing that multi-delay ASL achieved higher sensitivity and reproducibility over 123I-iodoamphetamine SPECT imaging to detect CBF changes after revascularization in patients with Moyamoya and atherosclerotic disease. 49 The contribution of our work also includes direction comparison in post-surgery CBF between regions affected by vasculopathy.
We also compared changes in transit time (ATT from ASL and Tmax from DSC) after revascularization in different brain territories. Since ATT can directly reflect the state of the macrovascular arterial circulation, there has been growing interest in evaluating the clinical value of ATT.50.51 Our data showed that ATT and Tmax in regions with vasculopathy reduced by 13% and 9%, respectively, after revascularization, implying improved arterial circulation in these regions. The strong and positive correlation between ATT and Tmax indicated that these two metrics contain similar information to assess transit time information. In contrast to Tmax, ATT is derived using fully diffusible blood water as the endogenous tracer in ASL. The direct comparison of ATT between different studies should be conducted with careful interpretation of the data and experimental design because the precise measurement of ATT depends on the actual location of the labeling plane relative to the brain and the labeling method (pulsed, continuous, or pseudo-continuous labeling). Since the labeling location of our data was set between C2 and C3 for all patients and the pseudo-continuous labeling technique was applied in all our ASL procedures, we were able to compare ATT measurements in different flow territories directly before and after revascularization.
Measuring CVR and CBF change using ASL and ACZ as the vasodilator allows direct and quantitative assessment of vascular hemodynamics. Although CVR can be indirectly inferred using blood oxygenation level dependent (BOLD) MRI with hypercapnia or breath-holding, the source of BOLD signal includes multiple factors such as CBF and CBV, which affects the interpretation of results. For example, Liu et al. showed enhanced CVR measured by resting-state BOLD MRI in Moyamoya patients after revascularization. 52 However, the CVR values from that study were in relative units and only suited for diseases with regional CVR impairment. Furthermore, an optimal temporal filtering strategy must be defined to process the BOLD CVR data to maximize the CO2-related BOLD signal contributions, which would inevitably lower the reproducibility of this technique for clinical applications. By contrast, we employed a quantitative CBF imaging technique using ASL that is widely available in most commercial MRI scanners without the need for optimization for specific cases. The CBF maps were also computed using well-established kinetic models based on consensus from the ASL research community.13.53 Although the injection of ACZ can cause such side effects as nausea, 54 it is a commonly used drug that can be administered by most healthcare professionals without additional training. In a systematic review paper, it was shown that ASL can achieve a higher test-retest agreement than BOLD by comparing the reproducibility of CVR measurements of different neuroimaging methods. 10 Since the current study specifically investigated the impact of revascularization on CVR measured by ASL, an open question is the degree to which a similar imaging protocol might be applicable for other MRI techniques (such as BOLD and DCE) and whether the different MRI methods are more of less favorable than each other for this application. These questions may be addressed in future studies using a similar experimental design.
Based on these considerations, we conclude that ASL could be an effective modality to evaluate the vascular hemodynamic changes in longitudinal studies based on its strength in evaluating both perfusion and transit time directly and quantitatively.
Limitations
There are several limitations to this work. One is the patient retention rate; only 52 out of 172 patients (31%) returned for post-surgery imaging follow-up in the 4-12 months time frame. The primary reason was the unavailability of local imaging facilities near the patients’ residence, so we doubt there is any systemic bias introduced for this reason. Enhancing the availability of ASL MRI exams will improve the timely assessment of vascular hemodynamics after neurosurgeries. Additionally, the sample size of this study was limited by the relatively low prevalence of Moyamoya disease (lower than 0.1 per 100,000 people in North America), 7 which might affect the generalization of applying ASL to examine the effect of revascularization treatments on vasculopathy. Although we accounted for common pitfalls of analyzing ASL data, the comparison of CBF before and after revascularization was performed without using the gold standard modality of 15O-water PET, which was due to the unavailability of local cyclotrons to produce the short half-life 15O-water tracer. In a previous study, however, we demonstrated that multi-PLD PCASL achieved a high and strong correlation in CBF measurements with PET in normal and affected brain regions. 18 In this work, we applied a similar scanning protocol and image analysis method. Nevertheless, comparing the post-surgery CBF between ASL and PET may be desired in future work. A practical alternative would be to predict PET CBF using existing ASL data, 55 if PET and a cyclotron are not available. Finally, the follow-up timing was relatively short (4–12 months). A longer-term follow up study of this cohort would be interesting to see if such changes are stable or continue to change in longer time periods. In the workflow of treating Moyamoya patients at our institution, we assess CVR using the present imaging protocol (Figure 1) at least six months after the surgery to allow sufficient time for the rehabilitation of the brain and minimize side effects due to the use of acetazolamide, which may induce severe hemodynamic disturbance. While our present data showed that baseline CBF and ATT improved towards normal levels after surgeries, it is still necessary to use acetazolamide if CVR measurements are needed. We believe such information is helpful to understand the ingrowth of the bypass and to help predict future stroke risk. A possible alternative to avoid acetazolamide is to predict CVR using deep learning with only baseline CBF and ATT, which we demonstrated in a pilot study. 56 However, since the algorithm was trained using pre-surgery data, it may be challenging to apply it to the post-surgery cases directly. Fine-tuning this model using both pre- and post-surgery data may be desired to develop a more robust technique in future work. Such a strategy will enable a fully noninvasive assessment of CVR. Examining whether changes in ATT and CBF alone at baseline are sufficient for following up these patients remains an interesting and open question. Additionally, comparing the present data with a control group would elucidate the longitudinal change in CVR in subjects without vasculopathies. Such a group may include normal subjects or Moyamoya patients without bypass surgeries, whose CVR are examined in the same interval (six months) as the patient group in future studies. Since impaired CVR in Moyamoya patients is a hallmark for a higher risk for acute stroke, the precise measurement of CVR plays a critical role in planning for bypass surgeries. As demonstrated in this paper, improved hemodynamic parameters (including CVR, CBF, and transit time) suggest successful surgeries. Since Moyamoya is a progressive disease, a potential extension of this study is to compare imaging biomarkers (such as CVR) and clinical outcomes (such as cognitive improvement) in a long-term follow-up beyond six months.
Conclusion
In this work, we investigated the change in vascular hemodynamic parameters of Moyamoya patients before and after revascularization using ASL and DSC MRI. We found significant increases in both CVR and CBF measured by ASL in regions affected by vasculopathy after revascularization. The transit time in these territories measured by multi-delay ASL and DSC declined significantly, and the results measured by these two modalities showed strong and positive correlations. Therefore, we conclude that revascularization enhanced perfusion and transit time and that multi-delay ASL may enable non-invasive measurement of arterial arrival times in Moyamoya patients.
Footnotes
Funding
The author(s) disclosed receipt of the following financial support for the research, authorship, and/or publication of this article: This work is supported by the American Heart Association (Grant: 826254) and the National Institutes of Health (Grants: R01EB025220-02 and R21NS121589).
Acknowledgements
The authors thank Teresa E Bell-Stephens, Lorraine Reilly, and Jeanne Gu for patient enrollment and project administration.
Declaration of conflicting interests
The author(s) declared the following potential conflicts of interest with respect to the research, authorship, and/or publication of this article: Greg Zaharchuk received funding support through GE Healthcare and Bayer Healthcare and equity from Subtle Medical. Gary Steinberg is a consultant for SanBio, Zeiss, and Surgical Theater, and receives royalties from Peter Lazic, US. The conflicts of interest were all unrelated to the current study.
Authors’ contributions
Moss Y Zhao: conceptualization, methodology, formal analysis, investigation, writing, funding acquisition
Rui Duarte Armindo: investigation, data curation
Andrew J Gauden: investigation, data curation
Benjamin Yim: investigation, data curation
Elizabeth Tong: investigation
Michael Moseley: supervision, funding acquisition
Gary K Steinberg: conceptualization, supervision, funding acquisition
Greg Zaharchuk: conceptualization, supervision, funding acquisition
Supplemental material
Supplemental material for this article is available online.