
Abstract
Cerebrovascular reactivity (CVR) reflects the CBF change to meet different physiological demands. The reference CVR technique is PET imaging with vasodilators but is inaccessible to most patients. DSC can measure transit time to evaluate patients suspected of stroke, but the use of gadolinium may cause side-effects. Arterial spin labeling (ASL) is a non-invasive MRI technique for CBF measurements. Here, we investigate the effectiveness of ASL with single and multiple post labeling delays (PLD) to replace PET and DSC for CVR and transit time mapping in 26 Moyamoya patients. Images were collected using simultaneous PET/MRI with acetazolamide. CVR, CBF, arterial transit time (ATT), and time-to-maximum (Tmax) were measured in different flow territories. Results showed that CVR was lower in occluded regions than normal regions (by 68 ± 12%, 52 ± 5%, and 56 ± 9%, for PET, single- and multi-PLD PCASL, respectively, all p < 0.05). Multi-PLD PCASL correlated slightly higher with PET (CCC = 0.36 and 0.32 in affected and unaffected territories respectively). Vasodilation caused ATT to reduce by 4.5 ± 3.1% (p < 0.01) in occluded regions. ATT correlated significantly with Tmax (R2 > 0.35, p < 0.01). Therefore, multi-PLD ASL is recommended for CVR studies due to its high agreement with the reference PET technique and the capability of measuring transit time.
Keywords
Introduction
Cerebrovascular reactivity (CVR) reflects the capacity of CBF to change when the physiological condition of the brain alters, and it can be measured as the relative change in CBF induced by a vasoactive stimulus.1,2 Clinically, CVR is an important biomarker that provides information to evaluate future stroke risk in diverse populations. 3 Patients with Moyamoya disease demonstrate chronic, progressive stenosis and/or occlusion of arteries in the brain, particularly of the anterior cerebral arteries (ACA) and middle cerebral arteries (MCA). 4 Due to progressive vasculopathy, these patients develop impaired CBF and CVR, leading to a higher risk of ischemic stroke and seizures.5,6 The current gold standard technique for CBF and CVR measurement is positron emission tomography (PET) with 15O-water as the radiotracer. 7 Despite its high accuracy and sensitivity, 7 this technique is not in widespread use because the procedure requires the co-localization of a PET scanner for imaging and a cyclotron to produce the short-lived 15O-water radiotracer.
Arterial spin labeling (ASL) is a non-invasive and contrast-free quantitative MRI technique to measure CBF using magnetically labeled blood water. 8 A consensus paper on ASL recommended single post-labeling delay (PLD) pseudo-continuous ASL (single-PLD PCASL) for CBF measurements in routine clinical applications. 9 Although this technique has been widely used under resting and normal conditions, the CBF measurement is sensitive to arterial transit time (ATT), the time duration for blood to travel from the labeling plane to the imaging region. 10 ATT changes during vasodilation, which makes single-PLD ASL potentially inaccurate for CVR calculations. 11 One solution to this is the use of multi-PLD PCASL, a more advanced ASL technique that demonstrated high accuracy for measuring CBF under different physiological conditions, including pre- and post-vasodilation, as it can account for changes in ATT by fitting the ASL data to a general kinetic model. 12 For instance, previous studies demonstrated that multi-PLD PCASL detected a significantly prolonged ATT in brain regions affected by stenosis or occlusion,13,14 making multi-PLD PCASL more accurate than single-PLD ASL to identify abnormal hypoperfusion and CVR impairment in Moyamoya disease patients. 15 Also, a recent systematic study comparing single- and multi-PLD PCASL suggested that multi-PLD PCASL agrees better with 15O-water PET in normal subjects. 16 Furthermore, measurement of ATT itself may be a valuable biomarker, as impaired ATT has been suggested to be a vascular risk factor for acute stroke and coronary artery disease.17,18 Time-to-maximum (Tmax) has been used to investigate the penumbra in stroke and is defined as the time to the maximum of the residue function of the signal of dynamic susceptibility contrast (DSC) MRI. 19 Tmax has been applied to identify penumbra in stroke imaging and characterize Moyamoya disease.20–22 Since ATT can be derived using multi-PLD PCASL without contrast agents, it may replace the metric of Tmax, which requires the administration of contrast agents such as gadolinium.
In this work, we studied CVR induced by the vasodilator acetazolamide (ACZ) in Moyamoya disease patients with a simultaneous PET/MRI system at 3T. We specifically compared single- and multi-PLD ASL to the gold standard PET CBF and CVR measurements to determine which MRI methodology best resembled the gold standard 15O-water PET measurement in this cohort with severe cerebrovascular disease. We also investigated the potential of multi-PLD PCASL to replace DSC MRI to measure transit time by examining the relationship between ATT and Tmax in different regions of the brain.
Materials and methods
Patient population
The study enrolled patients with Moyamoya disease without neurosurgical treatments undergoing evaluation for extracranial to intracranial bypass surgery at our institution. Exclusion criteria of PET/MRI procedures included kidney function impairment (glomerular filtration rate < 40 ml/min), pregnancy, history of brain injury, and contraindications to MRI or ACZ. All patients had a confirmed diagnosis of Moyamoya disease based on at least one of the diagnostic evaluations, including catheter cerebral angiography, MRI angiography, and computed tomography angiography. At the time of the imaging session, the patients had no acute infarction, hemorrhage, or previous stroke. Table 1 shows the demographic and vascular information of the patients enrolled in this study. Patients were instructed to refrain from food and beverage containing caffeine at least 6 hours before the experiment. 23
Patient demographics and classification of vasculopathy.
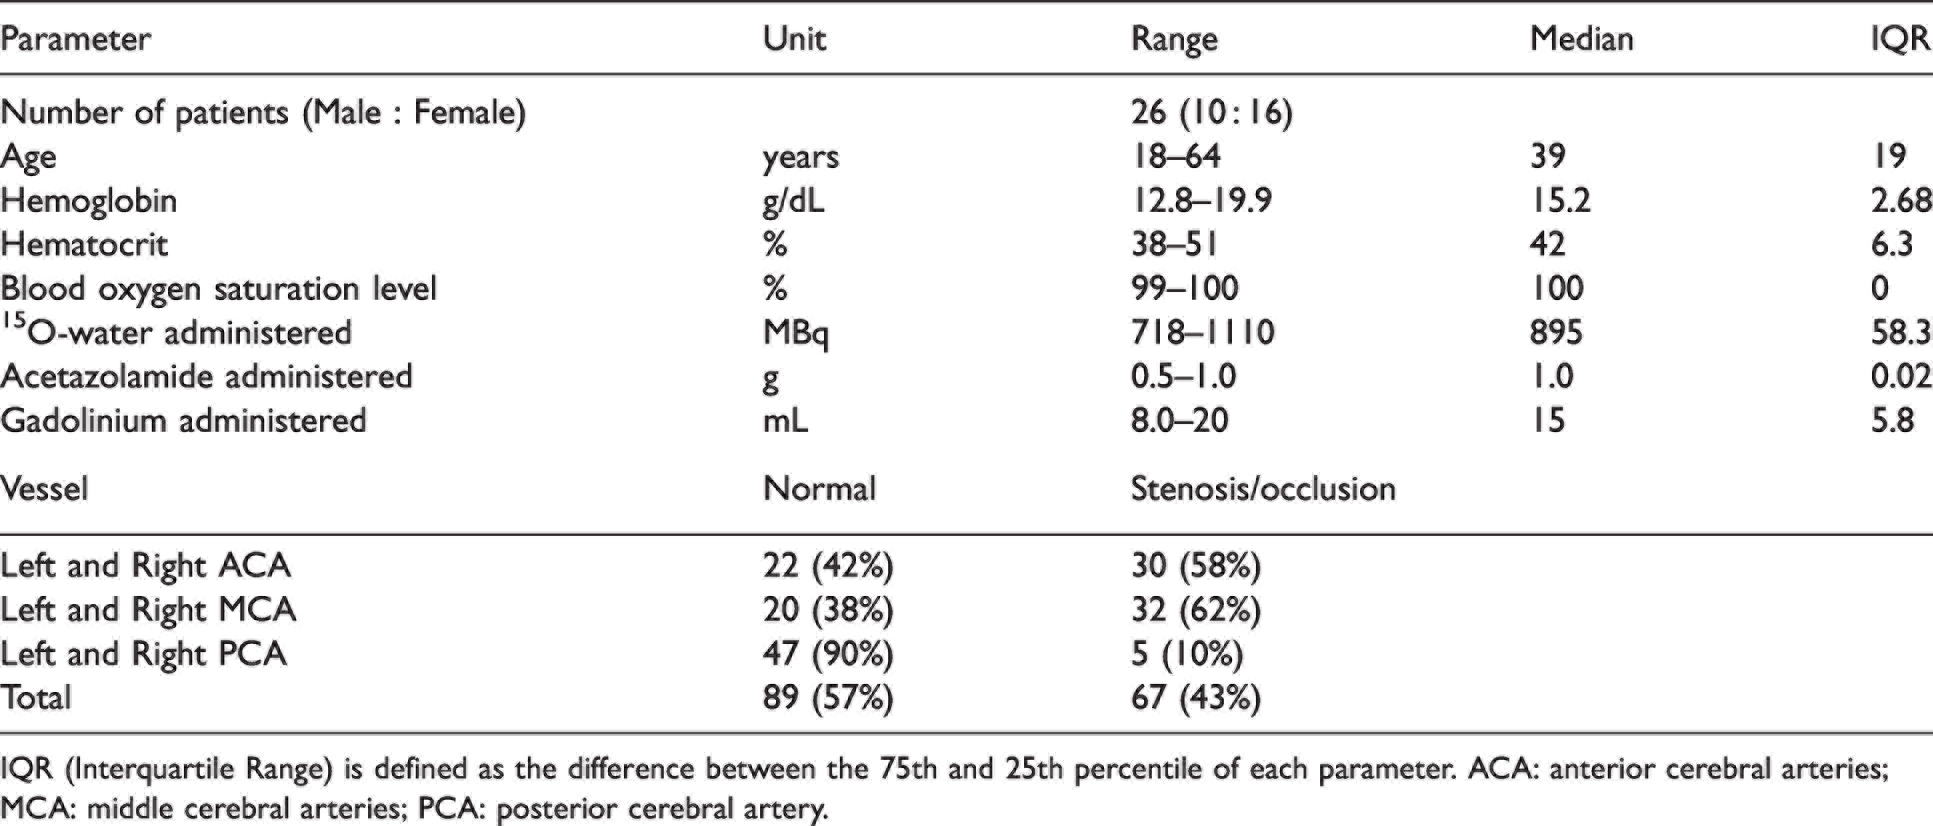
IQR (Interquartile Range) is defined as the difference between the 75th and 25th percentile of each parameter. ACA: anterior cerebral arteries; MCA: middle cerebral arteries; PCA: posterior cerebral artery.
Experimental design
All procedures were performed according to the regulations of the institutional review board of Stanford University and the Declaration of Helsinki, and all subjects provided written informed consent. Figure 1 presents the timeline of the imaging experiments performed. PET and MRI data were collected on a simultaneous time of flight (TOF) enabled 3T simultaneous PET/MRI system (Signa, GE Healthcare, Waukesha, WI, USA). Each subject received ACZ administration at a dose of 15 mg/kg of body weight (with a maximum dose of 1000 mg).
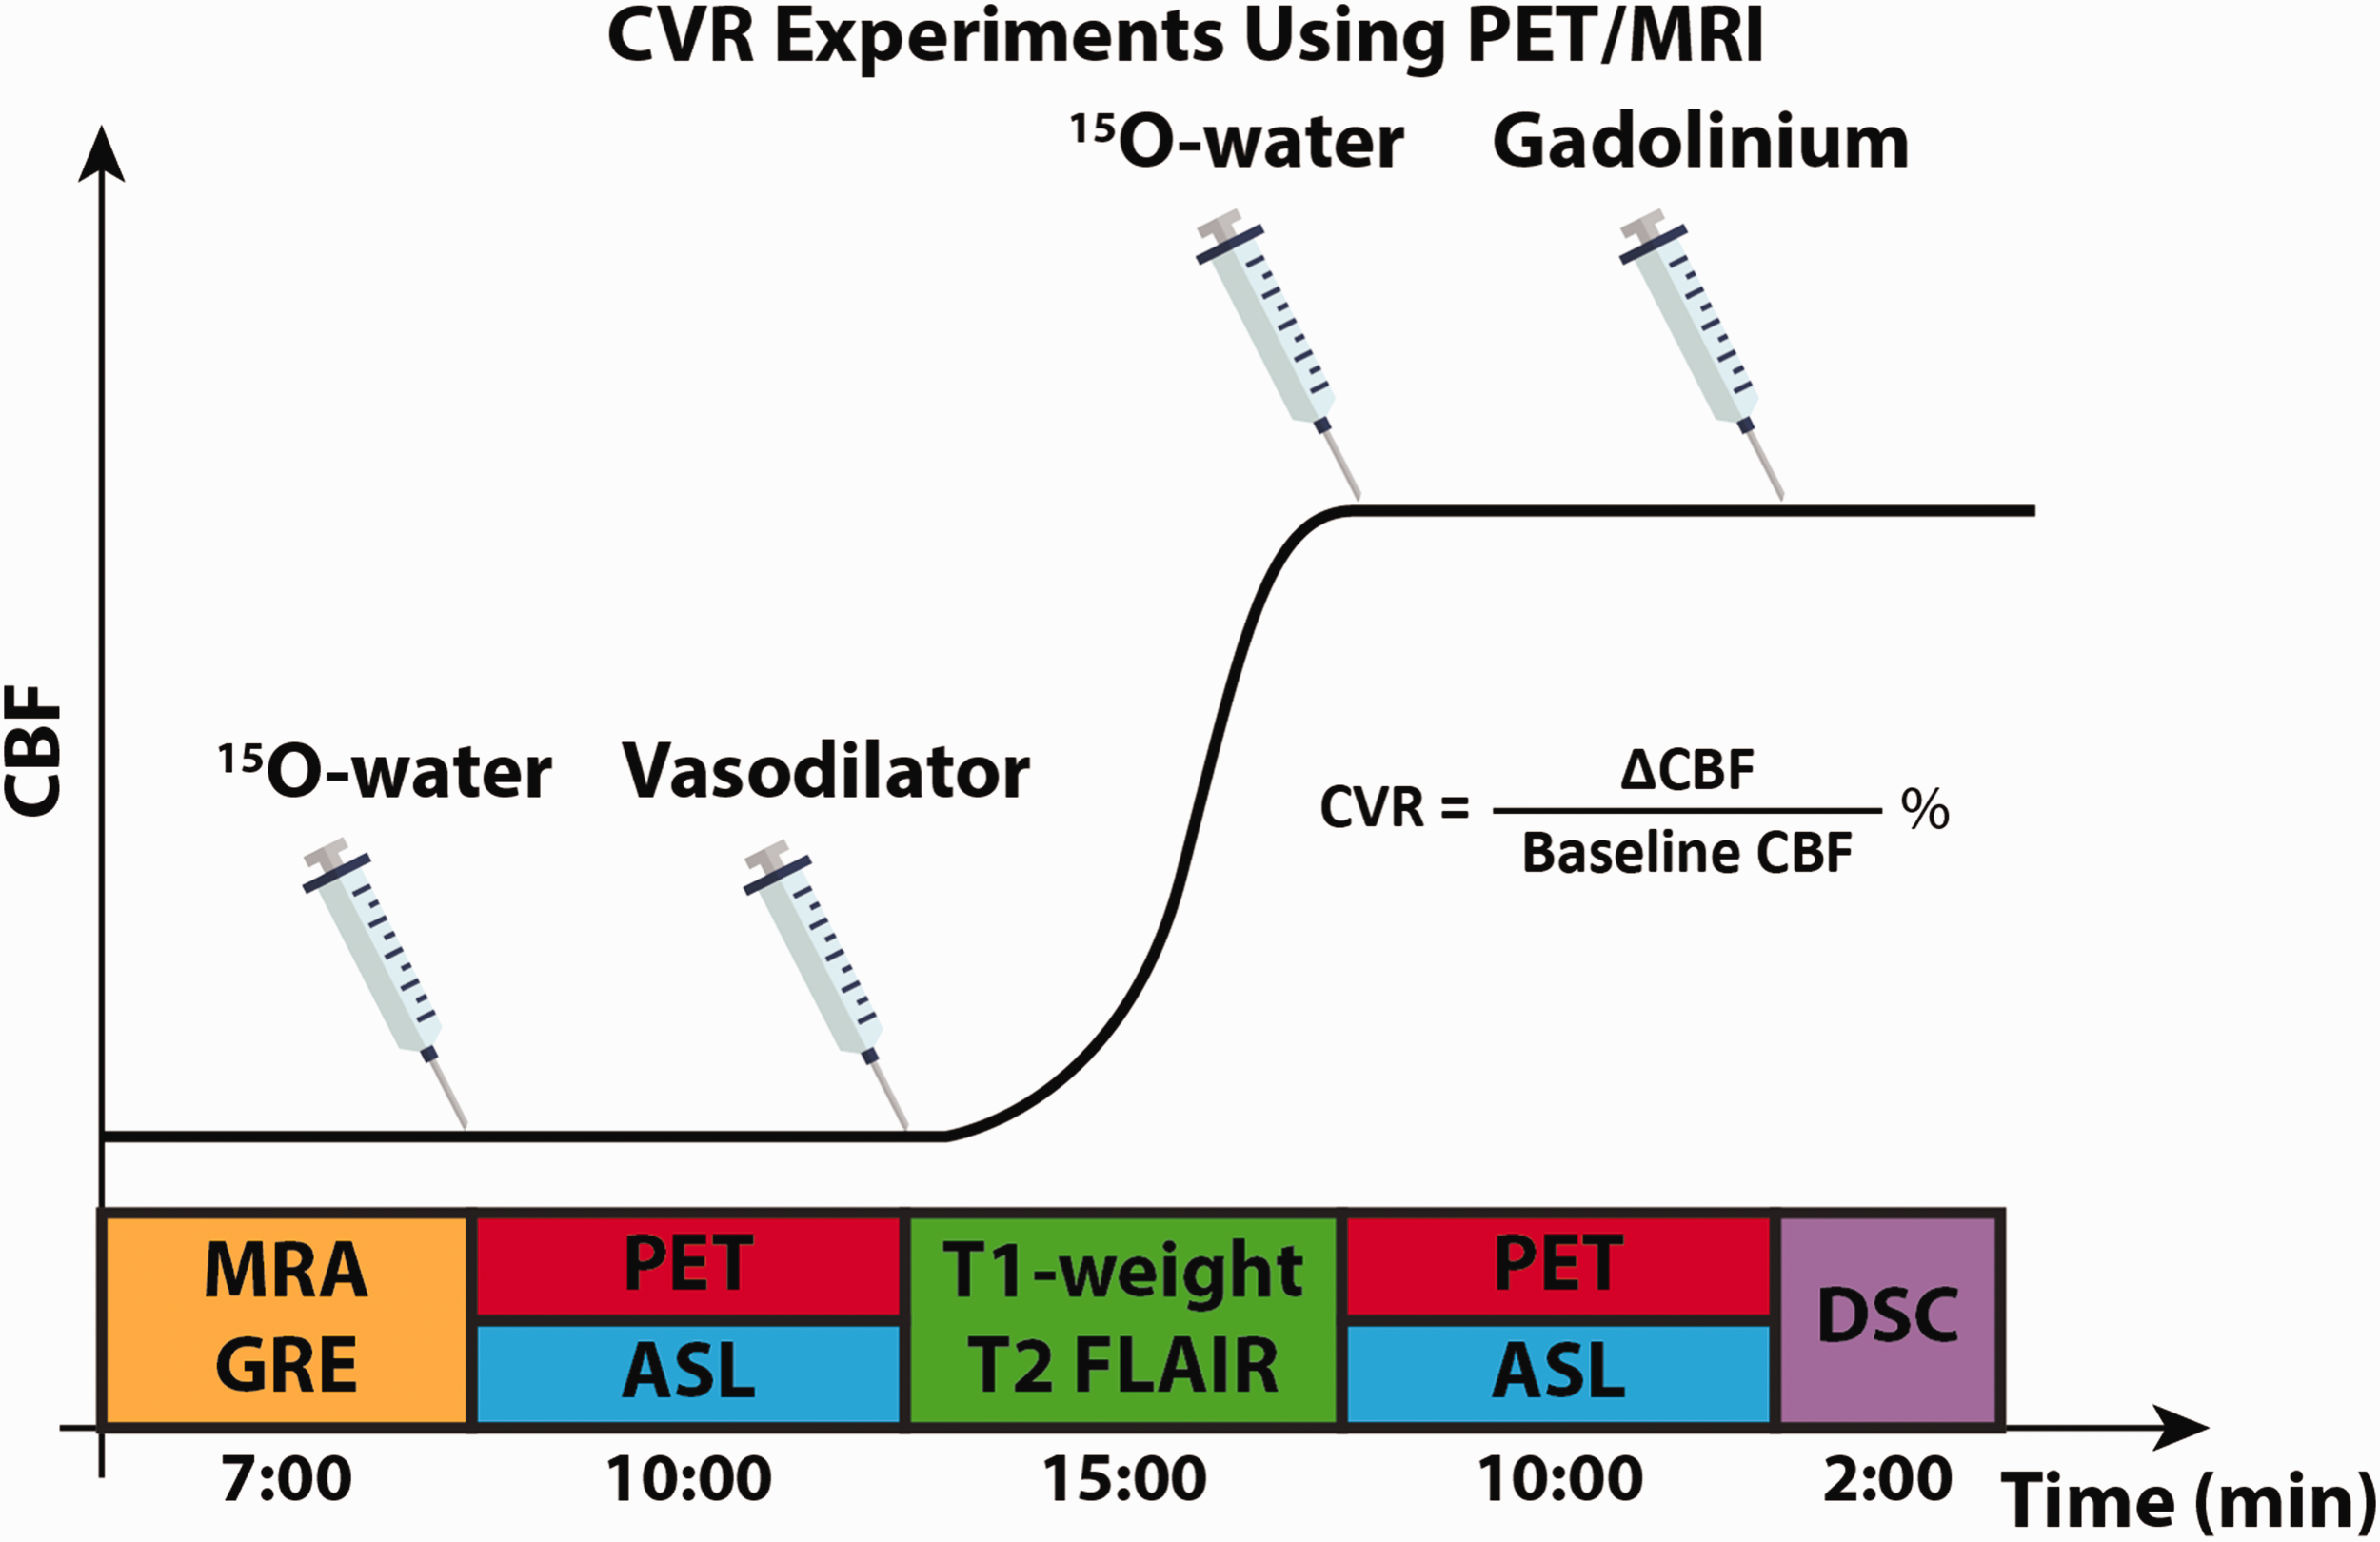
Experimental design for measuring CVR using PET/MRI. MRA, GRE, and T1-weighted images were performed to determine AIF for PET CBF quantification and extract a brain mask for analysis. Simultaneous PET/ASL data were acquired before and 15 minutes after the administration of the vasodilator (acetazolamide, ACZ). Two ASL techniques were used to measure CBF, CVR, and ATT: single- and multi-PLD ASL. DSC was acquired to quantify Tmax and MTT.
PET experiments
Each patient received 888 ± 66 MBq of 15O-water before and 15 minutes after the administration of ACZ. PET image acquisition commenced with the tracer injection for 10 minutes using the parameters listed in Supplemental Table S1. Dynamic PET frames over ten minutes (30 × 1, 10 × 3, 12 × 5, 12 × 10, 12 × 30 sec) after the injection of the tracer were reconstructed using a TOF-ordered subset expectation maximization algorithm with 3 iterations and 28 subsets. 16 Attenuation correction was achieved using a two-point Dixon MRI acquisition and an atlas-based algorithm provided by the manufacturer. 24 CBF of pre- and post-ACZ were measured by fitting a one-compartment pharmacokinetic model to the dynamic PET data with an image-derived arterial input function (AIF). 25
MRI experiments
MR angiographic (MRA) and gradient echo (GRE) images were acquired before the administration of PET tracer. The coverage of the MRA scan was a region of 40 mm in craniocaudal dimension, with the top of the imaging slices located at the Circle of Willis in order to obtain the AIF for PET quantitation. The coverage of GRE included the full brain and the data was used to extract a brain mask for analysis. DSC MRI was performed after the administration of the vasodilator ACZ using 0.1 mmol/kg of gadobenate dimeglumine (Multihance, Bracco, Milan, Italy) injected at a rate of 4 mL/s and a pre-delay of 18 s. Single-PLD (PLD = 2025 ms) PCASL and multi-PLD (300, 2000, 3700 ms) PCASL scans were performed at the same time as the PET scans using the parameters in Table S1 in Supplementary Materials. 26 T1-weighted structural and T2-FLAIR images were acquired from each patient. All MRI parameters are listed in Supplemental Table S1.
CBF and ATT from pre- and post-vasodilation ASL scans were quantified by fitting the ASL difference data to the general kinetic model using the spatially variational Bayesian inference techniques implemented in the FSL tool BASIL,27,28 assuming the labeling efficiency to be 85% and a blood-brain partition coefficient of 90%. 16 Partial volume effects on the edge of the brain were corrected using the erosion and extrapolation method. 29 Voxel-wise CBF variation (ΔCBF) was computed as the absolute CBF change after vasodilation (post-vasodilation CBF minus pre-vasodilation CBF). CVR was computed as the percentage ratio between ΔCBF and baseline CBF. 30 Voxel-wise Tmax and mean transit time (MTT) were computed by fitting the DSC data to the tissue concentration curve using the RAPID software (RapidAI, Redwood City, CA, USA).19,31
Image registration and analysis masks
A full brain mask for group analysis was created by extracting the brain from the T1-weighted template in the Montreal Neurological Institute (MNI) 152-2 mm space using the FSL tool BET. 32 Six flow territories (left ACA, right ACA, left MCA, right MCA, left PCA, and right PCA) were defined based on the Harvard-Oxford cortical and subcortical structural atlases. 33 For each of these regions, we further divided them into regions affected and unaffected by vessel occlusion based on the severity of vasculopathy of each Moyamoya patient. CBF, CVR, and ATT images of each subject were transformed to the MNI-152 space by using rigid-body transformation of the ASL difference or PET image to the T1-weighted structural image of each subject with FLIRT; followed by a second nonlinear transformation registering the T1-weighted image to the MNI152 2 mm standard brain using FNIRT. 34 Tmax maps of each patient were transformed to the MNI152 2 mm standard space using the same method with EPI distortion correction. 35 After registration, ΔCBF, CVR, ATT, and Tmax in each flow territory were computed. All parameter maps were smoothed using a Gaussian spatial filter of 5 mm FWHM.
Statistical analysis
Paired t-tests were conducted to compare (1) CVR between regions with and without occlusion (affected vs unaffected), (2) ATT before and after vasodilation, and (3) Tmax in different flow territories, under the null hypothesis that the values were the same and p-value thresholded at 0.05 for significance. The normality of the CVR and ATT data was checked using Kolmogorov-Smirnov tests before conducting the t-test. 36 Bland-Altman analyses were performed to compare the CVR measured by (1) single-PLD PCASL and PET and (2) multi-PLD PCASL and PET. The agreement between CVR measured by ASL and PET was examined using concordance correlation coefficient (CCC) 37 in occluded (affected) and normal (unaffected) regions. Since the Tmax values of the group were not normally distributed, their natural logarithm was computed. The relationship between ATT and Tmax was examined using log-level linear regression [log(Tmax) vs ATT].
Results
Patient information
A cohort of 26 patients (10 males, 18-64 years) was included in this study. The majority of stenosis or occlusion occurred in ACA and MCA (58% and 62%, respectively) while the circulation in PCA was normal for most patients (90%), as detailed in Table 1.
Hemodynamic maps of an example patient
Figure 2 shows the hemodynamic images of a patient with bilateral ACA and MCA occlusion. According to the T1-weighted and T2 FLAIR images, there was no acute hemorrhage, acute infarction, mass, or abnormal enhancement in the parenchyma. The occlusion of ACA and MCA caused delayed ATT and Tmax and declines in CBF and CVR (indicated by yellow arrows) in this patient.
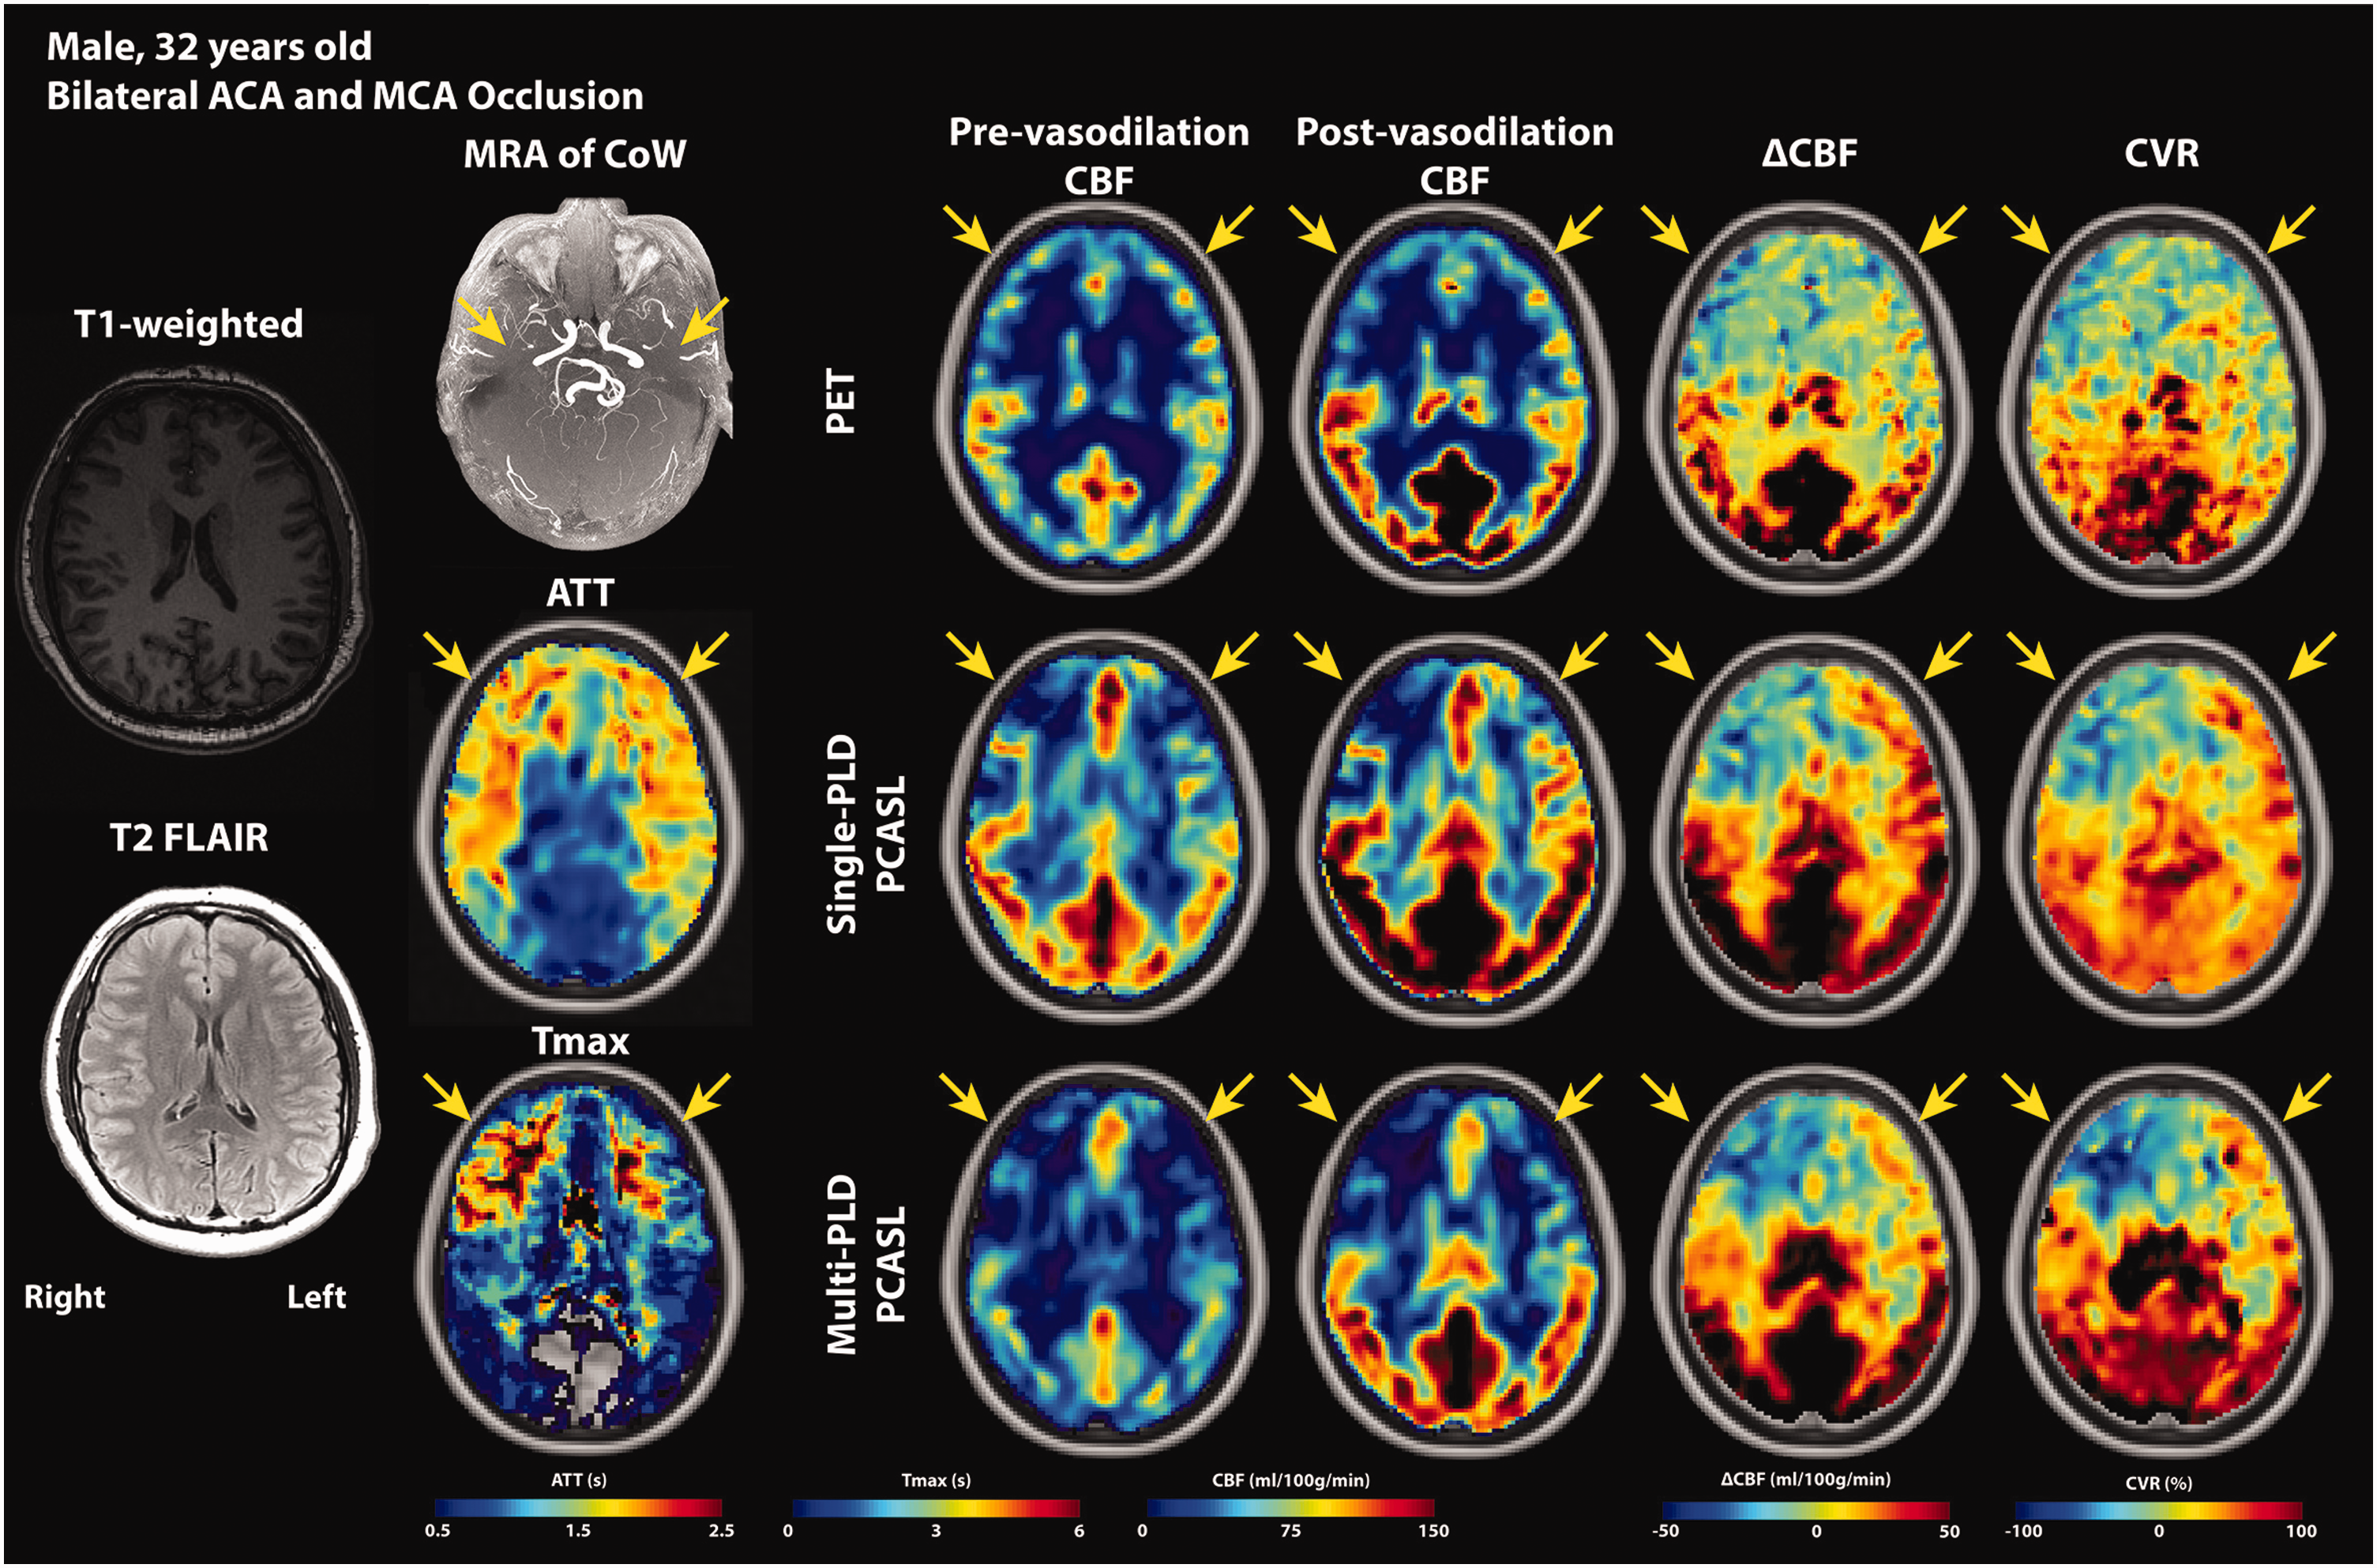
PET and MRI images of a Moyamoya disease patient (male, 32 years). According to the radiology report, there was no acute hemorrhage, acute infarction, mass, or abnormal enhancement in the parenchyma. MRA of CoW reveals the bilateral ACA and MCA occlusion (yellow arrows). PCAs of both hemispheres were unaffected. Both ATT and Tmax showed delayed transit time in the affected ACA and MCA regions. The obstruction of blood flow caused ATT and Tmax to increase and CBF and CVR to decrease in the ACA and MCA territories of both hemispheres, with the right side worse than the left. Comparing the hemodynamic parameters between the hemispheres, the right side demonstrated a higher Tmax, a lower CBF, ΔCBF, CVR than the left hemisphere, vascular steal (negative ΔCBF and CVR), leading to the conclusion that the vasculopathy of the right side was more severe than the left.
CBF and CVR results
Figure 3 shows the group mean CVR and ΔCBF induced by vasodilation in non-occluded (unaffected) and occluded (affected) vascular territories. The mean CVR in the non-occluded region was significantly higher (by 68 ± 12%, 52 ± 5%, and 56 ± 9% for PET, single-PLD PCASL, and multi-PLD PCASL, respectively, all p < 0.05) than the values found in the regions affected by occlusion. For absolute CBF change (ΔCBF) induced by vasodilation, no significant difference (p = 0.18) was detected by single-PLD PCASL while PET and multi-PLD PCASL showed a significantly lower change in occluded (affected) regions than non-occluded (unaffected) regions. Figure 4 shows the relationship between CVR measured by ASL and PET. using PET as the reference In the unaffected regions, multi-PLD PCASL was more accurate with a bias of 3.9% in comparison with 8.7% of single-PLD PCASL. The two ASL techniques showed a similar correlation with PET in affected territories (concordance correlation coefficient = 0.35 and 0.36 for single- and multi-PLD PCASL respectively), but multi-PLD PCASL demonstrated better agreement with PET in normal regions (0.32 vs 0.16 for single- and multi-PLD PCASL, respectively). For all affected and unaffected regions, multi-PLD PCASL achieved a stronger correlation than single-PLD PCASL, as shown in Figure S1 of Supplementary Materials. The relationship between ΔCBF of PET and ASL in affected and unaffected regions can be found in Figure S2 of Supplementary Materials.
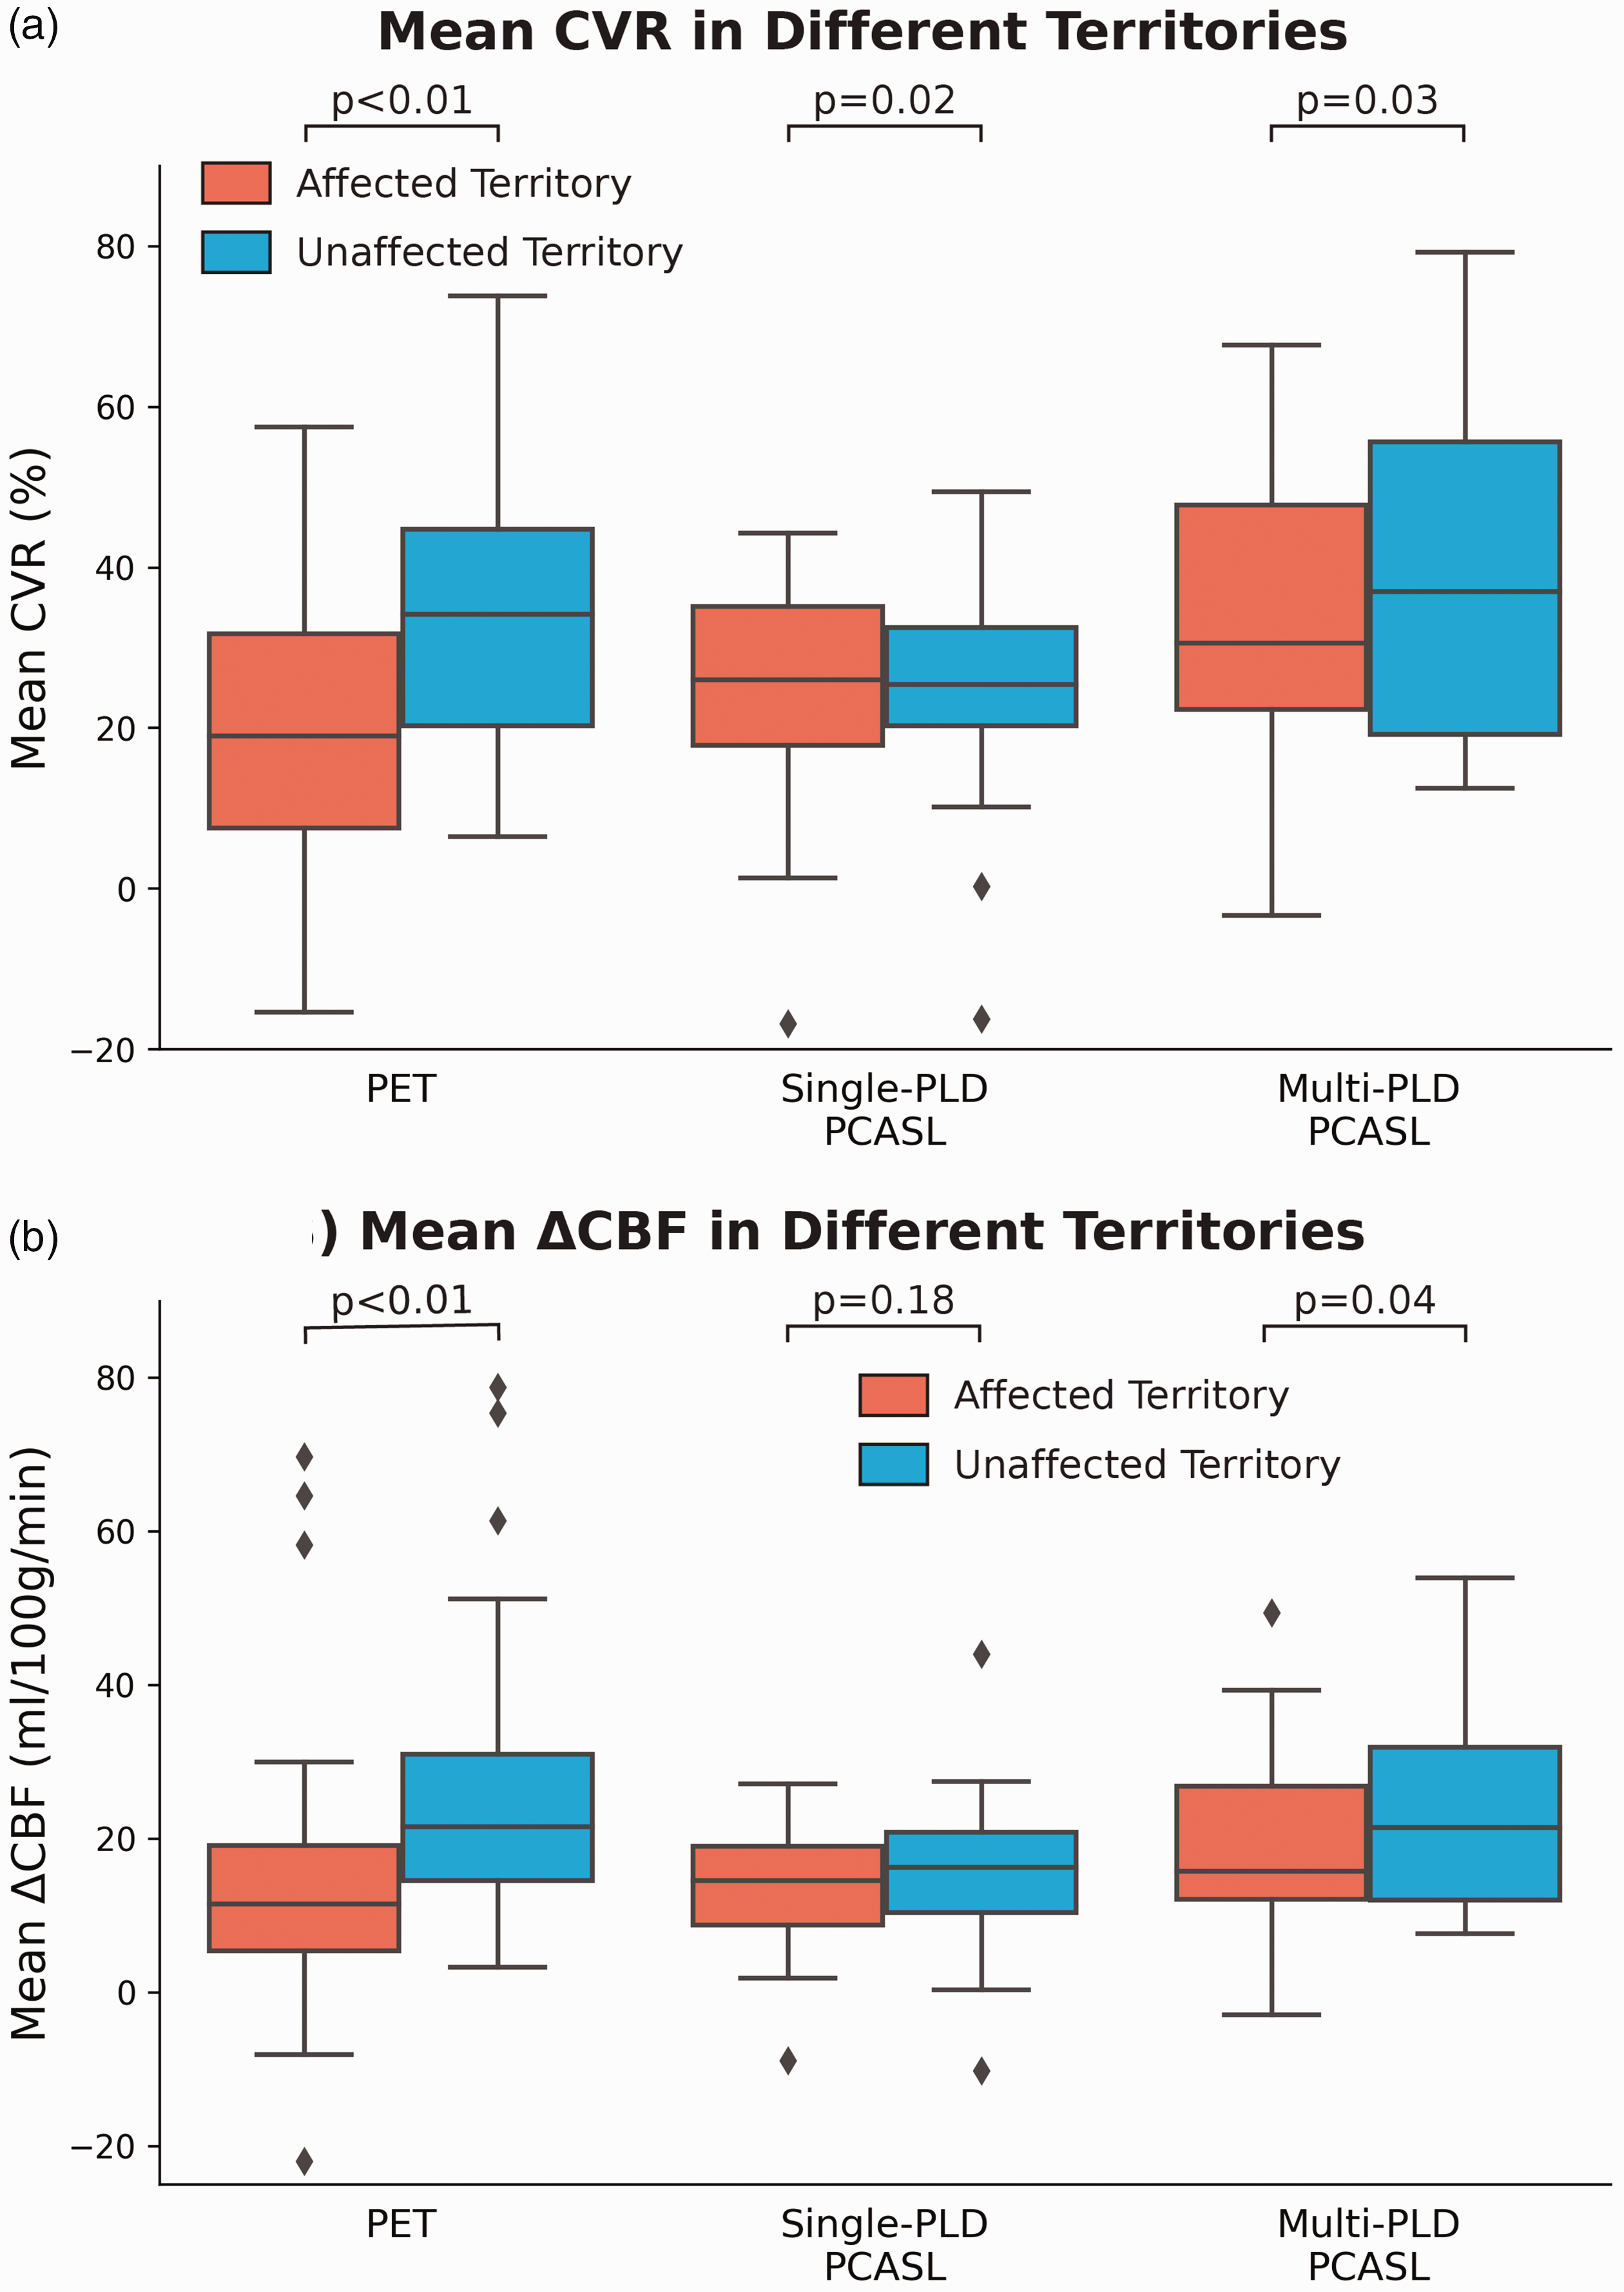
Group mean CVR and ΔCBF measured by ASL and PET in affected and unaffected territories. (a) Mean CVR measured by all modalities was significantly lower in affected regions. (b) Only PET and multi-PLD PCASL detected significant CBF variations induced by vasodilation between affected and unaffected regions. Each box plot indicates, from top to bottom, the maximum, 75th, 50th, 25th percentiles, and minimum without considering outliers, and the outliers are represented by diamonds.
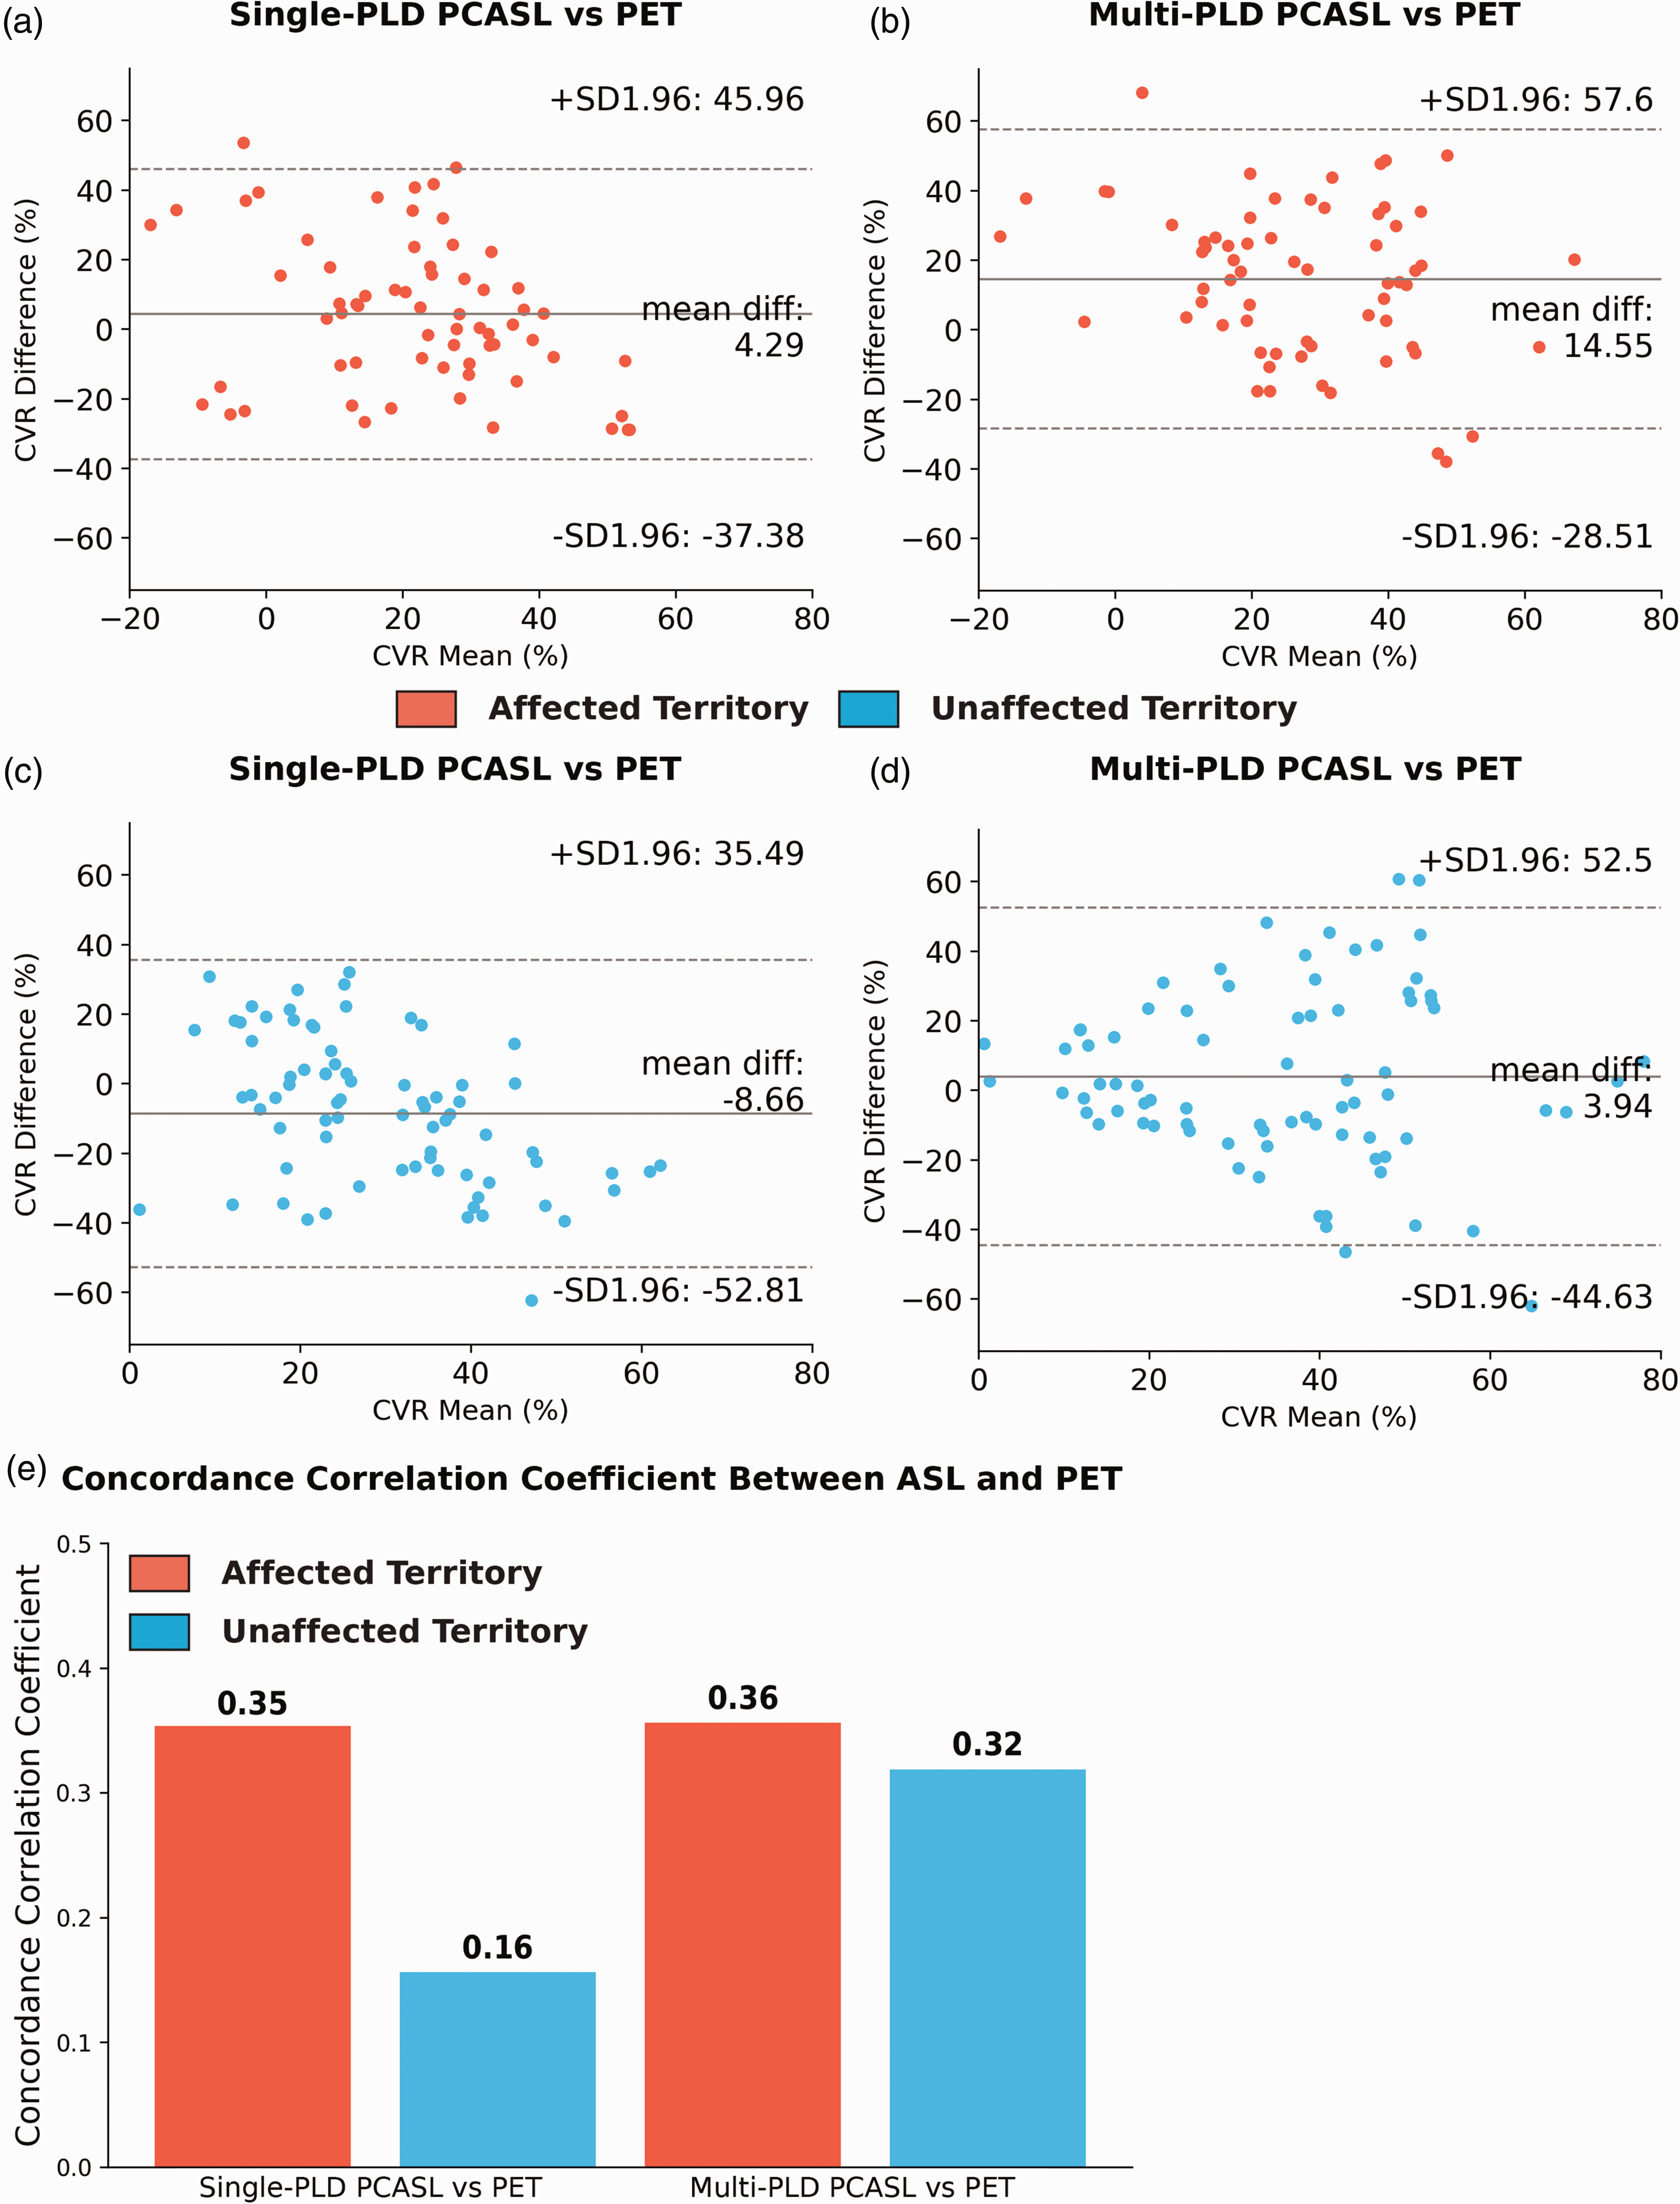
Relationship between CVR measured by ASL and PET. (a) and (b) In the territories affected by stenosis/occlusion (N = 67), single-PLD PCASL overestimated CVR with a bias of 4.3%. (c) and (d) In the unaffected territories (N = 89), multi-PLD PCASL slightly overestimated CVR by a bias of 3.5%. (e) Both ASL techniques had a similar concordance correlation coefficient in regions affected by stenosis/occlusion while multi-PLD PCASL showed higher agreement with PET in normal (unaffected) territories.
ATT, Tmax, and MTT results
Figure 5 shows the mean ATT measured by multi-PLD PCASL before and after vasodilation as well as mean Tmax in normal and affected territories. Overall, mean ATT reduced significantly (p < 0.01, paired t-tests) in both affected and unaffected territories after vasodilation. Specifically, the administration of vasodilator caused a 4.5 ± 3.1% reduction in ATT in regions affected by occlusion and an 8.9 ± 5.0% reduction in normal regions. Vessel occlusion caused mean ATT to be significantly higher than normal by 15 ± 8.6% and 18 ± 9.6% before and after vasodilation, respectively. In terms of the mean Tmax measured by DSC MRI, which was performed after vasodilation, a significant difference (33 ± 20%, p < 0.01) was found between Tmax of affected and unaffected regions. Similarly, MTT of affected territory (median = 7.41s; IQR = 1.09s) was significantly higher (p = 0.01) than the values of unaffected territory (median = 6.39s; IQR = 1.26), indicating impaired blood circulation affected by the vessel occlusion. Figure 6 shows the regression analysis between ATT and Tmax and between ATT and MTT. Overall, a strong and positive correlation was found between ATT and log(Tmax) and between ATT and log(MTT) before and after vasodilation while the correlation after vasodilation was better in all ACA, MCA, and PCA territories.
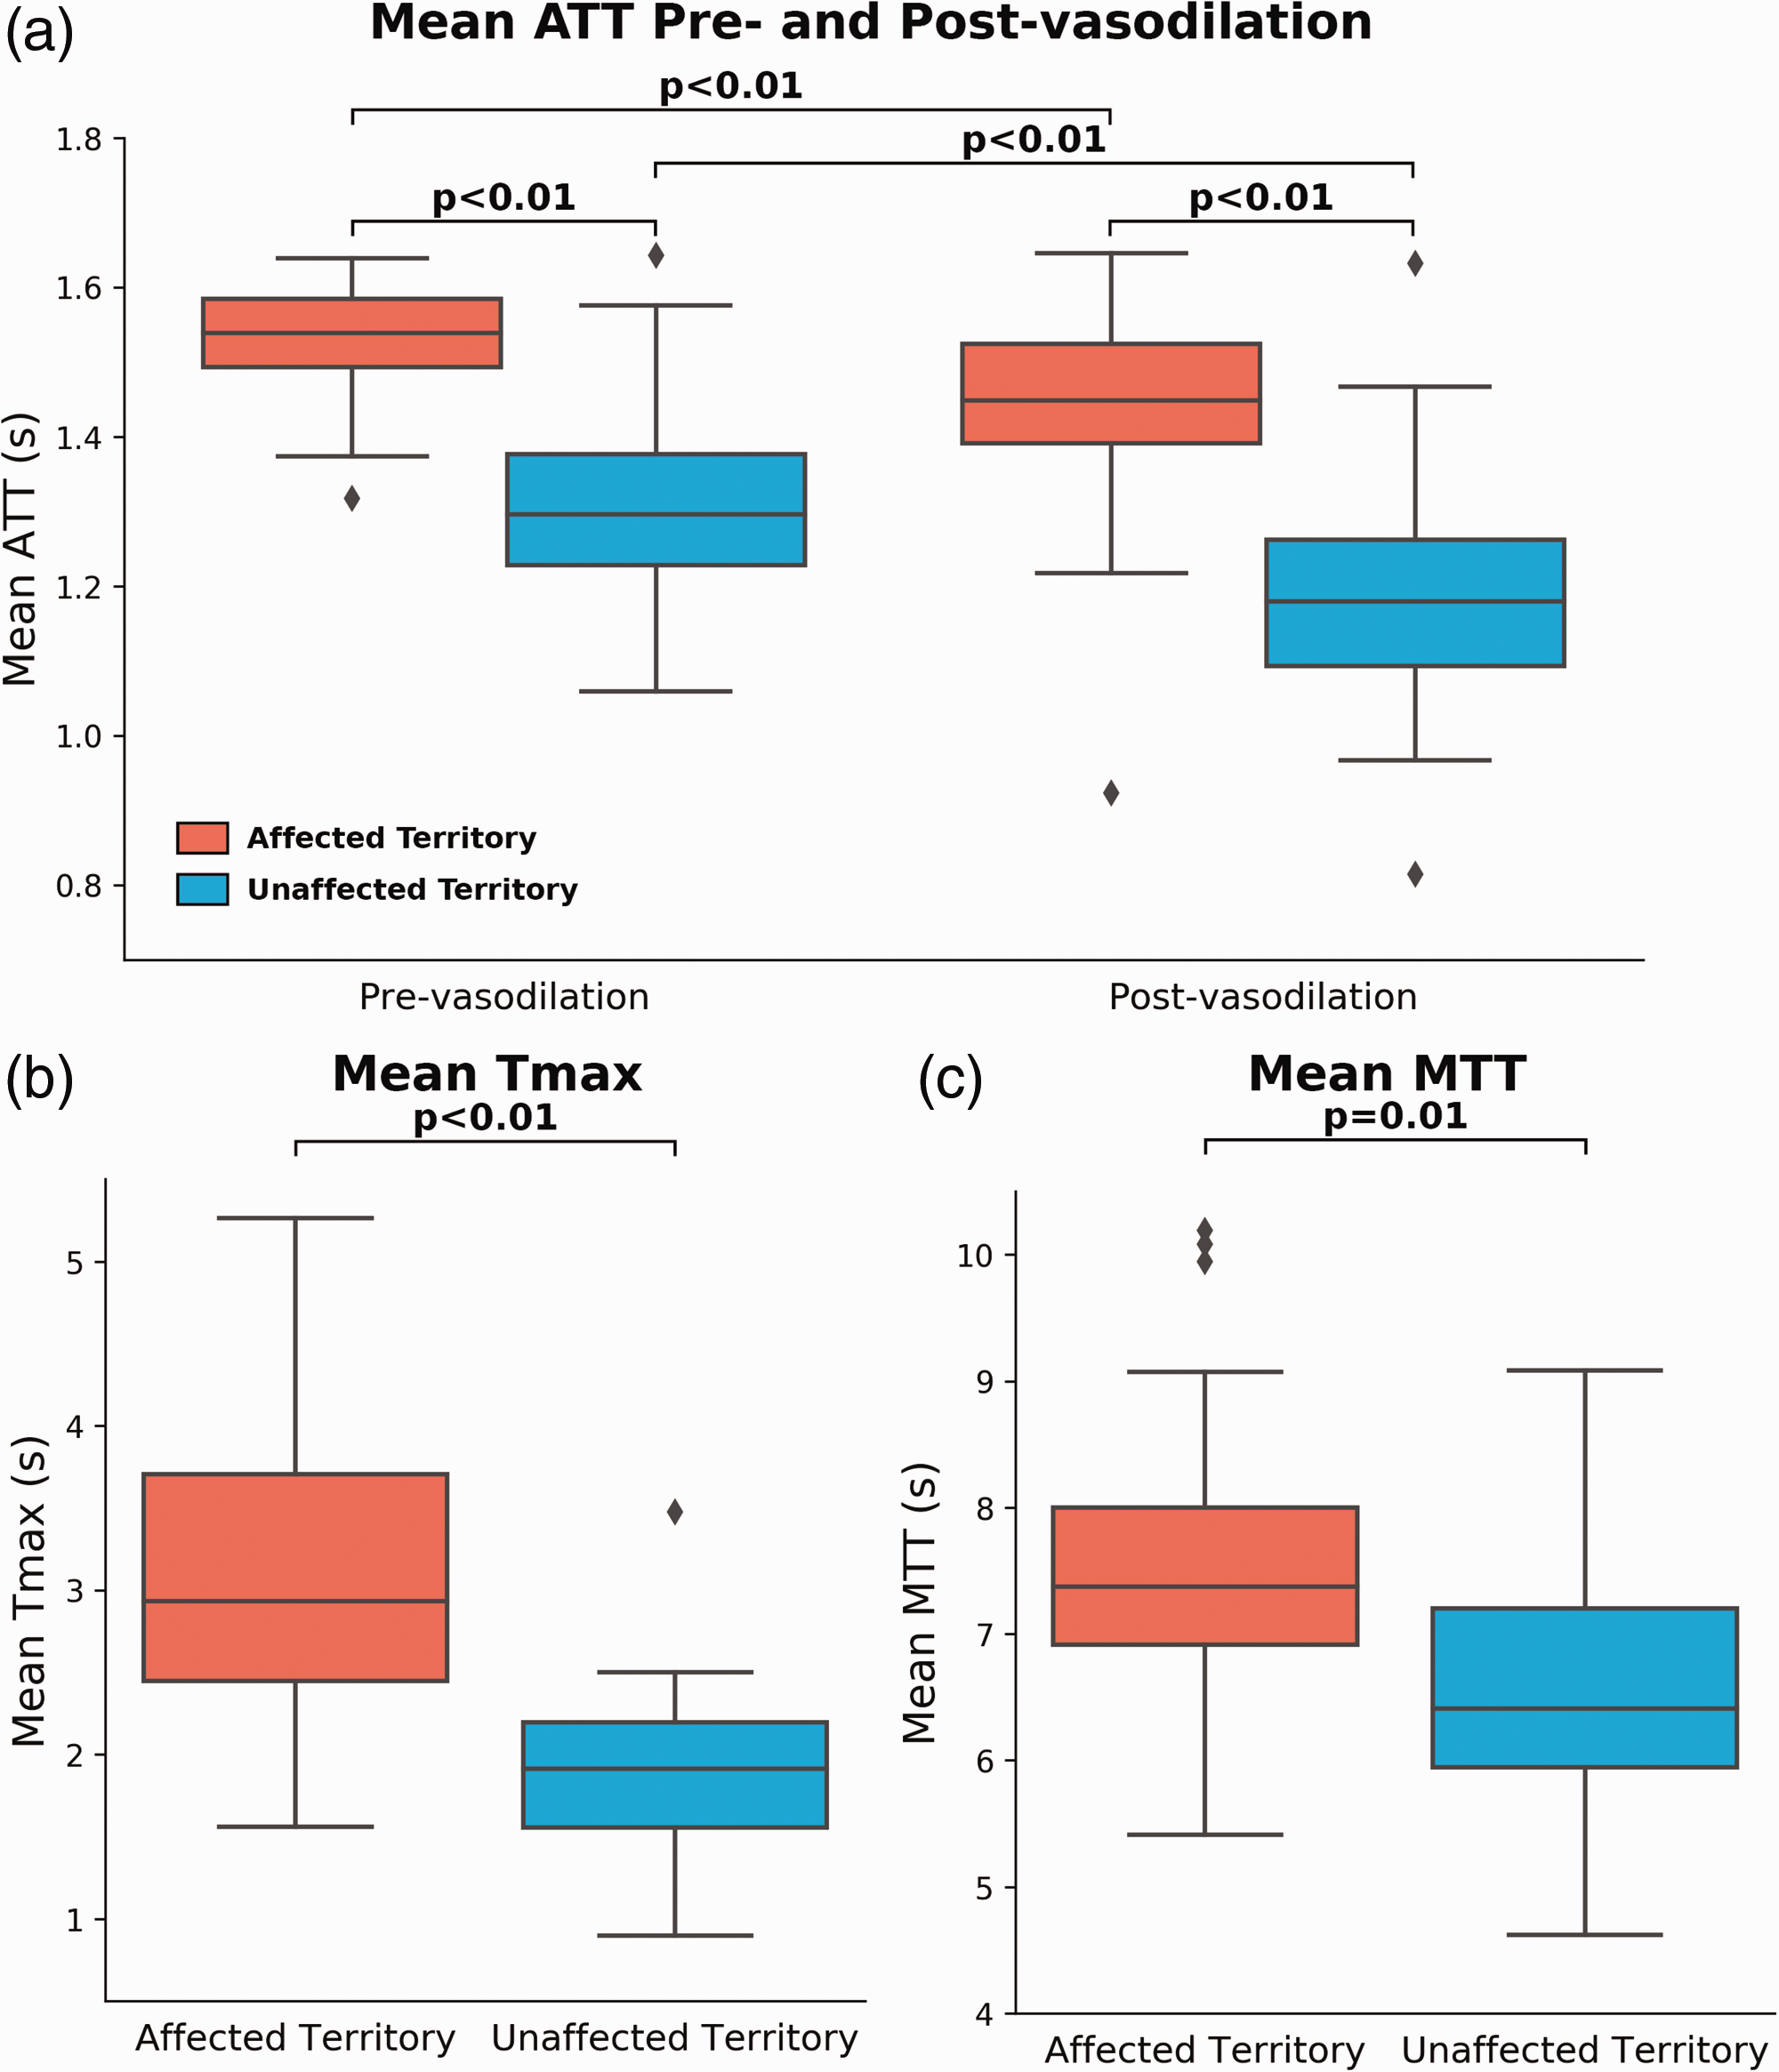
ATT measured by multi-PLD PCASL and Tmax and MTT measured by DSC MRI. (a) Mean ATT measured by multi-PLD PCASL. The mean ATT in both affected and unaffected territories decreased significantly after vasodilation, but the effect size in the normal territory was greater than in the diseased territory. (b) Mean Tmax of unaffected territory was significantly lower than the affected territory. (c) Mean MTT of unaffected territory was significantly lower than the affected territory. Each box plot indicates, from top to bottom, the maximum, 75th, 50th, 25th percentiles, and minimum without considering outliers, and the outliers are represented by diamonds. Each box plot indicates, from top to bottom, the maximum, 75th, 50th, 25th percentiles, and minimum without considering outliers, and the outliers are represented by diamonds.
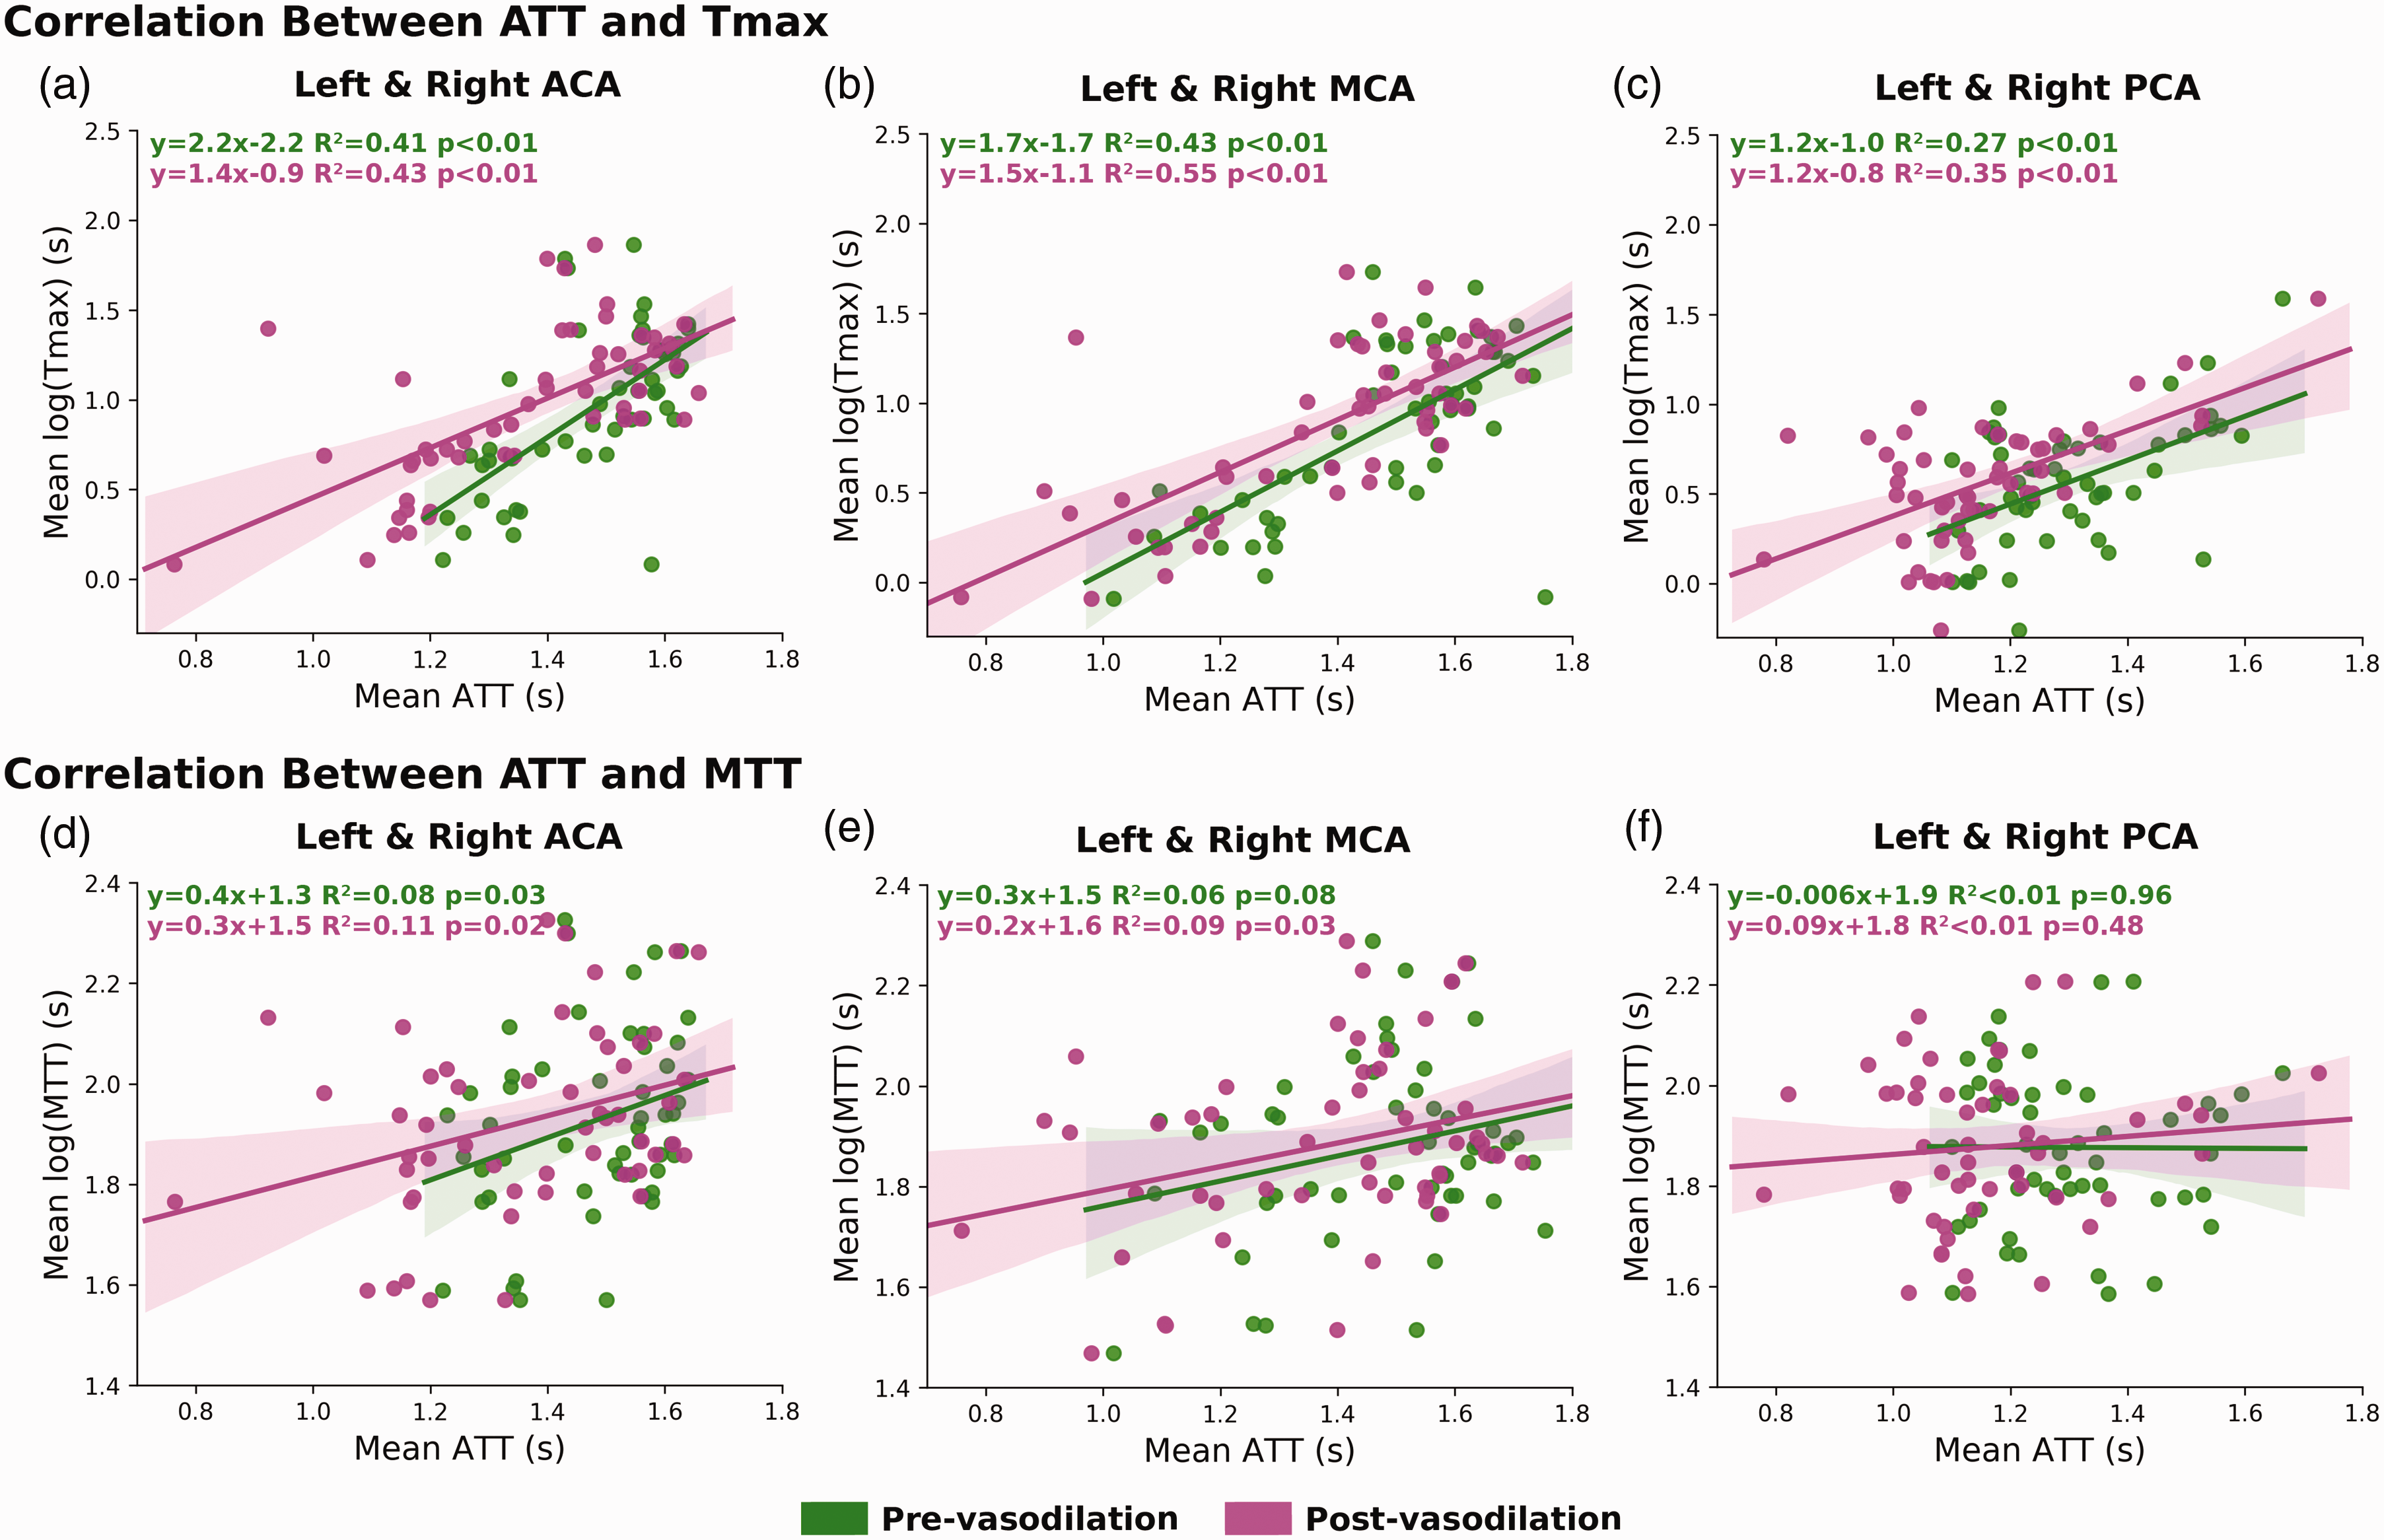
Correlation between mean ATT (ASL) and Tmax (subplots a, b, c) and between mean ATT (ASL) and MTT (subplots d, e, f) before and after vasodilation in affected and unaffected territories. In all flow territories, the correlation between ATT and Tmax was stronger than between ATT and MTT. The impact of vasodilation had a subtle impact on the correlation between ATT and Tmax. ASL scans were performed before and after vasodilation while DSC MRI was performed only after vasodilation.
Discussion
In this study regarding Moyamoya disease patients, we investigated CVR measurements using simultaneous 15O-water PET and ASL MRI and compared different transit time metrics derived by ASL and DSC MRI. Using PET as the reference technique, we compared the CVR results measured by both single- and multi-PLD ASL techniques in affected and unaffected territories. The value of ATT derived from multi-PLD ASL in characterizing Moyamoya disease was examined using its correlation with Tmax of DSC. The primary findings of our study were: (1) vasodilation induced significantly lower CVR in regions affected by occlusion than normal regions; (2) multi-PLD PCASL achieved a slightly better agreement with PET than single-PLD PCASL in both normal and affected territories and can characterize both perfusion (CBF and CVR) and circulation (transit time) at the same time; (3) ATT demonstrated a strong and positive correlation with Tmax before and after vasodilation.
CBF and CVR quantification
In comparing the CVR results measuring by ASL and PET, multi-PLD ASL demonstrated the highest agreement with the reference PET technique based on higher concordance correlation coefficients suggesting the advantage of accounting for transit time variations in multi-PLD ASL over single-PLD ASL. In the unaffected territories, our data indicated that single-PLD PCASL underestimated CVR by 8.7%, and multi-PLD PCASL slightly overestimated CVR by 3.9%. These results were consistent with our previous study on normal subjects where multi-PLD PCASL demonstrated higher agreement with PET. 16 In the territories affected by occlusion, single-PLD PCASL achieved a lower bias than multi-PLD PCASL. However, the concordance correlation coefficients showed a nearly identical relationship with the reference PET technique for both single- and multi-PLD PCASL. The reason was that multi-PLD PCASL had higher between-subject variations in CBF and CVR measurements, which have been demonstrated by several studies on normal subjects and patients.13,30,38 For example, previous work that applied a slightly different multi-PLD PCASL sequence (5 PLDs) on Moyamoya patients, the range of CVR was 24 ± 52% in the affected regions and 45 ± 45% in normal regions.13,38 Here, we extended the analysis to compare with the standard single-PLD PCASL and gold standard 15O-water PET. Specifically, our data showed that both ASL techniques were able to detect the significant CVR difference between affected and unaffected territories. However, since single-PLD ASL does not account for the significant ATT reduction induced by vasodilation, it underestimated CVR and ΔCBF by 8%. In contrast to several previous studies that examined relative CBF of different flow territories of Moyamoya disease patients,39–41 our work used absolute CBF (in ml/100g/min) obtained by ASL and PET for direct comparisons between regions and between modalities. The CBF and CVR of white matter should be interpreted with care. Since ATT of the labeled blood in white matter is longer and the T1 relaxation of white matter is different from gray matter, it is challenging to determine the CBF measured by the ASL signal in the white matter, which inevitably contained a higher level of noise than in the gray matter. Although partial volume correction may be considered to separate the signal from gray and white matter, it relies on the precise segmentation of brain tissues.42,43 The strength of using absolute CBF over relative CBF includes: (1) enabling physiological interpretation of the underlying hemodynamics in different flow territories; (2) reducing the errors and bias of comparison due to selecting a reference region (such as the cerebellum) to compute relative CBF; (3) allowing longitudinal assessments of CBF and CVR changes.
Since the aim of the paper was to compare the CVR of single- and multi-PLD PCASL using PET as the reference, the Bland-Altman plots reflects the distribution of the measurements. We understand that in many clinical scenarios CVR is measured by a single technique due to the limited scanning time and the availability of the imaging modality. Rather than recommending the best CVR modality, our work elucidated the different CVR values of PET and ASL obtained using a simultaneous PET/MRI system. Our data also reflected similar findings from other studies. For example, one paper showed that the correlation between PET and ASL increased after vasodilation in normal subjects. 44 Studies on patients with Moyamoya and ICA occlusion revealed that the single-PLD PCASL had lower correlation of relative CBF with PET than multi-PLD PCASL while relative CBF obtained using a long labeling duration (3 seconds) and long post-labeling delay (4 seconds) method had the highest correlation with PET. 12
In demonstrating the vascular impairment of Moyamoya disease patients, we directly compared the hemodynamic parameters (CVR, ATT, and Tmax) between the occluded and normal territories. In general, our data showed that the parameters in the occluded territory were significantly different from the values in the normal territory. The advantage of our experimental design over comparing with a healthy cohort includes avoiding the confounding effects of age and sex on the hemodynamic parameters, in particular, due to the broad age range in our cohort. For example, age and sex are both significant factors for CBF variations within normal subjects, and the effect size can be as high as 15% between male and female individuals aged between 30 and 40 years. 23 Although studies have found a negative relationship between age and CVR measured by BOLD MRI,45–47 the impact of various demographic factors on CVR measured by ASL or PET has not been thoroughly investigated and the normal range of CVR is yet to be defined. Additionally, several neuroimaging studies revealed that the impact of disease duration on diagnostic markers may be a more dominant factor than age.48–50 However, due to rank deficiency in most statistical models, where older patients often have a longer disease duration, it has been challenging to separate the effect of disease duration from age. 51 Based on these considerations, we employed a direct approach to compare the parameters between diseased and non-diseased territories rather than comparing with an age- and sex-matched control cohort.
In our study, the PET CBF and CVR were measured using an image derive arterial input function. 25 Although this technique eliminated the need for arterial blood sampling, it is susceptible to segmentation errors during the quantification of arterial blood volume in internal carotid arteries, which may reduce the reproducibility of PET CBF and CVR measurements. As a result, CCC may also be affected by the uncertainty in PET CBF. Another factor affecting both PET and MRI is partial volume effects due to the slightly different image resolution of the PET and ASL data. Although they can be corrected to separate gray and white matter CBF, there is currently no consensus about the most effective partial volume correction, which has remained an open question in the community and exceeded the scope of this work. Selecting the optimal PLD can be challenging without a priori knowledge of the underlying pathophysiology, especially in tissues with heterogeneous transit times. The PLD (2025 ms) of single-PLD PCASL was chosen to minimize the impact of prolonged transit time due to vasculopathy, making the resulting CBF/CVR less sensitive to transit time variations pre- and post-vasodilation. On the other hand, the choice for the PLDs of the multi-PLD PCASL should achieve a balance between measuring both CBF and ATT accurately. While having a long PLD can improve the accuracy of CBF/CVR measurements, the accuracy of ATT may be affected. 52 Since PET imaging cannot measure transit time, the validation of ATT measurements became challenging. Consequently, we compare the ATT of ASL with Tmax of DSC PWI, which has been widely used in characterizing flow in stroke imaging. The results showed a strong and positive correlation between these two parameters, which demonstrated the clinical value of ATT to characterize blood circulation and vasculopathy.
Throughout this study, 15O-water PET was chosen as the reference modality because it has established quantitative models that allow monitoring of absolute CBF changes. PET scans are not vulnerable to artifacts due to transit delays. The various ASL techniques, on the other hand, were developed later than PET. The simultaneous PET/MRI system used in this work allowed us to acquire both PET and ASL data at the same time to perform direct comparison of CBF and CVR. Both quantitative and qualitative comparisons between PET and ASL can be found in Table S2 of Supplementary Materials. From the CVR results measured by PET and ASL, we can conclude that using 15O-water PET as the reference, multi-PLD PCASL should be the preferred technique for ASL-based CVR measurements of patients with vasculopathy due to its higher agreement with PET, based on concordance correlation coefficients.
ATT and Tmax analysis
The metric of Tmax measured by DSC MRI has been applied to characterize the severity of vasculopathy in Moyamoya disease, with a longer Tmax indicating a more severe condition of stenosis or occlusion22,53 Although there is no consensus on the exact Tmax threshold to classify the severity of vasculopathy, commonly used values include less than 3 seconds for normal circulation and longer than 3 sec for stenosis or occlusion. 12 The Tmax data measured in our study were consistent with such a scale as shown in Figure 5(b). MTT has also been used to characterize circulation in stroke imaging. In this cohort, although both Tmax and MTT can be used to differentiate the transit time between normal and occluded brain regions, the effect size of Tmax was higher than MTT. The findings confirmed a previous study (Wang, et al, Stroke, 2012) that compared ASL and DSC in acute stroke patients that prolonged Tmax and MTT were observed in hypoperfusion regions. 54 The disadvantages of using Tmax or MTT include the side effects of the gadolinium contrast agent and discomfort during the injection of gadolinium in DSC MRI scans. Although DSC MRI has been applied as a routine procedure in Moyamoya disease and stroke imaging protocols, it has been widely recognized that the use of contrast agents, such as gadolinium, should be minimized to avoid side effects and the deposition of contrast agents in the body.55,56 Additionally, computing Tmax involves the deconvolution of the tissue kinetic signal, 57 and the pathophysiological meaning of Tmax is unclear due to the dispersion effect of the contrast agent and the high sensitivity to noise in the analytical solution to deconvolution. 19
By contrast, ASL enables the contrast-free measurement of ATT, which is defined as the time for the labeled blood water to travel from the labeling to the imaging region. Using the same experimental design, we demonstrated that the current implementation of multi-PLD ASL was effective in measuring the ATT of normal subjects before and after vasodilation. 16 The mean ATT in the normal territory of the patients in this study was between 0.9 and 1.6 s, which was within the range of the normal subjects reported in several other papers on normal subjects.12,16,30,58 For instance, in our previous work that applied multi-PLD PCASL with 5 PLDs, the reported range of ATT was between 0.72 and 1.78 s in the normal region and between 0.85 and 1.96 in the affected region. 13 Due to blockage of blood flow, the pre-vasodilation ATT in vessel occlusion regions was significantly higher than in the normal territory (Figure 5(a)). After vasodilation, we observed a smaller ATT decrease in the affected regions than the normal regions, implying a lower capacity of upstream arteries to vasodilate.
One of the fundamental differences between ASL and DSC MRI is the type of tracer involved in the imaging procedure. In ASL, labeled blood water was used as the endogenous and diffusible tracer that can escape from intravascular space to tissue. On the other hand, DSC uses gadolinium-based contrast agents as non-diffusible tracers that pass directly from arteries to veins without residing in the tissue space. 59 The different properties of the tracers influenced the data acquisition techniques used in ASL and DSC MRI. Since non-diffusible tracers can only exist in tissues for a much shorter period of time than diffusible tracers, faster imaging techniques, such as EPI, must be applied to capture the hemodynamic of the tracer. The use of such fast-imaging techniques not only introduces susceptibility artifacts near paranasal sinuses and base of the skull but also strong partial volume effects, both of which affect image quality and the interpretation of the underlying pathophysiology . By contrast, since diffusible tracers can exist in tissues for a longer period, there are more data acquisition choices available, such as the 3D Spiral technique used in the ASL sequences of this study, making the acquisition less susceptible to artifacts and enhancing the quality of the resulting CBF and ATT images.
In evaluating the relationship between ATT and Tmax, a strong and positive correlation was found in all flow territories. Specifically, the correlation after vasodilation was higher than before vasodilation because DSC MRI data were acquired only after vasodilation. Our ATT and Tmax results also complemented a previous study that demonstrated a high correlation in the relative CBF between ASL and DSC in children with Moyamoya disease. 60 These data suggested that multi-PLD ASL can replace DSC MRI to measure both transit time, CBF, and CVR, enabling a contrast-free assessment of patients with a higher risk of acute stroke (such as those with Moyamoya disease). Applying our correlation results in Figure 6 and the previously used Tmax thresholds (normal: less than 3 seconds; stenosis: longer than 3 seconds in literature12,38) for classifying vasculopathy, the corresponding ATT (pre-vasodilation) thresholds would be: 1.50 sec in ACA, 1.64 sec in MCA, and 1.75 sec in PCA.
There is a growing interest in the clinical value of ATT. Similar with Tmax derived using DSC MRI, ATT can reflect the condition of blood circulation of the macrovasculature of arteries and arterioles.61,62 In contrast to Tmax, which is measured using the non-diffusible tracer of Gd, ATT is measured as the time for the labeled blood to be fully perfused in brain tissues, making it a potential biomarker for the underlying tissue health of cerebrovascular diseases and neurodegeneration. 63 Although we were limited to compare ATT and Tmax after vasodilation, we found them to be highly correlated, which demonstrated the notion that ATT can be applied for assessing circulation. In comparing the hemodynamics between affected and unaffected brain territories of Moyamoya patients, we showed the effect of vasculopathy on delaying ATT. Future studies may be desired to explore the clinical value of ATT in different neurological disorders.
From the transit time results, we can conclude that ATT measured by the contrast-free multi-PLD PCASL can replace DSC MRI to characterize Moyamoya disease and in stroke imaging protocols based on its strong correlation with Tmax.
Limitations
There are several limitations to this study. The sample size of this study was limited by the relatively low prevalence of Moyamoya disease (lower than 0.1 per 100,000 people in North America), which might affect the generalization of applying ASL to examine vasculopathy. Another limitation is the reliance on a single scanner vendor, which prohibits generalizing our conclusion for studies using other scanners with different implementations of ASL and PET. A multi-center study using scanners of multiple vendors may be helpful to overcome this issue. Additionally, Tmax was measured after vasodilation due to the requirement of the scanning protocol to administer gadolinium-contrast in the final MRI sequence. Evaluating the correlation between ATT and Tmax at baseline is desired in future work to enable ASL to replace DSC MRI to measure transit time information to identify the risk of cerebrovascular diseases.
Conclusions
In this work, we have investigated the CVR induced by acetazolamide in Moyamoya disease patients using a simultaneous PET/MRI system. The CVR results showed that multi-PLD PCASL achieved the best agreement with the reference 15 O-water PET method in both diseased and normal vascular territories. Additionally, ATT measured by multi-PLD PCASL demonstrated a strong correlation with DSC-based Tmax before and after vasodilation. Therefore, we conclude that multi-PLD PCASL may be appropriate for CVR measurements and a valuable non-invasive and contrast-free imaging modality for patients with Moyamoya disease.
Supplemental Material
sj-pdf-1-jcb-10.1177_0271678X221083471 - Supplemental material for Using arterial spin labeling to measure cerebrovascular reactivity in Moyamoya disease: Insights from simultaneous PET/MRI
Supplemental material, sj-pdf-1-jcb-10.1177_0271678X221083471 for Using arterial spin labeling to measure cerebrovascular reactivity in Moyamoya disease: Insights from simultaneous PET/MRI by Moss Y Zhao, Audrey P Fan, David Yen-Ting Chen, Yosuke Ishii, Mohammad Mehdi Khalighi, Michael Moseley, Gary K Steinberg and Greg Zaharchuk in Journal of Cerebral Blood Flow & Metabolism
Footnotes
Funding
The author(s) declared the following potential conflicts of interest with respect to the research, authorship, and/or publication of this article: This work is supported by the American Heart Association (Grant: 826254) and National Institutes of Health (Grants: R01EB025220-02, 4R00NS102884-03, and 1K99-AG068310-01A1).
Acknowledgements
We thank Drs. Jarrett Rosenberg and Tie Liang for insightful discussion regarding statistical methods, Ms. Kim Halbert and Dawn Holley for data collection, Drs. Bin Shen and Jun Hyung Park for technical supports, Ms. Teresa Bell-Stephens, Lorraine Reilly, Brittney Williams and Julia Durski for project administration.
Declaration of conflicting interests
The author(s) declared the following potential conflicts of interest with respect to the research, authorship, and/or publication of this article: Dr Zaharchuk received funding support through GE Healthcare and Bayer Healthcare and equity from Subtle Medical. Dr. Steinberg is a consultant for Peter Lazic US, NeuroSave, SanBio, Zeiss, and Surgical Theater.
Authors’ contributions
Moss Y Zhao: Methodology, Formal analysis, Investigation, Writing, Funding acquisition
Audrey P Fan: Investigation, Data curation, Funding acquisition
David Yen-Ting Chen: Investigation, Data curation
Yosuke Ishii: Investigation, Data curation
Mohammad Mehdi Khalighi: Resources
Michael Moseley: Supervision, Funding acquisition
Gary K Steinberg: Supervision
Greg Zaharchuk: Conceptualization, Supervision, Funding acquisition
Supplemental material
Supplemental material for this article is available online.
References
Supplementary Material
Please find the following supplemental material available below.
For Open Access articles published under a Creative Commons License, all supplemental material carries the same license as the article it is associated with.
For non-Open Access articles published, all supplemental material carries a non-exclusive license, and permission requests for re-use of supplemental material or any part of supplemental material shall be sent directly to the copyright owner as specified in the copyright notice associated with the article.