
Abstract
The prevalence of diabetes is greater in older, low-income, urban South African populations. Exploring the potential of mobile applications to aid in this challenge, the research focuses on 514 diabetic patients in Cape Town, applying the Theory of Planned Behaviour. Utilizing Partial Least Squares Structural Equation Modelling, the study identifies age-specific variations in factors influencing mobile app use. While overall predictability of intention to use mobile health apps for exercise is moderate (R2 = 11.6%), specific relationships differ across age groups. Notably, relationships involving Social Norm, Intention, and Perceived Behavioural Control show insignificance in certain age brackets. Although the study retains significance for the oldest age group at a 95% confidence interval, compared to the original 99%, the overall model exhibits low predictive power. The findings underscore the necessity for designers to tailor mobile applications to diverse age requirements. This research contributes to theoretical understanding by highlighting age-related nuances in the Theory of Planned Behaviour, offering practical insights for intervention design and public health policies to enhance diabetes management among various age groups in South Africa.
Keywords
Introduction
Non-communicable diseases (NCDs) are driven by a complex interplay of multiple risk factors. Successful treatment of diabetes includes patient self-management behaviours to prevent or delay complications and comorbid diseases (Pheiffer et al., 2021). The findings from clinical trials (Hilmarsdóttir et al., 2020) and professional guidelines prescribe daily regimens of glucose testing, healthy eating and physical activity (Feldman et al., 2023). However, the consistent, long-term commitment to regimens is challenging.
Physical activity is defined as “any bodily movement produced by skeletal muscles that results in energy expenditure” (Helbostad et al., 2017). Physical inactivity is a critical risk factor for global morbidity (Cunningham et al., 2020) and non-insulin-dependent diabetes mellitus (American Diabetes Association, 2019). COVID-19 is also negatively affecting the level of physical activity due to movement restrictions during the lockdown and social distancing (Cunningham et al., 2020). It is recommended that patients with diabetes reduce their daily sedentary behaviour (Sun et al., 2022). Therefore, increasing physical activity by 150 min of moderate-intensity physical activity per week (World Health Organization, 2018).
Disparities in the accessibility and availability of the Internet have been reduced due to technological advances (Tennant et al., 2015). The lowering of barriers such as less expensive devices and mobile technologies are no longer limited to specific demographics as it is made increasingly affordable to all (ICASA, 2023).
Based on research by (Öcal, 2023), a mobile health intervention would need to bring about explicit behavioural changes for patients with diabetes to better manage their condition. In Low and Middle-Income Countries (LMIC) the reduction of glycated haemoglobin (HbA1c) is supported by ten studies determining that 83.3% of mobile applications were effective in promoting better diabetes self-management (Mokaya et al., 2022). Therefore, diabetes self-care behaviour, such as exercise, can be supported using mobile applications. Mobile applications are defined as “software applications designed to run on a Smartphone or tablet device and provide a convenient means for the user to perform certain tasks” (Angosto et al., 2020).
Mobile applications are increasingly being used to assist patients with lifestyle changes and self-management behaviours between provider visits (Yoon et al., 2022). Mobile applications have a variety of functions to promote physical activity (Hamidi et al., 2022). The functions include tracking of physical activities such as step count tracking, goal setting and prompts related to goal progress (Yerrakalva et al., 2019). Mobile applications can also allow the syncing of wearable devices such as fitness watches or external pedometers (Pelletier et al., 2023; Yerrakalva et al., 2019). However, it is noted that there are usability challenges for the use of mobile applications for diabetes applications (Kamaldeep et al., 2021). Usability challenges by the elderly include items such as small screens and fonts for diabetic patients with poor eyesight (Isaković et al., 2016).
People older than 65, the prominent age for patients with non-insulin-dependent (Type 2) diabetes (American Diabetes Association, 2019) are more likely to be affected by a digital divide called the grey divide (Choi et al., 2020). The literature indicates that there are differences in usage rates, usage intensity, and the commonly used mobile phone functions between older and younger age groups (Seifert et al., 2017). Likely, people and elderly people more specifically, who do not have access to smartphones or the economic means to purchase data will naturally be less likely to use mobile applications for health-related purposes. This suggests that people of low socioeconomic status, particularly the elderly, likely lack the capabilities and resources necessary to achieve optimal health functioning.
Context
In South Africa, the prevalence of diabetes is greater in older, low-income urban populations (Health Systems Trust, 2004). A low income and a heavy population constitute a challenge to the achievement of Sustainable Development Goal 3, “ensuring healthy lives and promote well-being for all at all ages” (Transforming Our World: The 2030 Agenda for Sustainable Development, 2015). The focus on health is also evident in the South African National Development Plan (NDP) 2030. The NDP recognises that social and economic factors contribute to illness and is, therefore, an essential consideration for managing the health of the South African nation (National Planning Commission, 2012).
This research focused on the City of Cape Town, Western Cape, South Africa due to the high diabetes prevalence (Kengne and Sayed, 2017). The glycated haemoglobin (HbA1c) test is used to obtain the average plasma glucose over the previous eight to twelve weeks (World Health Organisation, 2011). Additionally, it is reported that 75.5% of the sample in the Western Cape had HbA1c over 7% (Razak and Isaacs, 2017). In 2016/2017 another study at the Mitchells Plain Community Health Centre reported 80.6% of the 324 patients with an HbA1c value above the increased target of 7% (Khalied, 2017). Patients in the Cape Metropolitan district, Western Cape, South Africa expressed dissatisfaction with the following aspects of their experience: the waiting time to secure clinic appointments, the ability to see a healthcare professional on the same day, and the clarity of instructions provided for managing their diabetes (Booysen and Schlemmer, 2015). Therefore, there is an increasing health burden.
Despite the burgeoning numbers of people having access to the Internet as a result of more affordable phone options, people are not using the Internet as they consider data expensive (Gillwald et al., 2017). Therefore, despite the increased availability of m-health applications, the use and continued use remain low, especially in low-income patients (Nelson et al., 2016) and older patients in the Western Cape (Petersen et al., 2019). The increasing prevalence of diabetes among older, low-income, urban populations in South Africa necessitates a nuanced understanding of factors influencing the use of mobile applications for physical activity among diabetic patients. Our study focuses on age-specific variations in these factors, addressing a critical research gap in the existing literature. While numerous studies have explored mobile app use in diabetes management, few have delved into age-related distinctions, hindering our comprehension of tailored interventions. Our research aims to bridge this gap by examining the impact of age on the Theory of Planned Behaviour components in the context of mobile app usage for exercise among South African diabetic patients.
The research question was: What is the use of mobile applications for physical activity for diabetic patients in the City of Cape Town? The research sub-question was: Is there a difference in the use of mobile applications among different age groups? Therefore, the objective of this paper is to add to the existing literature by examining the use of mobile applications for physical activity in this context as a lack of exercise is a key risk factor.
Research model
The four prominent technology acceptance and use models used in health (Sun et al., 2013). The Theory of Planned Behaviour (TPB) is derived from the Theory of Reasoned Action (TRA), the Technology Acceptance Model (TAM) and the Unified Theory of Technology Acceptance and Use of Technology (UTAUT) include the following constructs:
Theory of Reasoned Action (TRA) – Attitude towards behaviour refers to “an individual's positive or negative feelings about performing the target behaviour” (Fishbein and Ajzen, 1975). This construct is also found in TPB. It may be influenced by the Perceived Usefulness construct (“the degree to which a person believes that using a particular system would enhance his or her job performance”) in TAM (Davis, 1989). Additionally, it is influenced by the Effort Expectancy (“the degree to which an individual believes that using the system will help him or her to attain gains in job performance”) and Performance Expectancy construct in UTAUT (Venkatesh et al., 2003). Theory of Planned Behaviour (TPB) – TPB is derived from TRA with the addition of Perceived Behavioural Control (PBC). PBC refers to the “perceived ease or difficulty of performing the behaviour” (Fishbein and Ajzen, 1975). Subjective Norm refers to “the person's perception that most people who are important to them think that they should or should not perform the behaviour in question” (Fishbein and Ajzen, 1975). TPB takes into consideration the social systems and the roles of individual organisational members when used to predict and explain human behaviour such as health service utilisation, drinking, breastfeeding, smoking and substance use (Ajzen, 1991; LaMorte, 2018). Technology Acceptance Model (TAM) – The Technology Acceptance Model (TAM), based on the work by (Davis, 1989), is an adaption of TRA (Lee et al., 2003). It includes two key variables: perceived usefulness and perceived ease of use. Based on (Davis, 1989), Perceived usefulness (PU) refers to whether a person believes that using a particular system would enhance his or her health. Perceived ease of use (PEOU) refers to “the degree to which a person believes that using a particular system would be free of effort” (Davis, 1989). Perceived ease of use increases when the user believes that the system will save time and energy (Juhriyansyah, 2010). Intention to use is determined by both perceived usefulness and perceived ease of use, which ultimately impacts usage behaviour. PU is similar to the PBC construct in TPB. Unified Theory of Technology Acceptance and Use of Technology (UTAUT) – The PBC construct in TPB is similar to Effort Expectancy (EE) (“the degree of ease associated with the use of the system”) in UTAUT [18]. In this research, behaviour refers to using mobile health applications to promote physical activity. Social Influence is similar to the Subjective Norm construct in UTAUT (Venkatesh et al., 2003). Behavioural Intention is defined as “the person's subjective possibility that he or she will perform the behaviour in question” (Venkatesh et al., 2003). Facilitating Conditions is“ the degree to which an individual believes that an organizational and technical infrastructure exists to support the use of the system” (Venkatesh et al., 2003). EE is the same as PEOU in TAM and PBC in TPB.
Research design
This research used positivism which positions that knowledge is objective and measurable (Mingers, 2006). The research is based on the statement that “truth arises from a correspondence between a claim and empirically observed facts” (Avenier and Thomas, 2015). Therefore, the hypotheses (claims) were tested using quantitative data (empirically observed facts).
Data collection
Purposive sampling was used to collect a total of 541 responses from diabetic patients residing in the City of Cape Town. Field workers used an online survey to collect data. The survey used a 7-point Likert scale from strongly disagree to strongly agree. Questions were based on patients’ self-reporting of their use of mobile applications for exercise activities in the seven days before the collection of the data. The exercise activities questions were based on the summary of diabetes self-care as this survey was validated on 2000 participants (Toobert et al., 2000).
To mitigate sampling bias, we employed a stratified sampling approach to ensure representation across different age groups within the South African diabetic population. This method allowed us to capture diverse perspectives and enhance the generalizability of our findings.Using field workers allowed the selection from the target population to limit over- and under-representation of a particular group. It must be noted that patients with type 2 diabetes are generally older (Absetz et al., 2018). Respondents may have difficulty accurately recalling past experiences or behaviors. To mitigate recall bias, we framed questions in a way that encouraged reflection on recent experiences (the past 7 days) with diabetes mobile applications for physical activity, reducing reliance on distant memories. Respondents might exhibit social desirability bias by providing answers perceived as socially acceptable. To address this, social desirability bias, field workers assured respondents of the confidentiality of their responses, that could foster a more honest and accurate portrayal of their perceptions and behaviors.
After data collection, thorough data cleaning and validation procedures were employed to identify and address any anomalies or errors. The remaining 514 responses were analysed after responses with more than 15% missing values and those who responded the same to all questions (standard deviation = 1) (Gaskin, 2016) were removed.
Data analysis
The research model was tested using Partial Least Squares Structured Equation Modelling (PLS-SEM). PLS-SEM can assess construct validity by estimating the loadings (and weights) of indicators on variables (Lowry and Gaskin, 2014). PLS-SEM offers fewer choices for advanced modelling than covariance-based SEM (CB-SEM), such as latent growth modelling, mixture modelling, or second-order factor modelling (Hair et al., 2019). Researchers may find it challenging to assess how well the model fits the data, making model evaluation less straightforward. However, as this was not tested in this research it does not cause a significant limitation.
PLS-SEM also identifies causal relationships among variables. PLS-SEM assumes reflective measurement models, which may not be suitable for all types of research. This assumption may not align with situations where formative constructs are more appropriate. However, TPB is primarily a reflective model. According to its theoretical underpinnings, behavioral intention which emphasize the anticipated likelihood of use based on people's attitudes and beliefs determines actual technology use (Raffaghelli et al., 2022). Reflective measurement model assessments, such as internal consistency reliability, support the reflective nature of TPB.
PLS-SEM is a non-parametric method, meaning that data does not need to be normally distributed. Given the high levels of inequality in South Africa, using a non-parametric method is preferable. Additionally, PLS-SEM was used by (Venkatesh et al., 2003) to test the UTAUT model. Therefore, PLS-SEM was found suitable to test these hypotheses using Smart PLS 3 software (Ringle et al., 2015).
The online survey data were converted into a Microsoft Excel comma-separated values (CSV) file and then analysed using SmartPLS software (Ringle et al., 2015).
The construct reliability and validity of the data were assessed first (Table 1). The values for Cronbach alpha were used to assess the measure of internal consistency (Gliem and Gliem, 2003) for the survey questions. A value of 0.6 is an accepted benchmark (Kline, 2013). Therefore, the internal consistency of all five constructs meets the level of acceptance.
Construct reliability and validity.
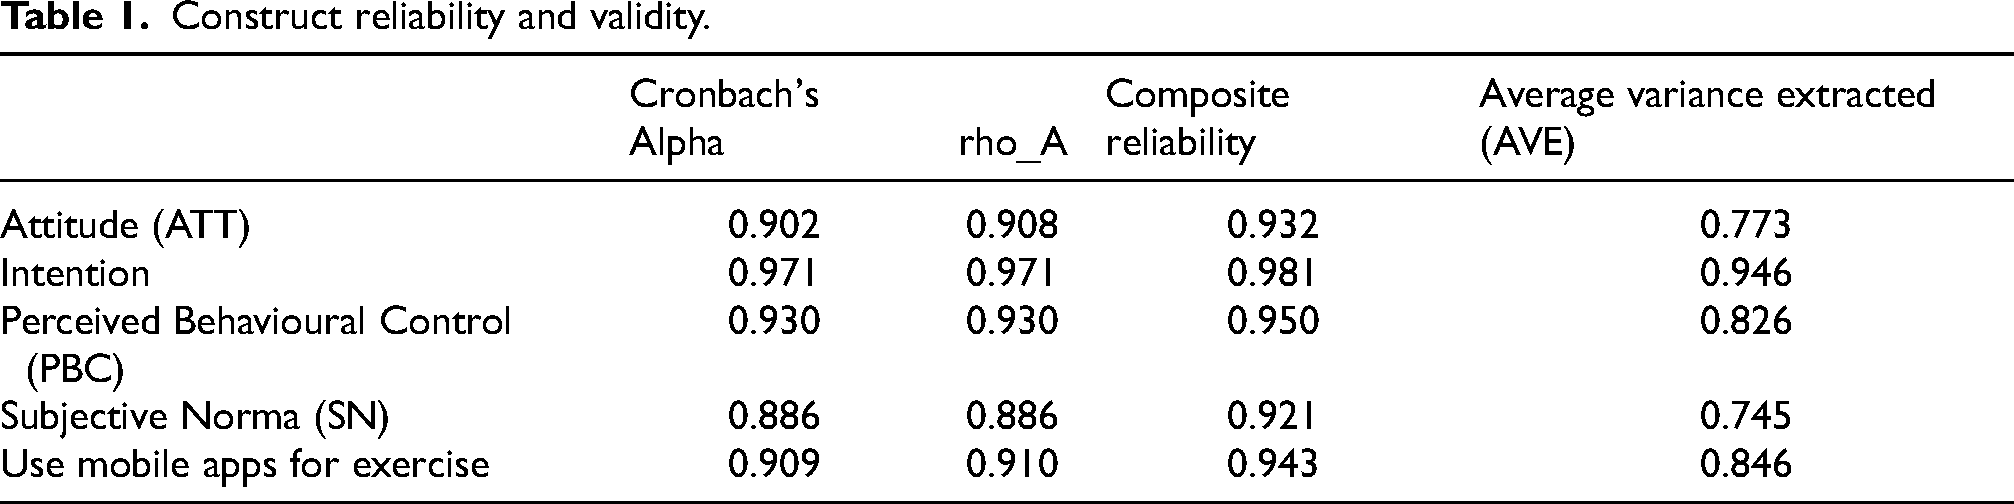
The average variance extracted (AVE) was used to test convergent and divergent validity. AVE reflects “the average communality for each latent factor in a reflective model” (Garson, 2016). AVE values should exceed 0.5 which indicates that factors “explain at least half the variance of their respective indicators” (Garson, 2016).
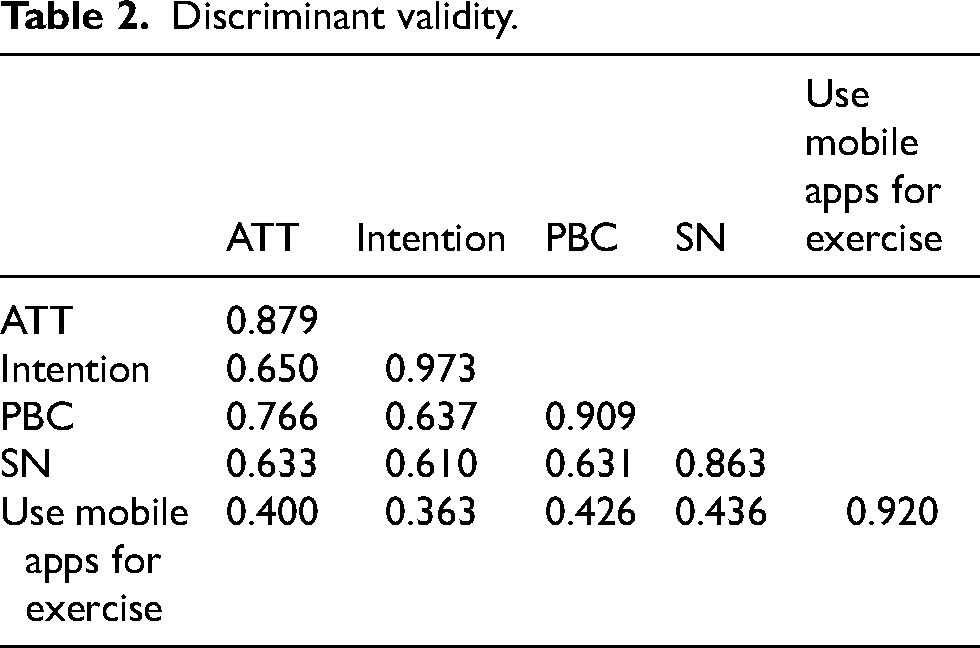
Based on Fornell and Larcker's criteria (Fornell and Larcker, 1981) discriminant validity can be determined by comparing the square root of the average variance extracted. In Table 2 the square root of the average variance is represented by diagonal values. According to (Lowry and Gaskin, 2014), the diagonal elements must be greater than the off-diagonal elements for the same row and column. The diagonal values in Table 2 are higher than any other correlation. Therefore, the criteria for discriminant validity were satisfied.
Discriminant validity.
A PLS-SEM path coefficients test was run to assess the strength and direction of the relationship between the variables as defined in the hypotheses (Huang et al., 2013). A positive influence is indicated by a positive path coefficient. Alternatively, a negative path coefficient presents a negative influence.
R2 provides a model of fit measure (Garson, 2016), that predicts which value of the dependent variables can be explained by the independent variables. The variance in the percentage is representative of the predictive power of the research model. The values range between 0 and 1: the larger the value, the better the explanatory power of the model (Diez, 2012).
The significance of the results, such as Cronbach's alpha, path coefficients and R2, are generated by a bootstrap procedure. According to (Sarstedt et al., 2017) (p.304), bootstrapping “is a resampling technique that draws a large number of subsamples from the original data (with replacement) and estimates models for each subsample. It is used to determine standard errors of coefficients to assess their statistical significance without relying on distributional assumptions”. The number of subsamples must be large to ensure the stability of results. Therefore, based on (Sarstedt et al., 2017), a bootstrap subsample of 5000 was used for the preparation of the final results.
Partial Least Squares Multi-group analysis (PLS-MGA) in the SmartPLS tool was used to calculate the differences in age groups. PLS-MGA is another non-parametric significance test that is not dependent on a normally distributed sample. PLS-MGA builds on the PLS-SEM bootstrapping results so that the differences in age groups can be compared to the entire sample (Sarstedt et al., 2011). It will also highlight any differences among age groups.
Ethical considerations
Ethical clearance was obtained from the Human and Social Sciences Research Ethics Committee at the University of the Western Cape. Observing the strictest levels of confidence during the data collection exercise was prioritised. All respondents had to provide consent to participate in the survey. No clinical data were collected. Questions were restricted to issues of acceptance and use, rather than respondents’ health circumstances.
Research model
TRA and TPB have been relatively successful predictors of health intentions and behaviour. In one case, it explained 32–44% of the variance in intentions and 15–41% of the variance in behaviour (Nisson and Earl, 2004). The use of ICTs for diabetes self-management in the Western Cape was examined using the UTAUT model. However, it is not successful in predicting the usage (Petersen et al., 2018). Therefore, to contribute to the literature, TPB as seen in Figure 1 was used for this research to test the adoption of mobile applications for diabetics in the Western Cape.
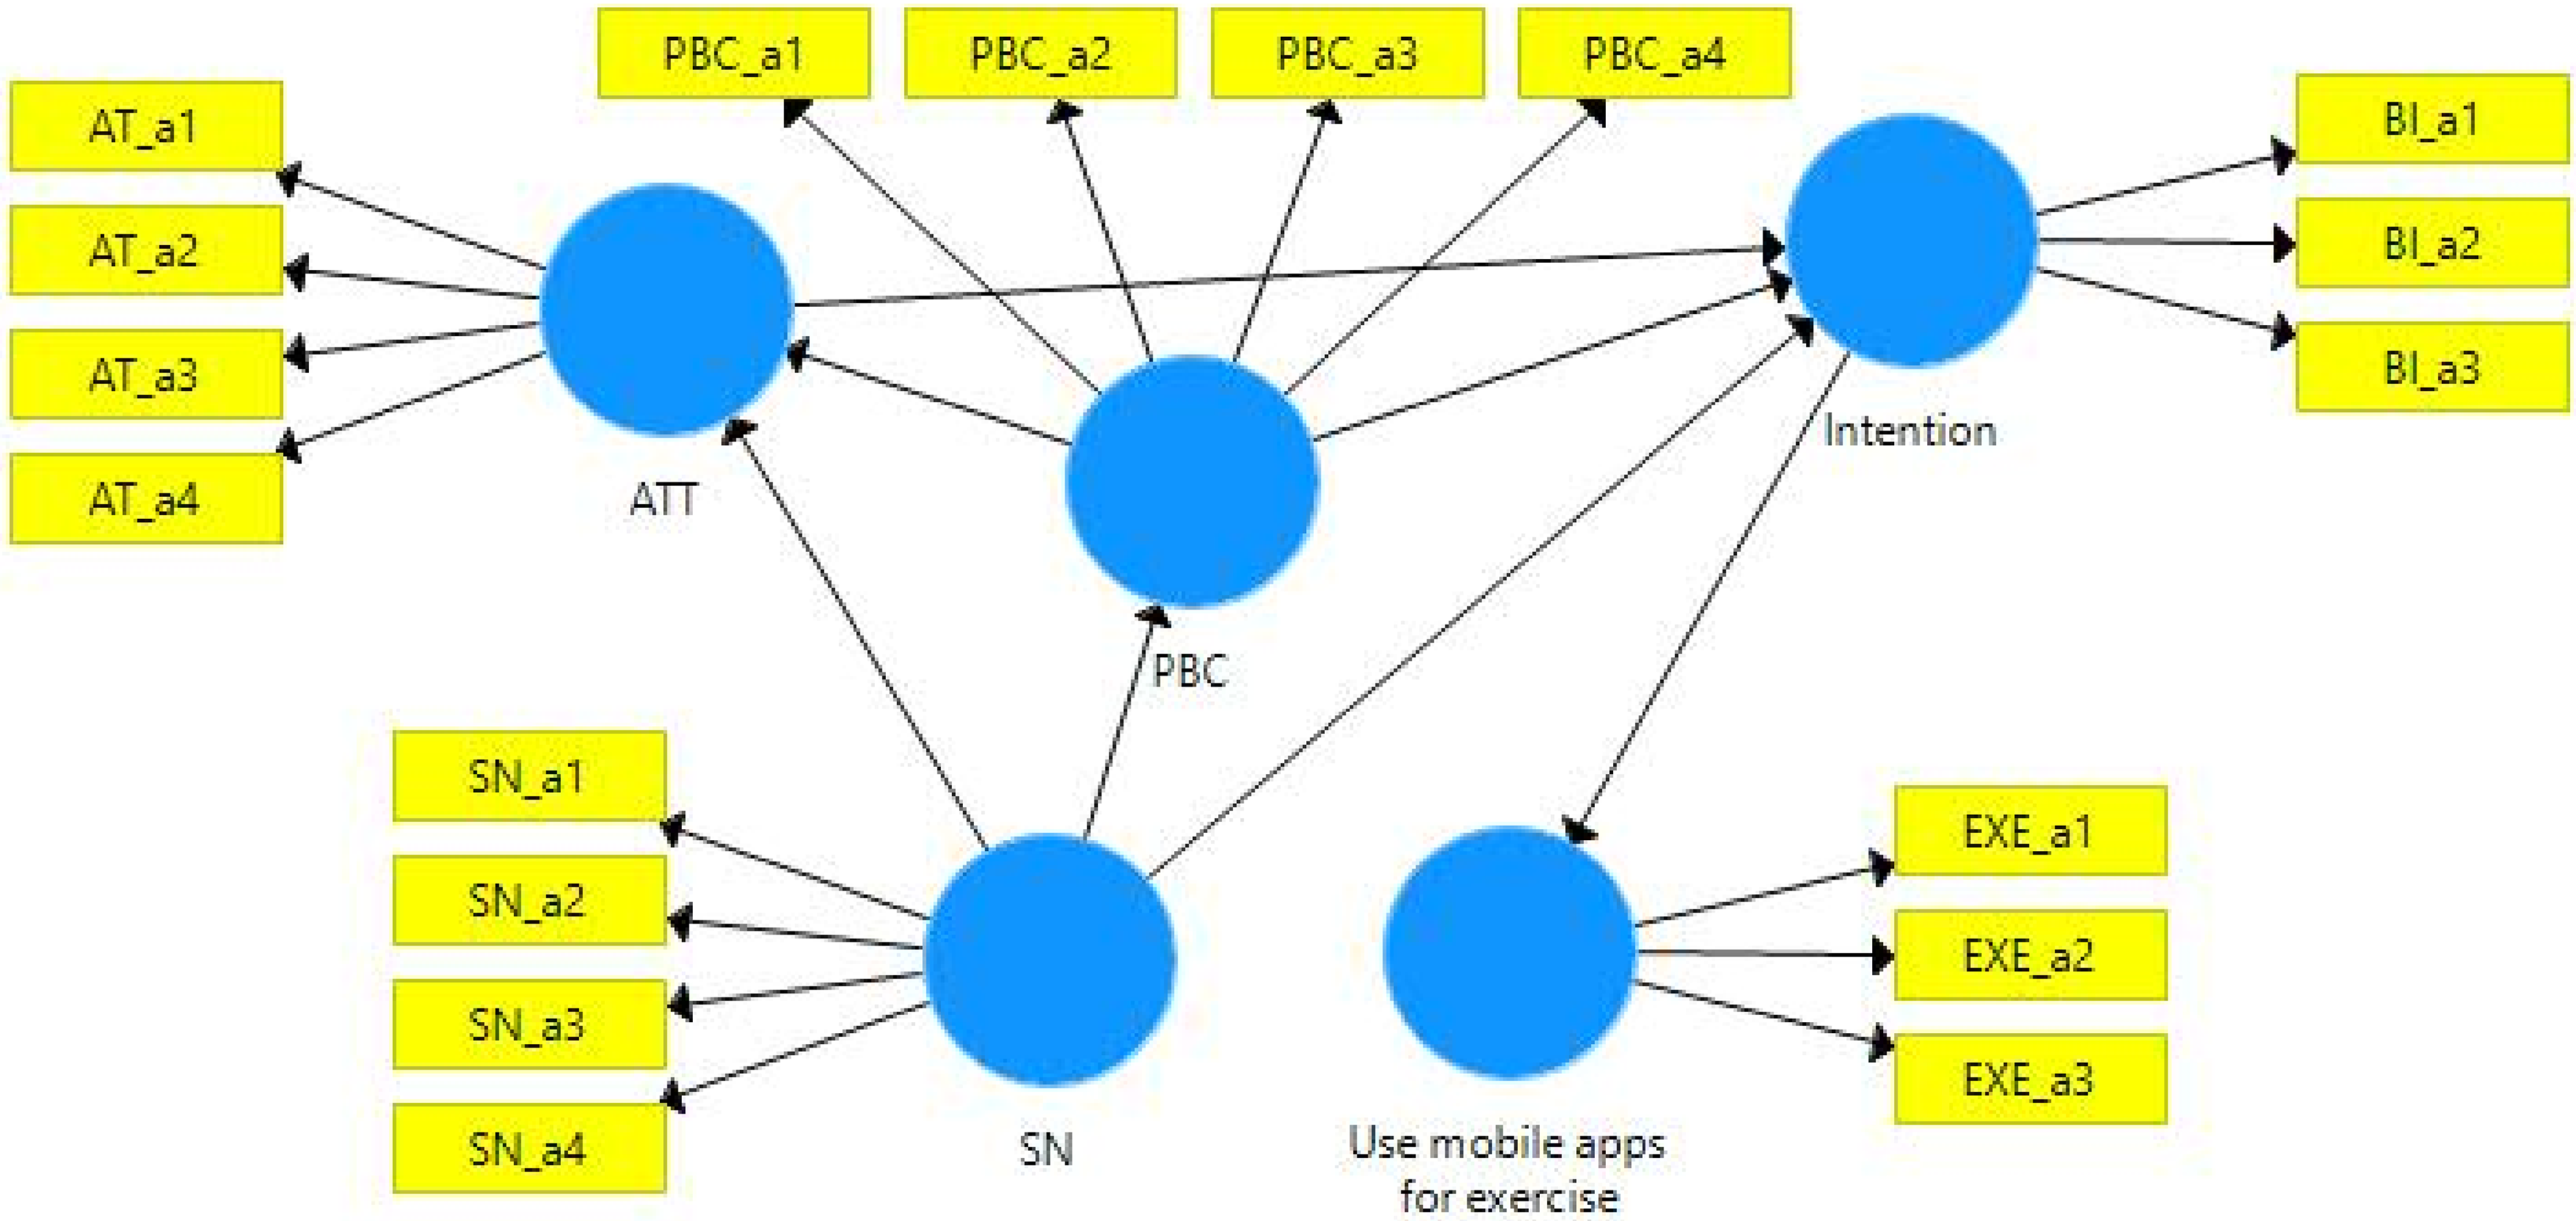
Research model.
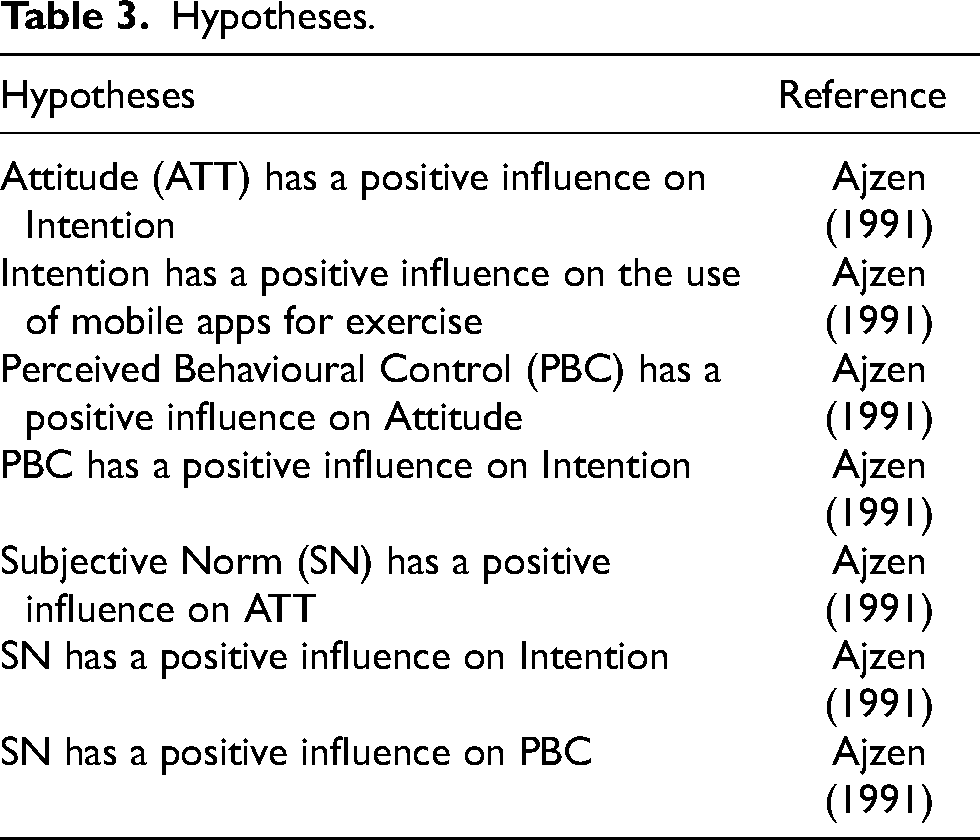
Table 3 indicates the hypotheses that were tested, as defined in the research model.
Hypotheses.
Results
The section commences with respondent demographics, followed by the research model testing results.
Respondent demographics
Demographic analysis indicated that the majority of the 514 respondents were female (58.6%), with grade 12 as their highest level of education (36.2%). Respondents were older than 50 (39.9%), with type 2 insulin-resistant diabetes, using oral diabetes medication such as Metformin or Glucophage. Respondents resided predominantly in the City of Cape Town. The top five areas were low-resourced areas such as Belhar (11.9%), Athlone (9.7%), Mitchell's Plain (8.6%), Khayelitsha (4.7%) and Gugulethu (3.5%).
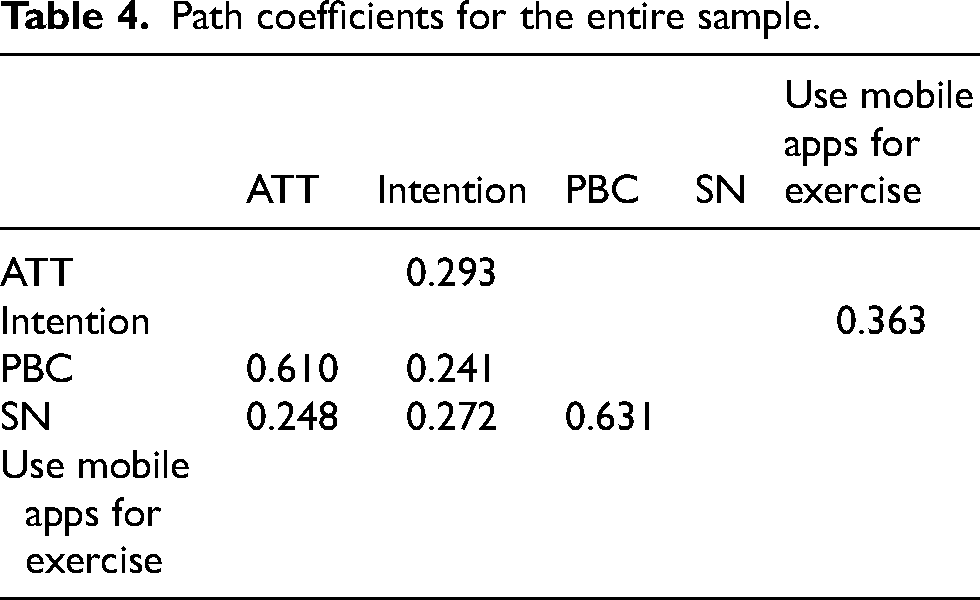
In Table 4 the PLS-SEM path coefficients test assessed the strength and direction of the relationship between the variables, as defined in the hypotheses (Huang et al., 2013). The results indicate only positive path coefficients, therefore there are only positive influences between the variables. The strongest positive influence is SN on PBC (0.631). Therefore, the ease or difficulty in using mobile health applications for physical activity is positively influenced by respondents’ friends and family. The weakest influence is PBC on the intention to use mobile applications.
Path coefficients for the entire sample.
As stated, the p-value, generated by bootstrapping, was used to test the hypotheses (Hair Jr et al., 2016). The hypotheses results are presented in Table 5. The original sample (O) refers to the sample of 514. The Sample Mean (M) is the mean of the estimated parameter over all subsamples (subsample = 5000) (Ringle et al., 2015).
Hypotheses testing results for the entire sample.
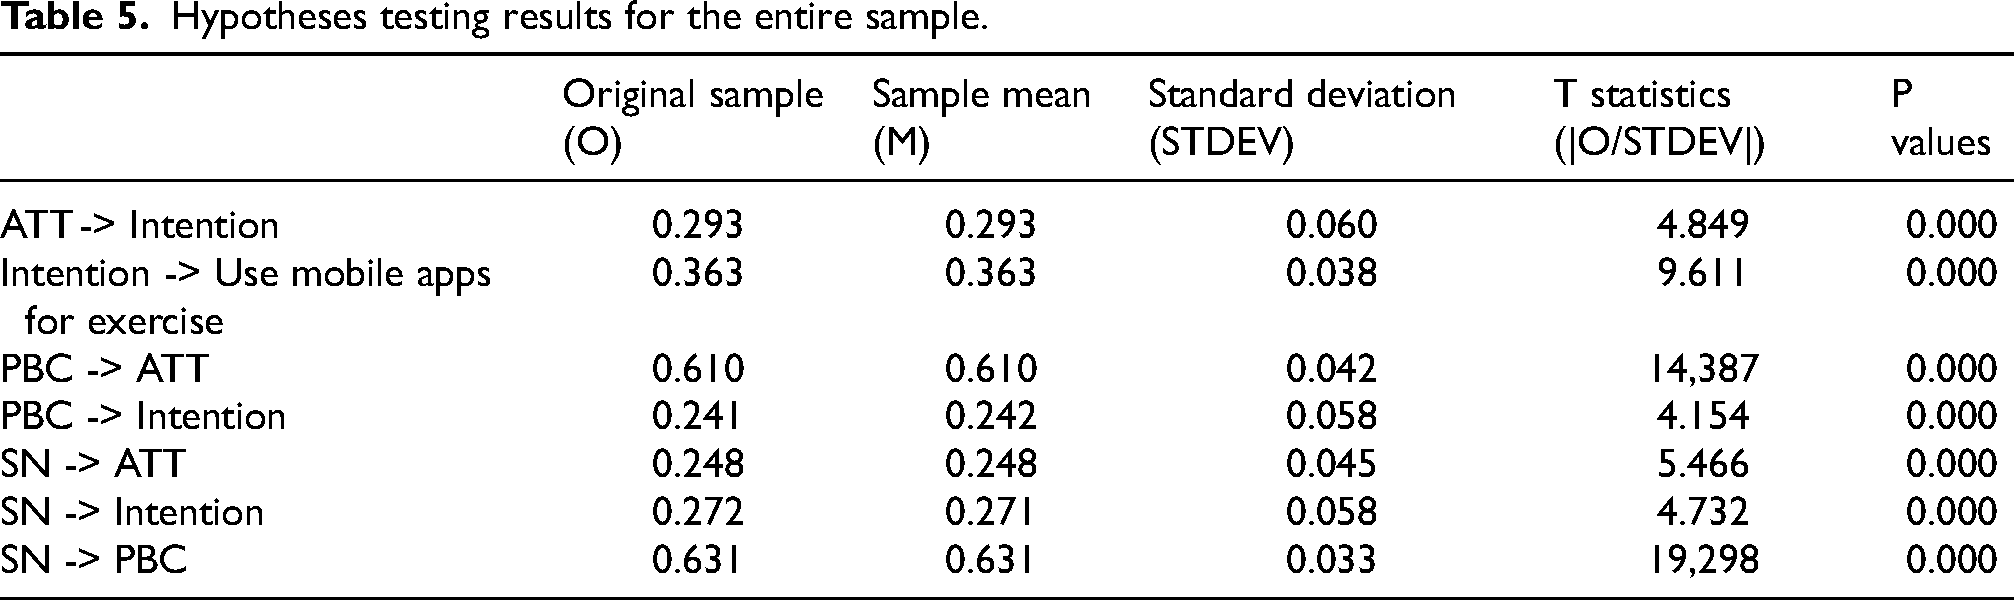
Standard deviation (STDEV) is the summary of the variance between the variable and the mean. In PLS-SEM bootstrapping it equals the standard error and is therefore used to calculate the t-statistic (Original/STDEV). All the hypotheses proved highly significant at a 99% confidence interval with p-values = 0.000.
Based on (Chin et al., 2003), R2 higher than 0.67 represents a good explanatory power; R2 between 0.33 and 0.66 represents a moderator explanatory power, and R2 between 0.19 and 0.33 represents a weak explanatory power. Therefore, the ability of PBC, SN and ATT to predict Intention was moderate (R2 = 51%). Despite a positive path coefficient of 36.3% between Intention and Use and all the relationships proving highly significant, the overall research model had low predictive power for the use of mobile health applications for physical activity (R2 = 13.2%).
Table 6 displays the results from the MGA analysis to compare the path coefficient and bootstrapping results per age group. The strongest relationship strength in the original sample was between Attitude and Intention for the youngest age group (25–34 years). Comparatively, the path coefficients per age group indicate negative relationships between SN and Intention that were not evident in the total sample.
Path coefficients: Age comparison.
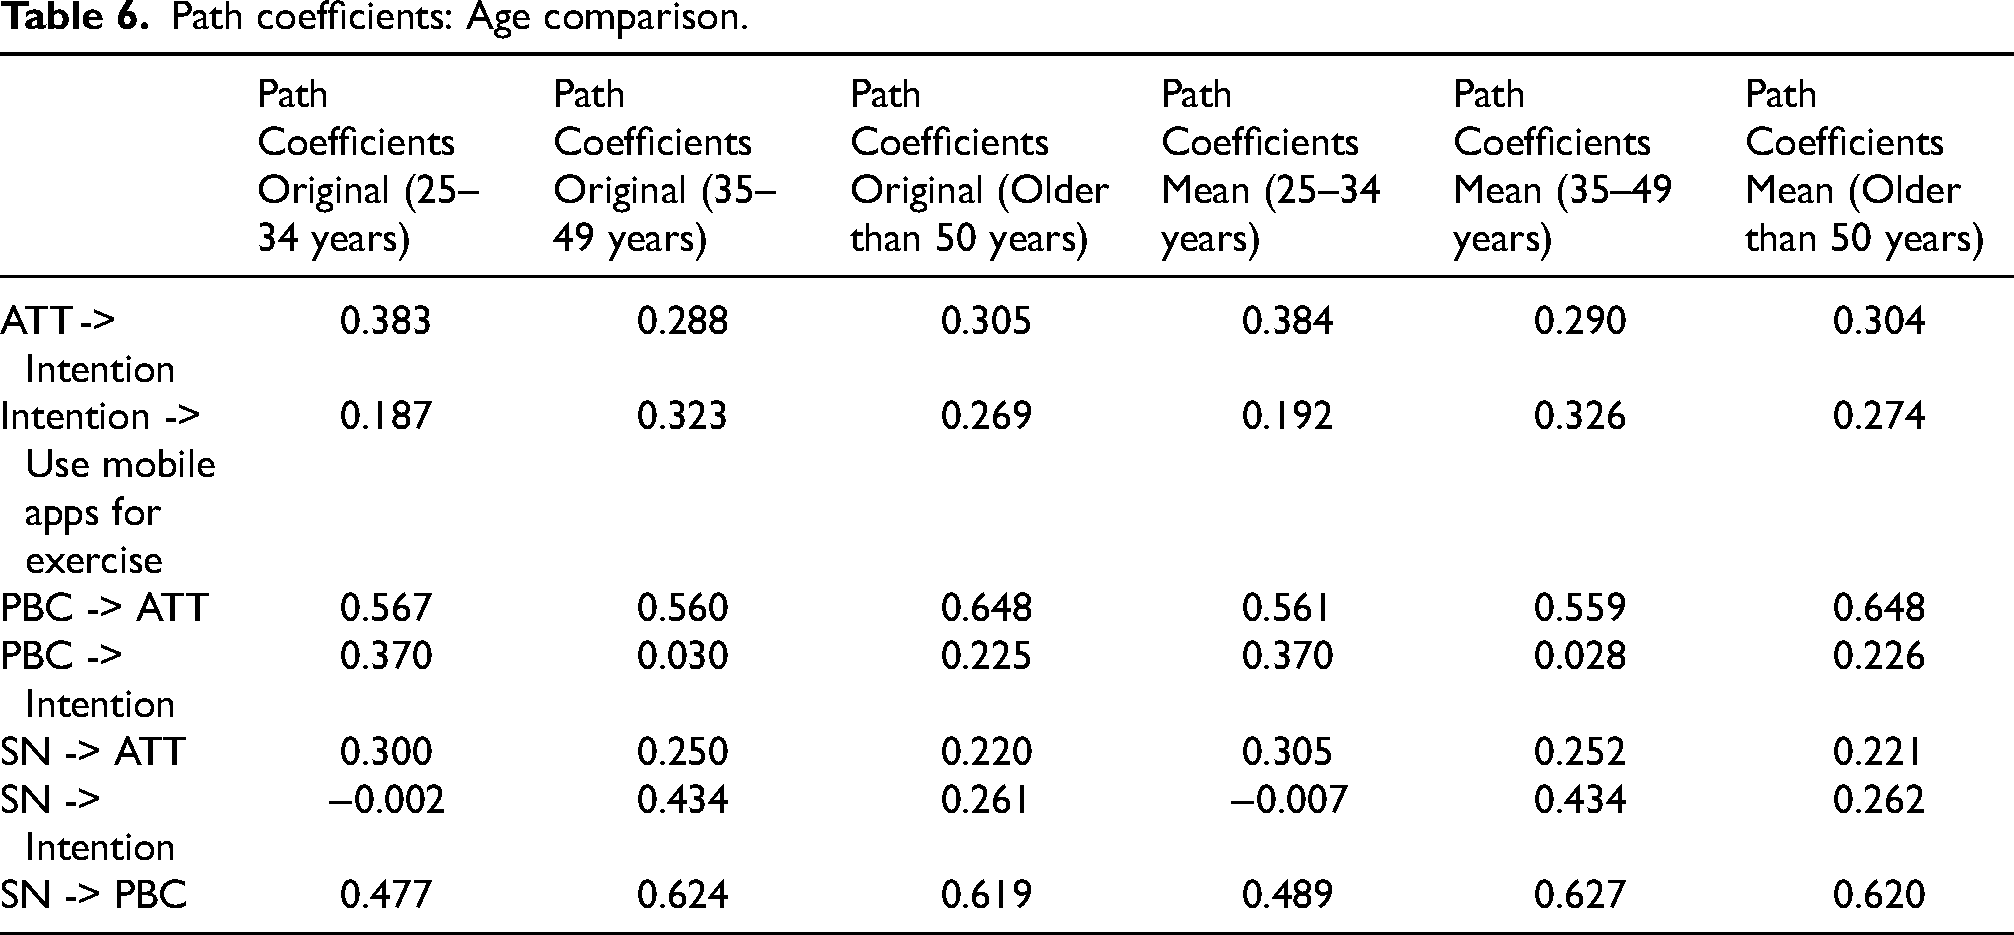
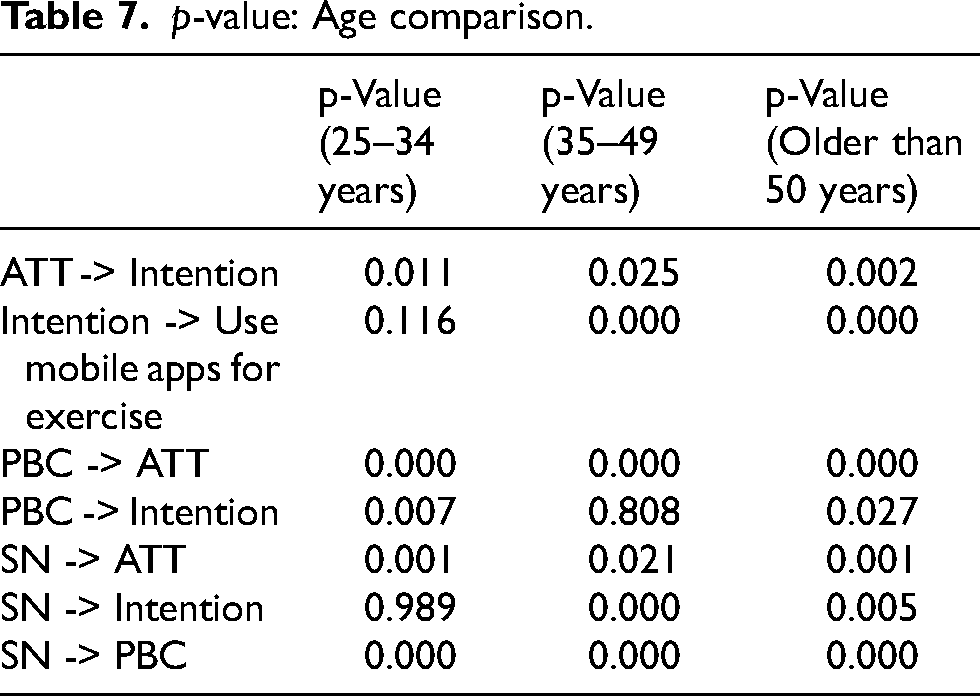
Table 7 indicates that despite the p-values for the entire population being highly significant (p-values < 0.001), three relationships are not significant for certain age groups. The insignificant relationships included two relationships for the youngest age group (25–34 years): SN and Intention and Intention and the use of mobile apps for exercise. The remaining insignificant relationship is between PBC and Intention for the age group (35–49 years). All relationships are still significant for the oldest age group but at a 95% confidence interval as opposed to the original 99% confidence interval.
p-value: Age comparison.
Discussion
Healthcare professionals agree that applications represent a crucial avenue for involving patients in the autonomous management of their health conditions and empowering them to cultivate positive behavioural changes. However, apprehensions have arisen due to the restricted digital literacy levels among patients and issues related to the seamless integration of these apps into their healthcare routines (Yoon et al., 2022). The research tested the acceptance and use of mobile health applications for physical activity for patients with diabetes in the City of Cape Town due to the high diabetes prevalence. In the entire population, all of the hypotheses tested had a significant positive influence on behavioural intention to use mobile applications for physical activity. These findings are supported by a study by authors (Hoque and Sorwar, 2017) which indicates that users’ behavioural intention to adopt mobile health services is strongly influenced by Perceived Behavioural Control (effort expectancy) and Social Norm (social influence).
The results for younger patients also indicated that the influence of Social Norm on the Attitude to use mobile applications was not significant, unlike for older patients. However, this contrasts with the study of 78 younger people (mean age = 19.94 years) in a developed country, where SN influenced the attitude toward using fitness mobile applications (Gabbiadini and Greitemeyer, 2019). However, there is no indication that the younger people had diabetes and the sample size was small.
The literature evidence that use behaviour is strongly influenced by behavioural intention (Venkatesh et al., 2016). Research in China supports the finding that attitude can be used to predict intention to use mobile health services for persons who are over 40 (Deng et al., 2014). The research adds that attitude can be used to predict the intention to use mobile applications for persons under 35 years old. These findings support the view that despite increasing access to the Internet via prepaid mobile phones, the use of mobile applications is low, especially for older patients (Li et al., 2017). The previous study by the author (Petersen et al., 2018) showed that the actual use of Information Communication and Technology (ICT) for diabetes self-management was low, despite the high behavioural intention.
The use of mobile health applications to improve physical activity in randomised control trials (58.6%) and 62% of trials assessed for pre/post changes shows promise (Elavsky et al., 2019). However, these studies did not support the view that mobile applications were accepted and used to promote physical activity in this context across different age groups. Alternatively, studies indicate that multiple national initiatives to improve the health of older people have been only marginally successful (Werfalli et al., 2019). Authors in recent studies highlight that enhancing patients’ self-efficacy for adopting healthy habits such as exercise requires a blend of traditional and virtual interactions (Hamidi et al., 2022).
For older diabetic patients with poor eyesight, research indicates frustration and feeling overwhelmed at the lack of usability. Usability challenges include using small instead of big buttons due to interface space (Hoehle and Venkatesh, 2015). Technical issues with using an activity tracker to motivate a small sample of 30 diabetic patients to exercise were also noted in a Canadian study (Pelletier et al., 2023).
Conclusion
This research aimed to identify the use of mobile applications for physical activity for diabetic patients in the City of Cape Town, a high diabetes prevalence area. Understanding age effects in mobile app adoption is imperative for designing targeted interventions that cater to diverse age groups. Older individuals may have distinct barriers or facilitators compared to younger counterparts, necessitating tailored strategies for effective health app utilization. By identifying age-specific variations in the factors influencing mobile app use, our study contributes valuable insights for healthcare practitioners, app designers, and policymakers. This research not only advances theoretical understanding but also holds practical implications for improving diabetes management interventions in South Africa.
The research highlights several key findings and implications:
Prevalence of Diabetes: The study acknowledges the higher prevalence of diabetes among older, low-income, urban South African populations. This underscores the importance of effective diabetes management strategies in these demographics. Role of Mobile Applications: Mobile applications have the potential to assist diabetic patients in adhering to self-care activities like exercise, which is crucial for preventing complications associated with diabetes. Theory of Planned Behaviour: The research employed the Theory of Planned Behaviour to assess factors influencing the intention to use mobile health applications for exercise among diabetic patients. The findings indicated that the TPB model could predict the intention to use mobile applications for physical activity. Moderate Predictive Power: While factors, like Perceived Behavioural Control, Social Norm, and Attitude, were found to moderately predict intention, the overall predictive power of the research model for the use of mobile health applications for exercise was relatively low. Age Differences: Notably, the study identified significant age-related differences in the relationships between variables. For instance, certain relationships were not significant for younger age groups, emphasizing the need for tailored interventions for different age brackets. The findings identified differences in the use of mobile applications among different age groups. All TPB hypotheses tested highly significant for the entire sample, ages from 24 years to older than 50 years. However, MGA showed differences in the significance of these relationships for different age groups.
Despite the large sample size, caution must be applied when attempting to generalise the findings due to the significant inequalities in the South African population (Statistics South Africa, 2020). The digital divide, particularly affecting older individuals, presents a challenge in using mobile applications for health-related purposes. Factors such as limited access to smartphones and data affordability can hinder their use.
In summary, this research contributes the following:
Theory Advancement: By emphasising age-specific subtleties in the links between TPB characteristics and the usage of mobile health applications for exercise, our research advances the Theory of Planned Behaviour (TPB). The current theoretical framework gains more detail with the discovery of particular linkages that are not significant for particular age groups. This understanding can help researchers clarify and expand theoretical frameworks in health psychology by encouraging them to investigate age-related changes in health behaviour ideas. Practical Interventions: Practitioners, medical experts, and application designers can benefit greatly from the study's conclusions. When building mobile applications for patients with diabetes, designers should take into account the varying demands and motivations of different age groups. Interventions can be more effective if they are designed to target age-specific characteristics that impact the adoption of health applications. For example, tactics to enhance Social Norm views might have more effect for specific age groups, supporting focused health promotion initiatives. Public Health Policies: The findings have ramifications for South African public health policies concerning the management of diabetes on a larger scale. Policies designed to encourage better lifestyles among diabetic groups can be developed with consideration for age-specific differences in the factors driving mobile app use. Policies and actions must to take into account the unique challenges and motivations of different age groups, fostering inclusivity and effectiveness in diabetes care initiatives.
This research contributes not only to academic knowledge but also offers practical insights that can shape the design of interventions, inform public health strategies, and improve the overall management of diabetes among diverse age groups in South Africa. By recognizing and acting upon these implications, stakeholders can work collaboratively to address the unique needs of diabetic patients and enhance the impact of mobile health applications on physical activity.
Footnotes
Declaration of conflicting interests
The author declared no potential conflicts of interest with respect to the research, authorship, and/or publication of this article.
Funding
The author disclosed receipt of the following financial support for the research, authorship, and/or publication of this article: National Research Foundation (grant number BAAP grant 116819). The financial assistance of the National Research Foundation (NRF) towards this research is hereby acknowledged. Opinions expressed and conclusions arrived at, are those of the author and are not necessarily to be attributed to the NRF.