
Abstract
Foamed materials are used in many everyday objects, including hot and cold beverage cups. In this research study, the compression behaviour of foamed polypropylene sheet samples used for thermoformed cups is investigated using finite element simulations. Computed tomography (CT) is utilised to examine the microstructure of two extrusion foam sheet samples prior to thermoforming. The samples consist of highly non-uniform cells. Therefore, finite element meshes are created directly from the CT measurements to reproduce the microstructure in detail. The meshes can be used for the mechanical characterisation. In order to validate the simulation models, experimental tensile tests are carried out, as compressive tests are not possible experimentally due to the small thickness of the samples. The validation shows that the tension behaviour in extrusion direction can be well depicted by the microstructural models. One validated model is then used to evaluate the compression behaviour at different stretching degrees to replicate the mechanical behaviour after the thermoforming process. The results show that the stretching of the foam highly affects the compression properties, so the higher the stretching, the lower the compressive strength.
Introduction
Foams are applied in numerous areas due to their special properties.1–3 They are very often used in the field of packaging,4–6 for example in hot cups 7 due to their low thermal conductivity. 8 The mechanical, thermal, and electrical properties are dependent on various factors (e.g. bulk material properties, cell size distribution, relative density). 9 Therefore, the foam characterisation (e.g. examination of the foam microstructure) is important to meet the requirements for a certain application. Besides the experimental characterisation, the behaviour of foams can also be investigated virtually. For this, there is a need of proper models of the foam microstructure. In general, there are two modelling approaches, which differ in the description of the microstructure. One is the constitutive method where the microstructure is represented by a homogeneous medium. The material model of this medium, which represents the specific behaviour of the foam, can be obtained, for example, by the mean field homogenisation method.10–16 In the second approach, the direct modelling, the microstructure is modelled in detail. This means that all components of the cells (e.g. struts, edges, faces) are present in the model. In literature, there are many predefined models, where one cell geometry represents the entire foam microstructure.17–20 In addition to the representative models, there are also approaches where the foam microstructure is obtained by a specific modelling technique, resulting in different cell structures. Finite element meshes can be extracted directly from computed tomography (CT) data, for example, and used for simulations.21,22 The models presented in literature are based on the preliminary segmentation using grey values.23,24 The resulting model microstructure is similar to the real foam microstructure because of the detailed description of e.g. the cell size distribution.24–26 Nevertheless, several post-processing steps and software applications are needed. Furthermore, the number of elements and therefore the computational effort is high due to the detailed description of the microstructure. In order to keep the computational effort as low as possible, it is necessary to investigate small regions, which are still large enough to represent the entire foam microstructure27,28 or to partition a larger region into several segments. Thus, the single parts can be characterised separately if the microstructure is different through the foam. 29 In this research work, a direct modelling approach based on CT data was used, which is described in detail in Hössinger-Kalteis et al. (2021). 29 Finite element models for two extrusion foam sheet samples were created using the software Avizo™ (Thermo Fisher Scientific Inc., Version 2019.4) and the corresponding XWind Extension. The foam sheets are used for hot cups produced by thermoforming. The compression behaviour of the sheet samples should be characterised by simulations at different stretching degrees as the hot cups have limited compressive strength and the experimental characterisation is hardly possible due to the small thickness of the samples. Prior to the compressive test simulations, the foam models were validated with experimental tensile tests to see if the model predicts reliable results.
Foam sheet samples
Two foam sheet samples, which are used for thermoforming hot cups are investigated. Both are produced by extrusion and show a skin-core-skin structure, with compact skins and a foamed core. The two samples differ in their material composition (Figure 1). In the skin layers, sample 1 consists of a polypropylene (PP) homopolymer (PP type 1) applied in thermoformed packaging. A mixture of two PP types is used for the foamed core: 70% of the PP type 1 of which the skins are made of and 30% of a long-chain branched PP homopolymer (PP type 2). Sample 2 consists solely of the PP type 1, both in the skin layers and in the core. Description of the material composition of (a) sample 1 and (b) sample 2.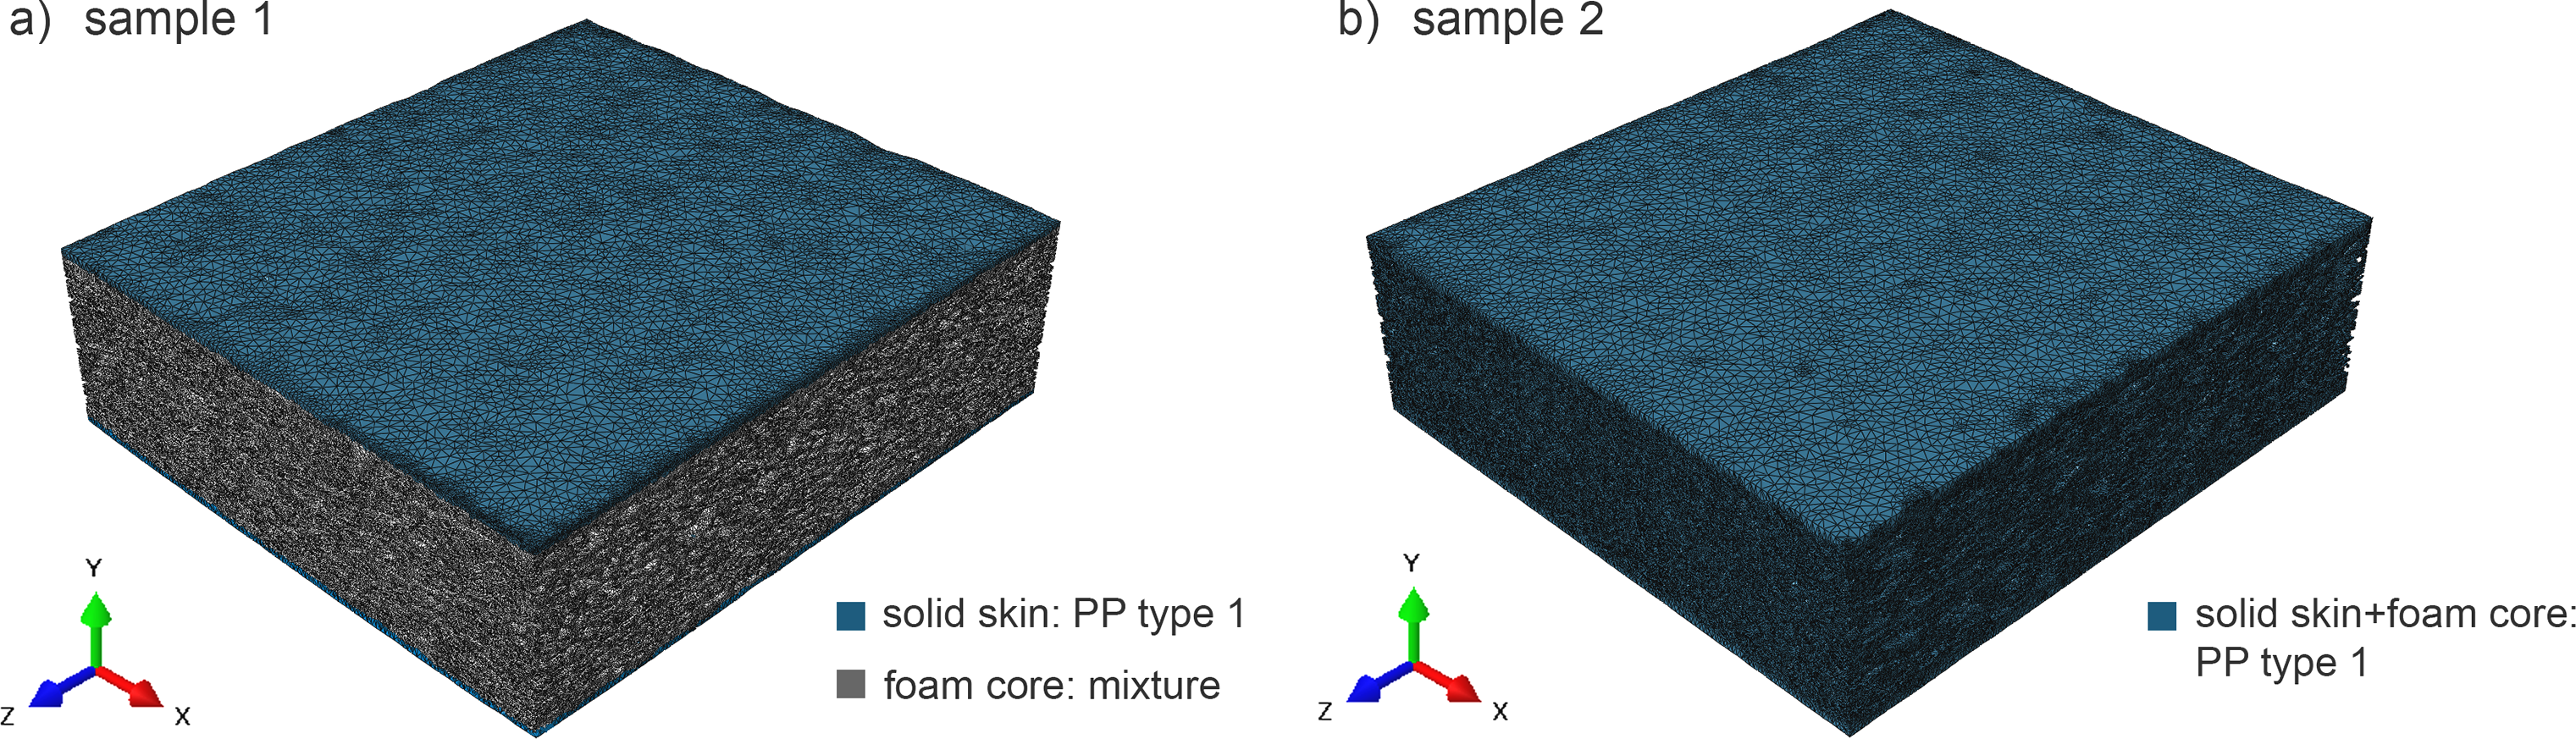
CT scan
For the CT scans a laboratory CT device was used (test equipment: Thermo Fisher Scientific Heliscan, 3 µm voxel edge length, 60 kV, 50 µA, 0.1 mm steel pre-filter, approximately 6 hours scan time). Cut-outs were made from the sheet samples with a size of approximately 5 mm x 1.6 mm × 10 mm centred and at a distance of approximately 5 cm from the top. A resolution of 3 µm voxel edge length was chosen and was sufficient to analyse the pores in both samples. In Figure 2, illustrations of the CT scan results are shown. Illustrations of the CT scan results: (a) sample 1 and (b) sample 2.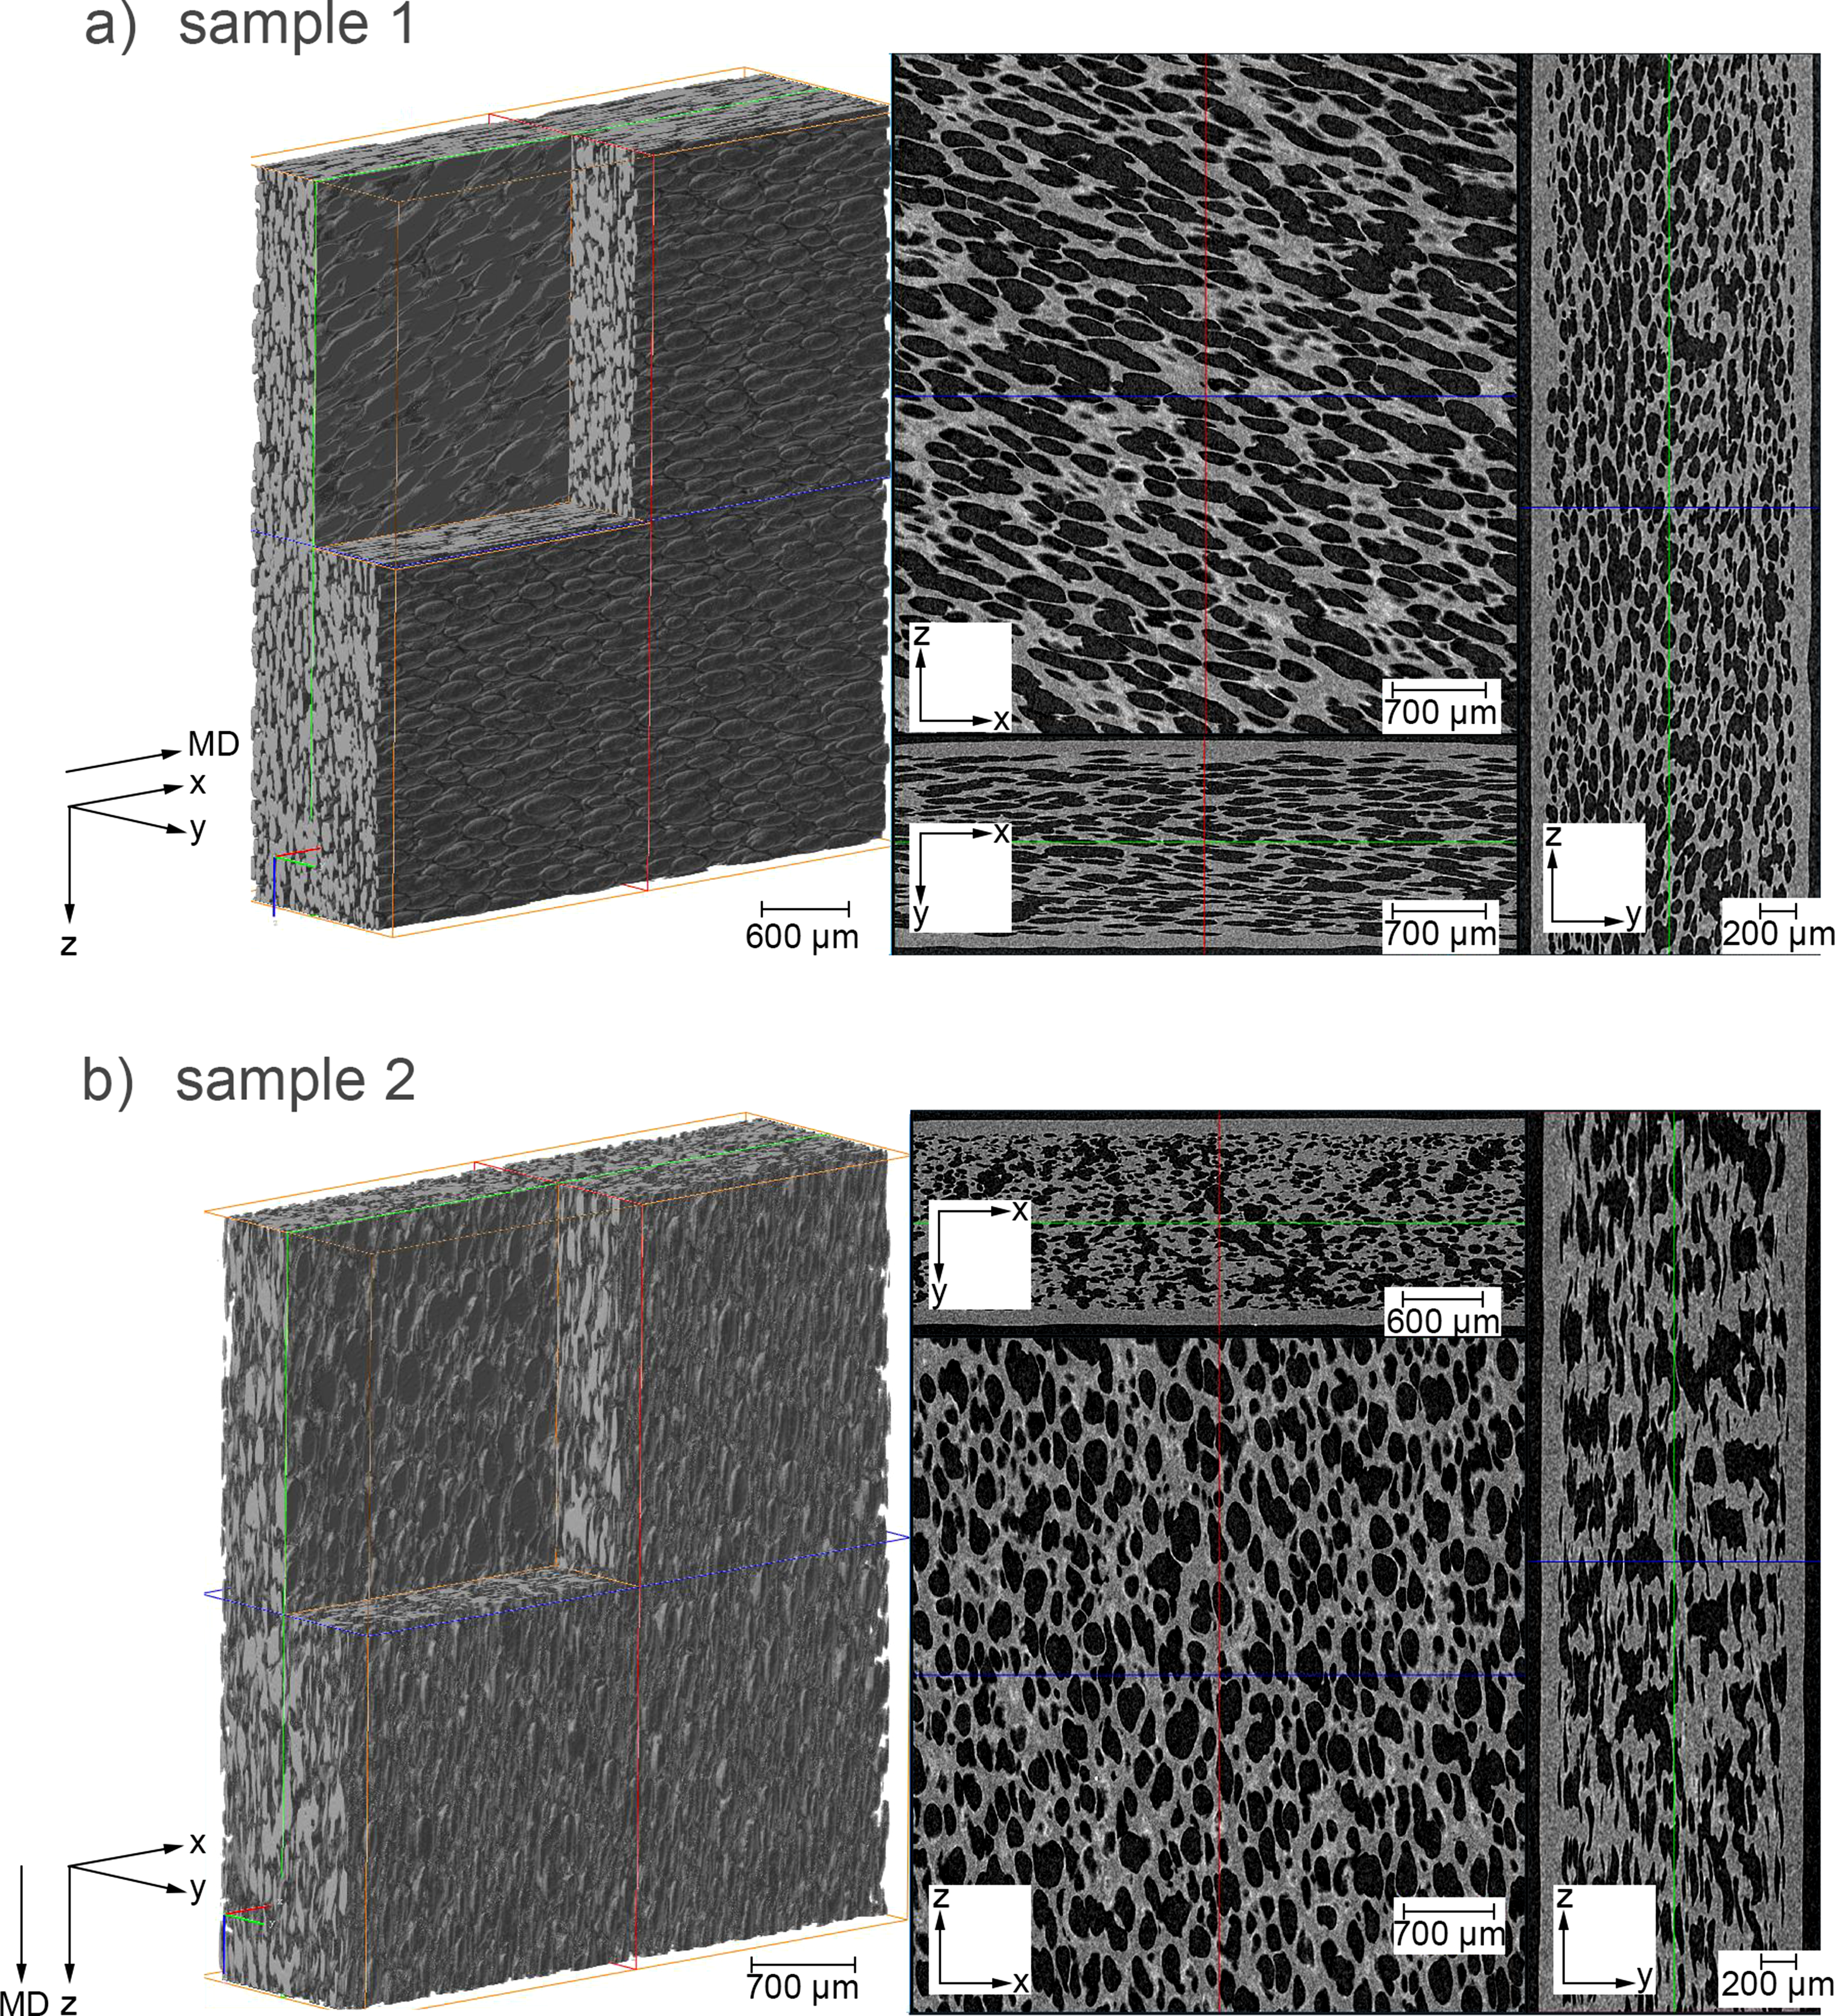
The extrusion direction, which is the machine direction (MD), is represented by the x-direction for sample 1 and the z-direction for sample 2. The direction transverse to the MD, the transverse direction (TD), is the z-direction for sample 1 and the x-direction for sample 2. The directions are different for the two structures, as the definition of the directions was chosen arbitrarily, which is insignificant for the results. Both samples show a distinct elongation of the pores in the MD.
Especially in sample 1, one can observe a slight tilt of the orientation in the core. Sample 1 shows more oval but also irregular shaped pores that are strongly connected in the frontal plane (xz-plane). Sample 2 shows highly irregular shaped pores that are also strongly connected in plaque thickness direction (y-direction). As already mentioned, both samples show a skin-core-skin structure. The thickness of the compact skin layers is approximately 60 µm for sample 1 and approximately 80 µm for sample 2.
Finite element model
The finite element mesh generation for sample 1 and sample 2 from CT data was done using the software Avizo™, Version 2019.4 (Thermo Fisher Scientific Inc.) and the corresponding XWind Extension. The data was smoothed in a pre-processing step with an adaptive Gauss filter utilising the software VGSTUDIO MAX, Version 3.3.5 (Volume Graphics GmbH). The mesh generation methodology is the same as described in Hössinger-Kalteis et al. (2021).
29
The region used for the mesh generation was approximately 4.7 mm x 1.6 mm × 5.2 mm and thus smaller than the scanned region, which was approximately 5 mm x 1.6 mm × 10 mm to reduce the modelling effort. The resulting finite element models consist of approximately 10 million tetrahedral elements. The shortest edge length is 0.02 µm and the longest 170 µm. The created meshes can then be imported in the finite element software Abaqus (Dassault Systèmes), where the meshes were further edited (e.g. non connected elements were removed) and all simulations were performed. As the number of elements is very high the simulation effort would be also very high. Therefore, the finite element models were partitioned into several regions to reduce the number of elements and thus the computation time. Each region could then be analysed separately. In Figure 3, the partition of the finite element models into smaller regions for sample 1 and sample 2 in MD and TD are shown. The partitions of sample 1 in MD are smaller than the other partitions. The number of elements was approximately 700 000 for these models. Running the first simulations with the partitions of sample 1 in MD, it was found that the simulation effort was not so high as expected and therefore the number of elements could be increased for the further simulations. Illustrations of the partition of the finite element models into smaller regions: (a) sample 1, left: machine direction (MD), right: transverse direction (TD) and (b) sample 2, left: machine direction (MD), right: transverse direction (TD).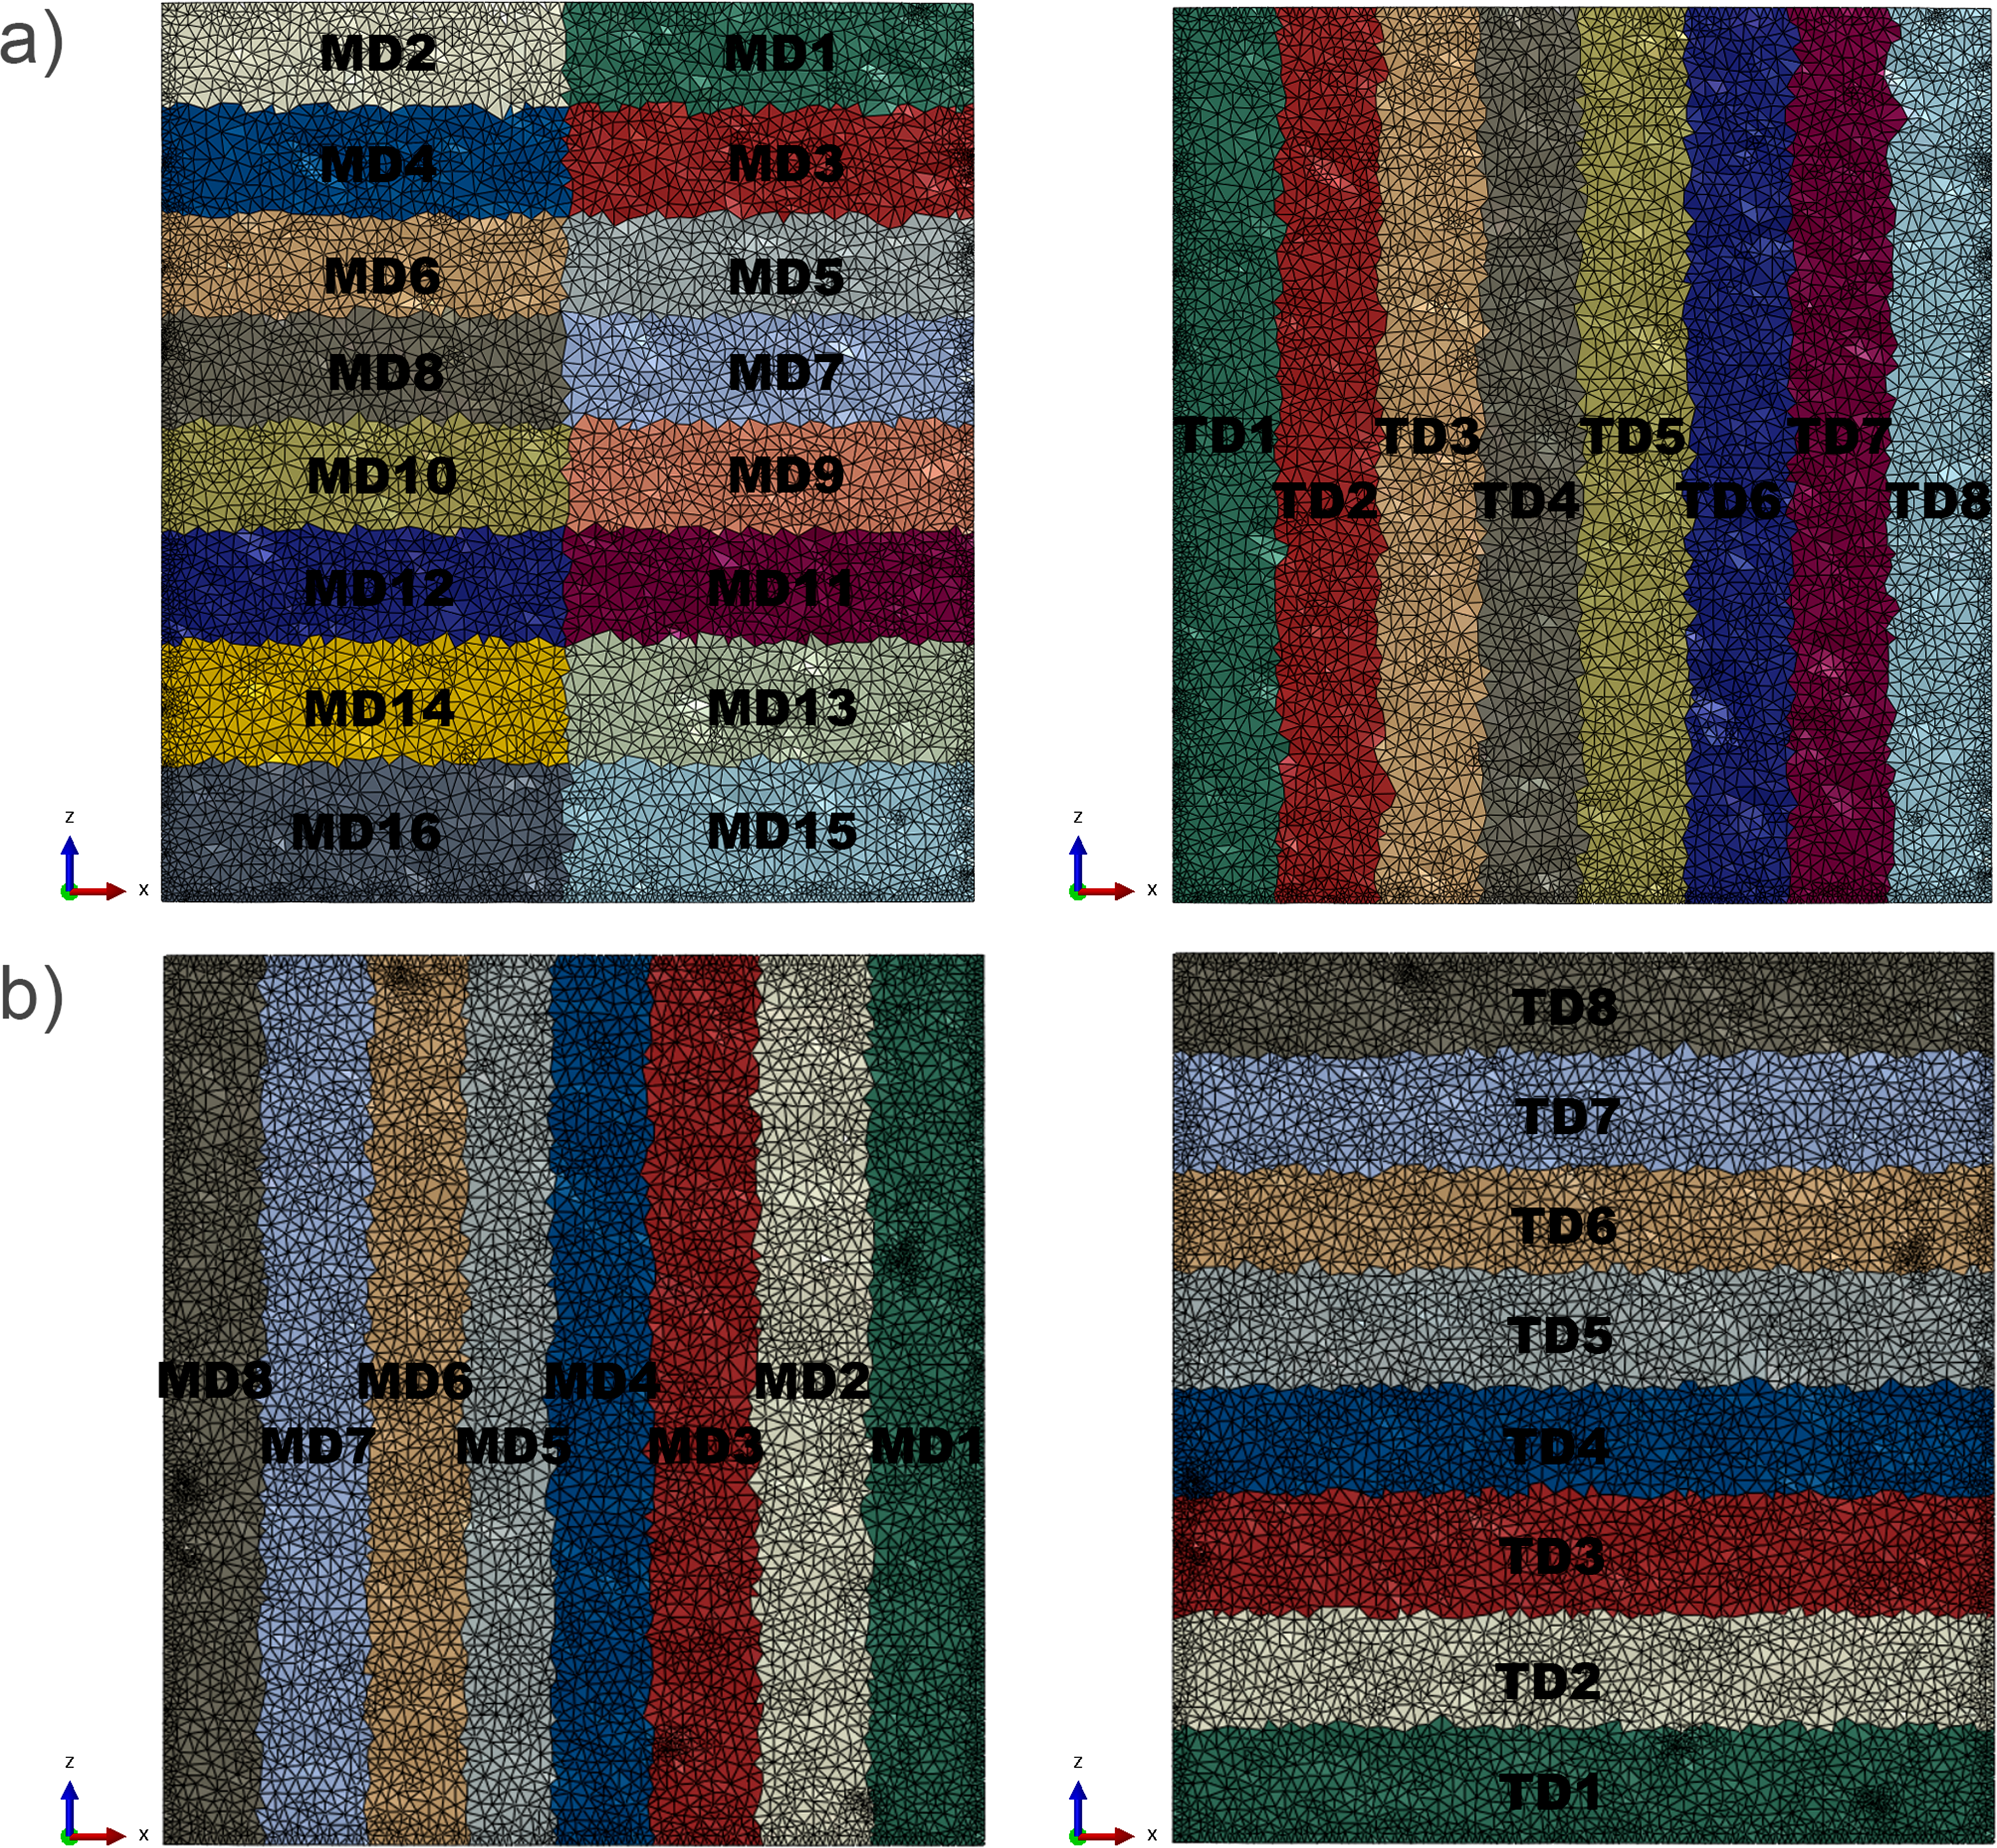
For the models of sample 1 in TD and sample 2 in MD and TD the number of elements was approximately 1.5 million elements. The models consist of some elements which are not connected to the main mesh, especially in the boundary regions. These elements were deleted as they would not affect the simulation results but the simulation time. After that, the models are prepared to the extent that they can be used for the simulations described in the next sections.
Tensile test simulation
In this section, the tensile test simulations performed in Abaqus (Version 2020) of the sheet samples 1 and 2 are described. The simulation results are validated with experimental results to determine whether the simulation method is accurate and whether the foam area investigated is representative for the entire sheet sample.
Material model
For the simulations, material models of the unfoamed materials are necessary. As shown in Hössinger-Kalteis et al. (2021) 29 the elastic plastic material model implemented in Abaqus is sufficient to determine the tension behaviour of foamed samples. Therefore, material models for the unfoamed PP homopolymer (PP type 1) and for the unfoamed mixture of the two PP types were created.
Material model PP type 1
For the elastic plastic material model creation of the unfoamed PP type 1, the stress-strain curves of experimental tensile tests were needed. The experiments were performed according to ISO 527-1:2012 on a ZwickRoell Z-Polar testing machine with a 7.5 kN load cell. For the determination of the material model parameters the average of the results of 10 tested samples were used. In Figure 4, the elastic plastic material model and the average experimental curve are illustrated. The Young’s modulus was calculated from the averaged experimental curve by assuming it is the slope of the stress-strain curve. For this a linear equation is used and the modulus is calculated between the stress values at 0.0005 and 0.0025 strain which results in a value of 1500 MPa. The Poisson’s ratio was assumed and set to 0.4. The plastic part of the material model is based on the von Mises yield surfaces with associated plastic flow and isotropic hardening.
30
For the plastic part of the material model it is necessary to define the yield stress which was assumed to be 18 MPa, so that the material model represents the experimental curve with the lowest deviation. Illustration of the elastic plastic material model and the average experimental curve of the PP type 1.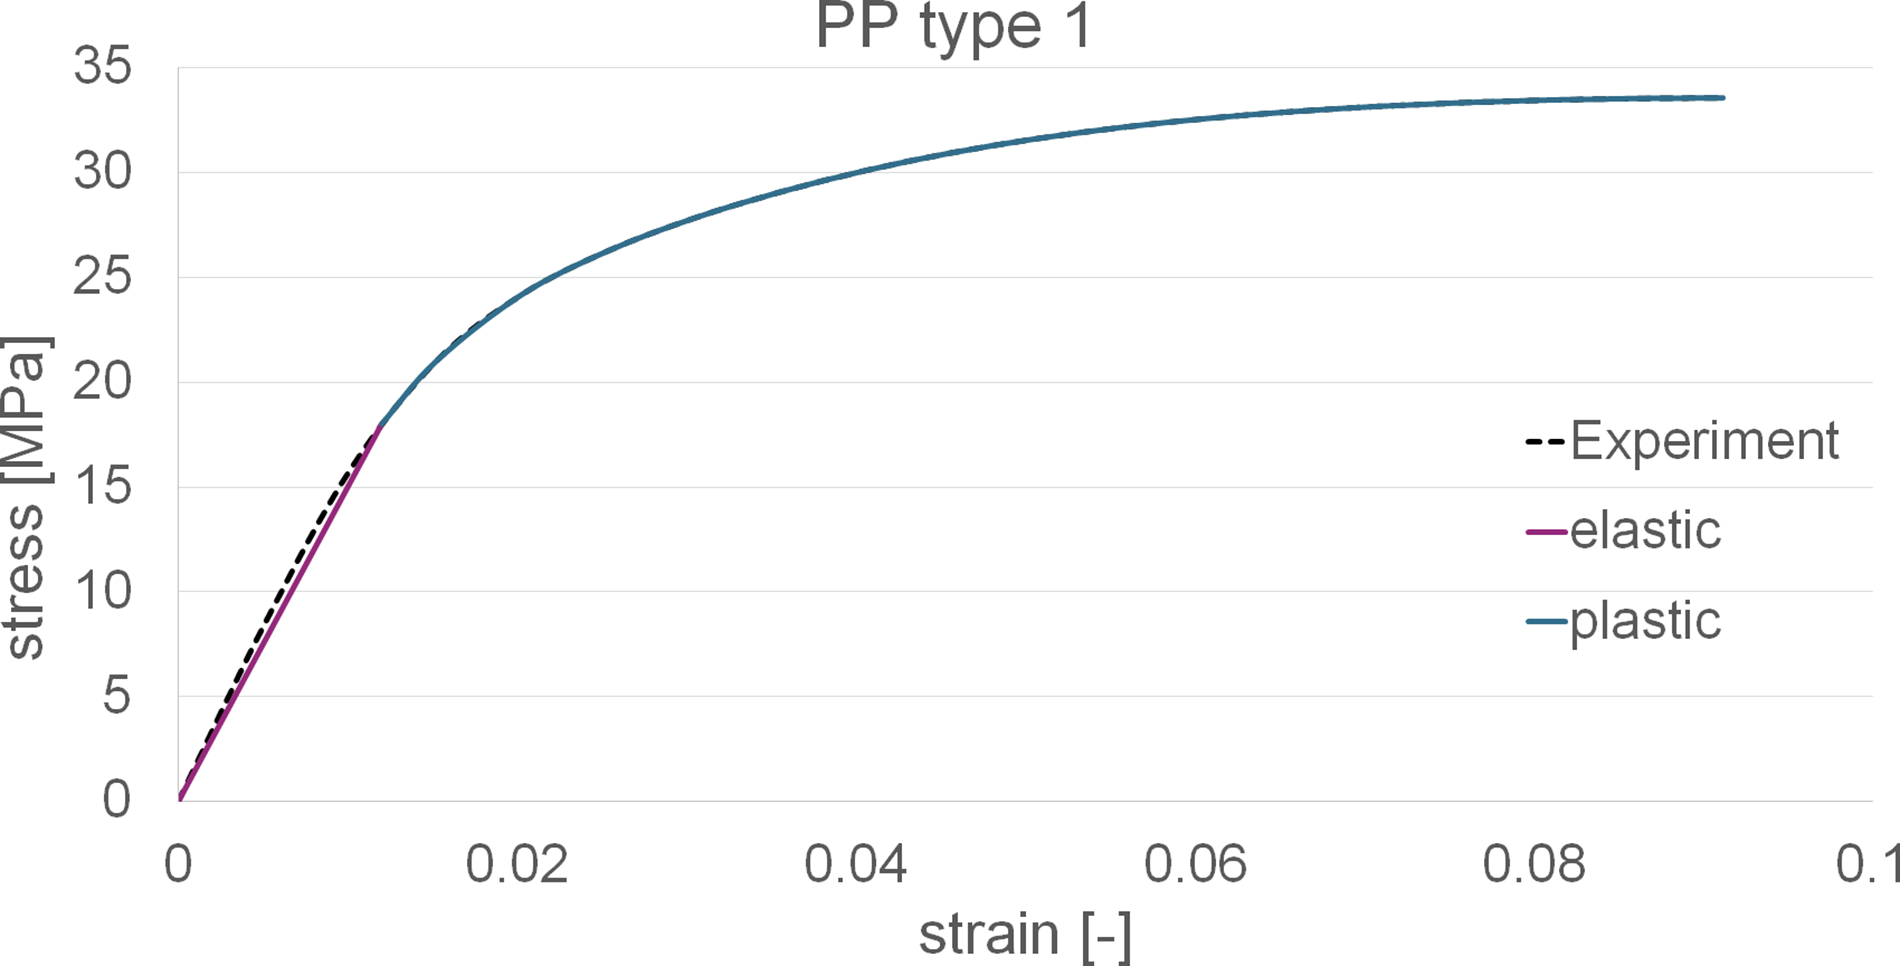
Material model mixture PP type 1 + PP type 2
Overview of the elastic plastic material model parameters for PP type 1 and PP type 2.
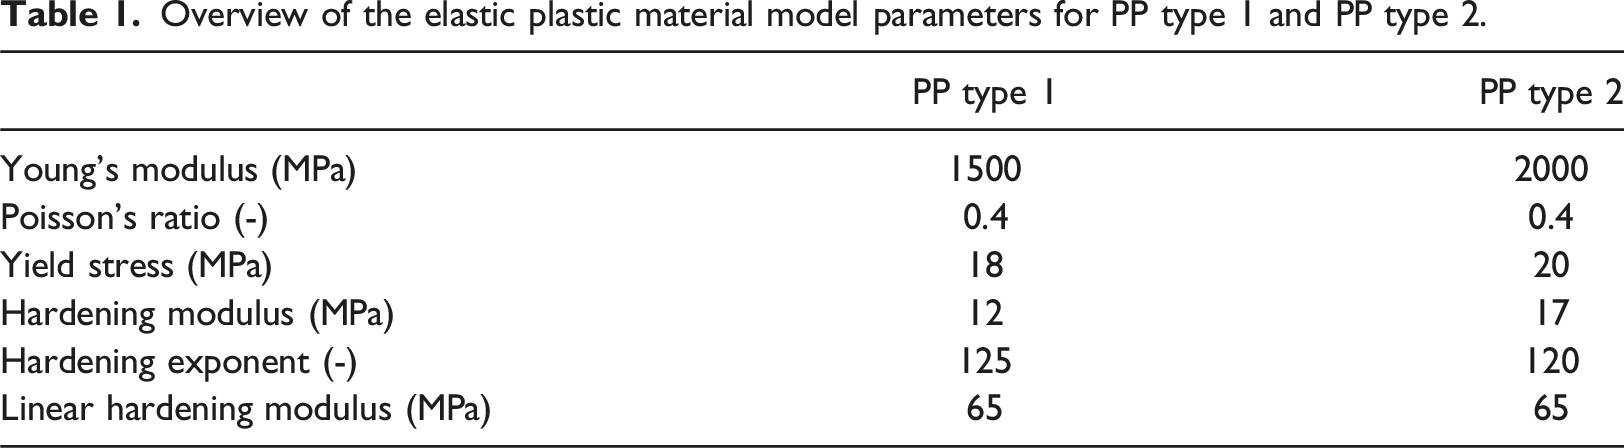
For the PP type 1, the averaged experimental curve was used as in the creation of the material model in the previous section.
For the PP type 2, similar experimental tensile tests were conducted as for the PP type 1. Also for this PP type, the averaged curve of ten tested samples serves as input for the determination of the material model parameters. It was assumed that the microstructure consists of PP type 1 as matrix material with spherical inclusions of PP type 2 embedded in the matrix. In Figure 5, the elastic plastic material model of the mixture and the average experimental curves of the PP type 1 and the PP type 2 are shown. Illustration of the elastic plastic material model of the mixture and the average experimental curves of the PP type 1 and the PP type 2.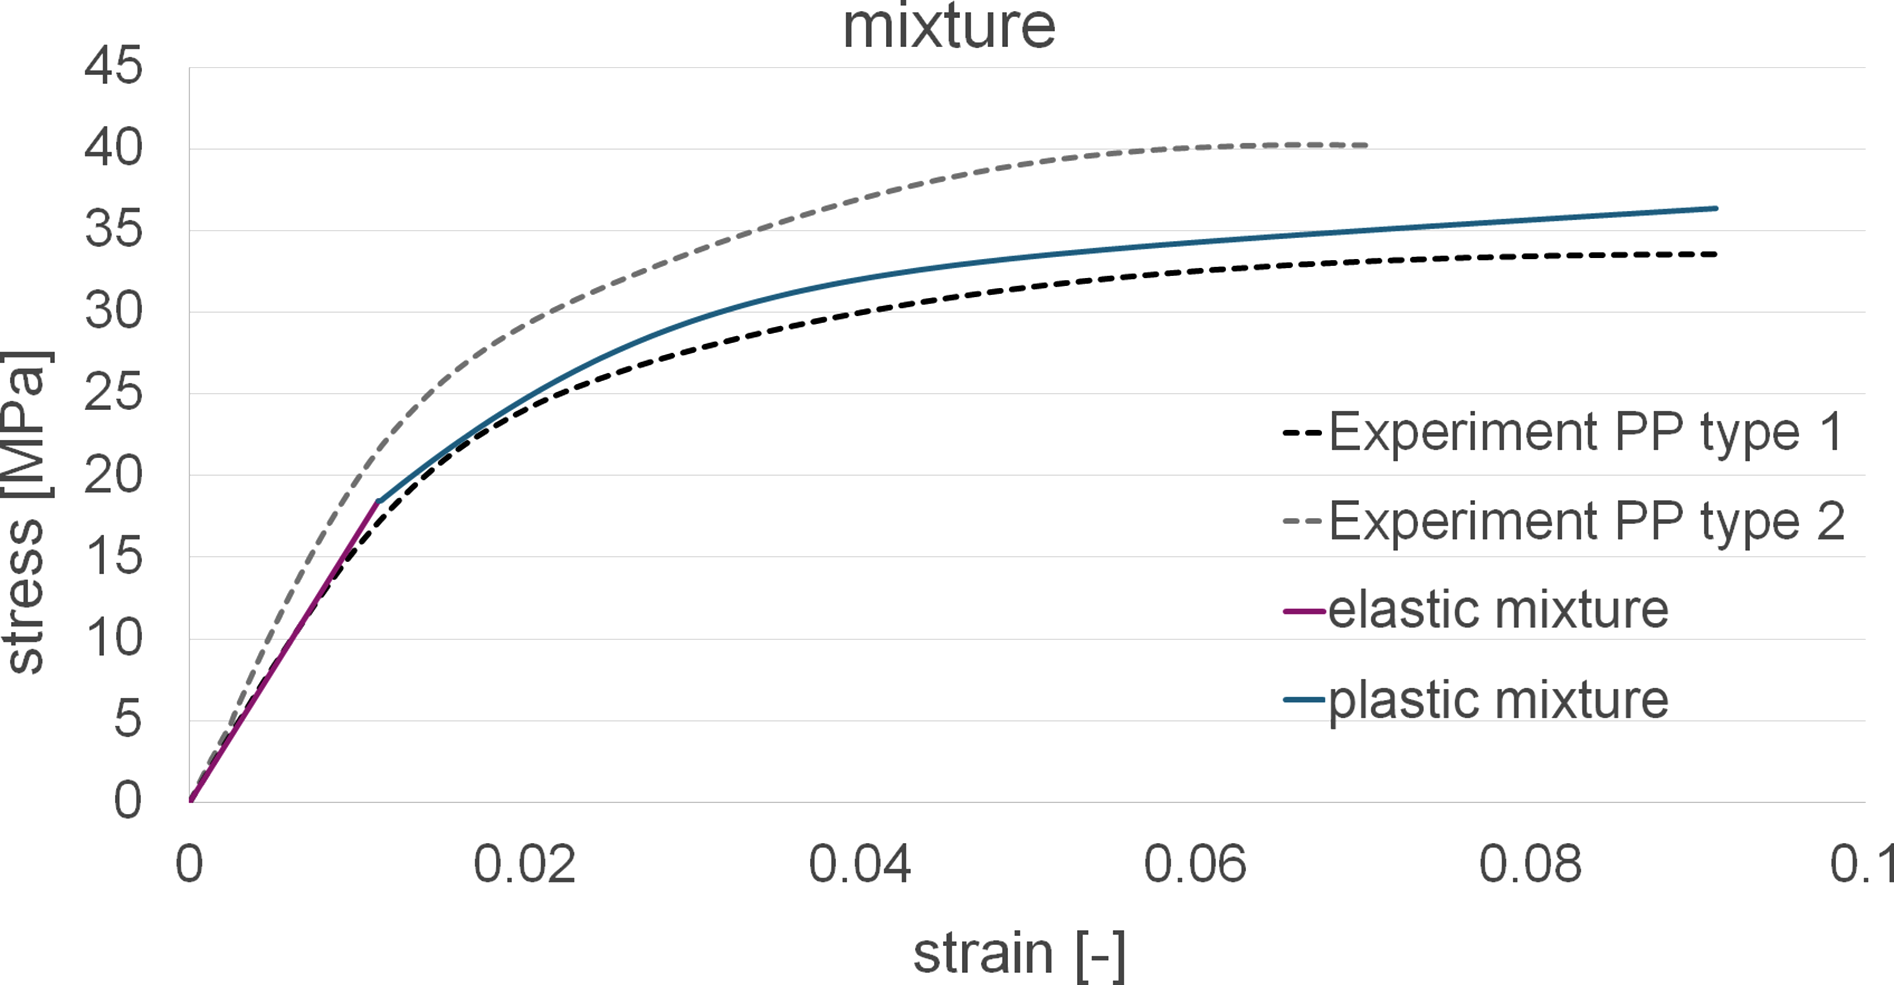
The Young’s modulus of the mixture was estimated at 1635 MPa, the Poisson’s ratio at 0.4 and the yield stress at 18.5 MPa.
Simulation set-up
In the following section, the simulation set-up of the tensile test simulations is described. The partitioned finite element models created from the CT scans were used for the tensile test simulations. The element type was defined as linear (element type in Abaqus: C3D4). In Figure 6, the boundary conditions used for the tensile loading are shown. Illustration of the tensile test simulation set-up of a foam partition.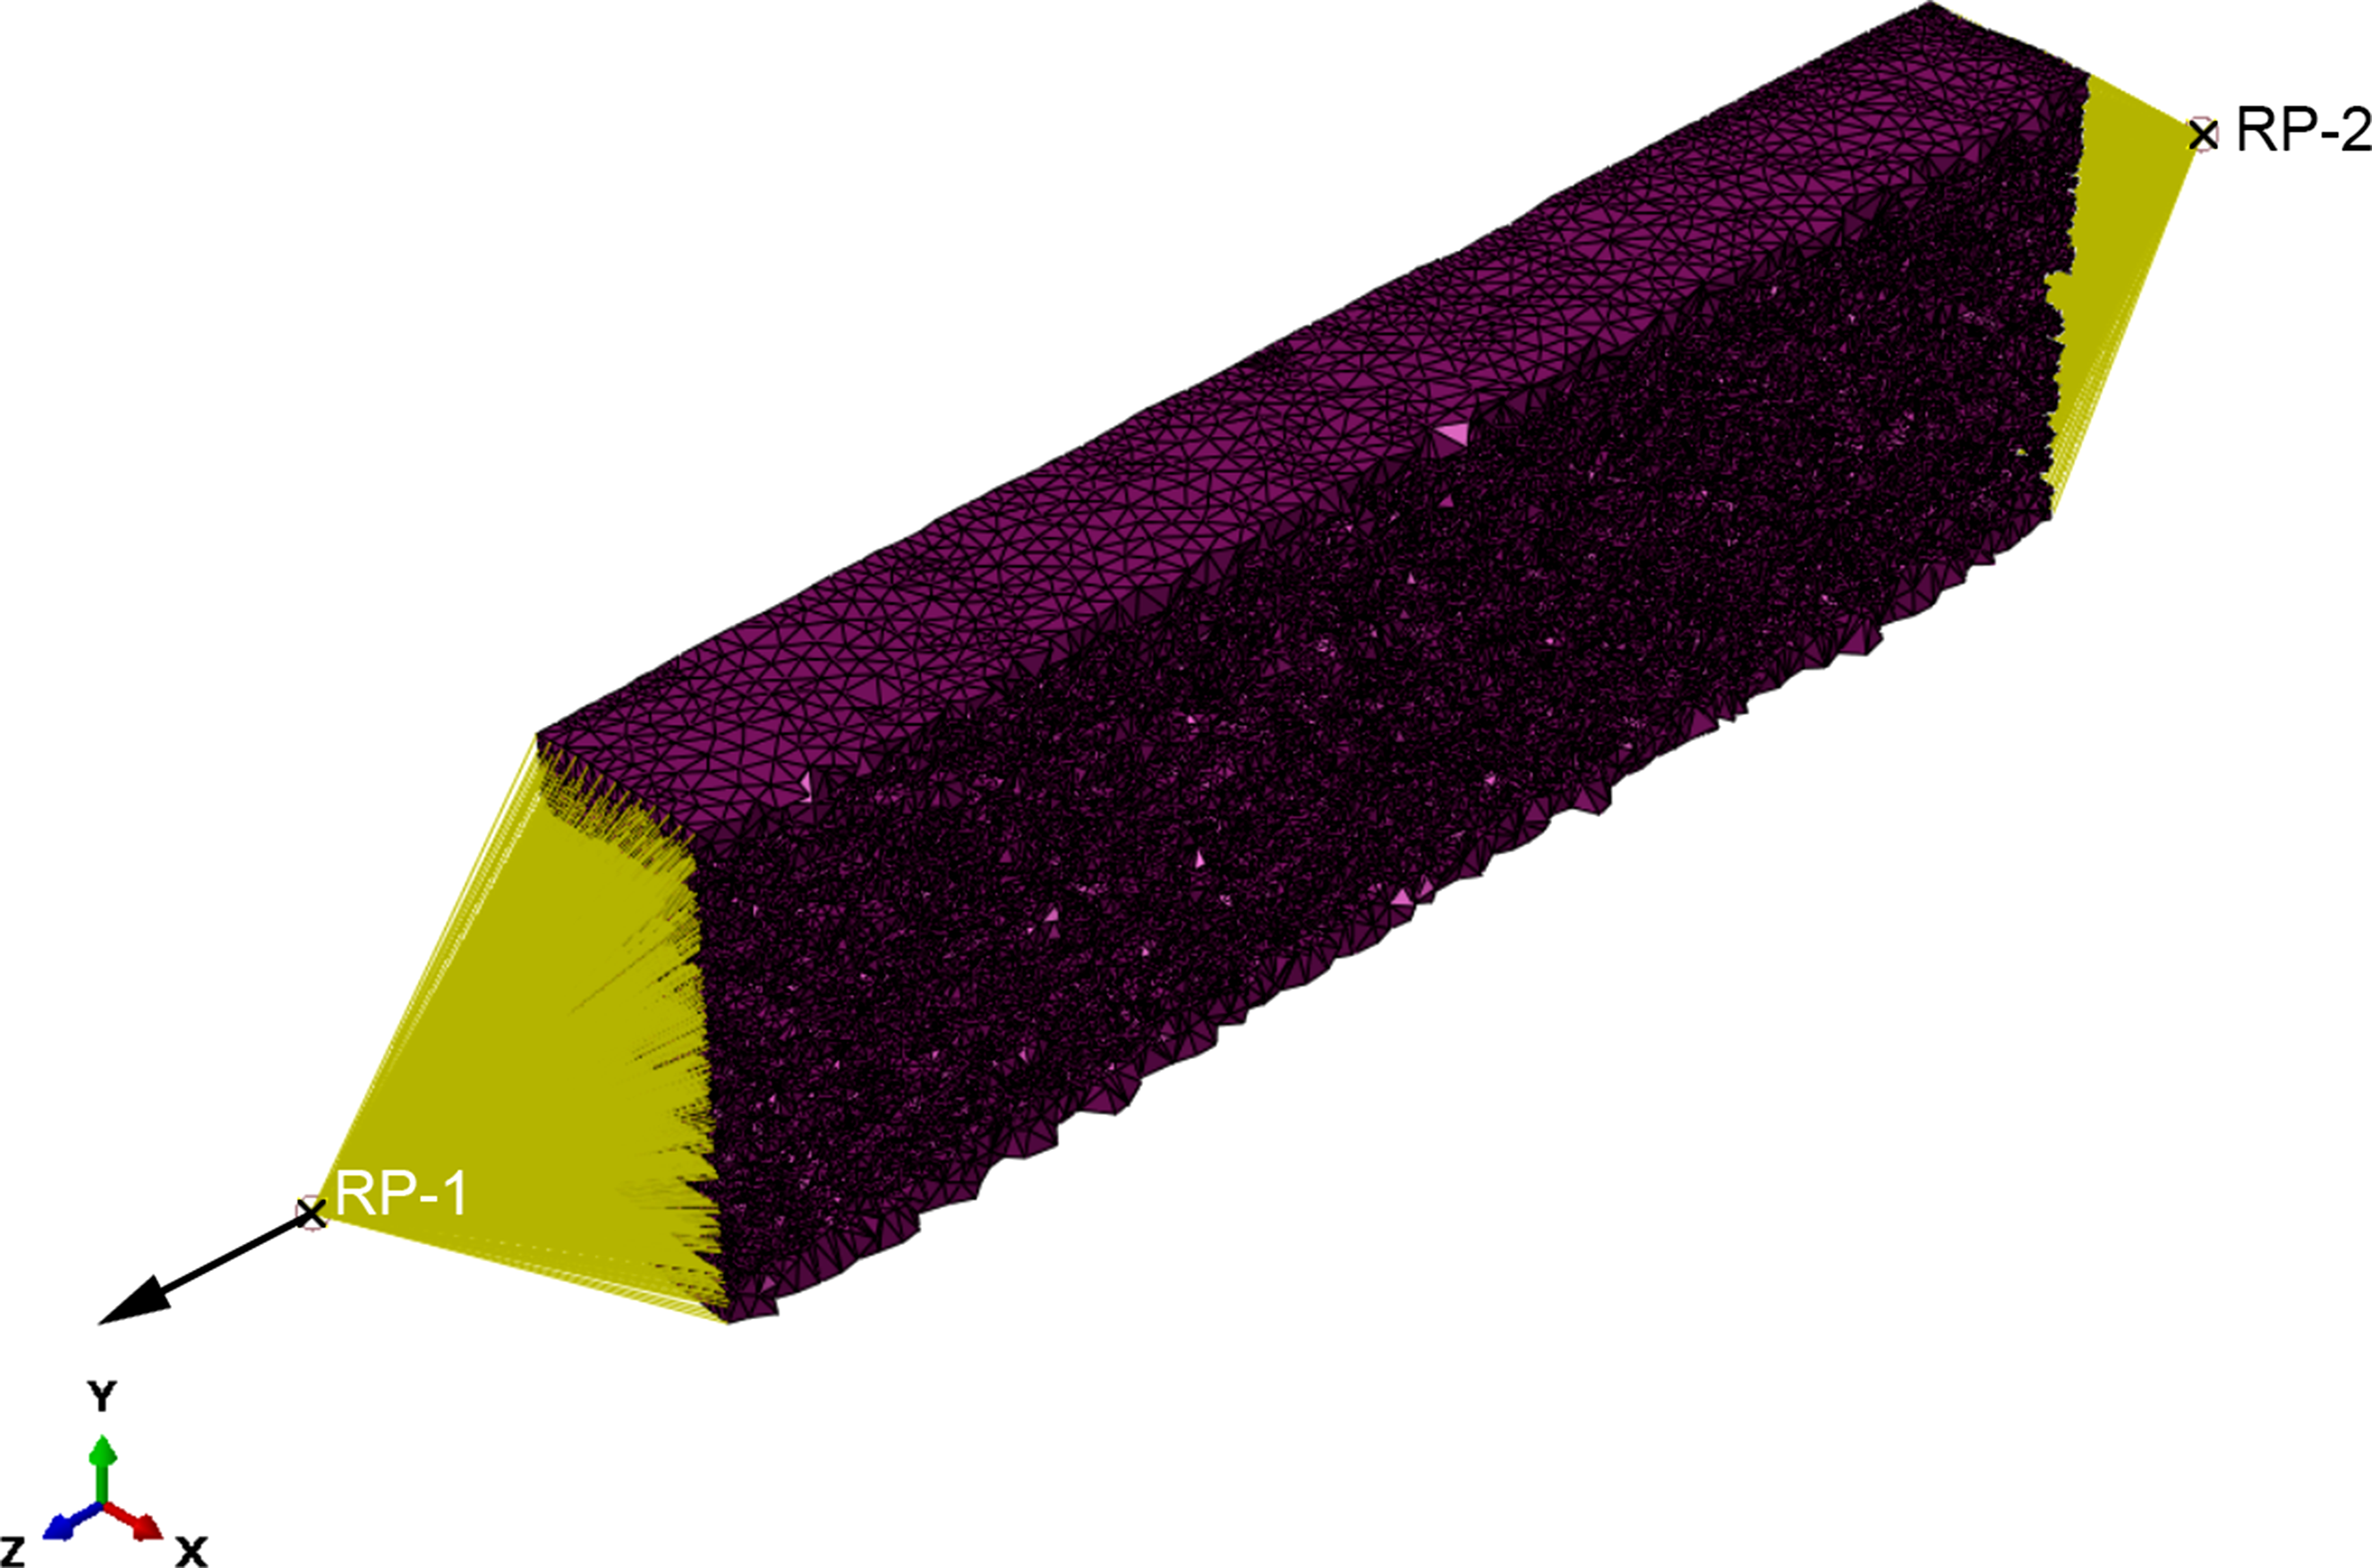
The displacement was applied over a reference point (RP-1), which is connected with a kinematic coupling constraint to the foam. 30 On a second reference point (RP-2), which is equally connected to the foam as RP-1, the clamping was applied (all degrees of freedom were constrained). The tensile test simulations were performed with the dynamic implicit solver.
The simulation set-ups were created for all foam partitions of the sheet samples 1 and 2 (Figure 3).
Results and validation
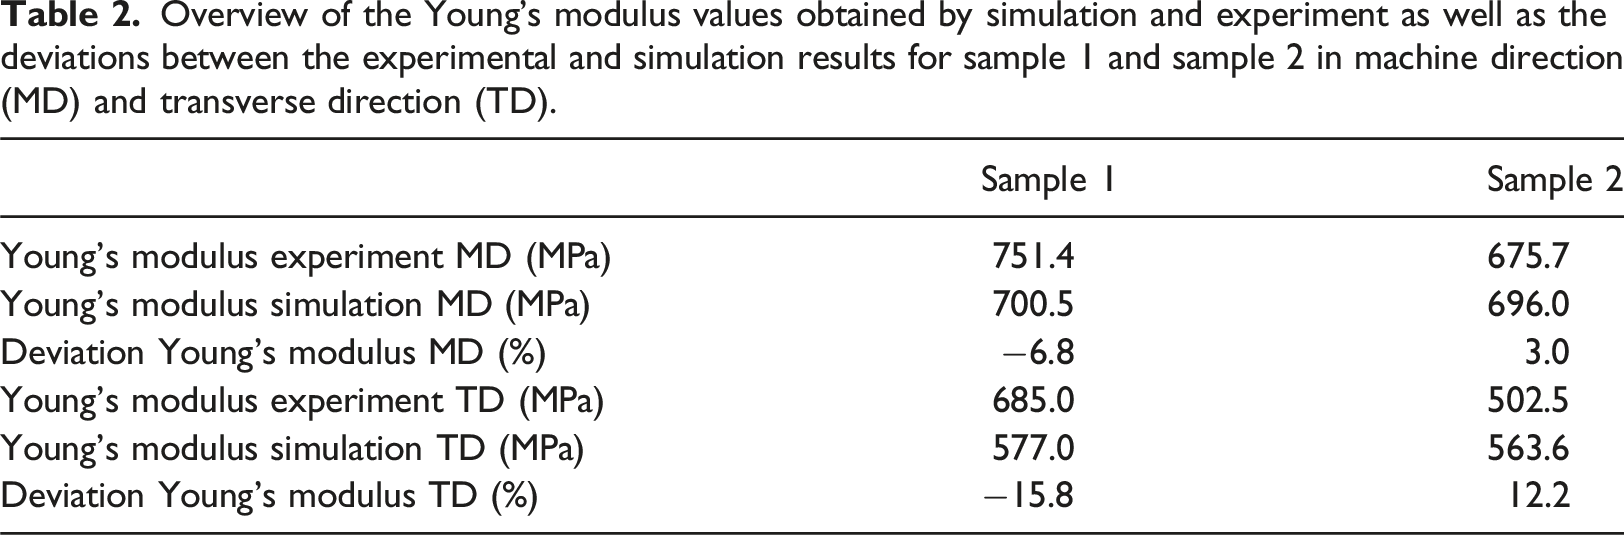
For each foam partition tensile test simulations are performed as described in the previous section. The simulation results were then averaged for each direction (MD and TD) and compared with experimental results. The experimental curves were obtained by performing tensile tests according to ISO 527-1:2012 on a ZwickRoell Z100 testing machine with a 1 kN load cell. For the validation of the simulation results the average of the results of 10 tested samples were used. In Figure 7, the averaged stress-strain curves with standard deviations obtained by simulations and experiments are depicted for the sheet samples 1 and 2. The stress is defined as the ratio of the force to the original cross sectional area of the sample and the strain is the ratio of the displacement to the original length. Comparison of the simulation results with experimental results; stress-strain curves with standard deviations: (a) sheet sample 1 in machine direction (MD), (b) sheet sample 1 in transverse direction (TD), (c) sheet sample 2 in machine direction (MD), (d) sheet sample 2 in transverse direction (TD).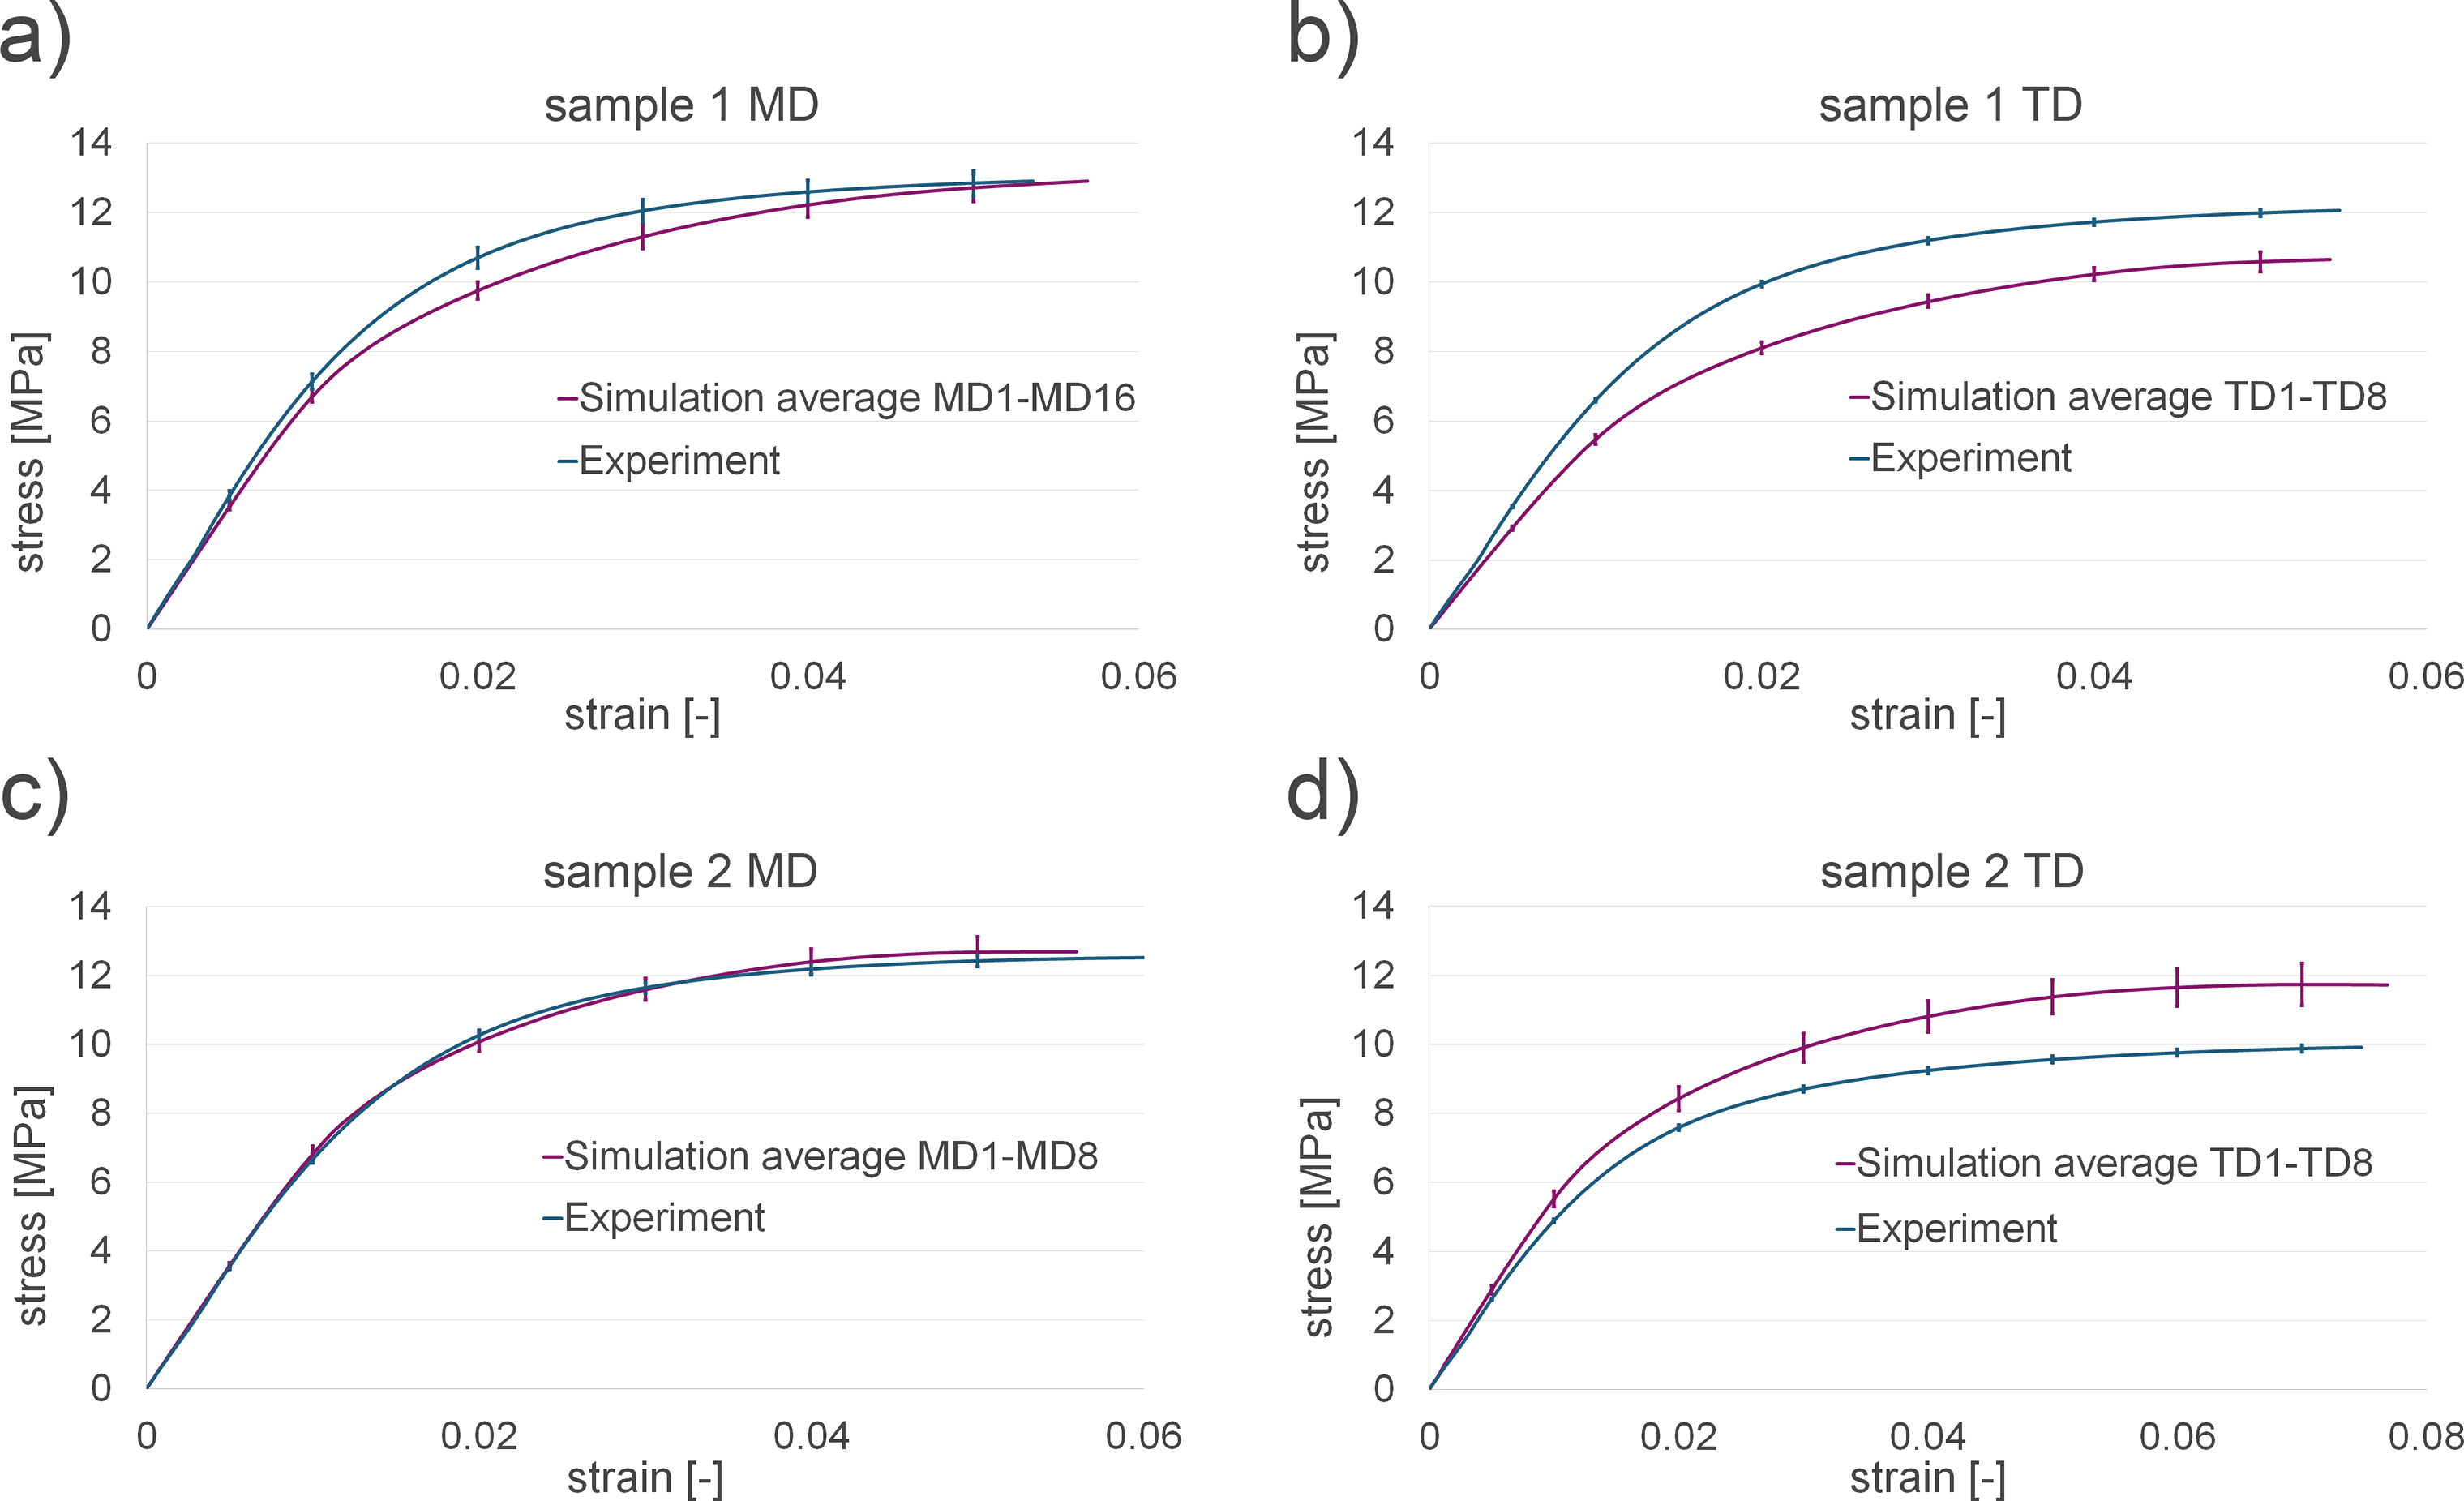
Overview of the Young’s modulus values obtained by simulation and experiment as well as the deviations between the experimental and simulation results for sample 1 and sample 2 in machine direction (MD) and transverse direction (TD).
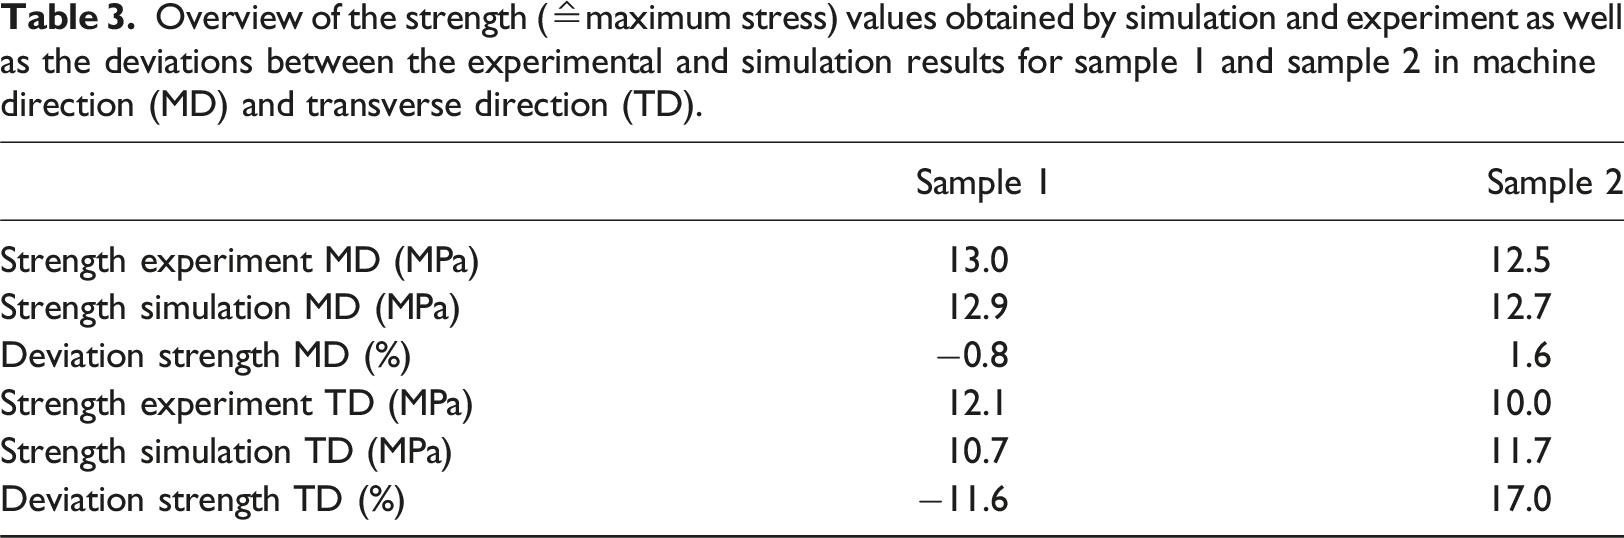
Overview of the strength (≙maximum stress) values obtained by simulation and experiment as well as the deviations between the experimental and simulation results for sample 1 and sample 2 in machine direction (MD) and transverse direction (TD).
It can be seen that for sample 1 the experimental results show a rather isotropic behaviour, whereas the results obtained by simulation are clearly anisotropic. For sample 2, both the experiment and the simulation show an anisotropic behaviour.
From the validation it can be assumed that the behaviour in MD can be estimated correctly with the investigated foam part and simulation method. Therefore, further simulations can be performed using one foam partition in MD to investigate the compression behaviour in MD. The simulations and their results are presented in the next sections.
Stretching simulation
The investigated samples show the microstructure before the thermoforming process. To evaluate the compression behaviour of a thermoformed cup, the microstructure has to be virtually stretched in a similar way as it is stretched during thermoforming. The virtual stretching is necessary as the microstructure of the already stretched thermoformed cups cannot be investigated and modelled, respectively due to the highly deformed foam pores. Foam partition MD16 from sheet sample 1 is successively stretched up to 100% (based on the initial length) to investigate the influence of the degree of stretching on the compression behaviour. The stretching was performed in 5% steps up to a stretching of 20% and then in 10% steps. Thus, specimens could be created at multiple stretching degrees. In the next sections, the used material model and the simulation set-up are explained.
Material model
The material model used for the stretching simulations is purely linear elastic. This was chosen because the simulation time is lower and only the geometry of the microstructure is important and not the strains and stresses acting on the foam partition during stretching. For the skins (PP type 1) and core (mixture) of the foam partition MD16 the Young’s modulus and Poisson’s ratio values are the same as used for the tensile test simulations (PP type 1: E = 1500 MPa, ν = 0.4 and mixture: E = 1635 MPa, ν = 0.4).
Simulation set-up
The simulation set-up was chosen to imitate the thermoforming process in a simplified way. In Figure 8, the applied boundary conditions in the stretching simulation are depicted. Illustration of the applied boundary conditions in the stretching simulation, a) boundary conditions on reference points, b) boundary conditions on outer nodes on the xy-plane.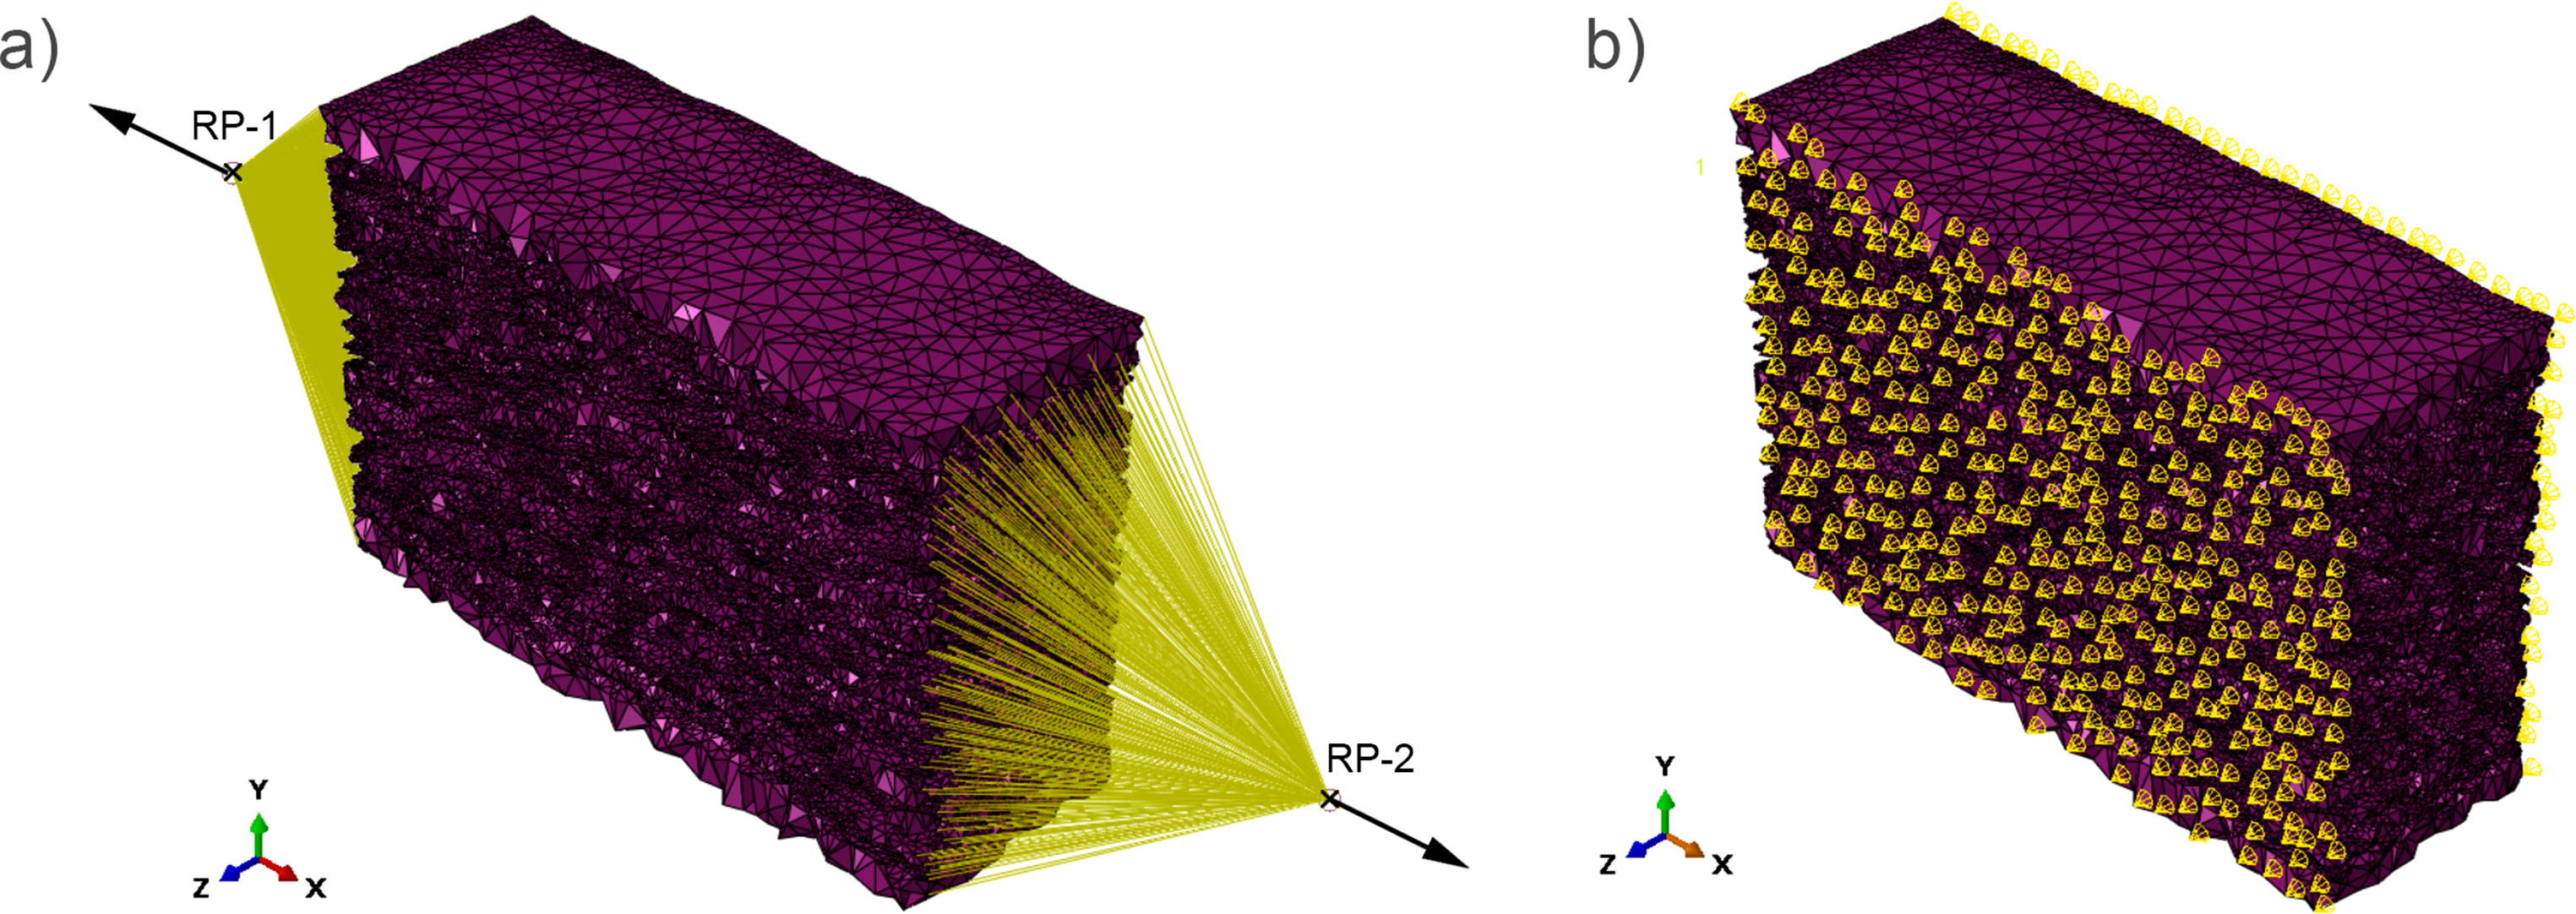
In Figure 8 (a), the displacements applied on reference points (RP-1 and RP-2) placed on both sides of the foam partition are illustrated. Similar as in the tensile tests, the reference points and the foam partition are connected with a kinematic coupling constraint to the foam. 30 In Figure 8 (b), a further boundary condition is shown, where the degree of freedom in z-direction is blocked at the outer nodes on the xy-plane of the foam partition in order to avoid necking in this direction. This was assumed because the foam is also stretched in z-direction during thermoforming, but the ratio between the stretching in x- and z-direction is unknown and would need further experimental investigation. Linear tetrahedral elements (element type in Abaqus: C3D4) and the dynamic implicit solver were used.
Results
In Figure 9, the result of the stretching simulation of the sheet sample stretched by approximately 40% is shown as an example for all stretched configurations. The stretching was not exactly the given stretching, as this was not possible from a simulation point of view. In this case, the stretching was 40.3%. Illustration of the result of the stretching simulation of the sheet sample stretched by 40 % as an example for all stretched configurations.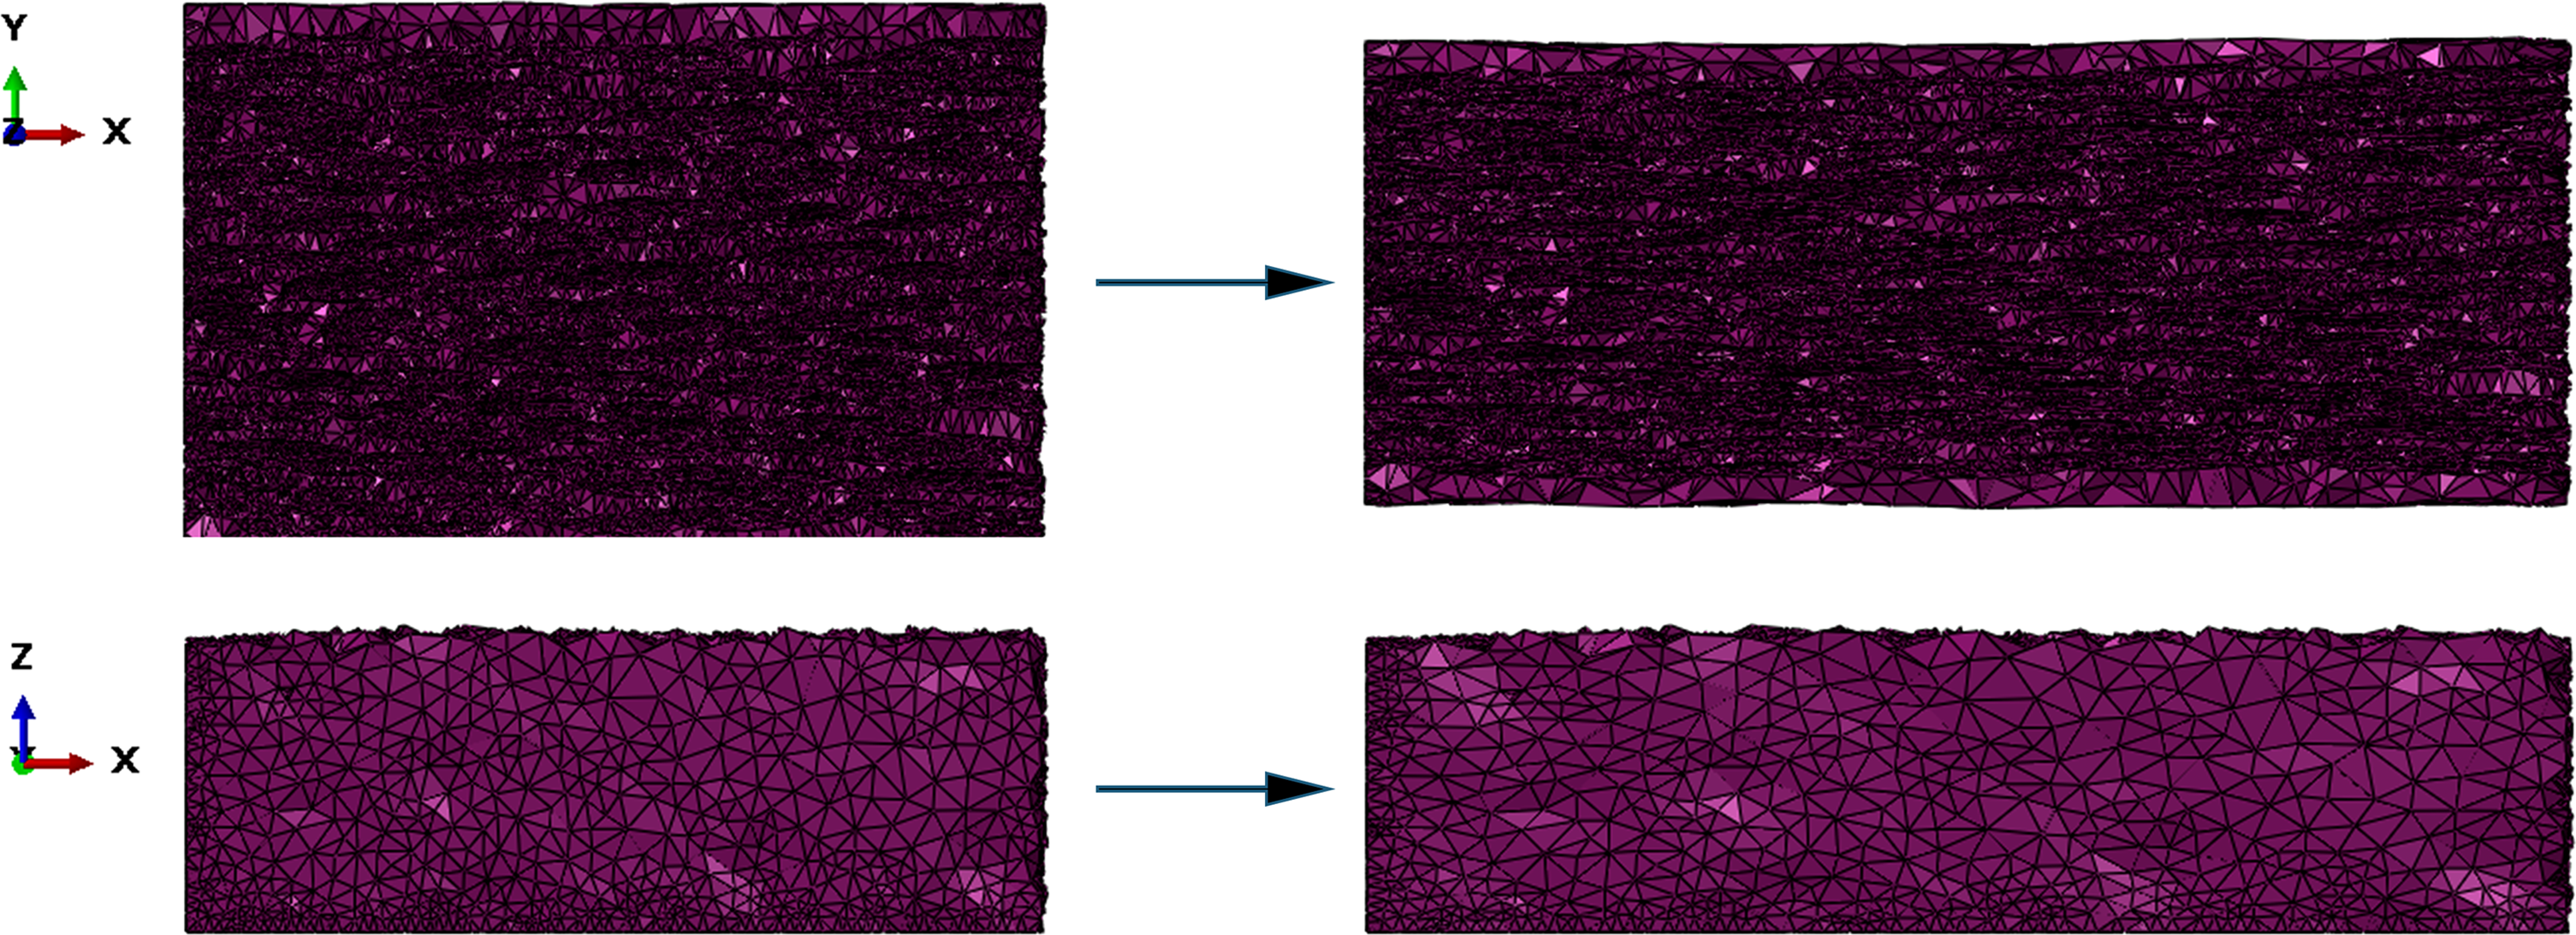
The stretched configurations of the sheet sample were used to perform compressive test simulations. There, it was observed that at a certain stretching (40%) the foam buckles under compression load. The buckling prevents the comparability of the compressive test results and therefore the stretched samples were shortened to the length of the original foam geometry. This is schematically depicted in Figure 10 for the foam stretched by 40%. Illustration of the shortening of the sheet sample stretched by 40 %.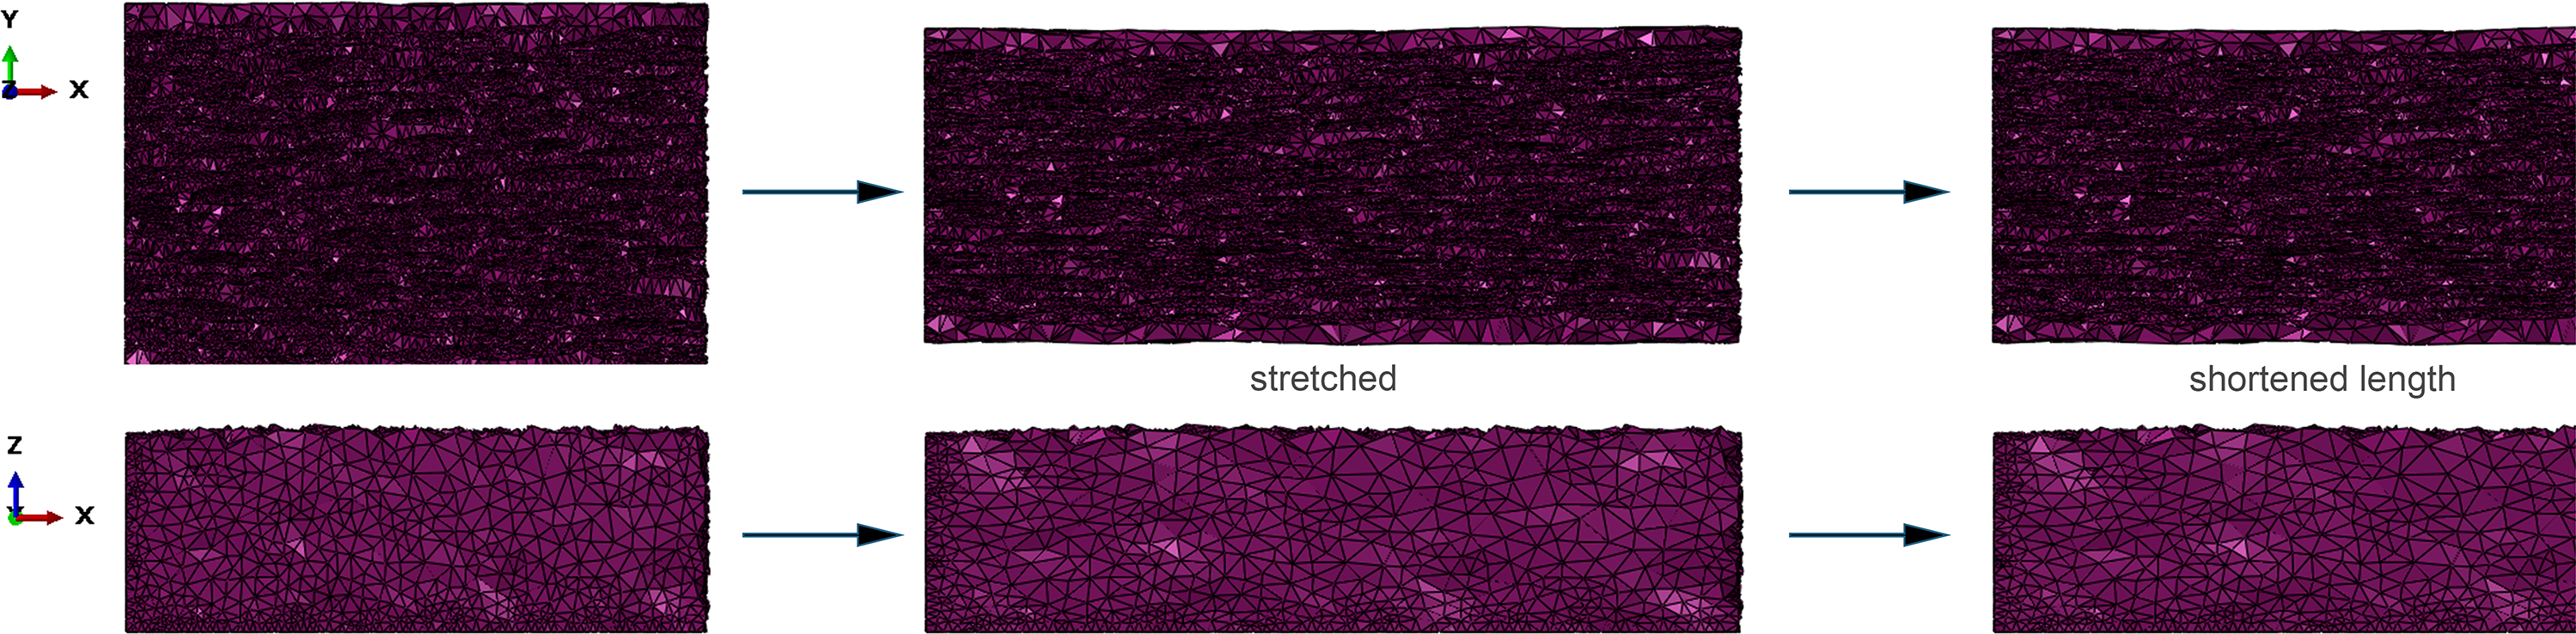
The foam is stretched and then the elements were simply deleted so that the length of the sample is similar to the length of the unstretched sample. The stretched and shortened sheet sample configurations were then used for the compressive test simulations.
Compressive test simulation
In this section, the compressive test simulations performed in Abaqus of the unstretched and stretched configurations of sheet sample 1 are described. The simulation results were used to investigate the influence of foam stretching, so the thermoforming process, on the compression behaviour.
Material model
The material models for the compressive test simulations are the elastic plastic models for the PP type 1 and the mixture used for the tensile test simulations (PP type 1: E = 1500 MPa, ν = 0.4, yield stress = 18 MPa and mixture: E = 1635 MPa, ν = 0.4, yield stress = 18.5 MPa).
Simulation set-up
The original foam structure and the stretched and shortened configurations of sheet sample 1 were used for the compressive test simulations. Due to the compression load, the elements were chosen to be quadratic tetrahedra (element type in Abaqus: C3D10M). In Figure 11, the simulation set-up is depicted. Illustration of the compressive test simulation set-up.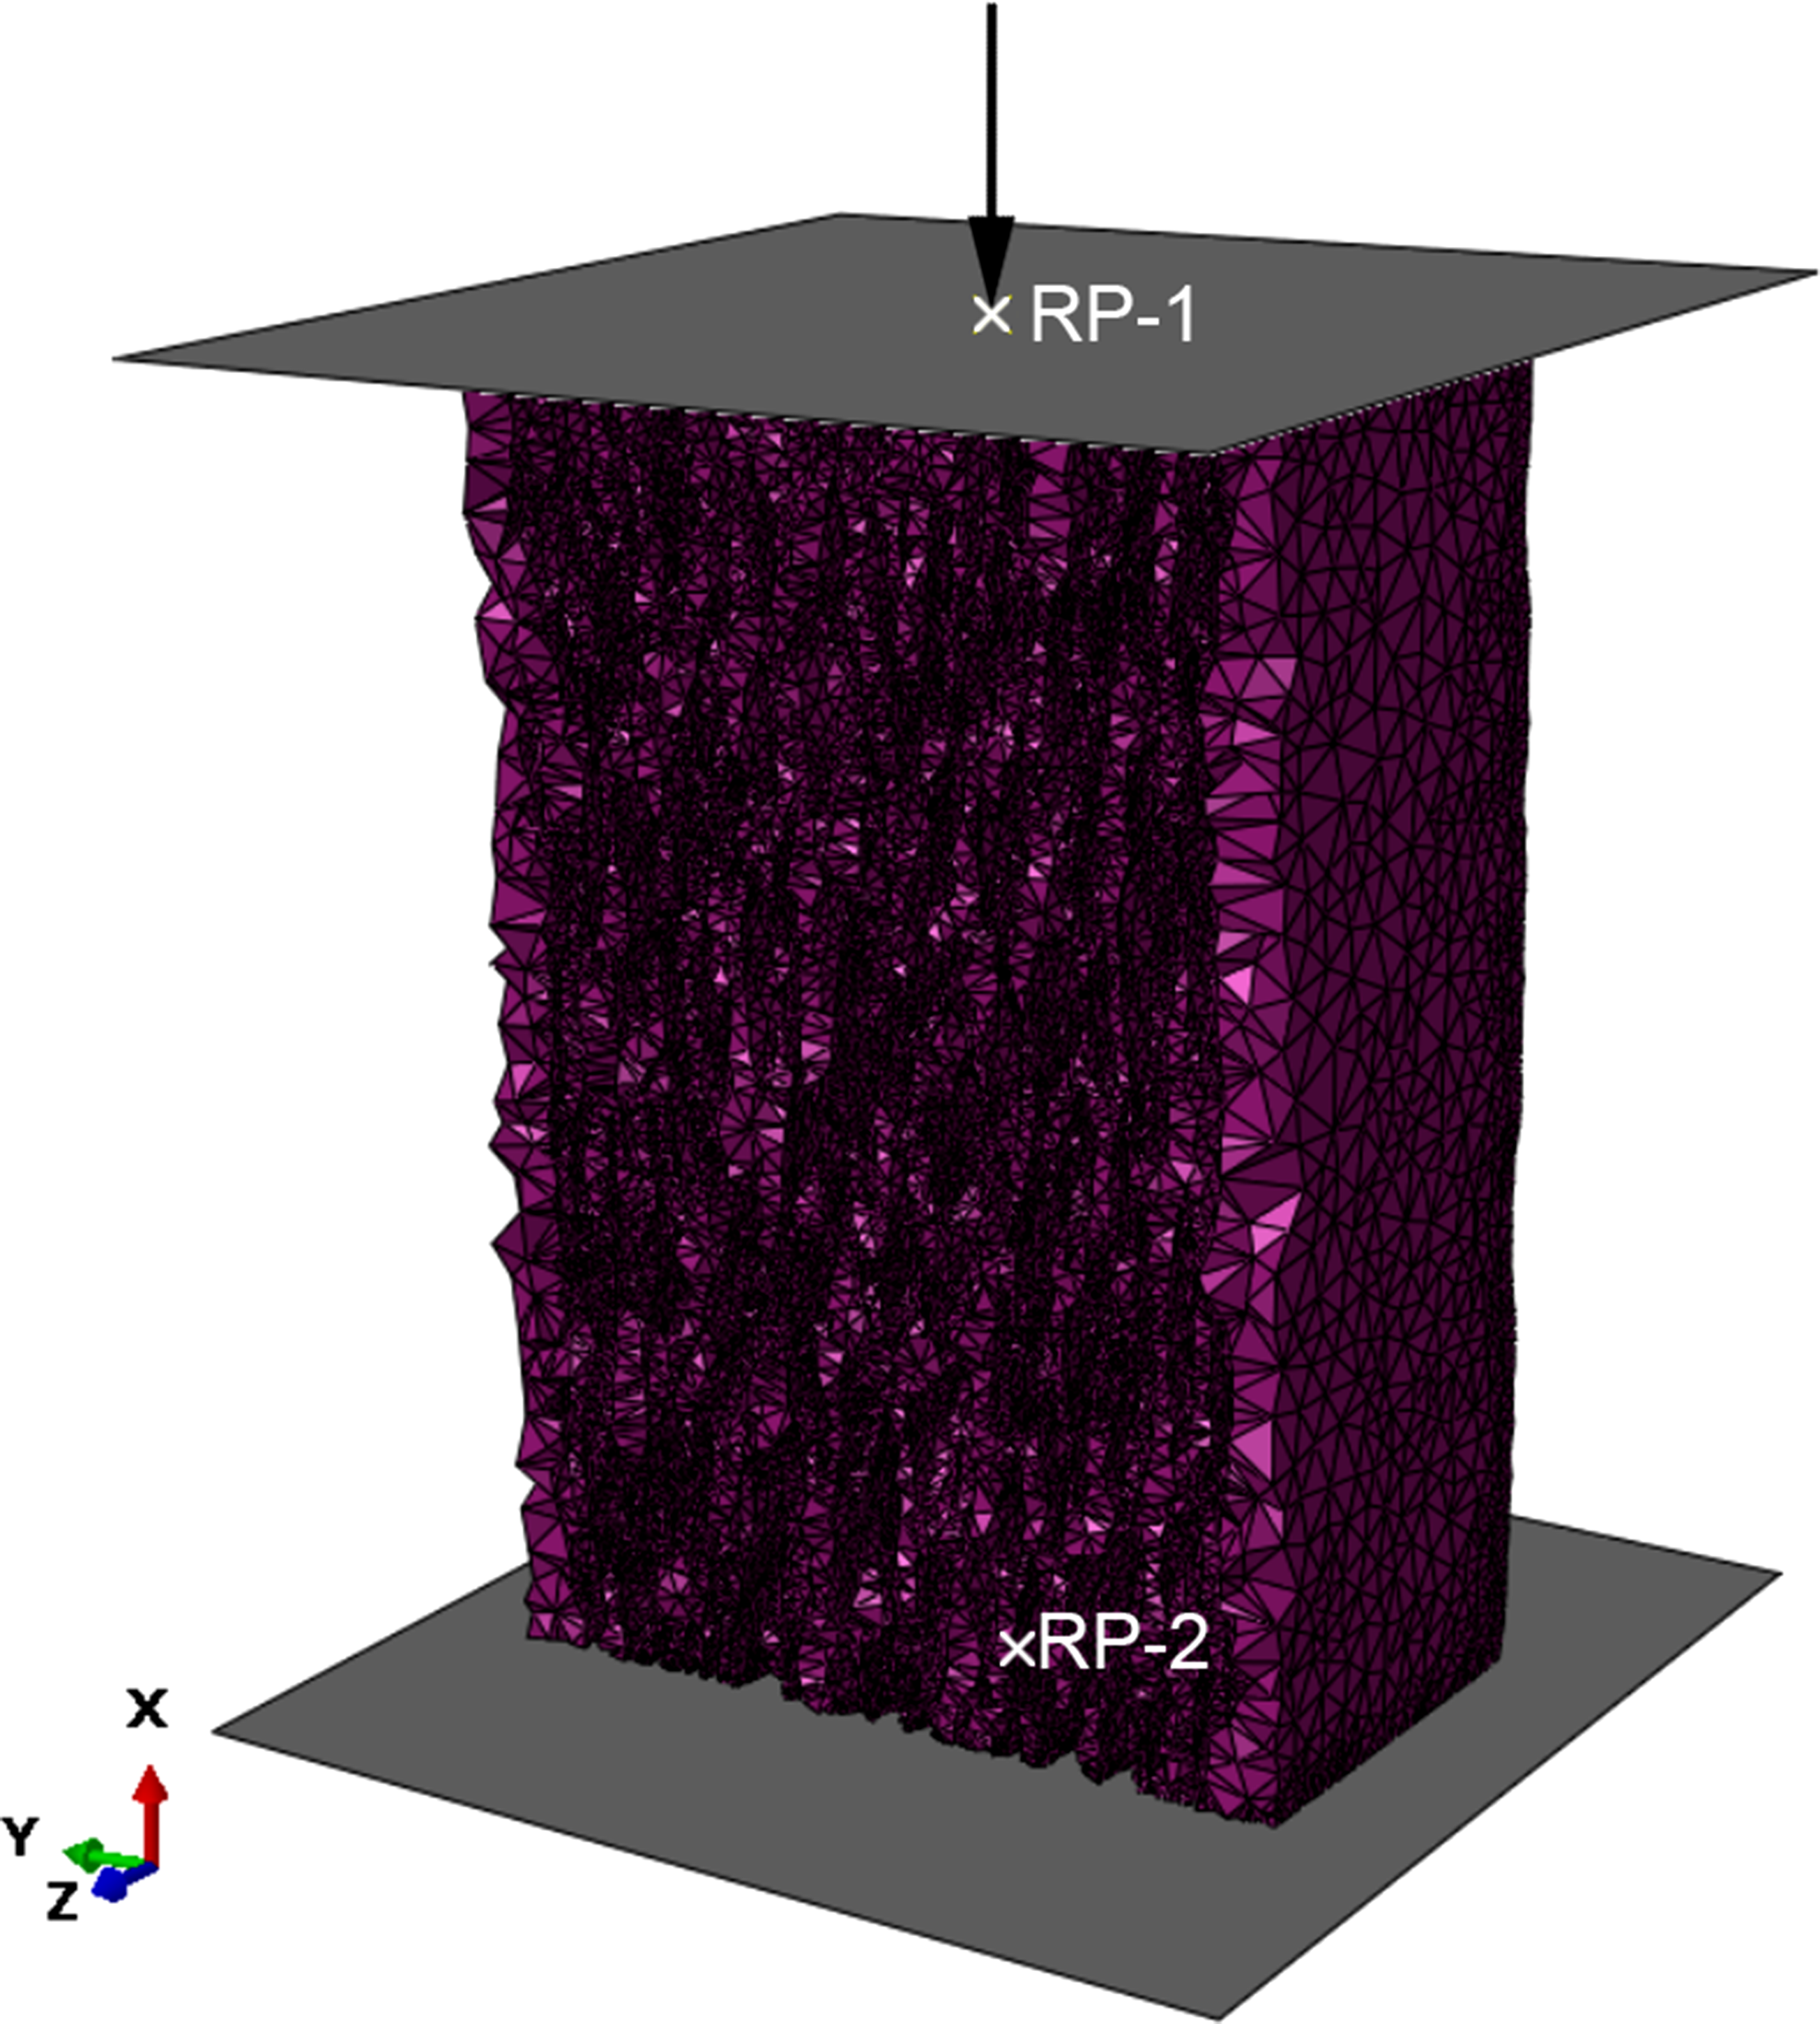
Analytical rigid plates were modelled, where the upper plate is used for transferring the displacement in MD (x-direction) to the sheet sample and the lower plate functions as support. On the upper plate, all degrees of freedom are blocked except in x-direction and the movement of the lower plate is blocked in all directions. These boundaries conditions are used to mimic a real experimental compressive test. A contact between the plates and the foam itself had to be modelled. For this, the explicit solver was selected so that the general contact definition could be used, which enables the contact between all components. The contact properties were the follows: a tangential behaviour with a friction coefficient of 0.3 and a normal behaviour with the ”hard-contact” option. 30 With this set-up, compressive test simulations are performed with the original foam sheet sample and with the stretched and shortened configurations. The results are shown and discussed in the next section.
Results
In Figure 12, the resulting stress-strain curves of the compressive test simulations are depicted. The stresses and strains are defined in the same way as for the tensile test simulation results. Resulting stress-strain curves of the compressive test simulations of the original foam sheet sample (0 % stretching) and the stretched and shortened configurations.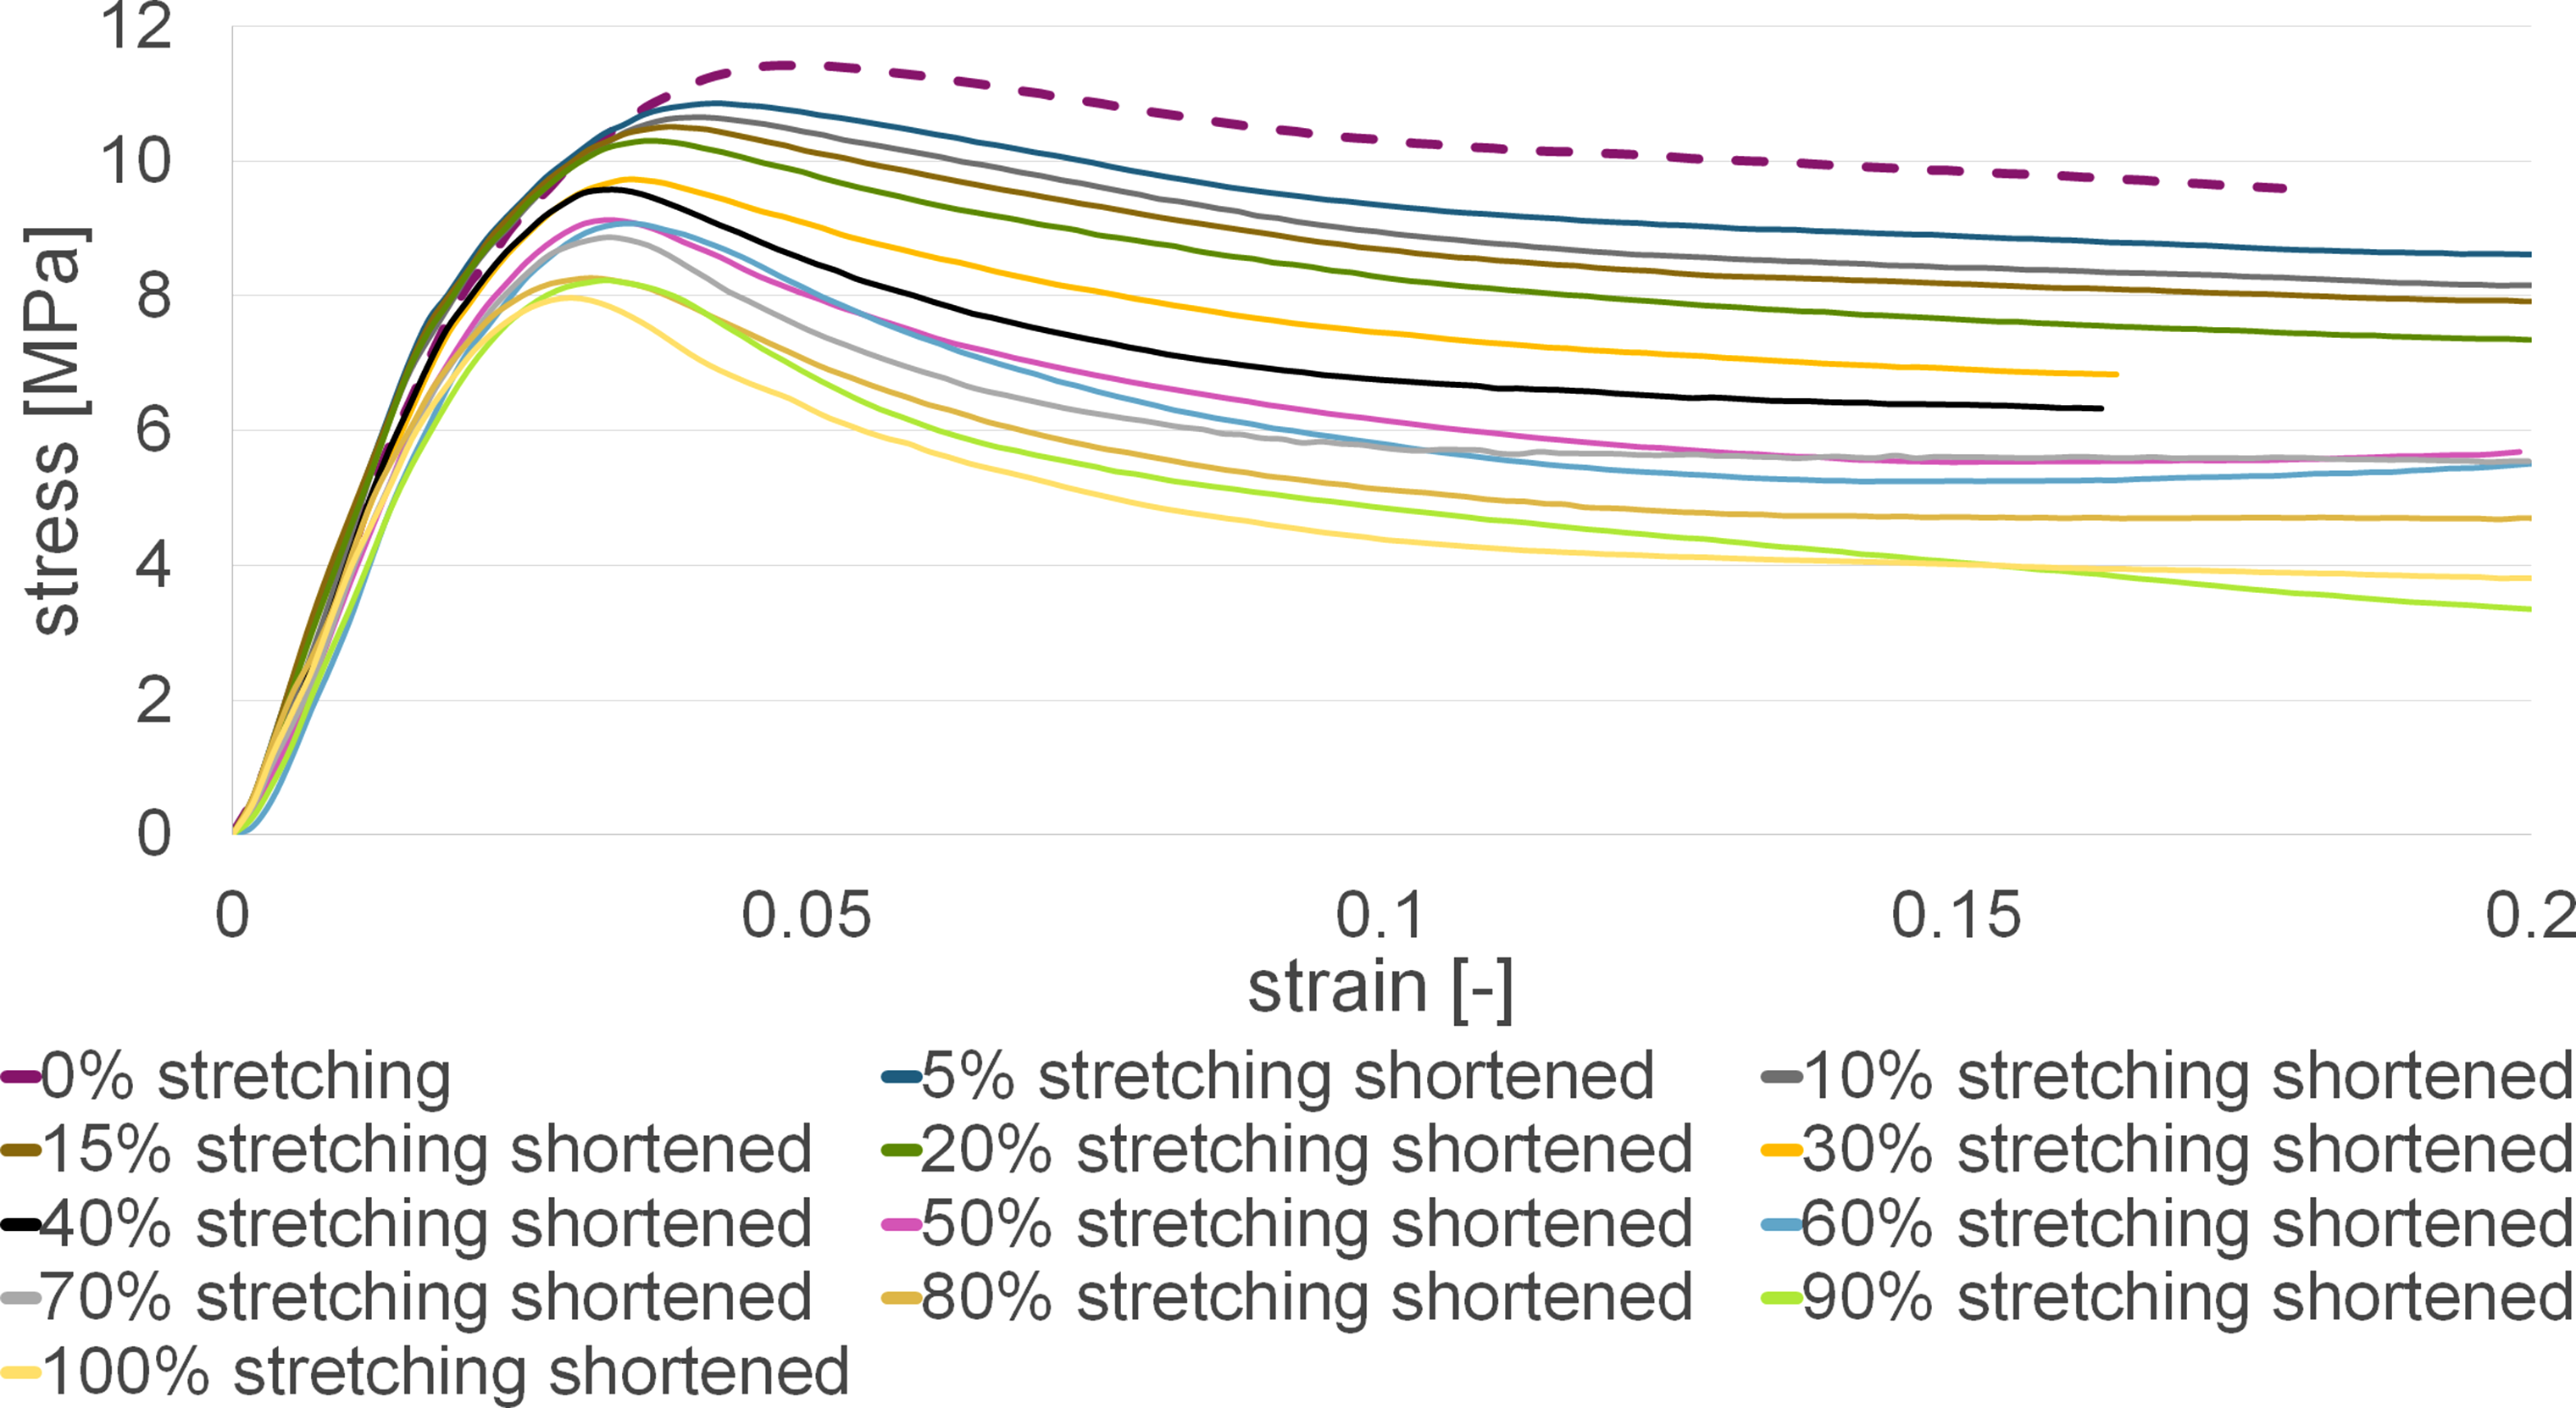
Moreover, in Figure 13 the Young’s modulus and strength (≙maximum stress) values including the average values are depicted. Illustration of the a) Young’s modulus and b) strength (≙maximum stress) values including the average values.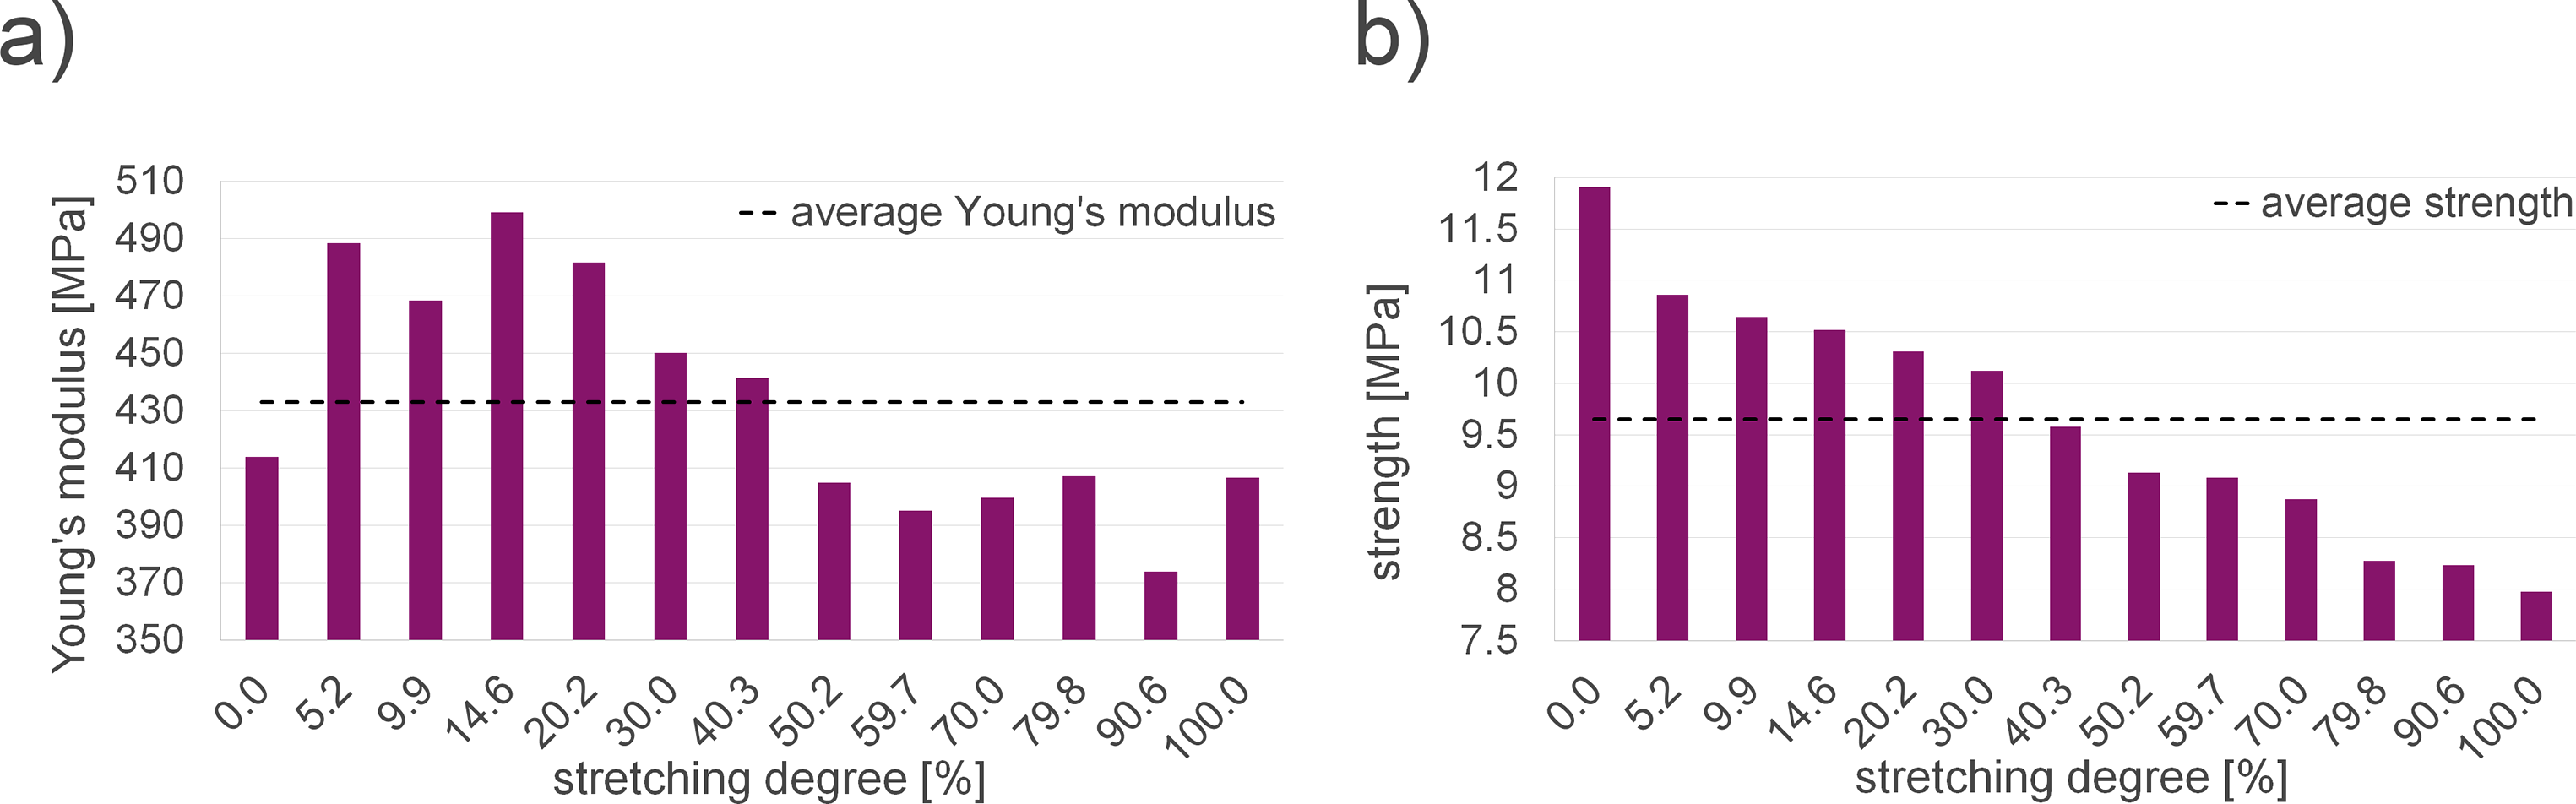
No clear trend regarding the influence of the stretching degree on the Young’s modulus is observed. At a stretching degree between 5% and 40% the Young’s modulus is slightly higher than the Young’s modulus of the original foam structure. At a stretching degree of approximately 50% and higher the Young’s modulus is similar to the Young’s modulus of the original foam structure. For the strength it can be seen that the higher the stretching degree, the lower the strength, which is in agreement with the real life observation. The strength of the sample stretched by 100% is over 30% lower than the strength of the original sample. These results explain why the hot cups have limited compressive strength and can help to evaluate an appropriate stretching degree in order to obtain sufficient compressive strength of the cup.
Conclusion
In this research, a simulation method was introduced to investigate the compression behaviour of two foamed sheet samples used for thermoformed cups as these cups show limited compressive strength. The simulation models of the samples were obtained directly from CT measurement results using the modelling approach described in Hössinger-Kalteis et al. (2021). 29 Tensile test simulations were performed with the finite element models in MD as well as TD and validated with experimental results to evaluate if the investigated foam parts are representative for the whole sheet samples. This was necessary because both sheet samples show a highly irregular microstructure. The simulation results in MD are in good agreement with the experimental results, whereas in TD, deviations between the simulation and experimental results are observed. This means, that the investigated foam microstructure differs from the overall foam structure in TD. Thus, it would be necessary to examine further cut-outs of the sheet samples to estimate the behaviour in TD more accurate. Nevertheless, it can be concluded that the simulation methodology is suitable to predict the tension behaviour of the sheet samples, despite the very irregular microstructure, as the deviations between simulation and experiment are a maximum of 17%, which is still an acceptable result from a simulation point of view.
In a next step, a simulation model of sheet sample 1 was successively virtually stretched in a simplified way to obtain a microstructure which is similar to the microstructure of a thermoformed cup. With the stretched configurations the influence of the stretching degree on the compression behaviour was evaluated. The simulation results showed that the stretching degree has great influence on the compressive strength: the higher the stretching degree, the lower the compressive strength. This means, that due to the thermoforming process the compressive strength of the foam is reduced leading to poor compression properties of the cups. In future research, the presented simulation method and the presented findings can be used to adjust the thermoforming process to obtain cups with sufficient compressive strength.
Footnotes
Author’s note
The COMET program is managed by the Austrian Research Promotion Agency (FFG).
Declaration of conflicting interests
The authors declared no potential conflicts of interest with respect to the research, authorship, and/or publication of this article.
Funding
The authors disclosed receipt of the following financial support for the research, authorship, and/or publication of this article: This research was funded within the COMET - Competence Centers for Excellent Technologies program by the BMK, the BMDW, and the Federal Provinces of Upper Austria and Vienna (grant number 868615).