
Abstract
In this research study, a methodology is introduced for generating finite element simulation models for low density closed cell foams based on computed tomography (CT) measurement results. Creating this kind of simulation models can be very expensive with regard to modelling and computational effort. Hence, a combined modelling technique based on CT data and Voronoi diagrams is developed that minimizes this effort, but nevertheless, generates simulation models with a realistic microstructure. In this article, the generation of simulation models using this modelling method and the necessary adaptation of the models concerning microstructural features to consider, for example, anisotropic properties of the foam, are described. Furthermore, simulations are performed to investigate the mechanical performance of the foam models and to compare the results with several analytical models and experimental data. Finally, conclusions regarding the applicability and possible further extensions of the model are provided.
Introduction
Foams are utilized in a broad field of applications1–10 and can be manufactured by various processes (e.g. extrusion or injection moulding).
11
Depending on the process and its parameters, the foam microstructure
12
and therefore the foam properties
1
vary. To determine these properties, several modelling approaches are presented in literature. Two main modelling approaches for foams can be found: direct and constitutive modelling.13,14 The difference is the description of the foam microstructure. The constitutive methods model the microstructure by a homogeneous medium whereas it is described in detail in the direct modelling approach. Direct models can be obtained, for example, by Voronoi diagrams which are a special space division technique and tessellation method, respectively.15,16 The basic procedure of generating 3D Voronoi diagrams is the following14,17–19: Seed points which are representative for the nucleation points of the foam cells are randomly arranged in a construction domain spheres (3D) or circles (2D) (with equal sizes) are placed on the seed points and start to grow simultaneously with a uniform growth speed and stop once the cells are in contact or the space is completely filled symmetry planes are formed between individual spheres/circles and their adjacent ones the intersection of these planes forms convex, non-overlapping polyhedra with planar faces which represent the foam microstructure.
The random arrangement of the seed points in the classical Voronoi approach, for example, with the Poisson point process19,20 leads to geometric deviations from the real foam microstructure, for example, the cell sizes are almost uniform. 21 To better approximate the geometry of real foams, several variations of the classical Voronoi tessellation were developed, for example, the Voronoi diagram with Laguerre geometry16,21–27 (implementation of cell size distribution) and the set Voronoi diagram28,29 (implementation of anisotropic cell shape).
In this study, a direct modelling procedure for closed cell foams is developed and utilized for generating models for low density extrusion foams. The modelling technique is based on classical Voronoi diagrams allowing for the modelling of thin foam cell walls, which are present in the investigated extrusion foams. The Voronoi diagram approach is combined with computed tomography (CT) measurements. This enables the development of models with moderate effort but with a microstructure that includes several properties of the real foam (e.g. cell size distribution).30,31 Linear elastic finite element simulations are performed with the obtained models and the results are compared with results from experiments and several selected analytical models. Based on the comparison, the model is recalibrated to better describe the microstructure of the real foam.
Modelling methodology
In the following section, the methodology of generating a 3D shell model of a closed cell low density foam utilizing Voronoi diagrams and CT data is described. An overview of the approach is shown in Figure 1. Overview of the modelling methodology including the implementation of microstructural features (highlighted in purple).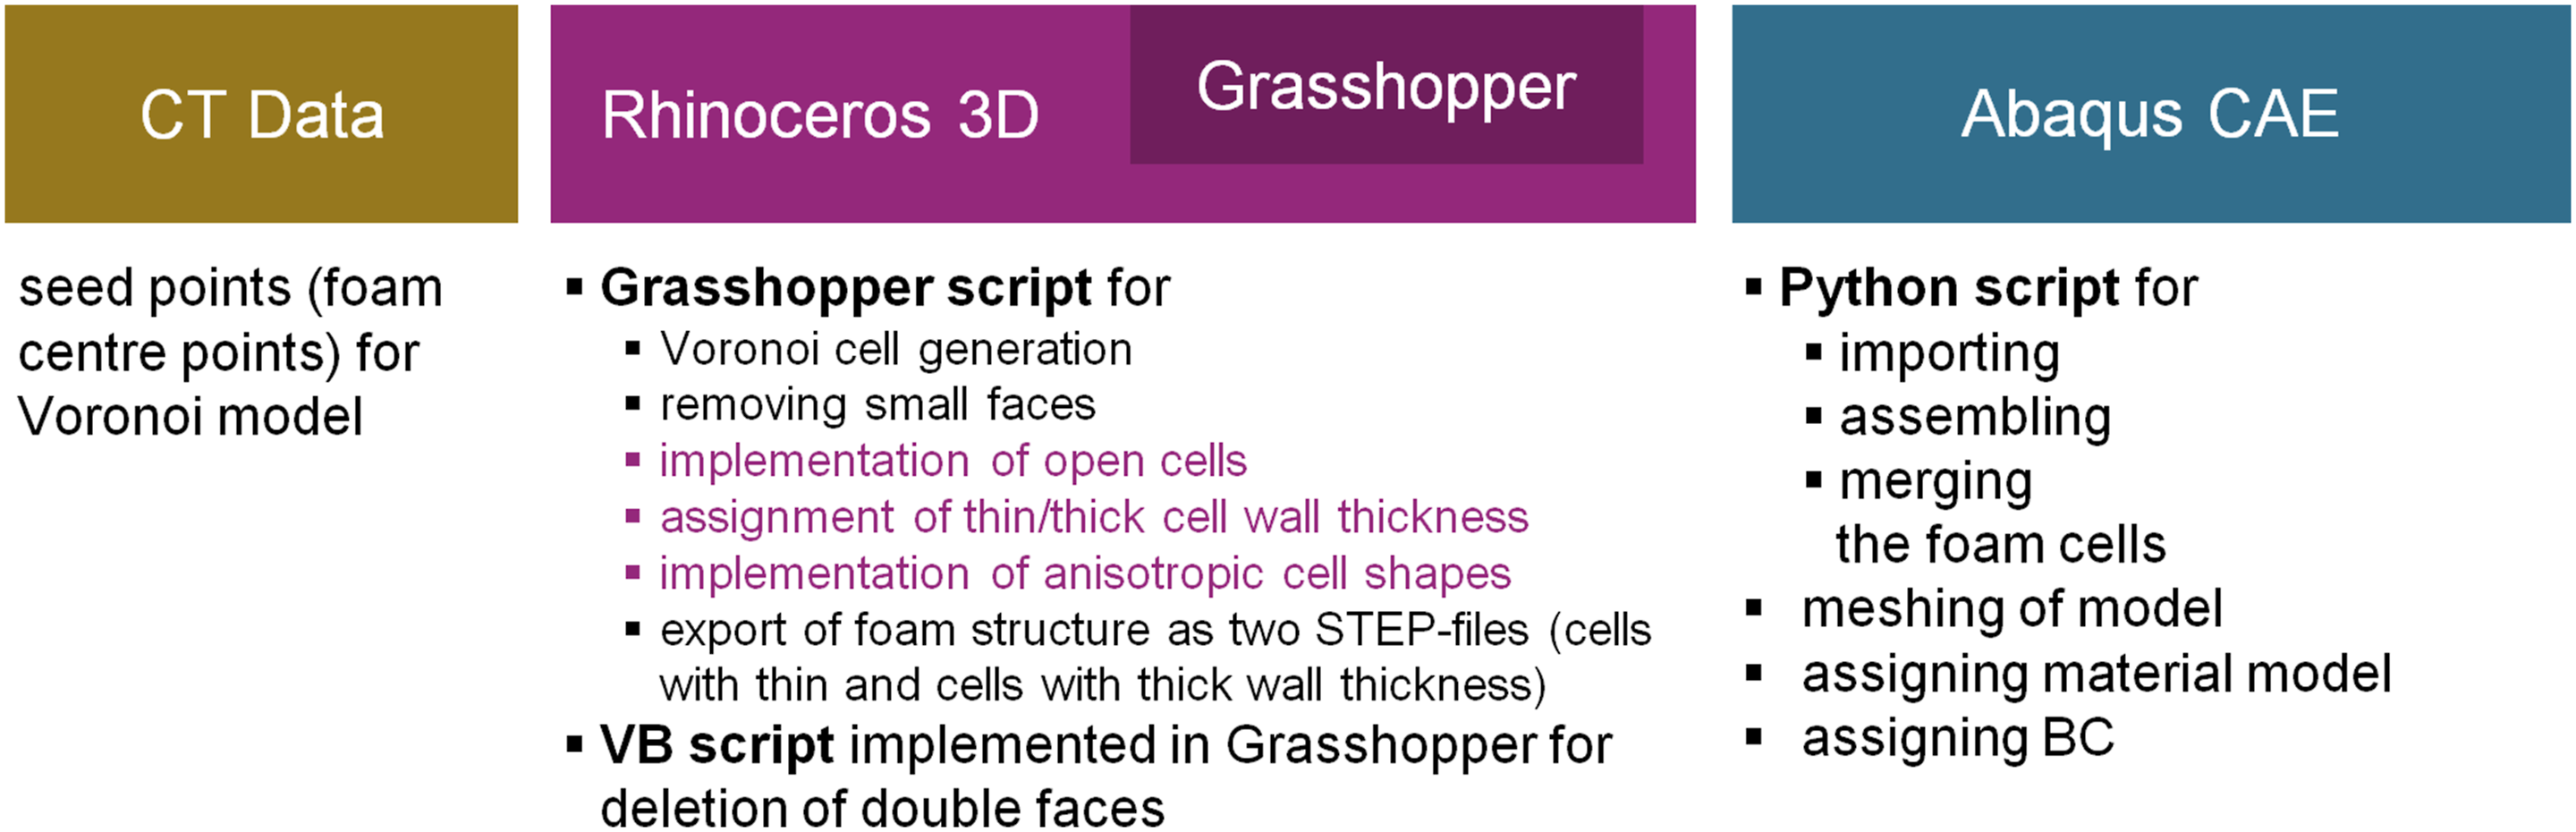
The text highlighted in purple denotes the necessary modifications of the modelling approach described in this section. The details of these modifications are given in section ‘Improved modelling methodology’.
The Voronoi diagrams are created in the software Rhinoceros 3D (Robert McNeel and Associates) and its plug-in Grasshopper. To obtain a cell size distribution like in the real foam microstructure, the foam cell centre points, which are obtained from CT measurements, are utilized as seed points. The centre points are determined in the same way as described in Kastner et al.
32
A global threshold method is applied for the separation of cells and polymer. The threshold is chosen such that the air to polymer ratio fits to the measured material density. For cell segmentation, a watershed approach is used to transfer each cell into a separated object. This enables the calculation of morphological details for each object.
32
The construction domain for the Voronoi cell generation is the CT measurement range, its dimensions are approximated from the largest x-, y- and z-coordinates from the centre points. In Grasshopper, closed Voronoi cells are created from each seed point, resulting in double faces between two adjacent cells (Figure 2). Double face between two adjacent cells.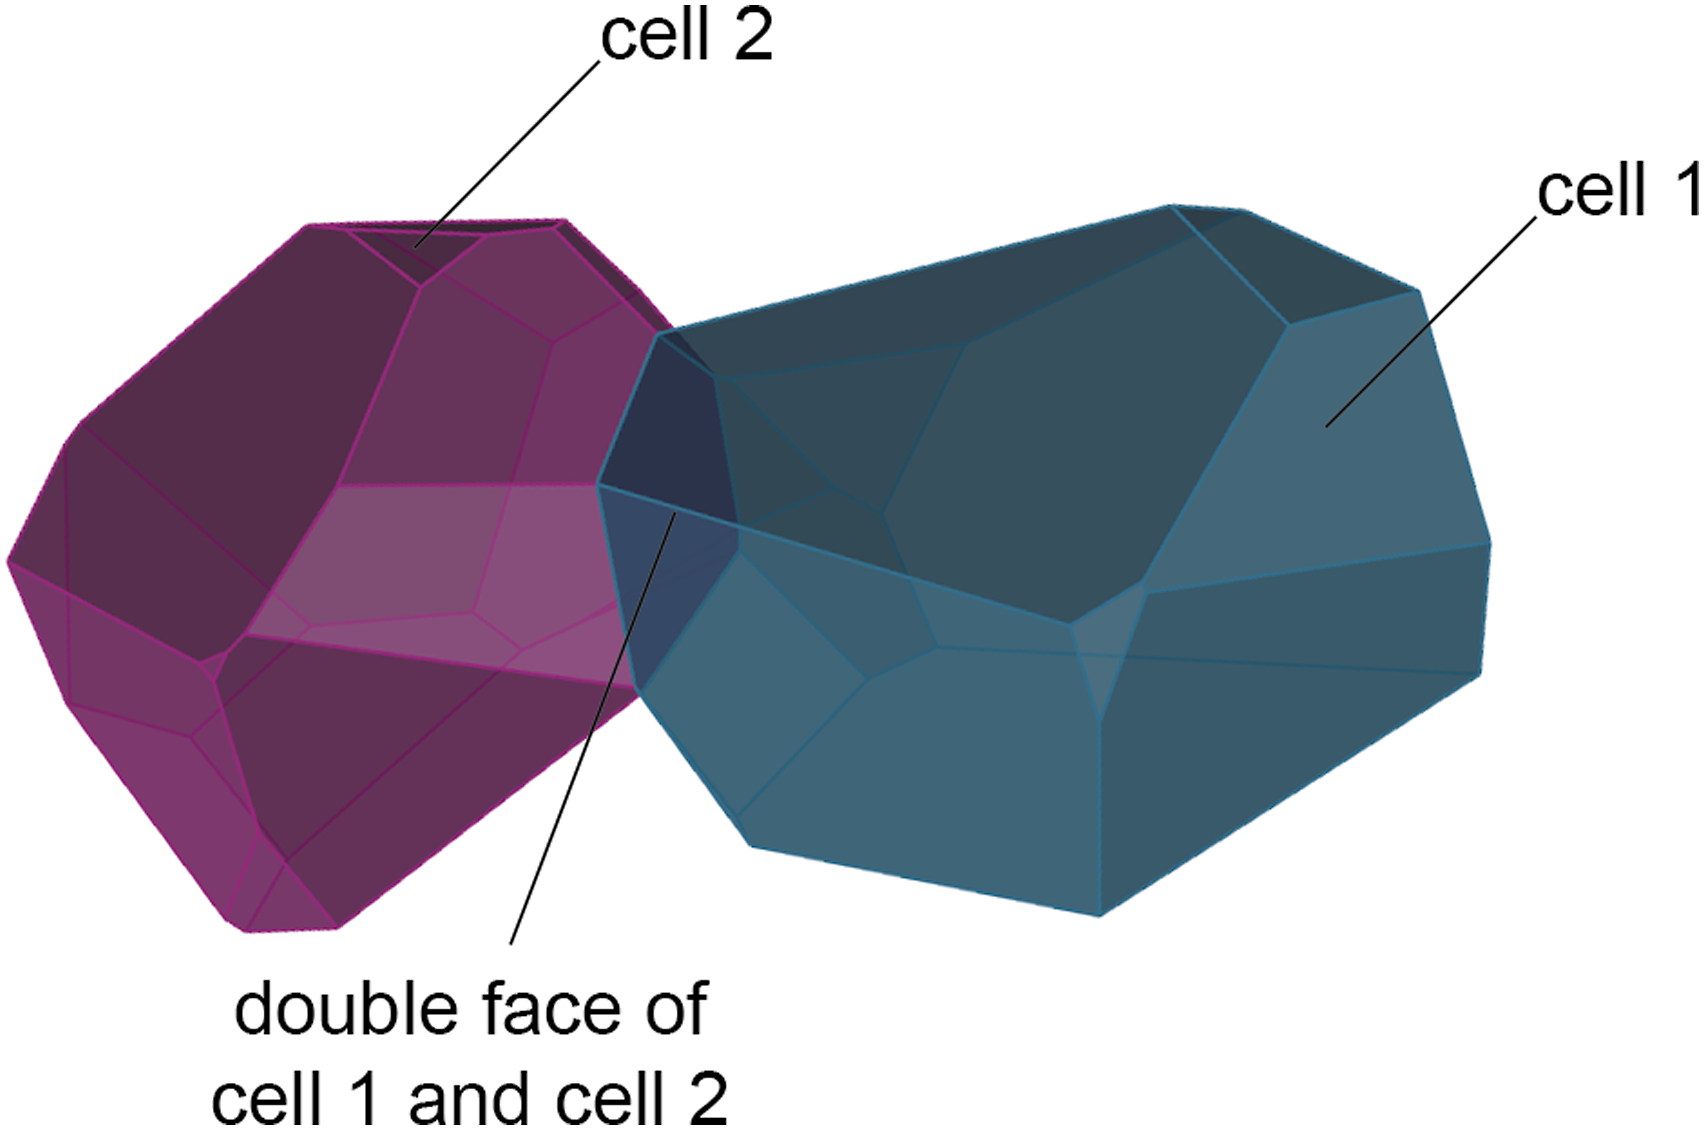
These double faces have to be deleted, otherwise no continuous shell structure can be modelled. The deletion is performed in Grasshopper with a so called ‘culling pattern’ for which input is obtained with a script implemented in Grasshopper. The centre points of each cell wall (polygon) serve as input for the script, so that the duplicate faces are identified, and thus the ‘culling pattern’ is defined. The single faces can then be imported into a finite element software (e.g. Abaqus, Dassault Systèmes). Due to better meshing behaviour, the model should be ‘cleaned up’ concerning faces exhibiting a surface area smaller than 0.005 mm2 (approximated value). These small faces, which have a negligible influence on the simulation results, would not be meshed that easily because small element sizes would be needed, and therefore the number of elements and the computational effort would increase. In Figure 3, the removed small faces are illustrated. Illustration of the small faces which are removed from the Voronoi structure of the foam with a density of 100 kg/m3.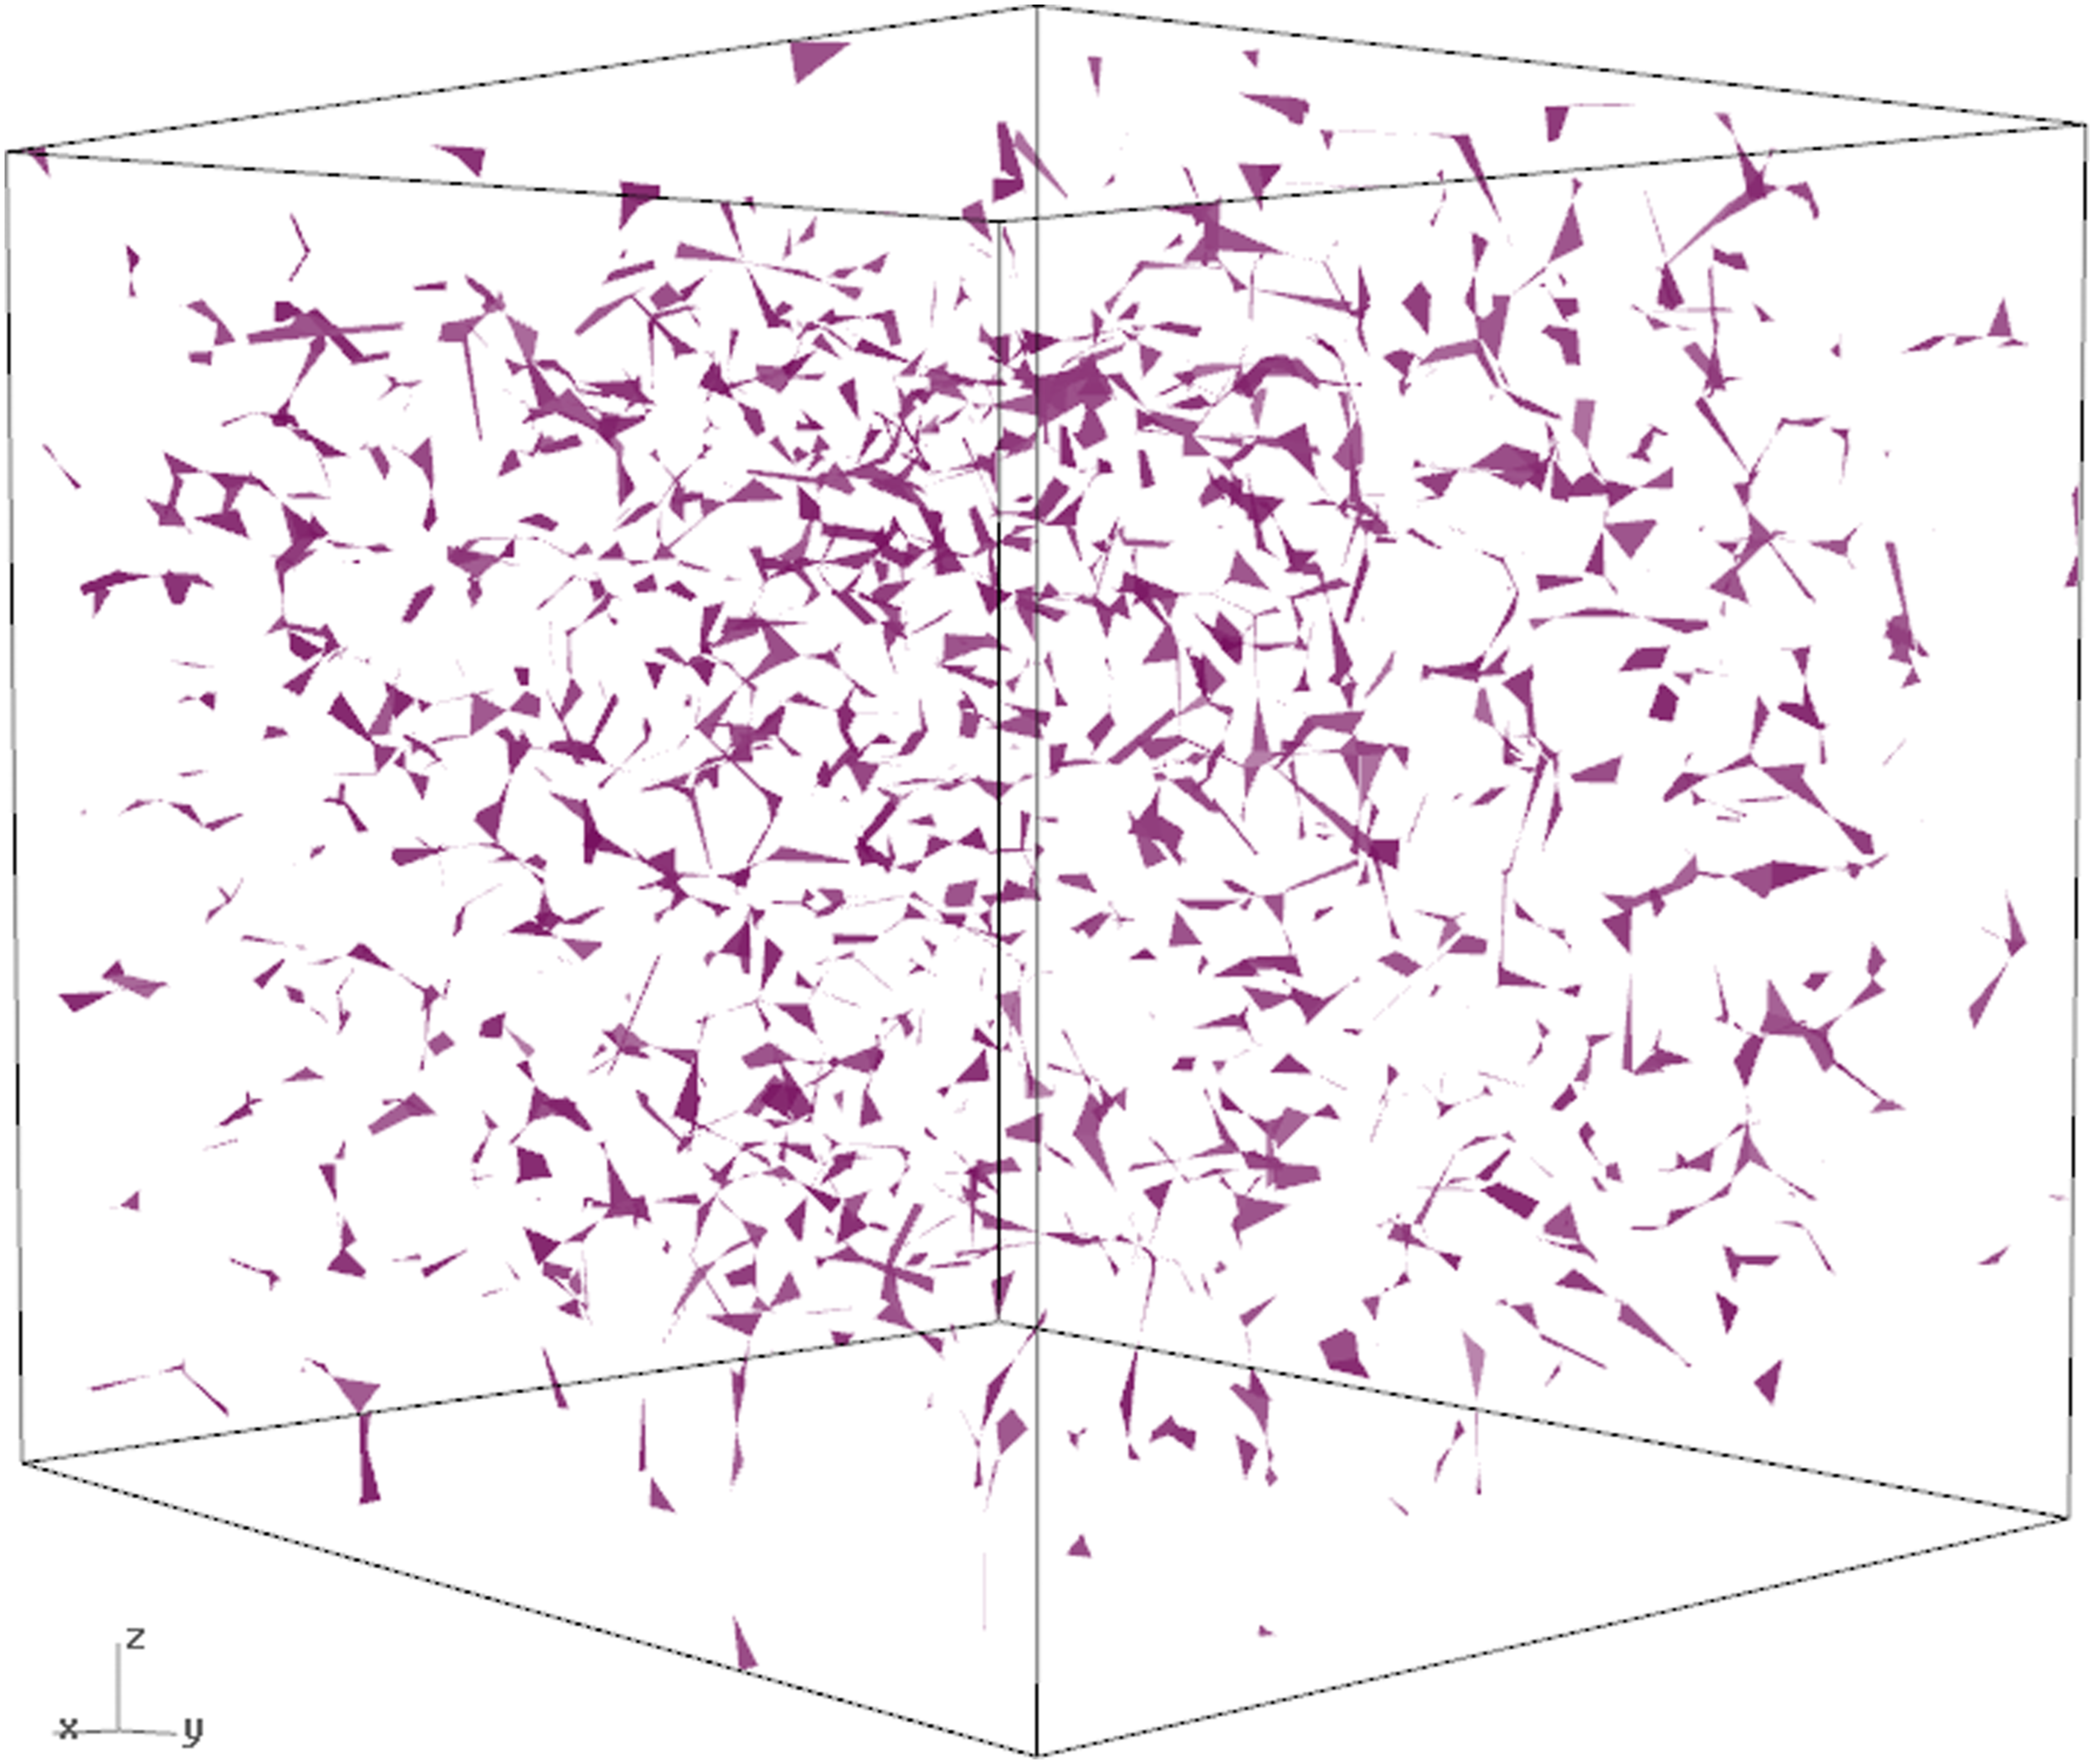
In Abaqus, the single faces are merged to one surface and part, respectively, which is then meshed with linear quadrilateral (S4R) and linear triangular elements (S3). Using this method, models for extrusion foams with densities of 100 kg/m3, 200 kg/m3 and 300 kg/m3 are created.
Simulation methodology
In the following section, the methodology for linear elastic tensile test simulations of the foam models created using the method described above is presented. The utilized material model for the simulations is obtained from experimental tensile tests (ISO 527–1:2012) of specimens made of the bulk material (high melt strength polypropylene). For analyzing the linear elastic behaviour of the foams, a linear elastic material model of the bulk material is used for the simulations with the following parameters:
Young’s modulus = 1898 MPa, Poisson’s ratio = 0.4.
The Young’s modulus is evaluated from the abovementioned experimental tensile test results of the bulk material and the Poisson’s ratio is estimated.
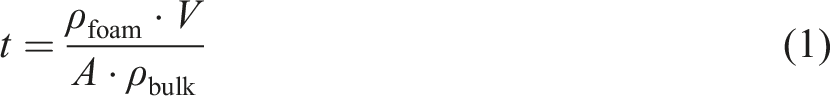
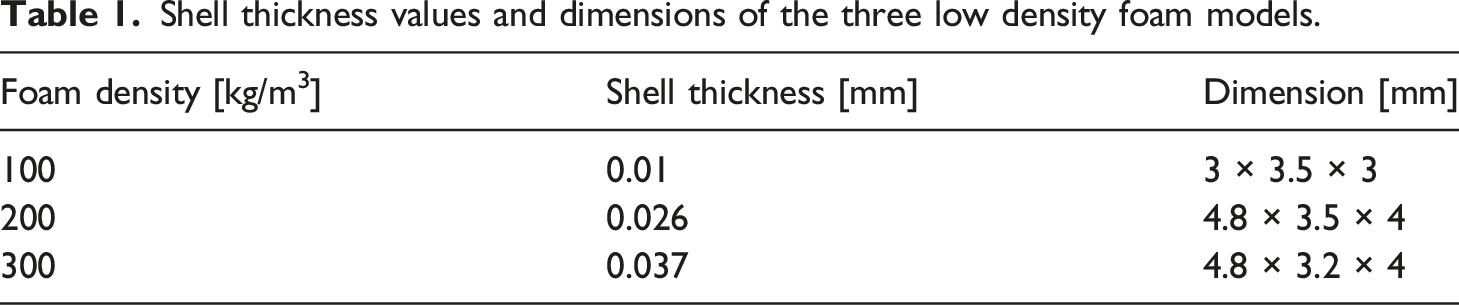
For a complete material model definition, a thickness for the 3D shell model is also required. The thickness of the cell walls t is dependent on the density of the foam ρfoam and bulk material ρbulk, the volume of the box where the Voronoi structure is generated V and the area of all cell faces A. t can be estimated as follows
Shell thickness values and dimensions of the three low density foam models.
Due to the extrusion process, anisotropic properties of the foams are expected.
33
Thus, simulations with tensile loading in machine, transverse and thickness direction are performed to investigate this behaviour. In Figure 4, the simulation setup is illustrated. Simulation set up for the tensile test simulations.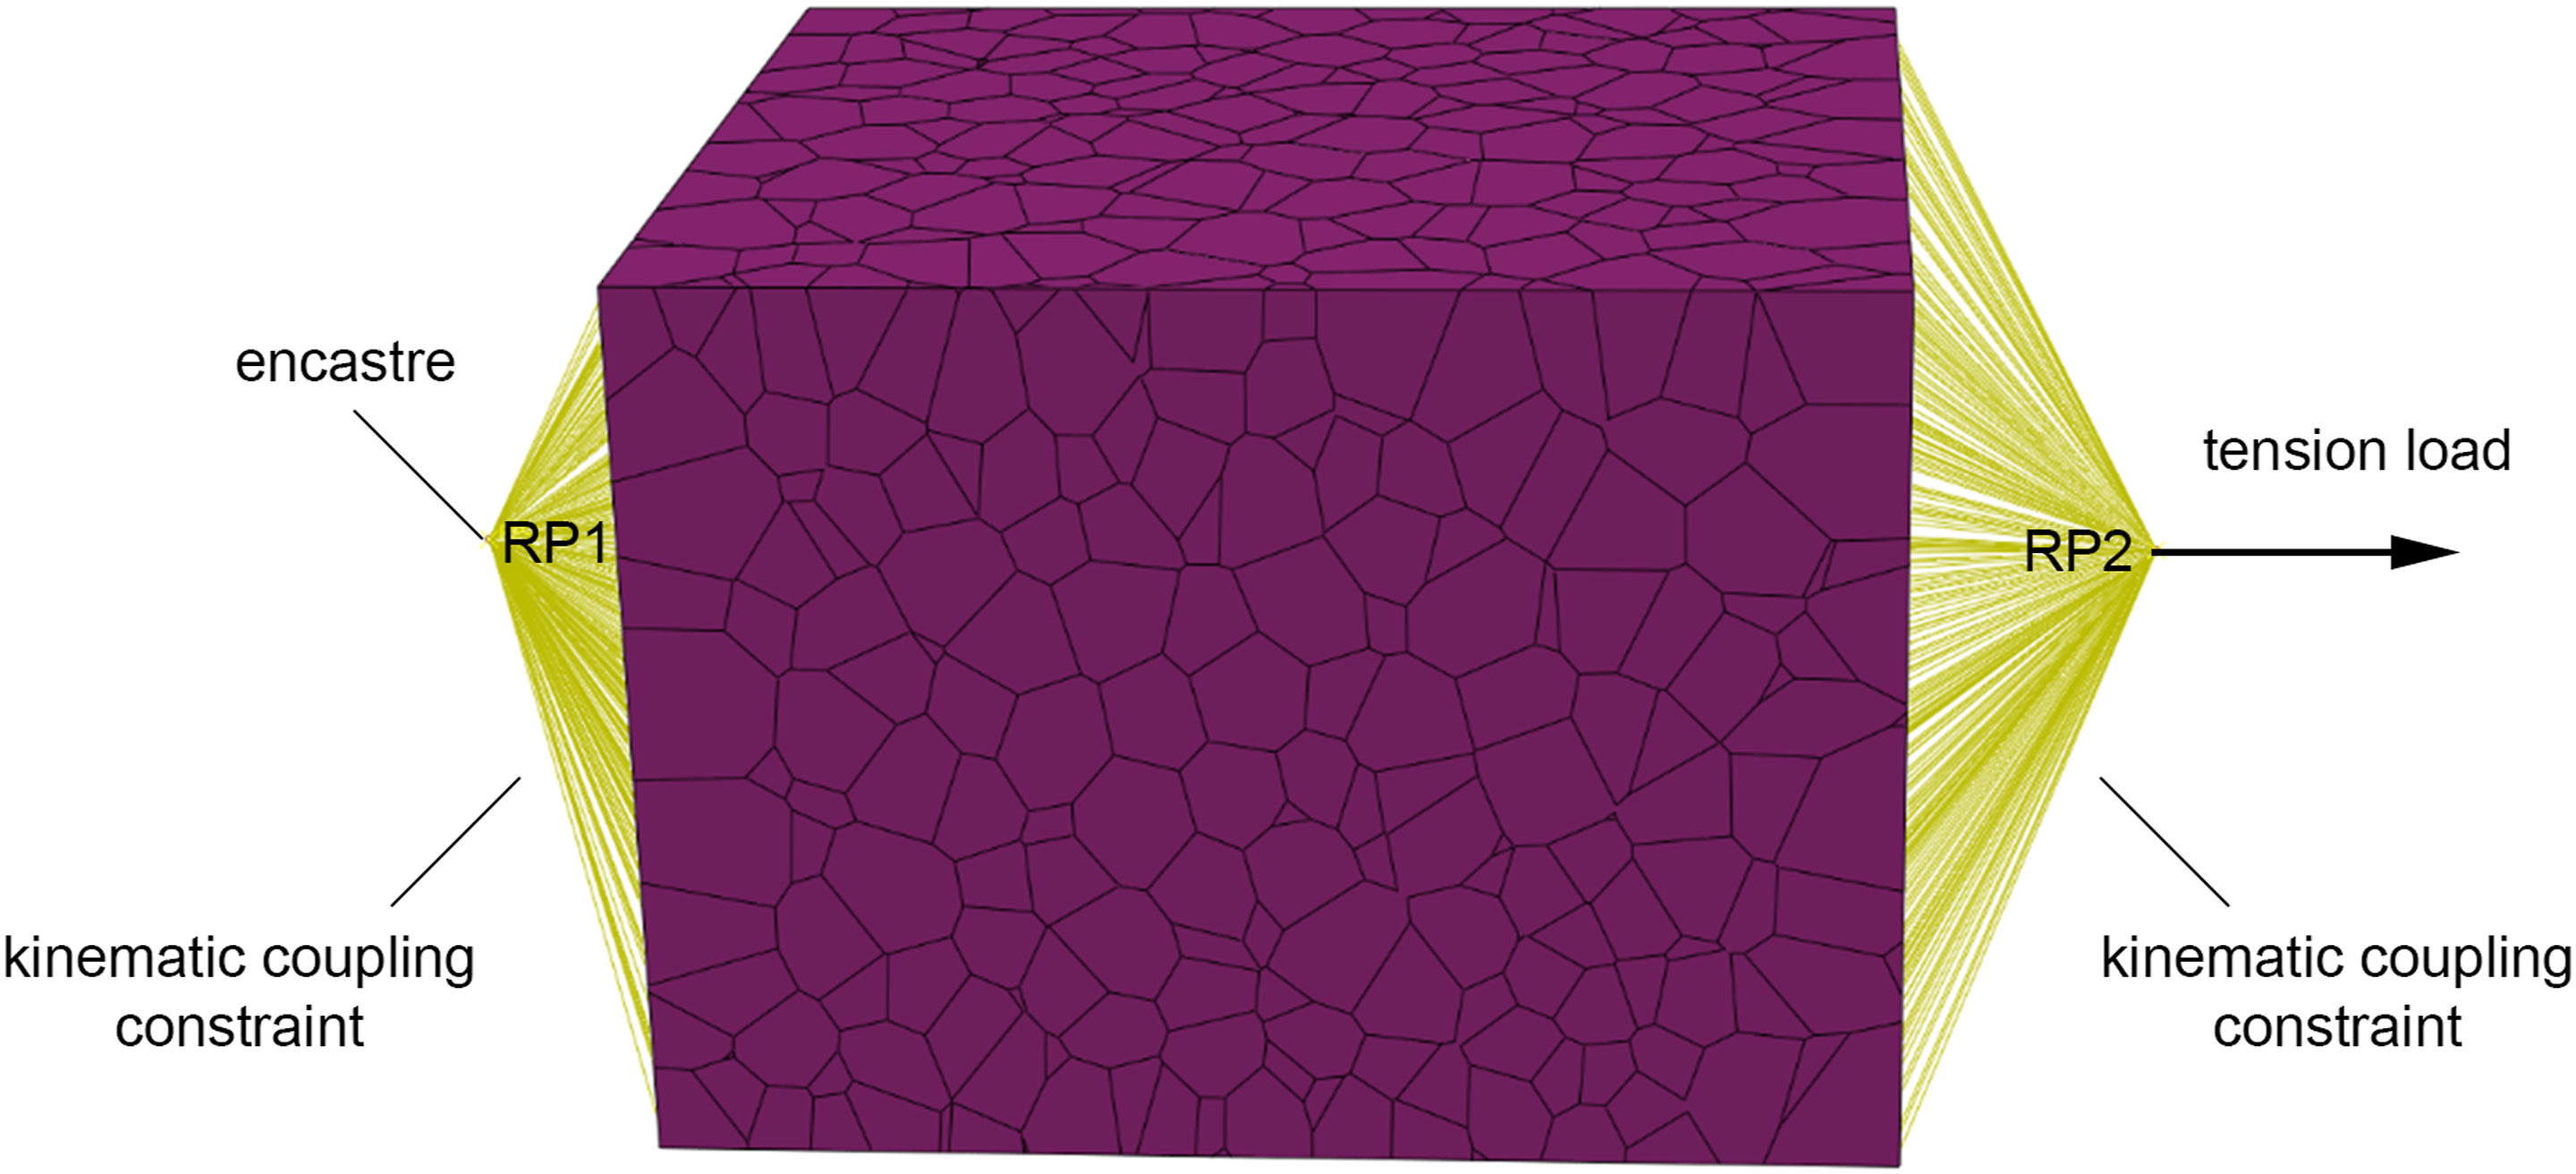
The load is transferred using a reference point (RP2) with a kinematic coupling constraint to the foam. 34 The foam is clamped (encastre) at the bottom through a reference point (RP1).
Results and discussion
The tensile test simulation results are discussed in this section. The anisotropic behaviour of the foams is investigated and the simulation results are compared with experimental results and with several selected analytical models.
Investigation of the anisotropy
Experimental tensile test results are available in machine and transverse to the machine direction for the extruded low density foams (ISO 527–1/-2, specimens according to the standard ISO 527–2 type 1B were milled out of foamed extrusion plates) which serve as validation data for the simulation models. In Figure 5, the comparison of the Young’s modulus values in the different directions obtained experimentally and numerically is shown. For the determination of the Young’s modulus, the simulation was performed up to a strain of 1%. Comparison of the Young’s modulus values obtained by the simulation models with the experimentally determined Young’s modulus values for the foams with densities of (a) 100 kg/m3, (b) 200 kg/m3 and (c) 300 kg/m3.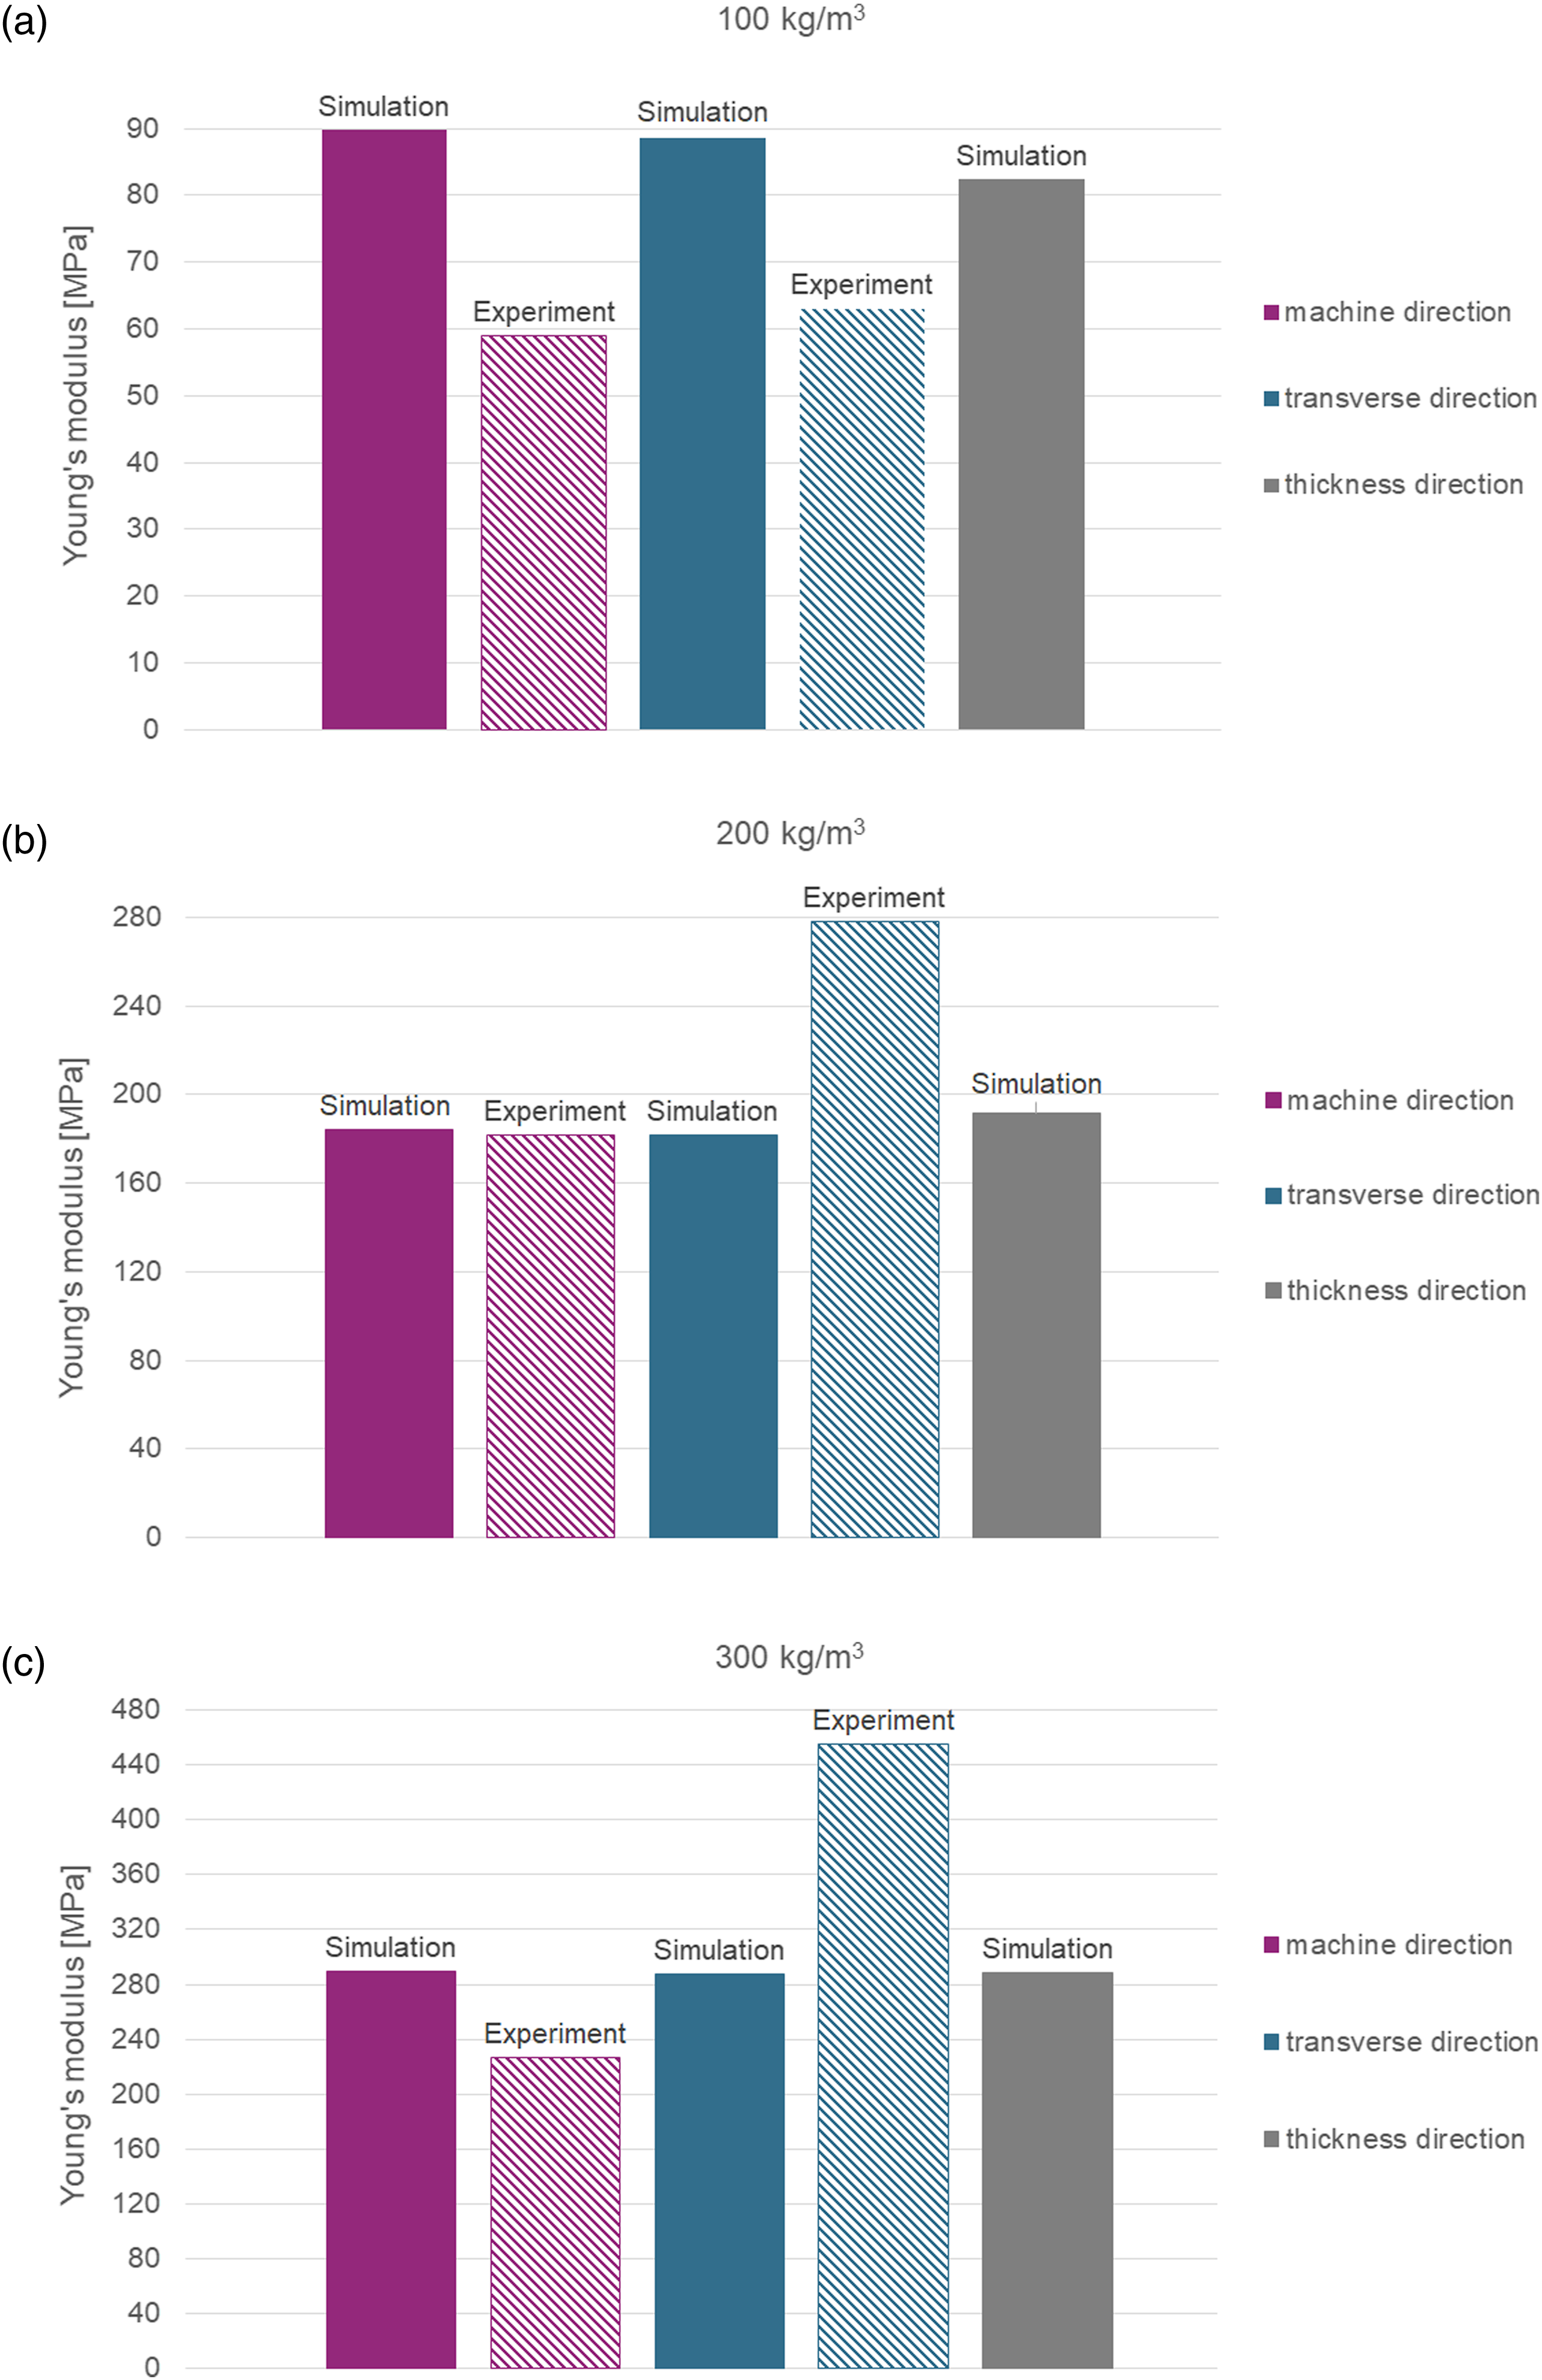
For the foam with a density of 100 kg/m3, it can be seen that the Young’s modulus obtained by simulation is higher than the experimentally determined modulus. One reason for the stiffer behaviour is that the open cell content in the simulation model is too low, which is discussed in section ‘Improved modelling methodology’. Moreover, the results of the simulation model show a nearly isotropic behaviour like the experimentally characterized foam. The Young’s modulus in machine direction of the foam model with a density of 200 kg/m3 corresponds well with the experimentally determined Young’s modulus in machine direction. For the foam with a density of 300 kg/m3, the simulation slightly overestimates the Young’s modulus in machine direction. Transverse to the machine direction, the values obtained by simulation and experiment do not match for both foams because the experimental results show a significantly higher modulus and anisotropic behaviour, respectively. This anisotropy is caused by the extrusion process and cannot be depicted with the current model. The implementation of the anisotropic behaviour is described in section ‘Improved modelling methodology’.
Comparison with analytical models
The results obtained by simulation are also compared with analytical models. The following models are chosen for the comparison:
The analytical formulation and detailed description are given in the individual references of the models and are summarized in Hössinger-Kalteis et al.
14
The first three models are direct models using a detailed model of the foam structure to investigate the behaviour of the foam. The last two are constitutive models based on homogenization methods, approximating the properties of the foam by a homogeneous medium. In Figure 6, the comparison of the Young’s modulus values in machine direction of the analytical models, the simulation models and the experimentally characterized foams are illustrated. It can be seen that the results obtained by the Skeleton Cubic Cell Model, which is the most basic model, are in good agreement with the experimental values. The Mori Tanaka Model overestimates the Young’s modulus compared to the experimental results and the highest Young’s modulus value is obtained with this model. With the Ramakrishnan–Arunachalam Model, the lowest Young’s modulus value is computed. The analytical models are only valid for isotropic foams, and thus only the behaviour in machine direction can be investigated, whereas with the developed model the anisotropic behaviour and also the non-linear region can be characterized. Comparison of the Young’s modulus values in machine direction of the analytical models, the simulation models and the experimentally characterized foams with densities of (a) 100 kg/m3, (b) 200 kg/m3 and (c) 300 kg/m3.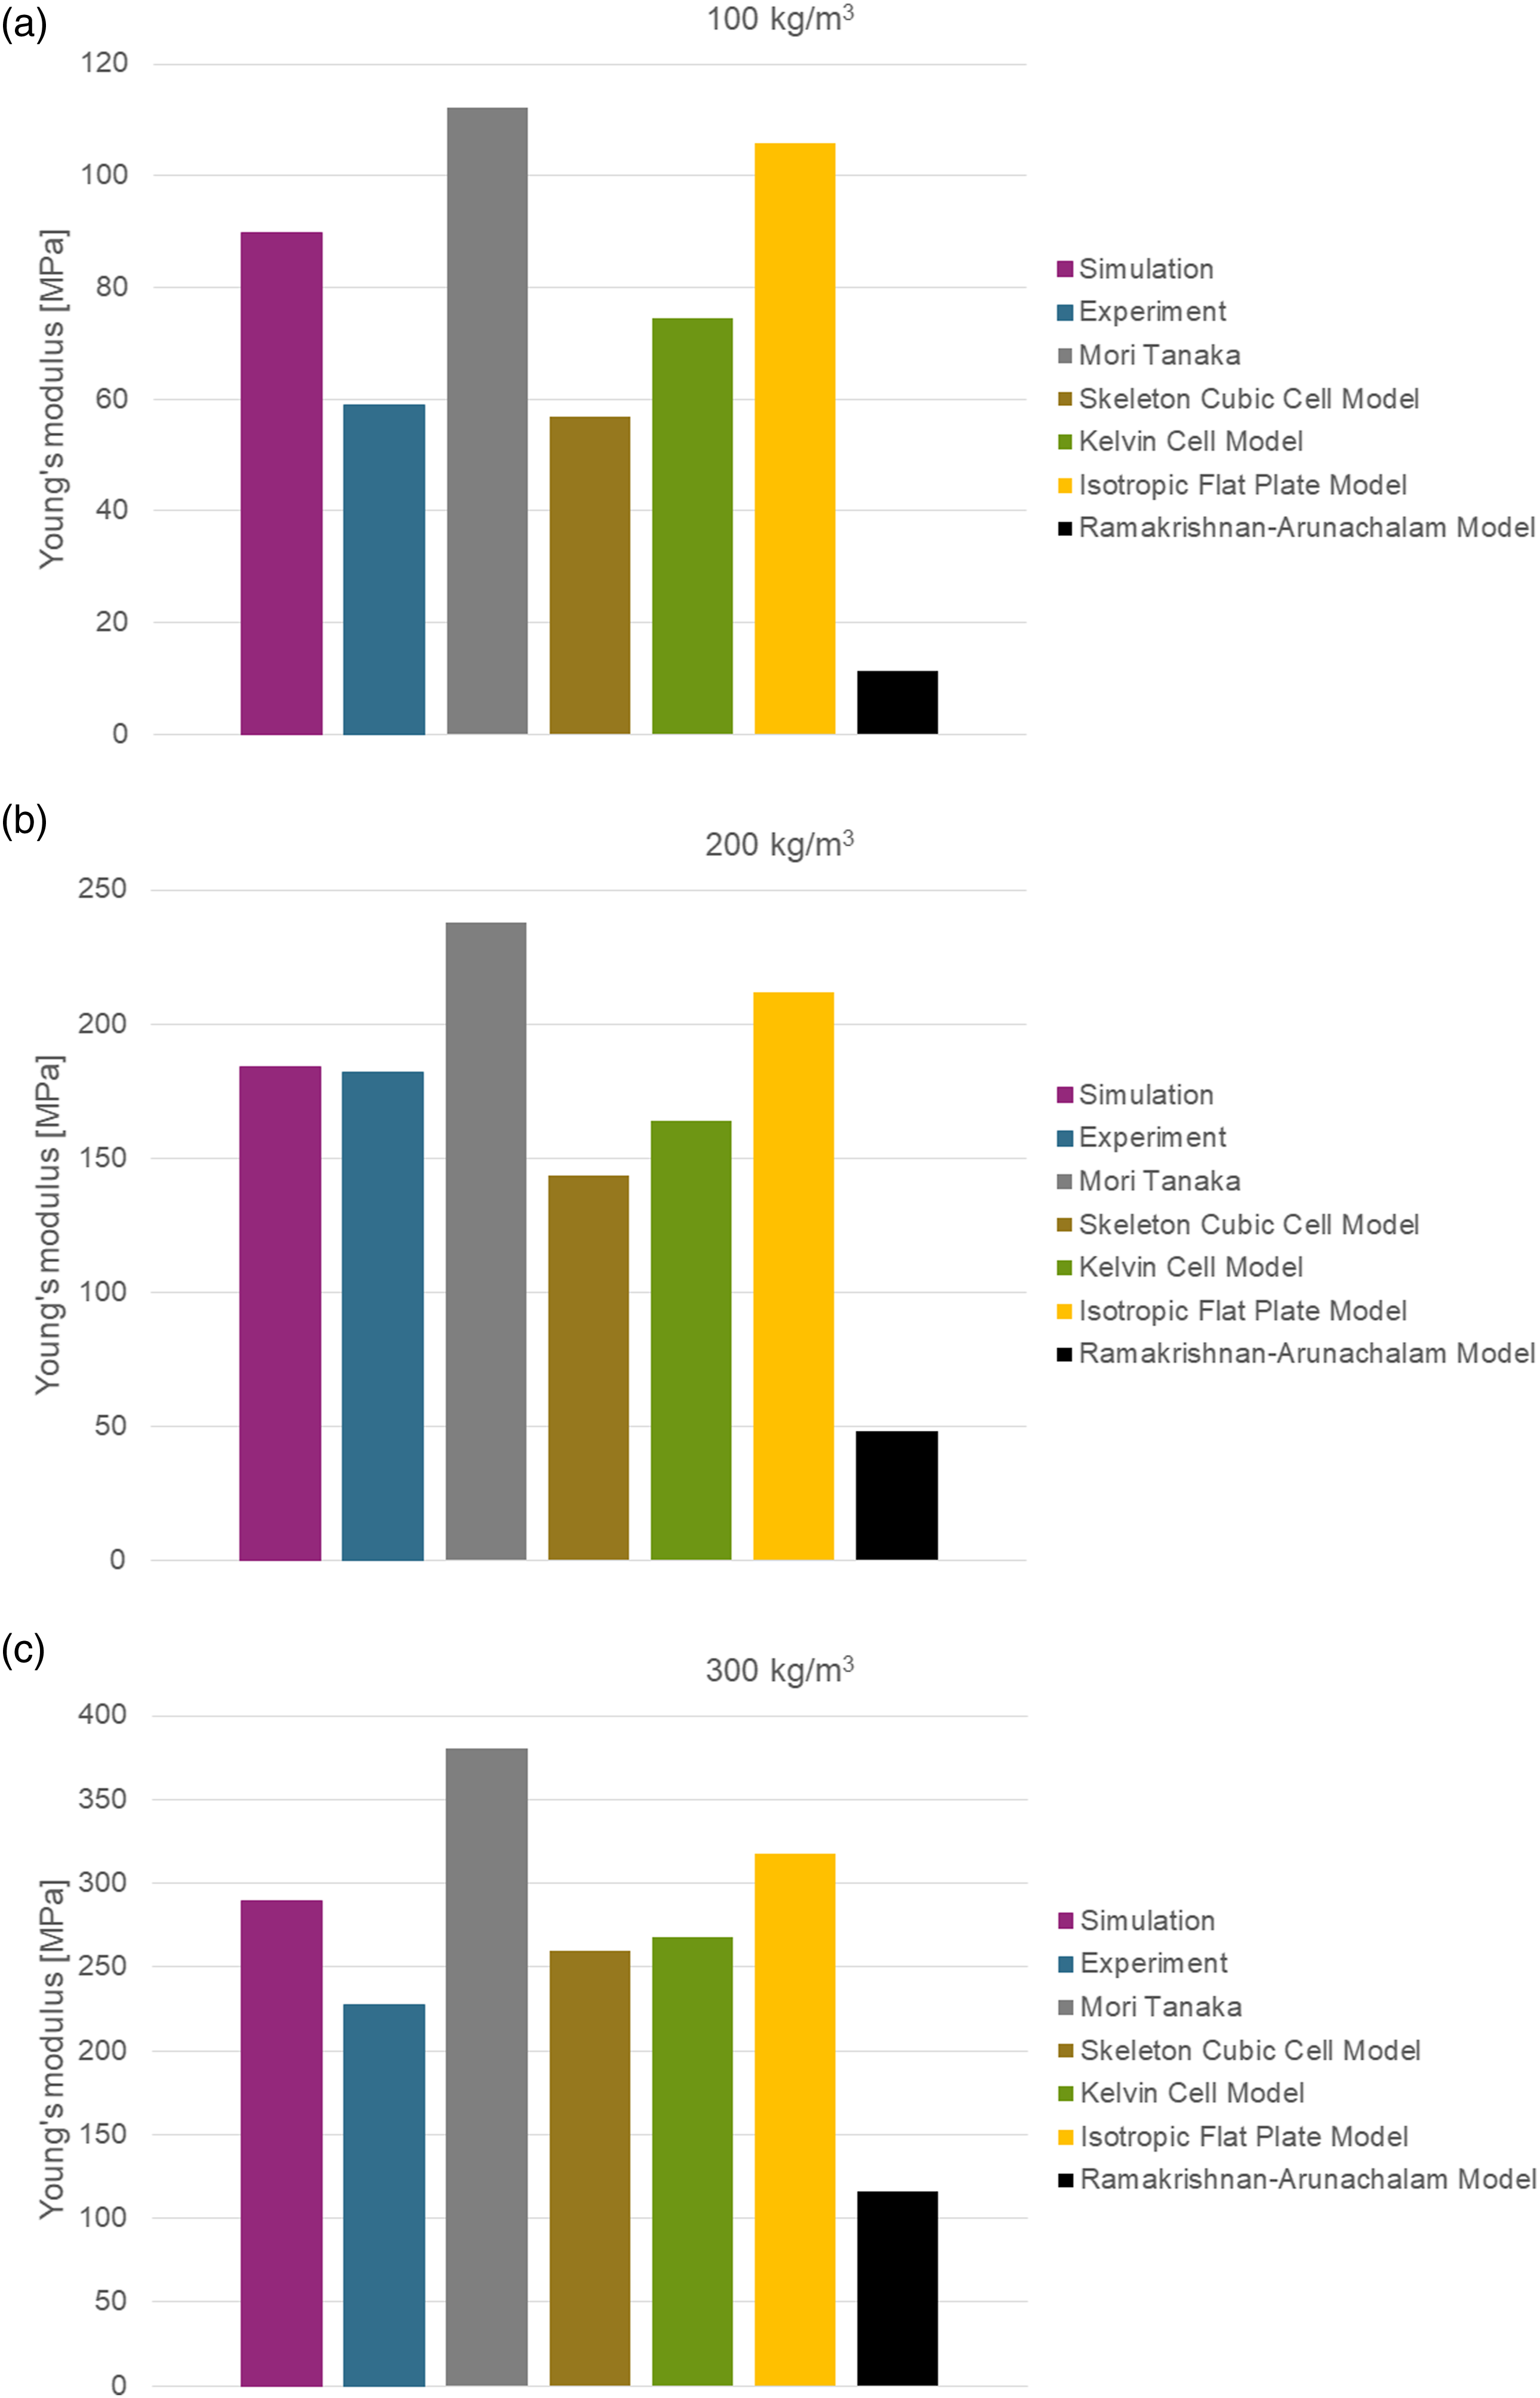
Improved modelling methodology
As some simulation results presented in section ‘Results and discussion’ are not in a good agreement with the experimental results, modifications of the models are necessary. Therefore, the CT measurement results are investigated. The evaluation of the results concerning the open cell content shows that for the foam with a density of 100 kg/m3 the open cell content is 20% and for the other two foams the open cell content is negligible. Hence, the first adaptation of the model is the increase of the open cell content of the foam with a density of 100 kg/m3. The open cells are not directly considered in the model because for some open cells two centre points can be detected in the CT measurement. An open cell is a coalescence of two single cells and if the boarders of the two cells are not completely vanished two centre points are identified for the open cell (Figure 7). Illustration of an open cell where the two centre points are depicted.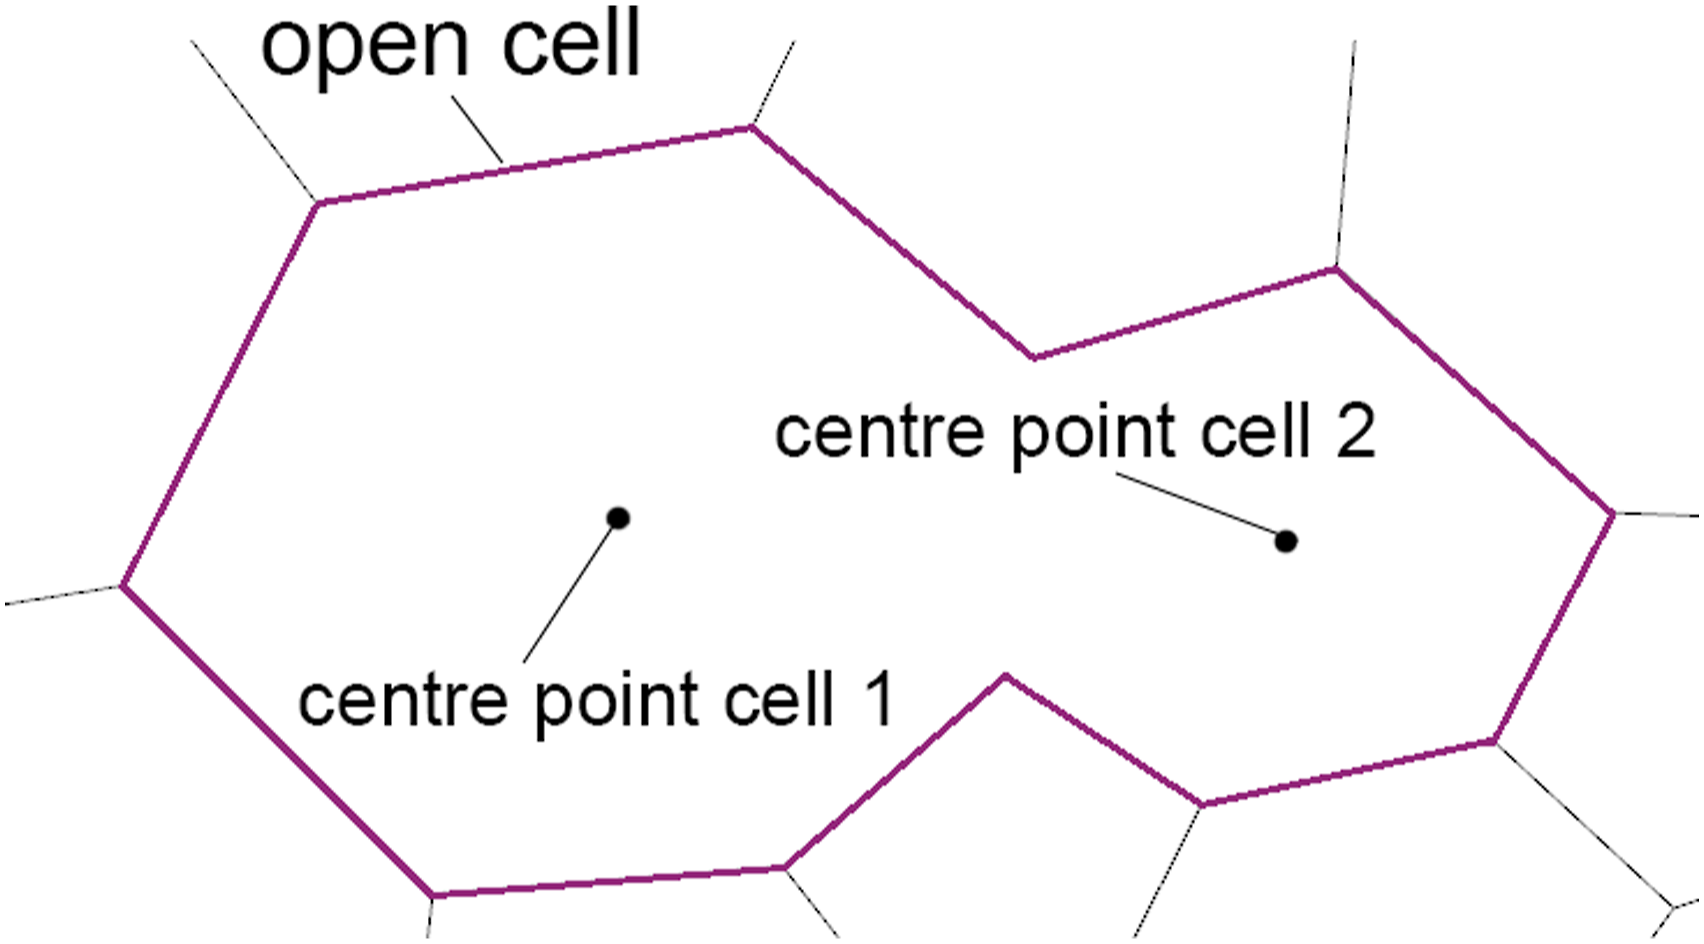
As a result, when using the Voronoi diagram approach, two single cells are modelled instead of one open cell, and thus the open cell content is too low in the simulation model. The open cell content is introduced in the model by deleting 20% of the cell wall faces. The deletion is performed in Grasshopper where the faces to be deleted are randomly chosen by the software. The final model is depicted in Figure 8 and the results are presented in section ‘Results and discussion – improved model’. Foam model with increased open cell content.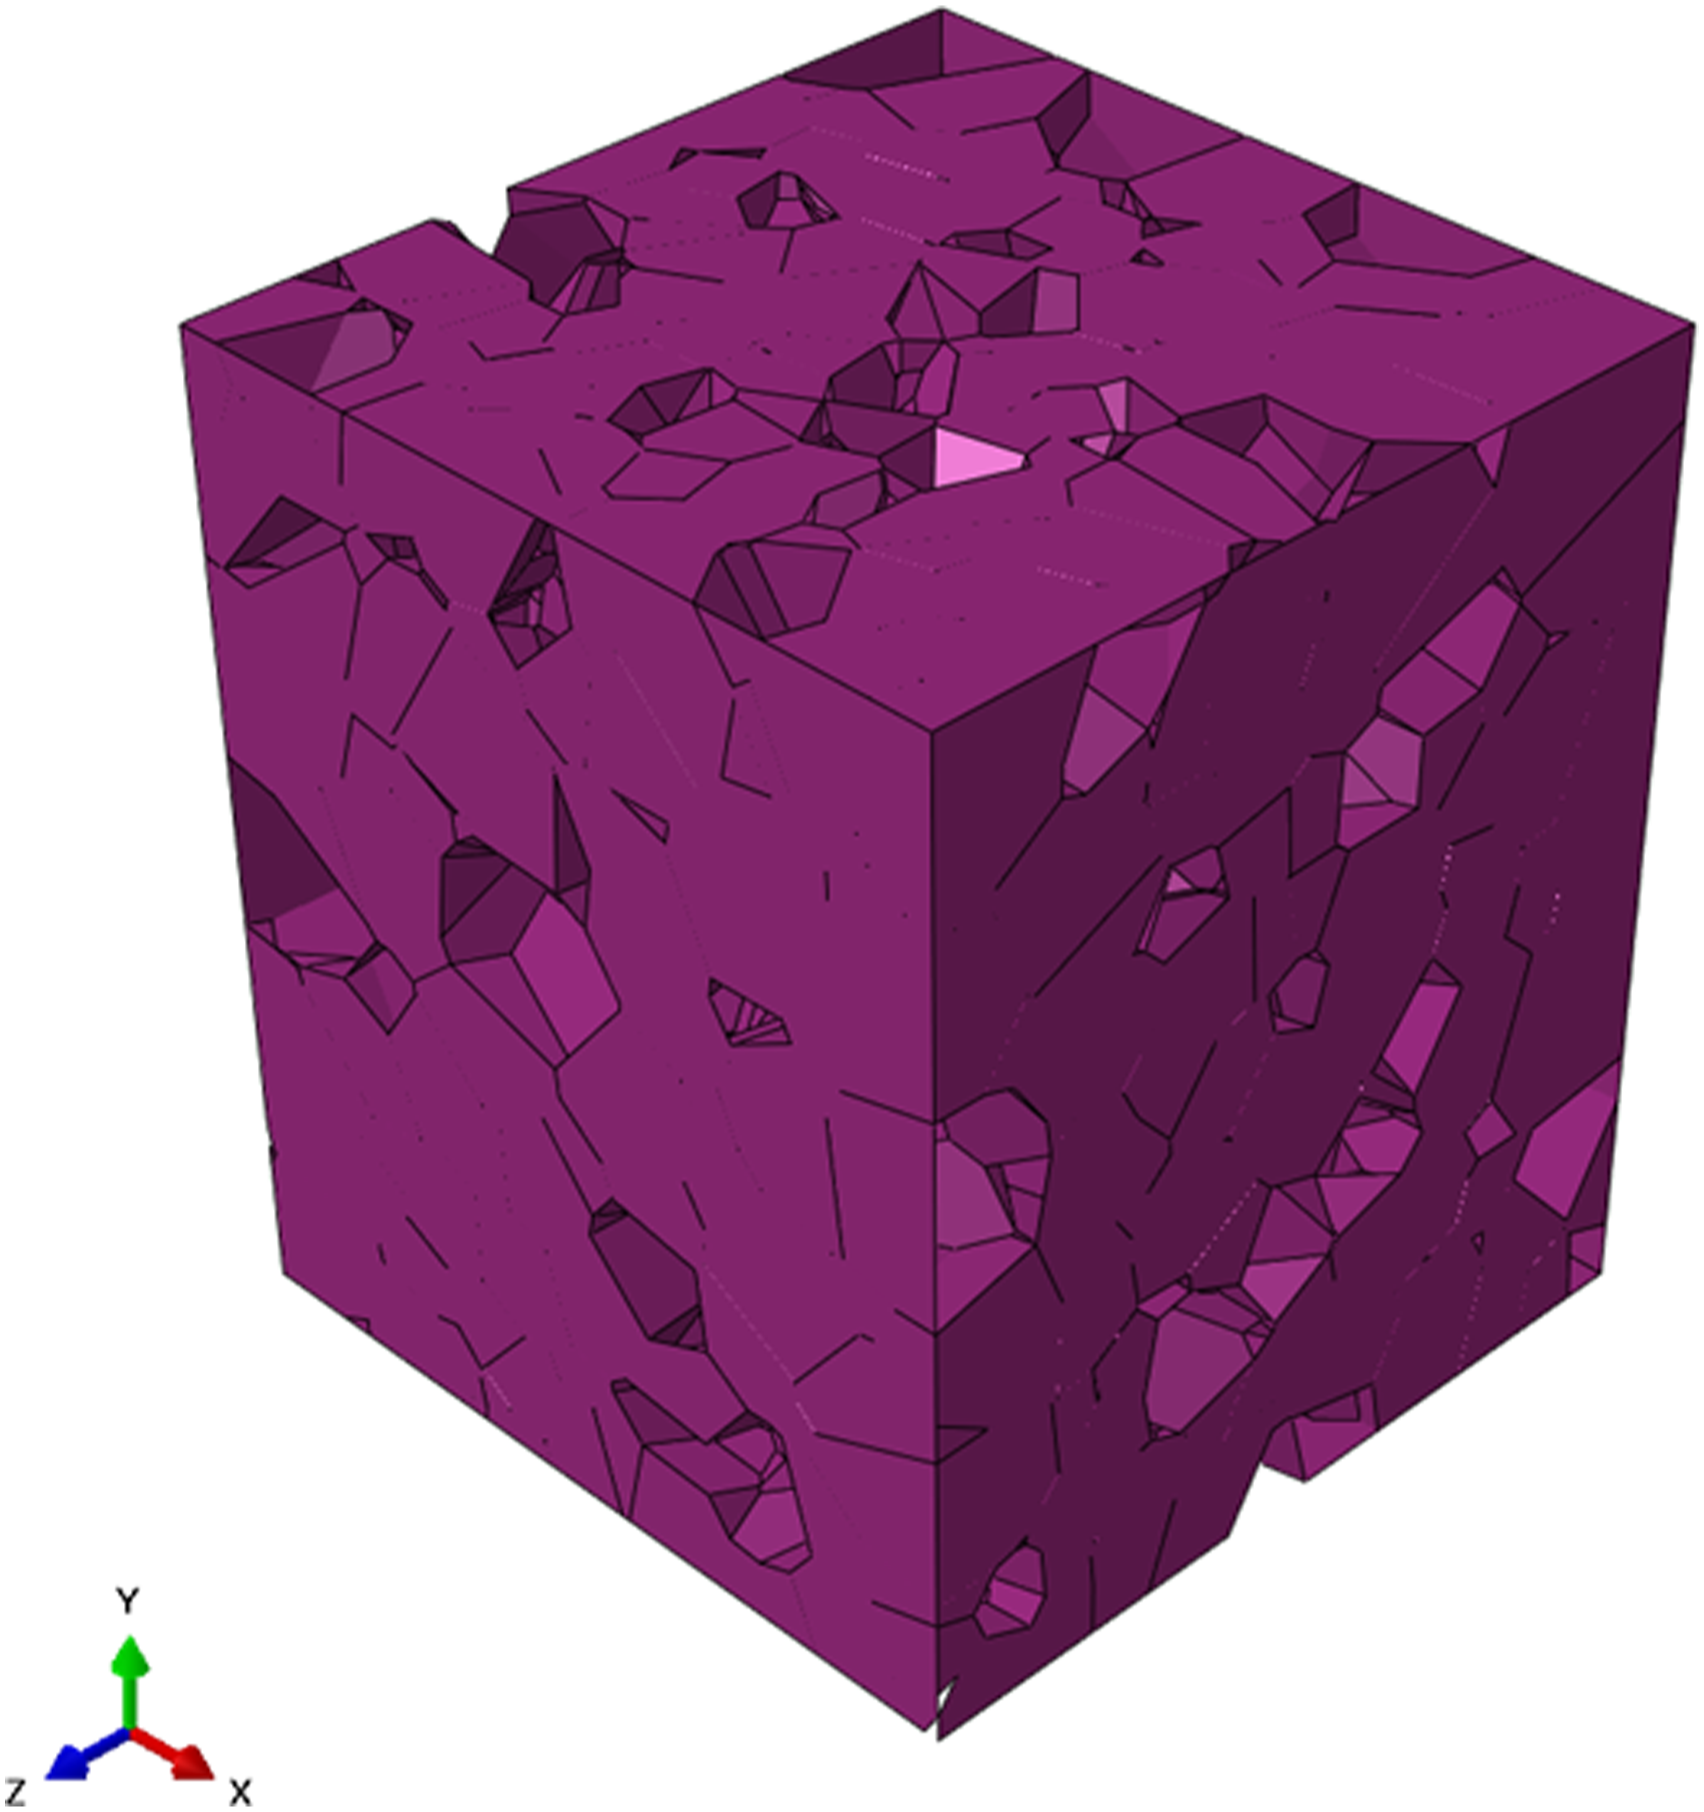
The second adaptation of the model is to incorporate the anisotropic behaviour as it is investigated for the foams with densities of 200 kg/m3 and 300 kg/m
3
. Illustrations of the microstructures of the foams obtained from CT scans are shown in Figure 9. Illustrations of the microstructures of the foams obtained from CT scans: (a) foam with a density of 200 kg/m3 and (b) foam with a density of 300 kg/m3.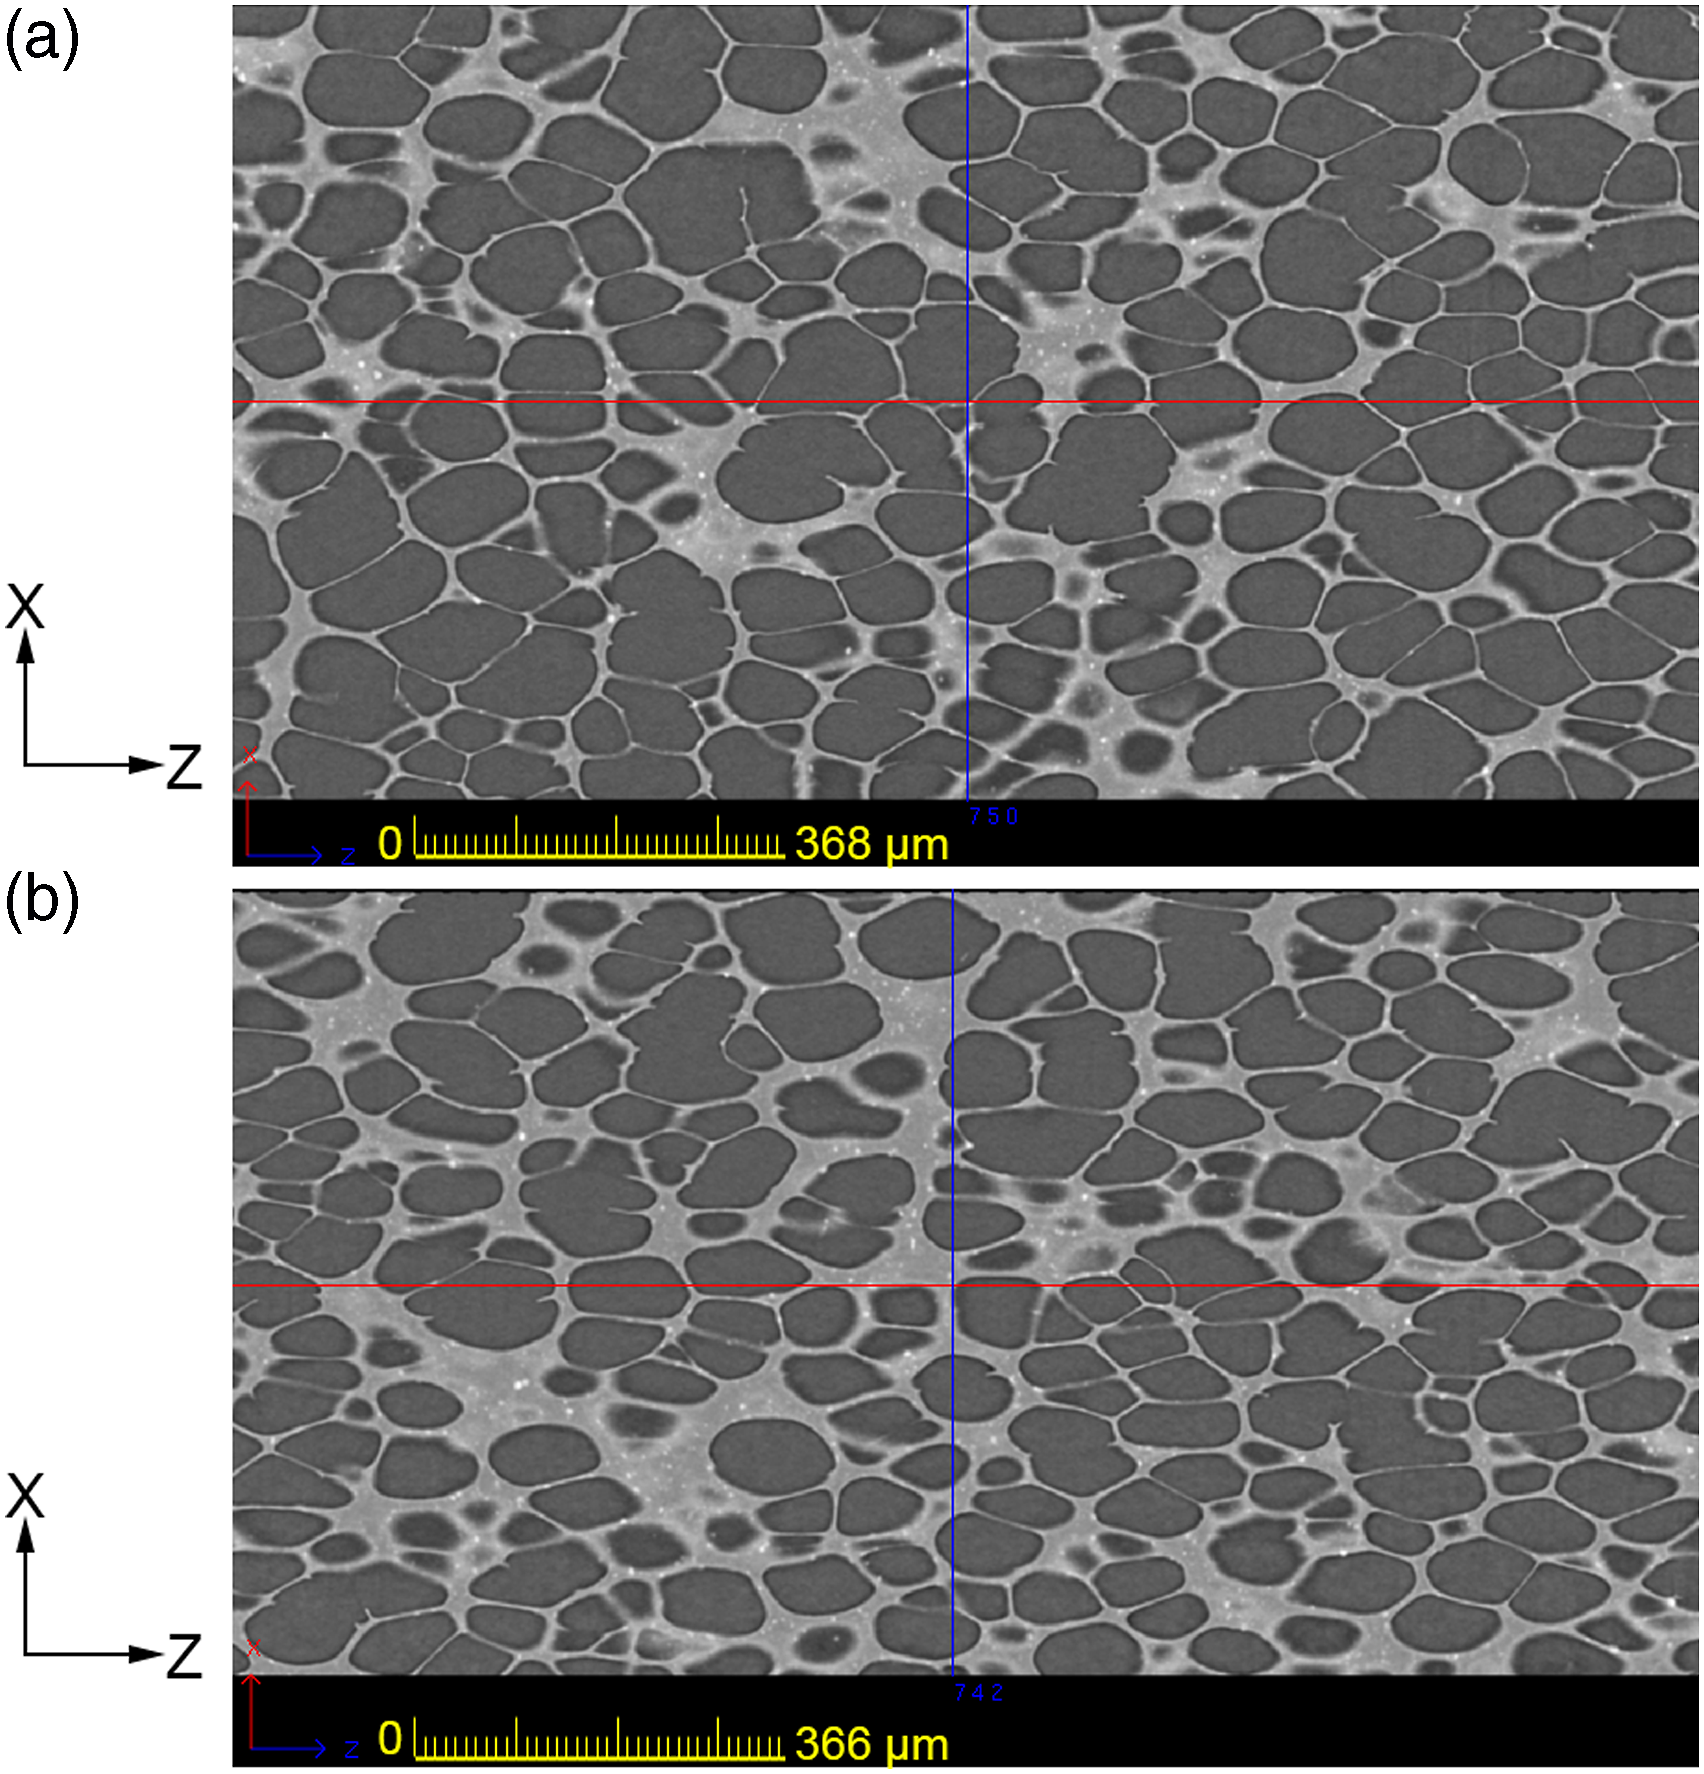
It can be seen that the cell wall thicknesses are not constant and that the cells are elongated in z-direction (transverse to the extrusion direction). The extrusion process is anisotropic by nature. The elongation and the thickness distribution arise during the foaming process when the polymer gas mixture exits the mould and foams up. This is more pronounced if the foaming degree is lower, so for foams with higher densities (200 kg/m3 and 300 kg/m3). The real thickness distribution is not easily evaluated from the CT measurement results and implemented in the simulation model. Thus, a simplified direction-dependent thickness is integrated in the model by dividing the faces into two sets. One set are the faces which enclose an angle between 5° and 175° with the transverse direction (z-direction), which is assigned a smaller shell thickness (Figure 10(a) and (c) blue region). This results in a lower Young’s modulus in machine direction. The second set are the faces which enclose an angle between 0° and 5°, and between 175° and 180° with the transverse direction, which is assigned a greater shell thickness. This results in a greater Young’s modulus in transverse direction (Figure 10(b) and (c) purple region). Faces with (a) thinner and (b) thicker cell wall thickness, (c) illustration of the division of the faces according to their enclosed angle with the transverse direction.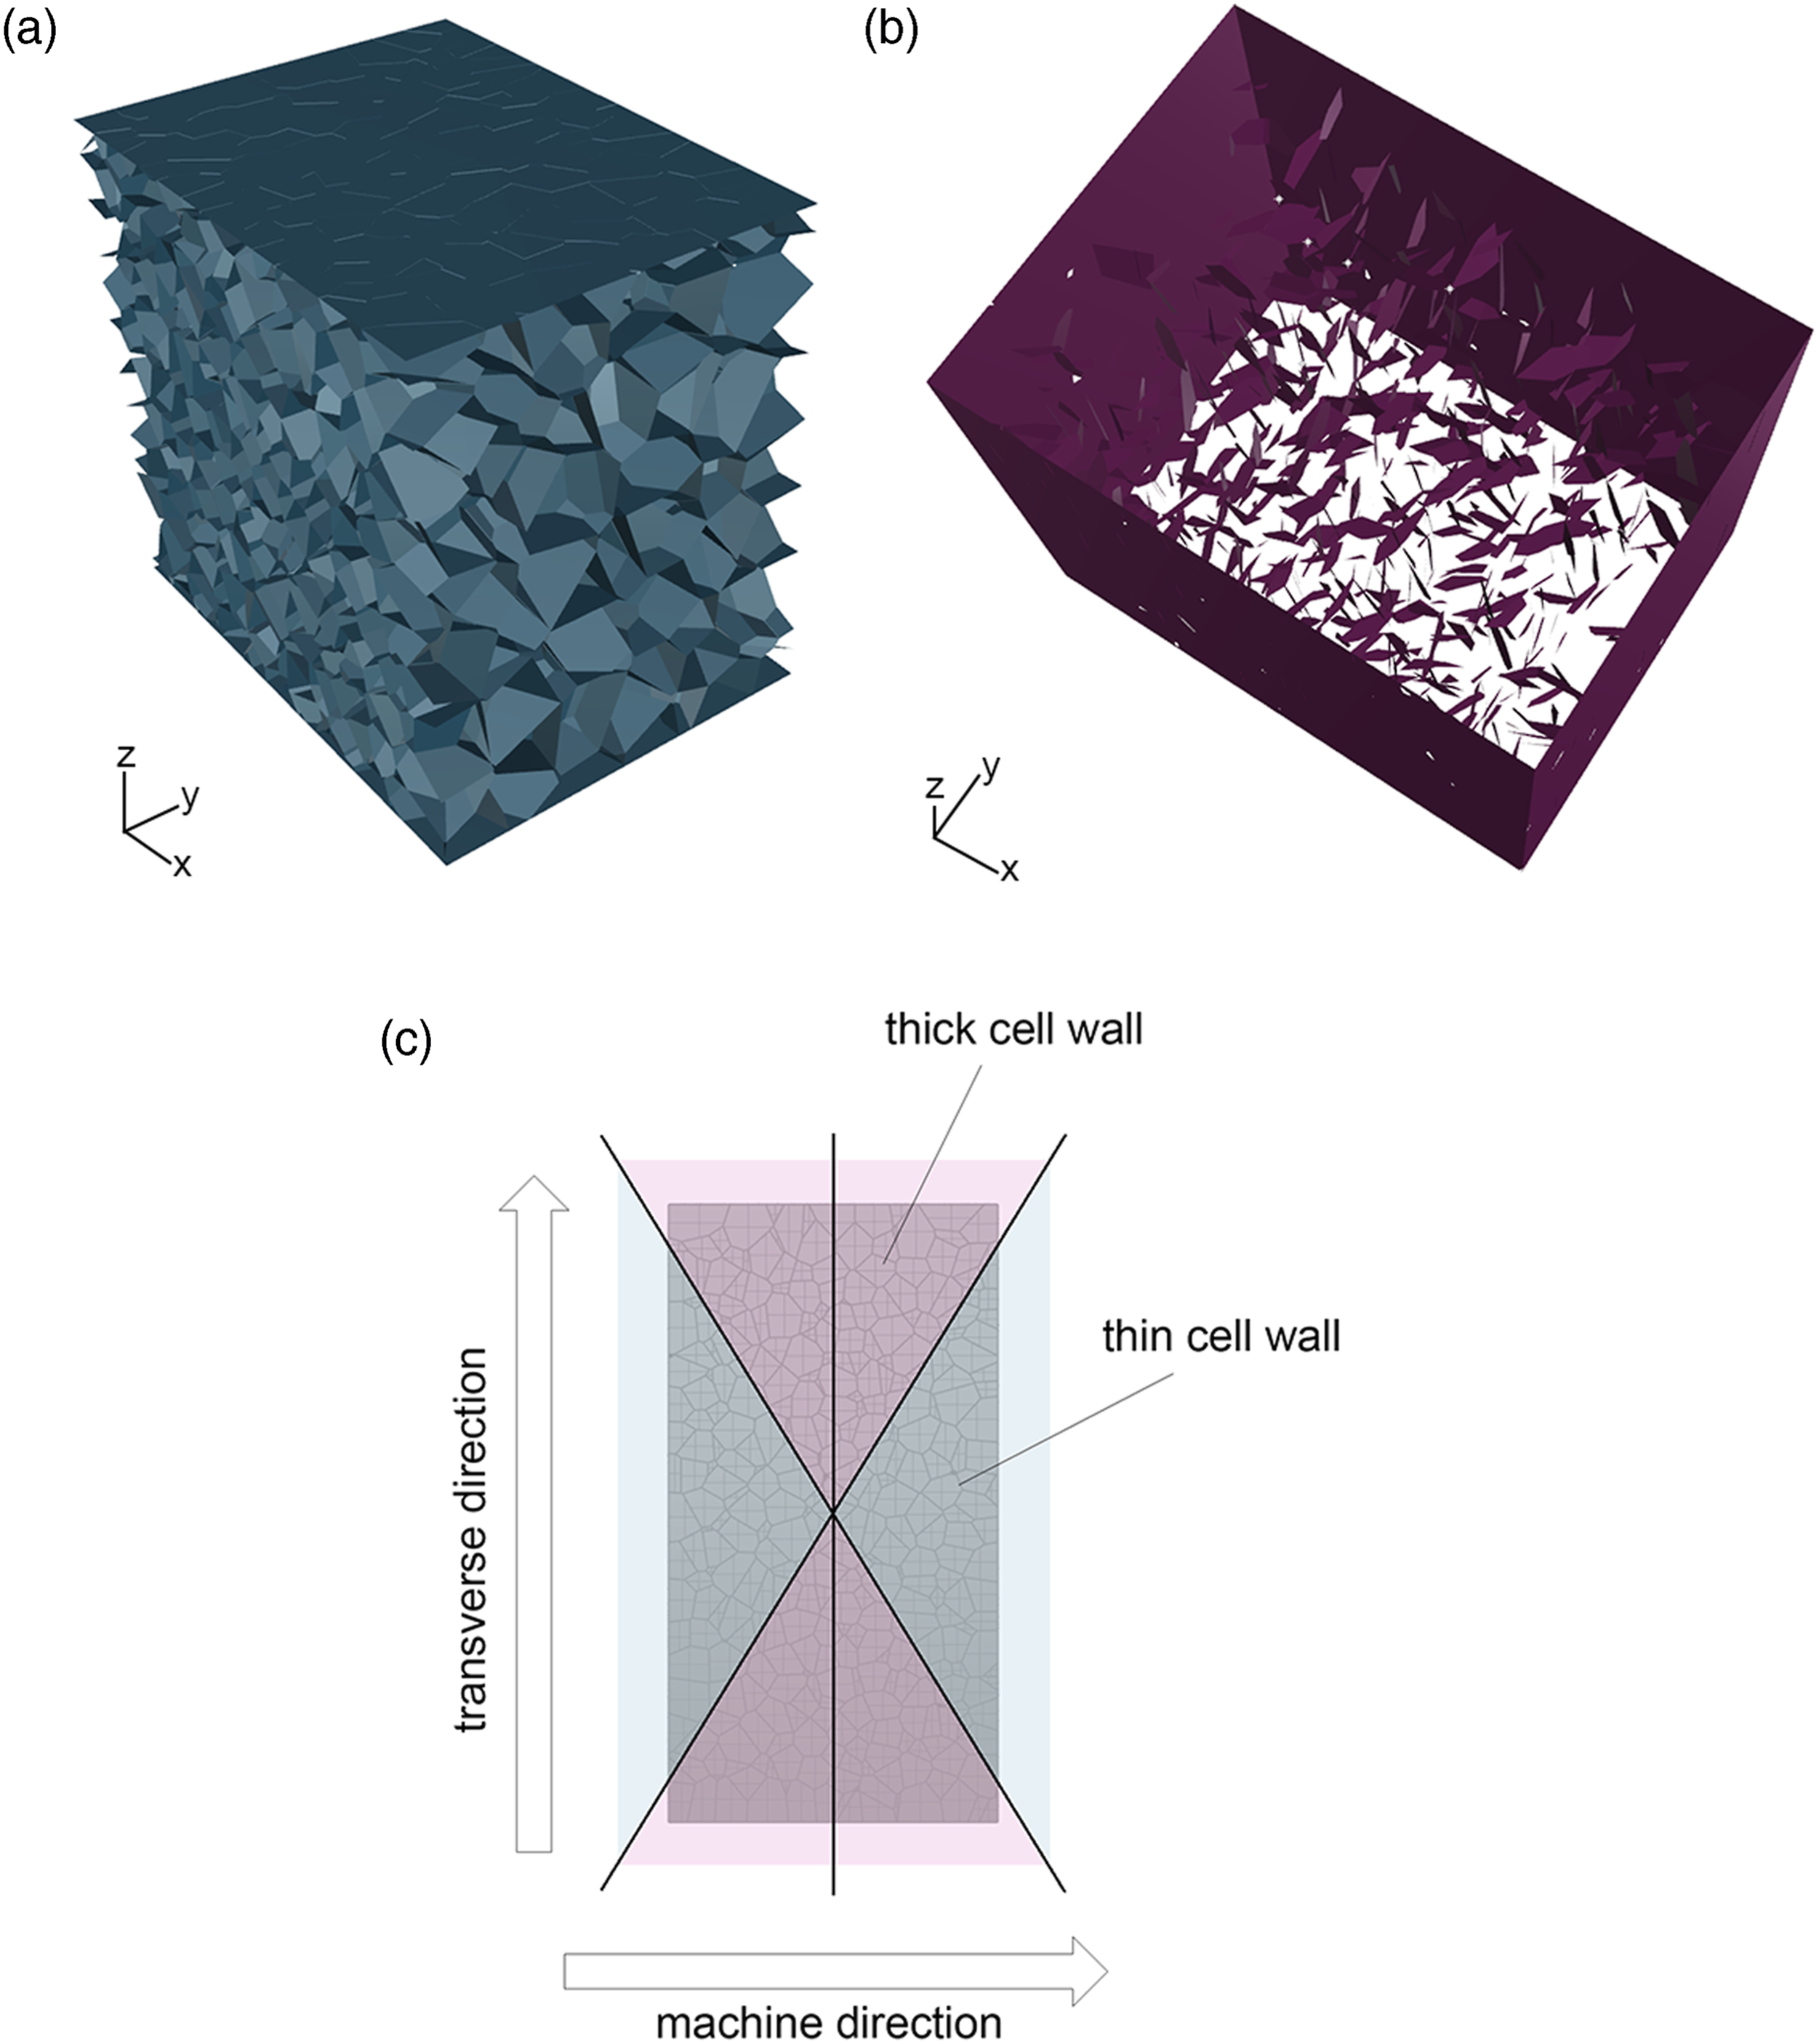
The thicknesses are adapted in this way that the relative density of the foam remains constant. The shell thickness ratio (ratio of the smaller shell thickness tthin to the greater shell thickness tthick) of the foam with a density of 200 kg/m3 is set to 0.24 and of the foam with a density of 300 kg/m3 it is set to 0.05. These values are chosen in a way that the Young’s modulus in machine direction is similar to the Young’s modulus obtained by the model with constant shell thickness because this modulus is in good agreement with the experimental result. The ratio of the foam with a density of 300 kg/m3 is lower than the ratio of the foam with a density of 200 kg/m3 due to the more distinct anisotropic behaviour.
Caused by the extrusion process, the cell shape is anisotropic. This is not considered in the model based on Voronoi diagrams. The anisotropy is evaluated from CT scans by measuring the average aspect ratio (average aspect ratio of a specific plane in thickness direction of the microcell) of the foam cells (Figure 11). Illustration of the average aspect ratio through the thickness; the x-axis values designate the position of a specific plane in thickness direction of the microcell where the aspect ratio is evaluated.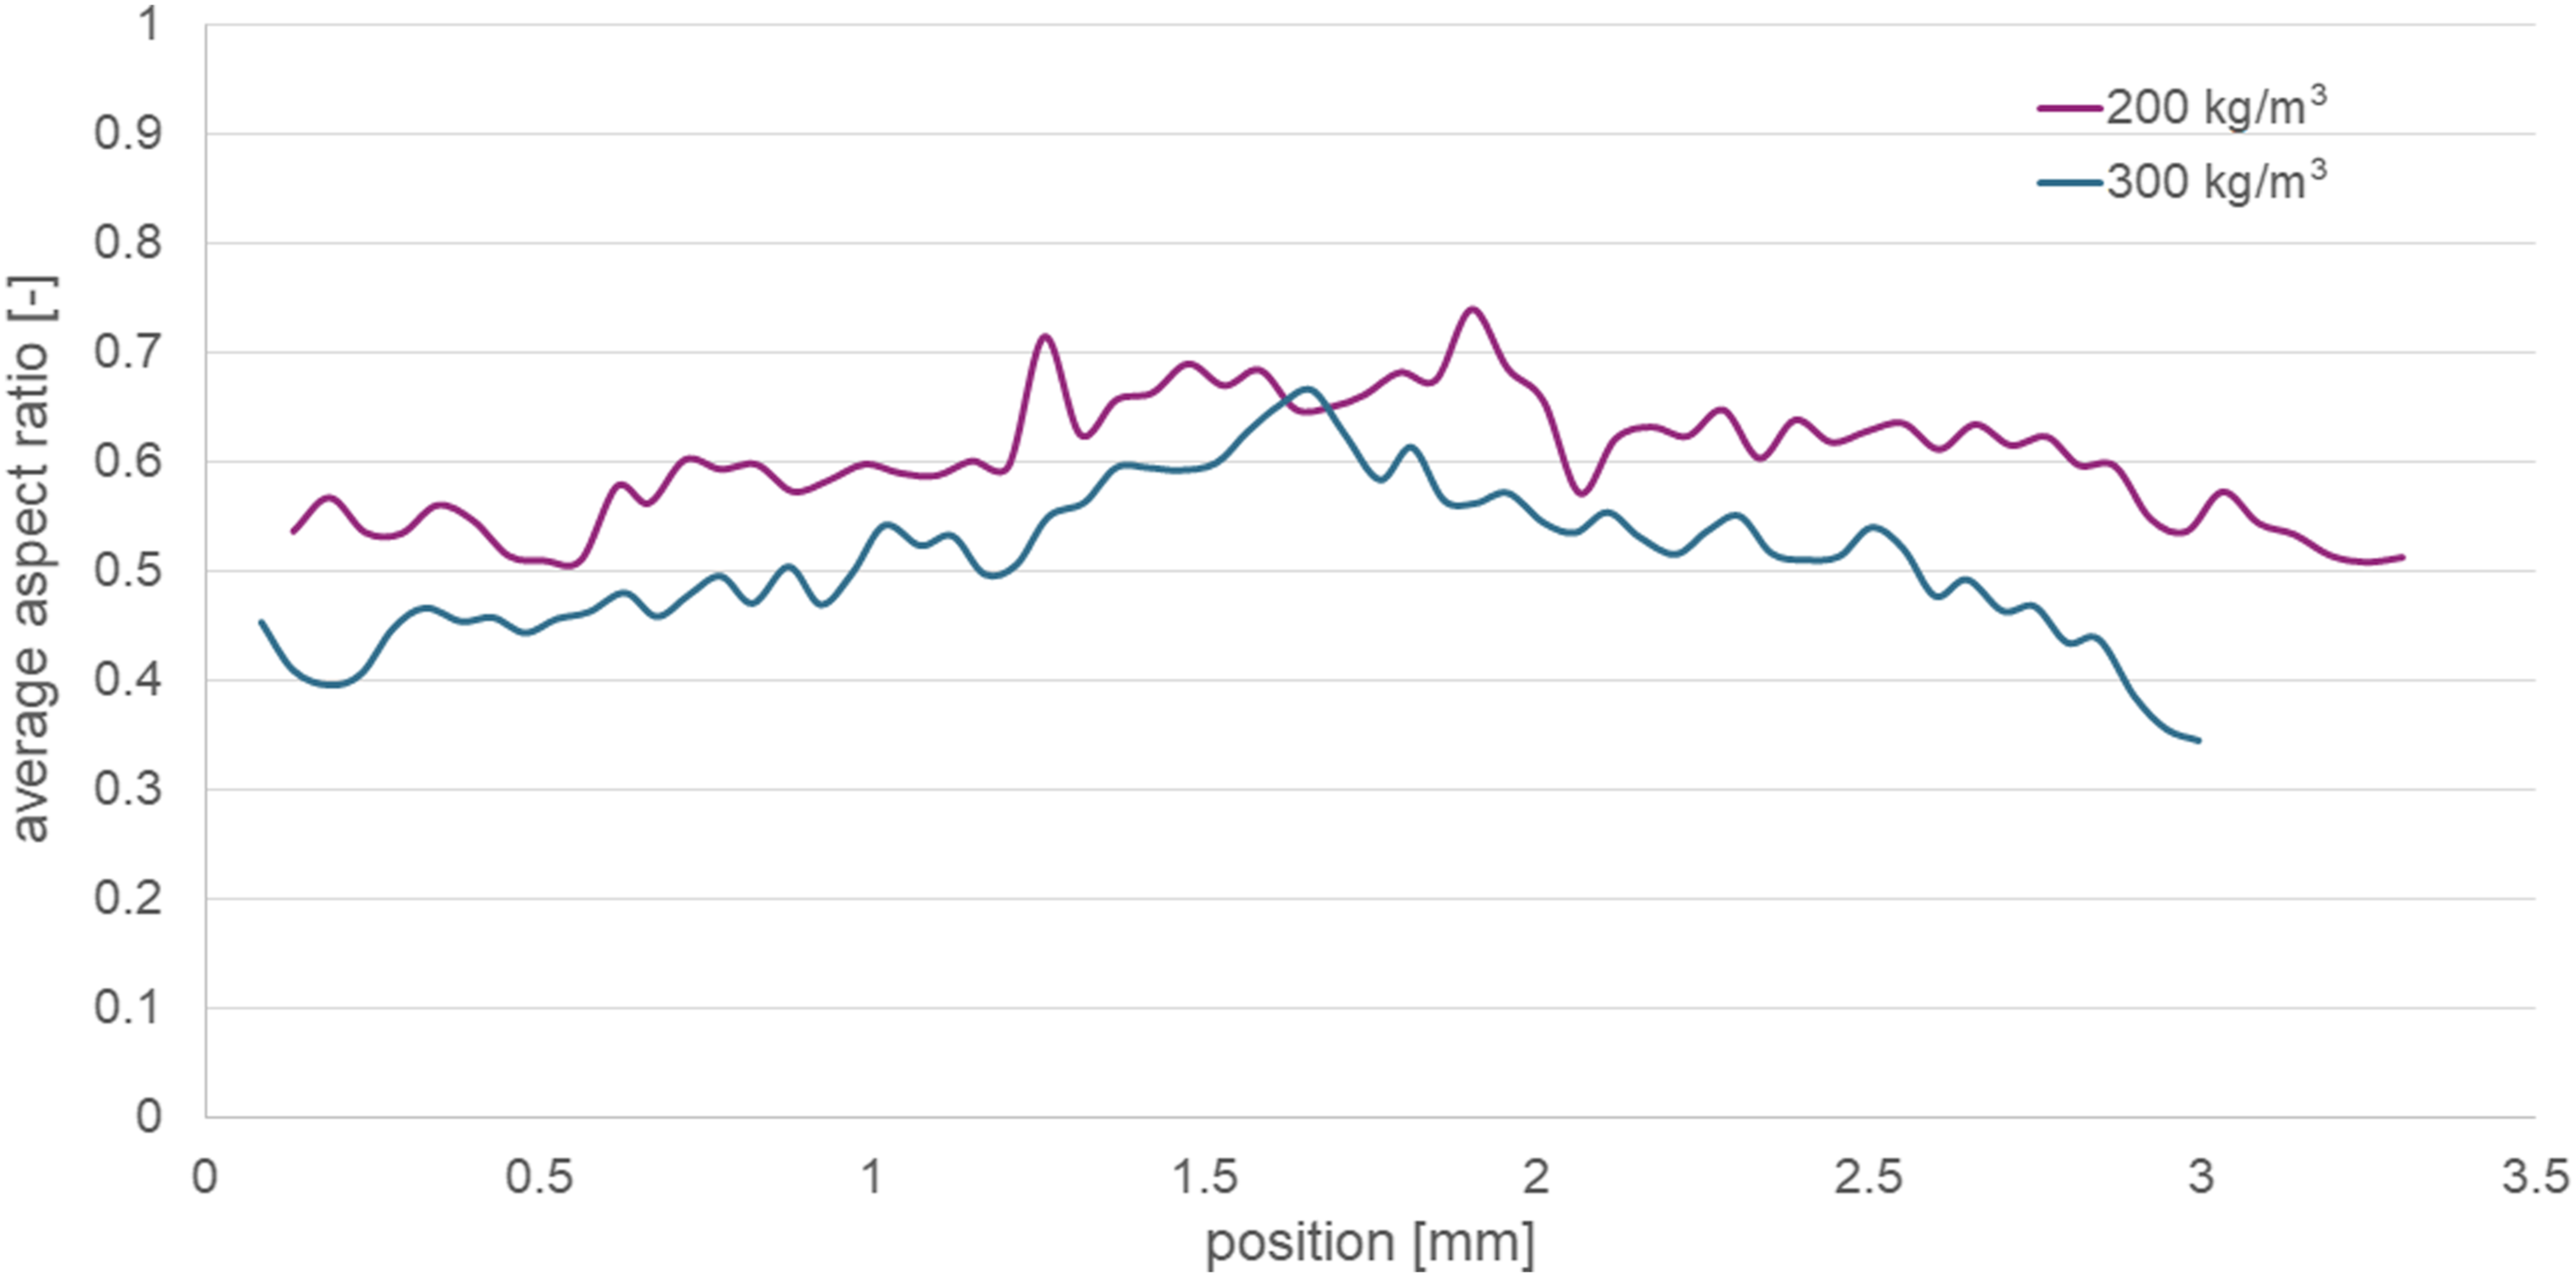
It can be seen that the average aspect ratio through the thickness of the foam with a density of 300 kg/m3 is lower than the average aspect ratio of the foam with a density of 200 kg/m3, which causes the more pronounced anisotropic behaviour. The average aspect ratio fluctuates through the thickness for both foams. In the boundary layers, the aspect ratio is lower than in the middle region, so the cells are more elongated. This is not easily implemented in the simulation model, and thus a simplified method is introduced to integrate the anisotropic shape of the cells in the model. The cell faces are scaled, which means that the faces are stretched by 5% in thickness direction and transverse to the machine direction (y- and z-direction) and compressed by 5% in machine direction (x-direction) (Figure 12). The amount of scaling is not easily evaluated from the CT measurement results but 5% scaling is assumed to be sufficient to introduce anisotropic cell shapes and therefore model the microstructure of the foam more realistically. Purple: original geometry, blue: scaled geometry.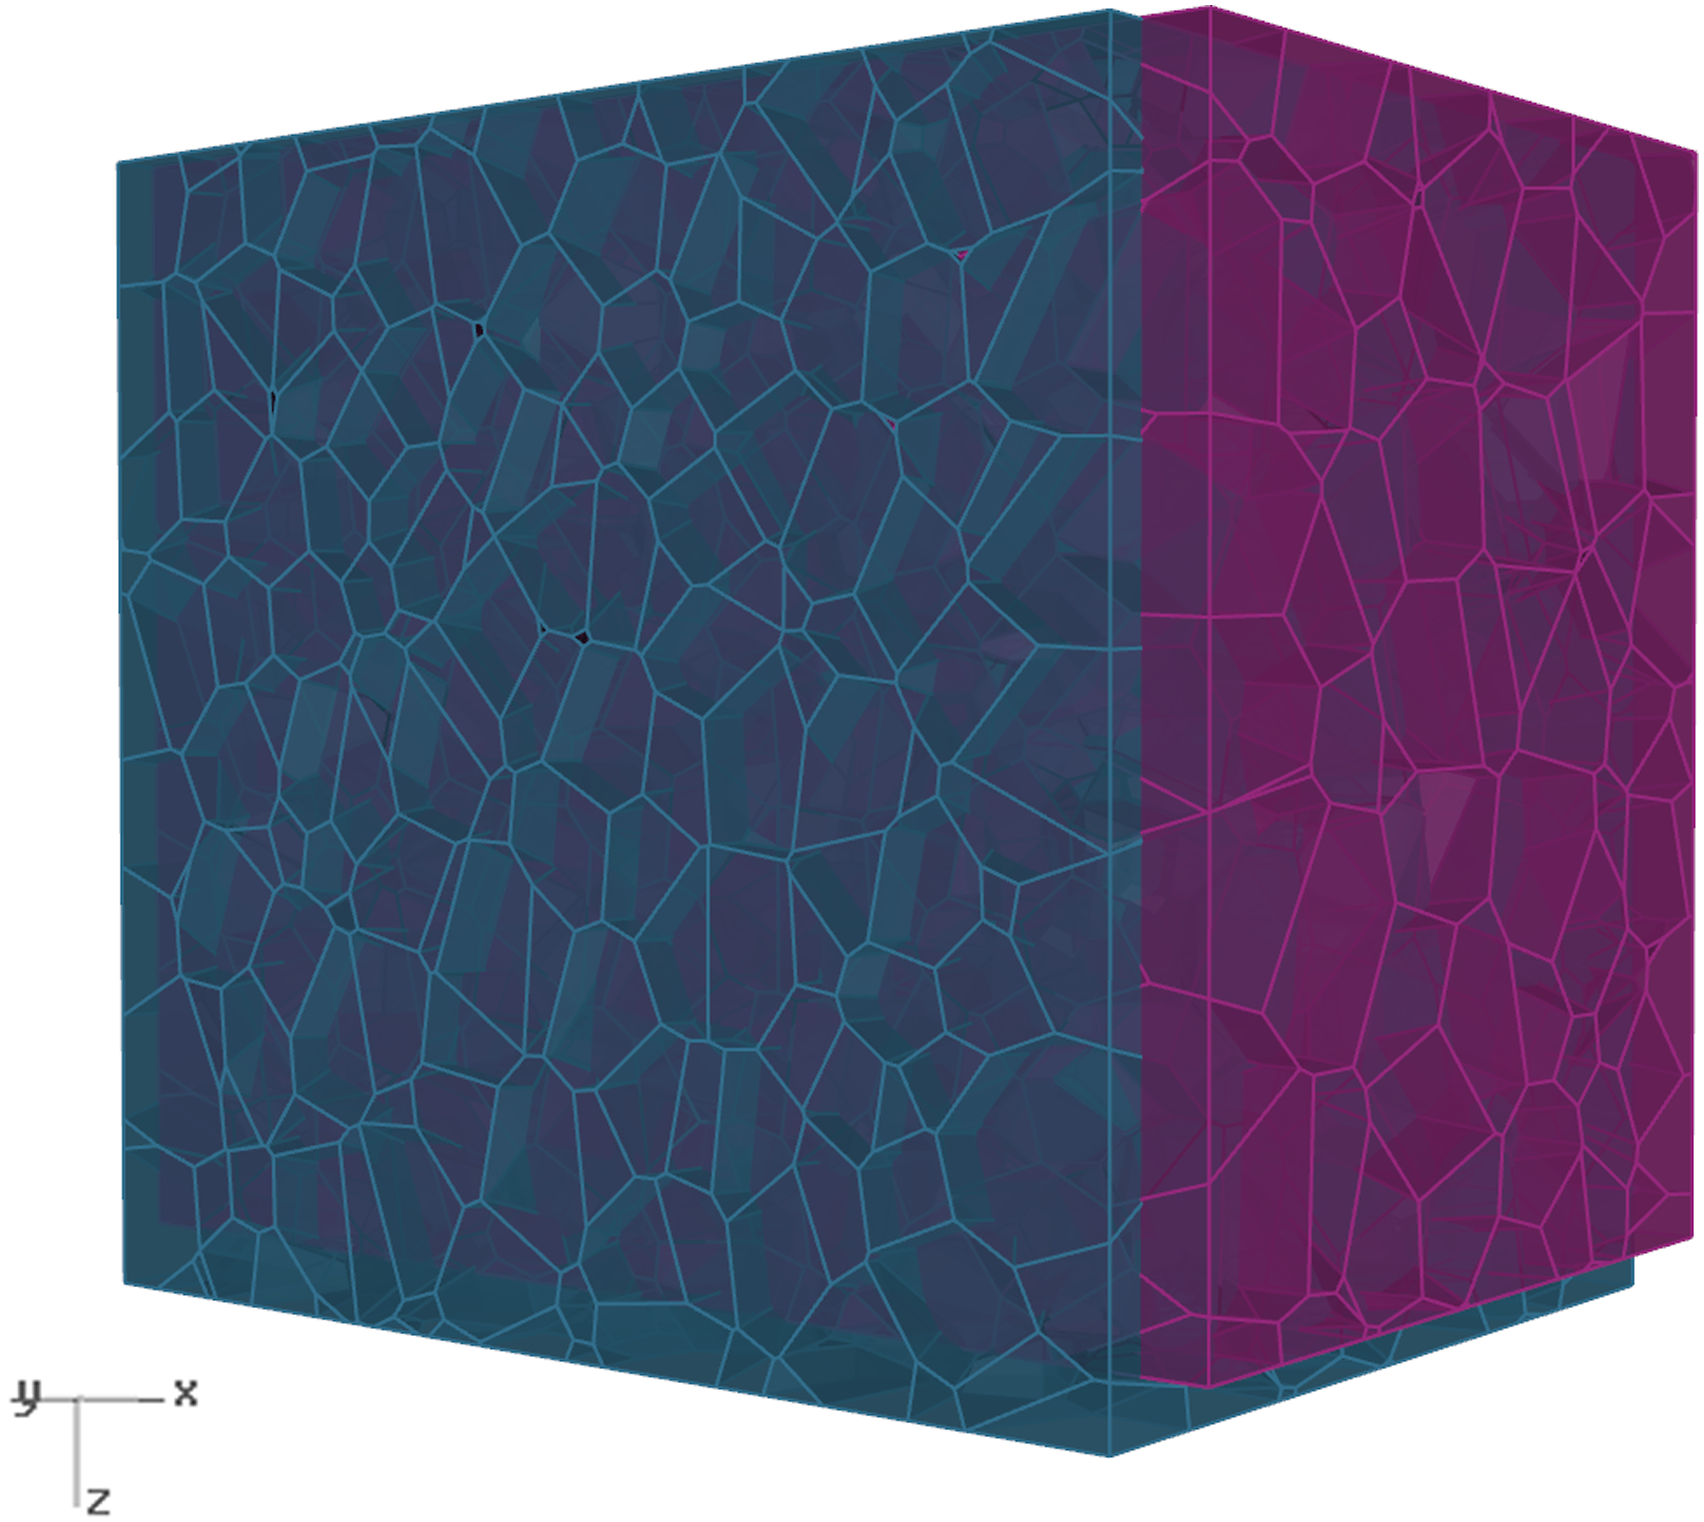
Results and discussion – improved model
In the following, the simulation results of the modified models are presented. The simulation methodology is the same as described in section ‘Simulation methodology’.
Increase of open cell content
The increase of the open cell content in the model of the foam with a density of 100 kg/m3 leads to a decrease of the stiffness, with the result that the stiffness determined in the simulation and the experimentally observed stiffness agree well (Figure 13). To investigate the influence of the open cell content on the Young’s modulus in more detail, further simulations with different open cell content and constant density (the shell thickness is adapted for each simulation so that the density is 100 kg/m3) are performed and the results are depicted in Figure 14. Comparison of the Young’s modulus values of the model with increased open cell content (20%) and the experimentally determined Young’s modulus for the foam with a density 100 kg/m3. Influence of the open cell content on the Young’s modulus values in machine direction of the model with a density of 100 kg/m3.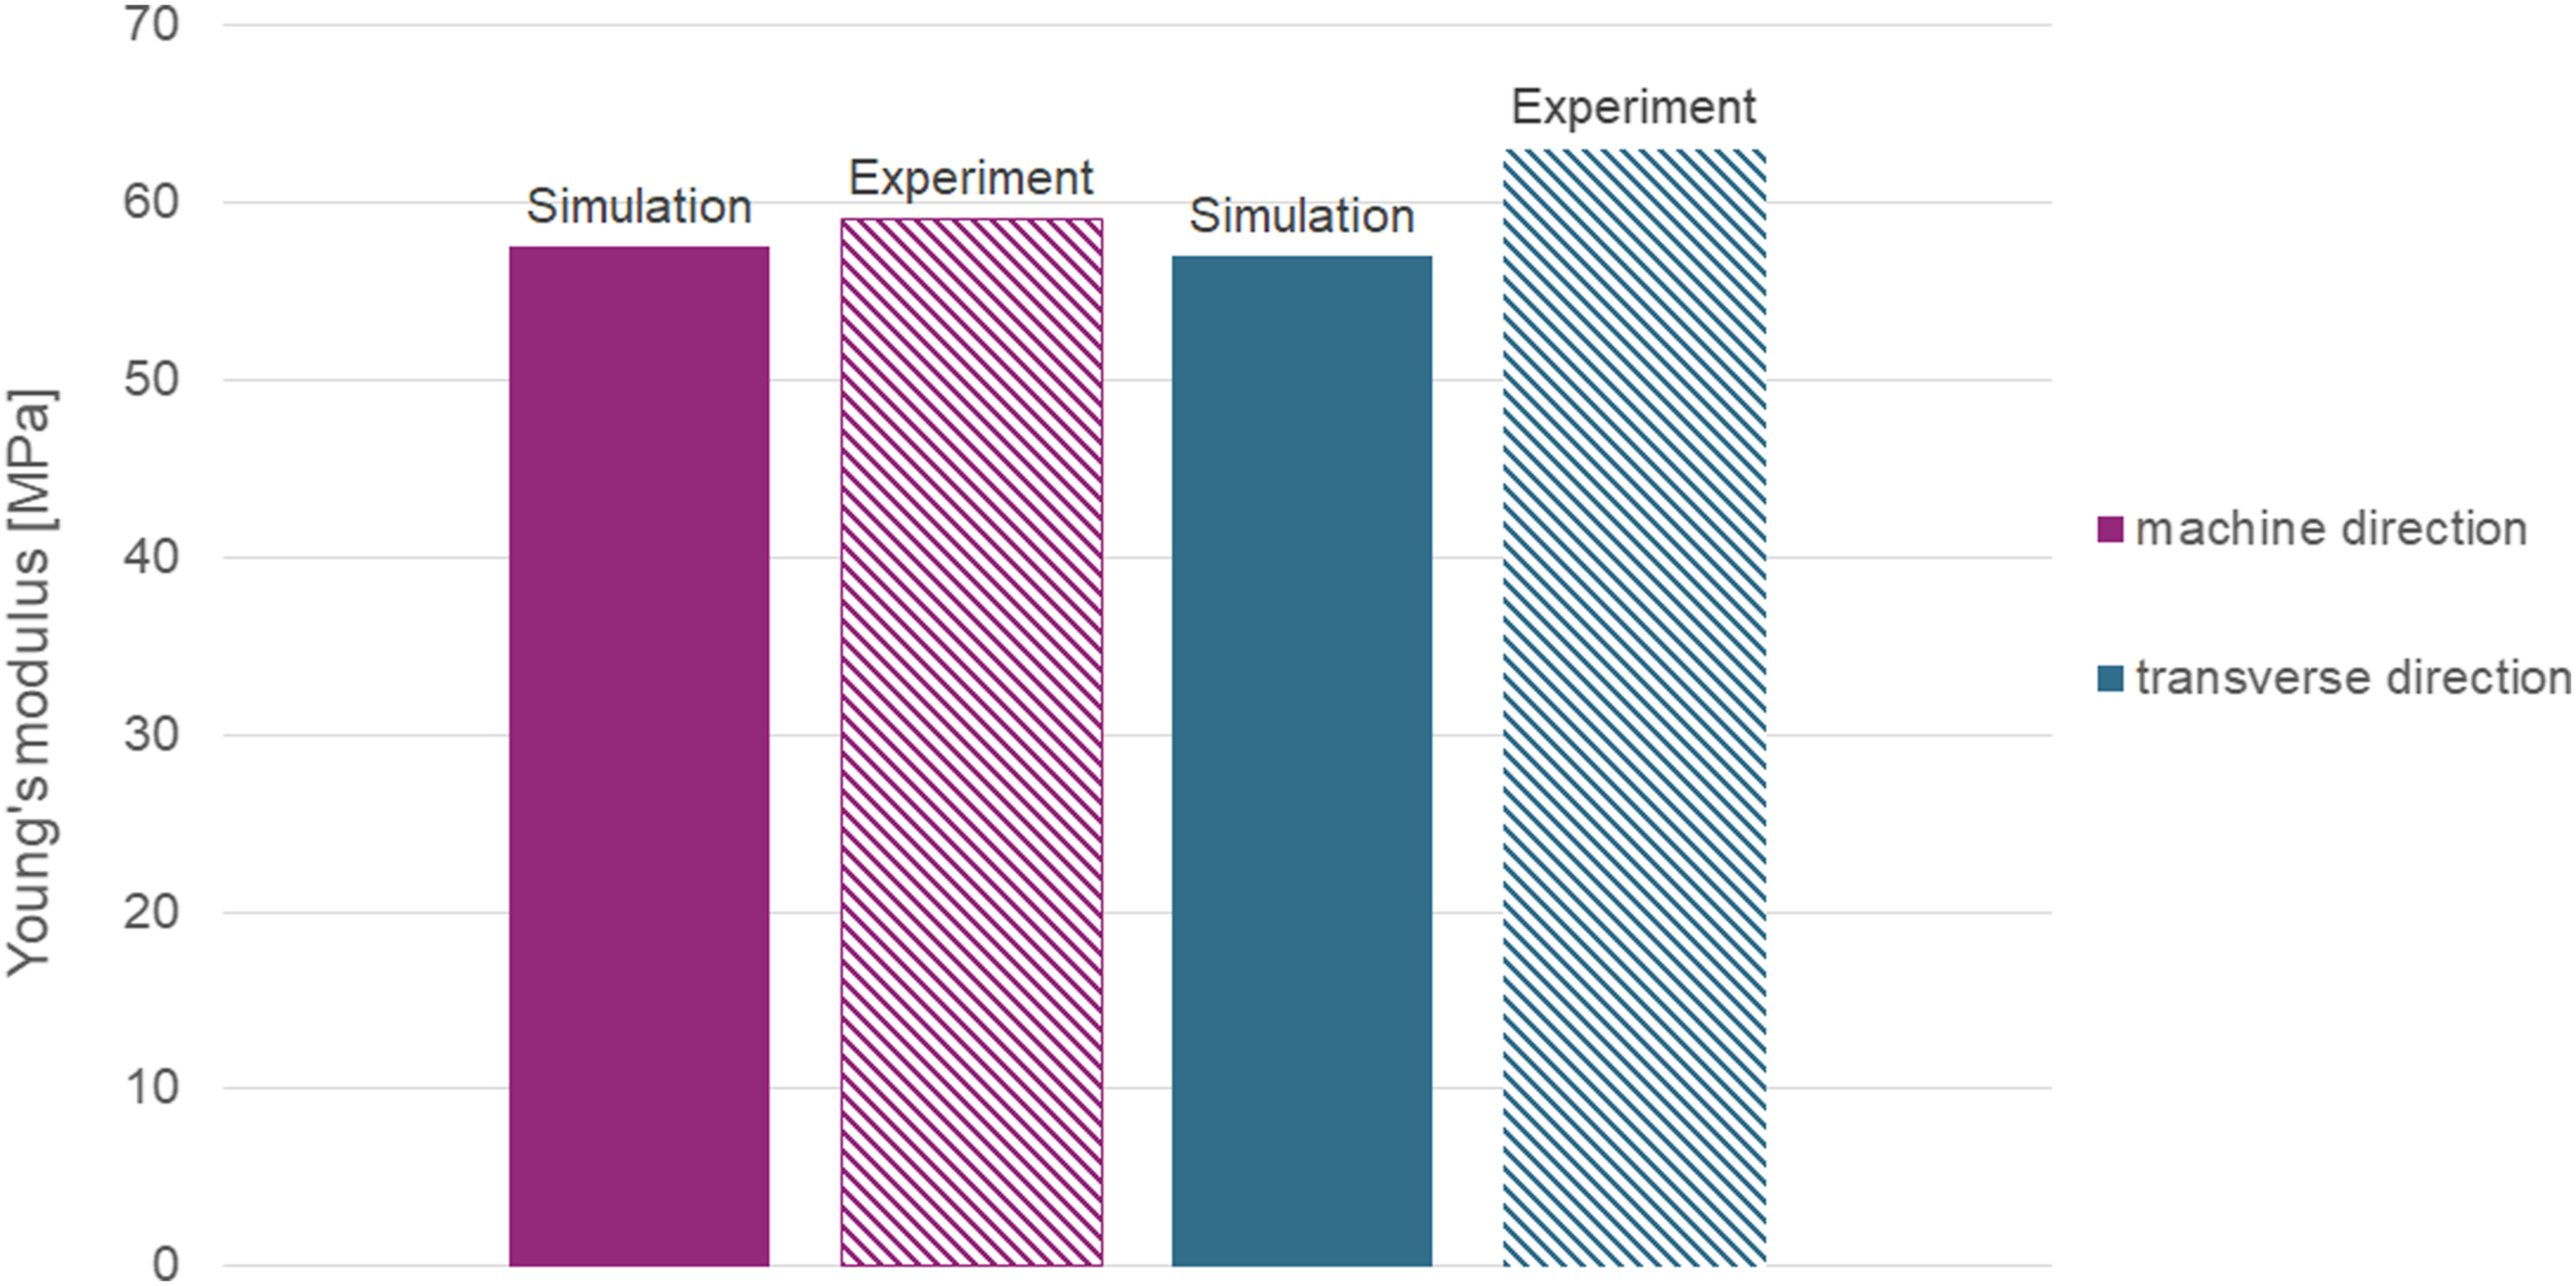
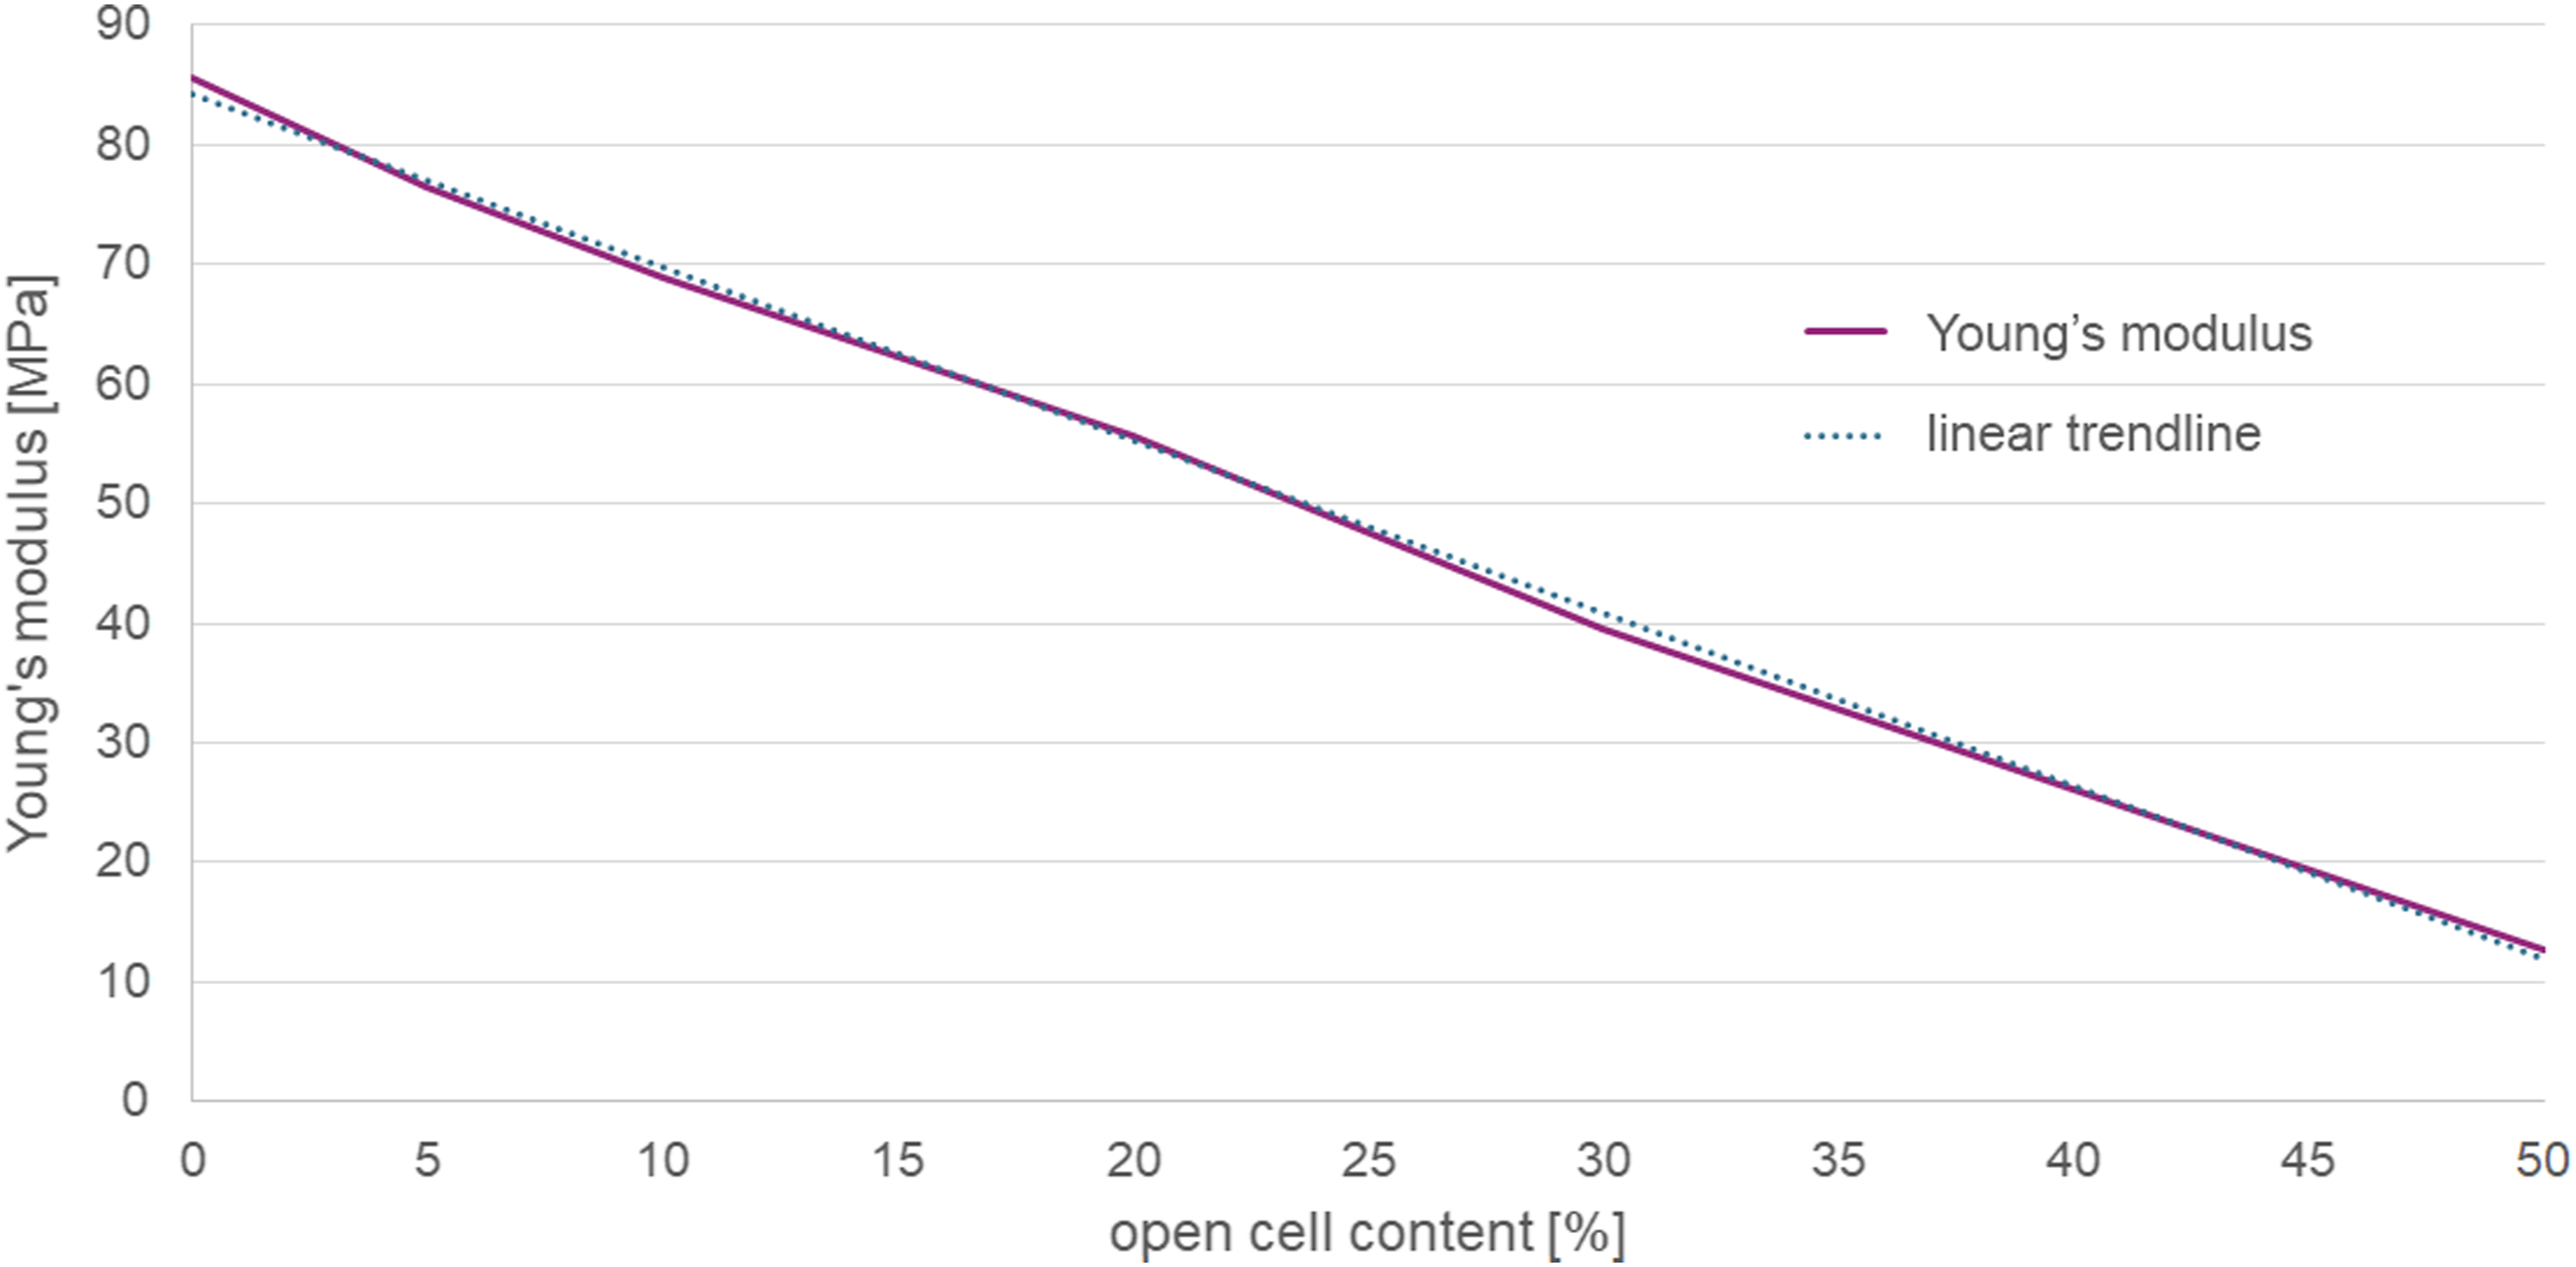
A nearly linear relation between the Young’s modulus and the open cell content is observed (for 0–50% open cell content): the higher the open cell content, the lower the Young’s modulus. For higher values of the open cell content, the Young’s modulus would approach 0 because at a certain open cell content a non-connecting foam is formed.
Implementation of anisotropy
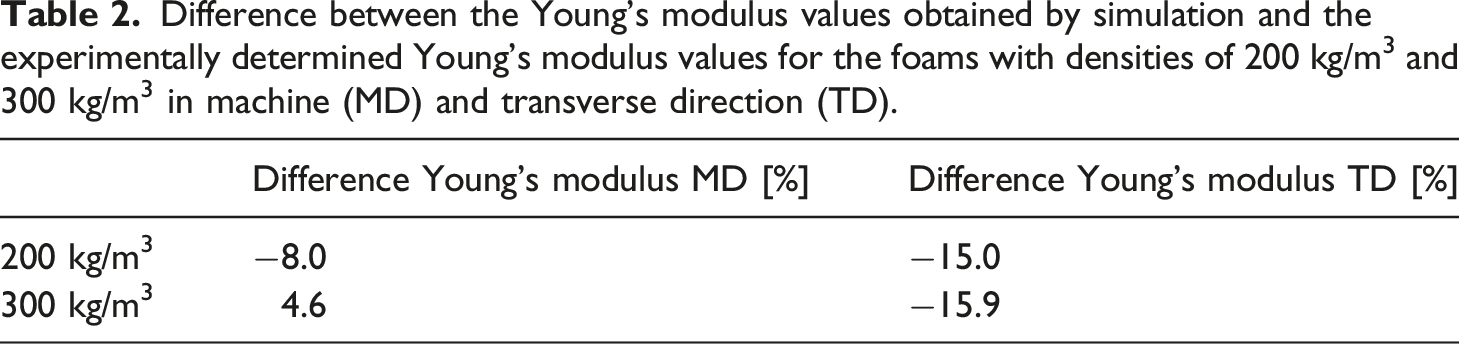
In Figure 15, the results of the modified model with the direction-dependent thicknesses and the anisotropic cell shapes are shown for the foams with densities of 200 kg/m3 and 300 kg/m3. The shaded bars illustrate the results of the Young’s modulus values of the original model, that is, constant shell thickness in the whole model and isotropic cell shapes. The difference between the Young’s modulus values obtained by simulation and the experimentally determined Young’s modulus values in machine direction and transverse direction are listed in Table 2. Illustration of the results of the model with direction dependent thicknesses and anisotropic cell shapes for the foams with densities of (a) 200 kg/m3 and (b) 300 kg/m3. Difference between the Young’s modulus values obtained by simulation and the experimentally determined Young’s modulus values for the foams with densities of 200 kg/m3 and 300 kg/m3 in machine (MD) and transverse direction (TD).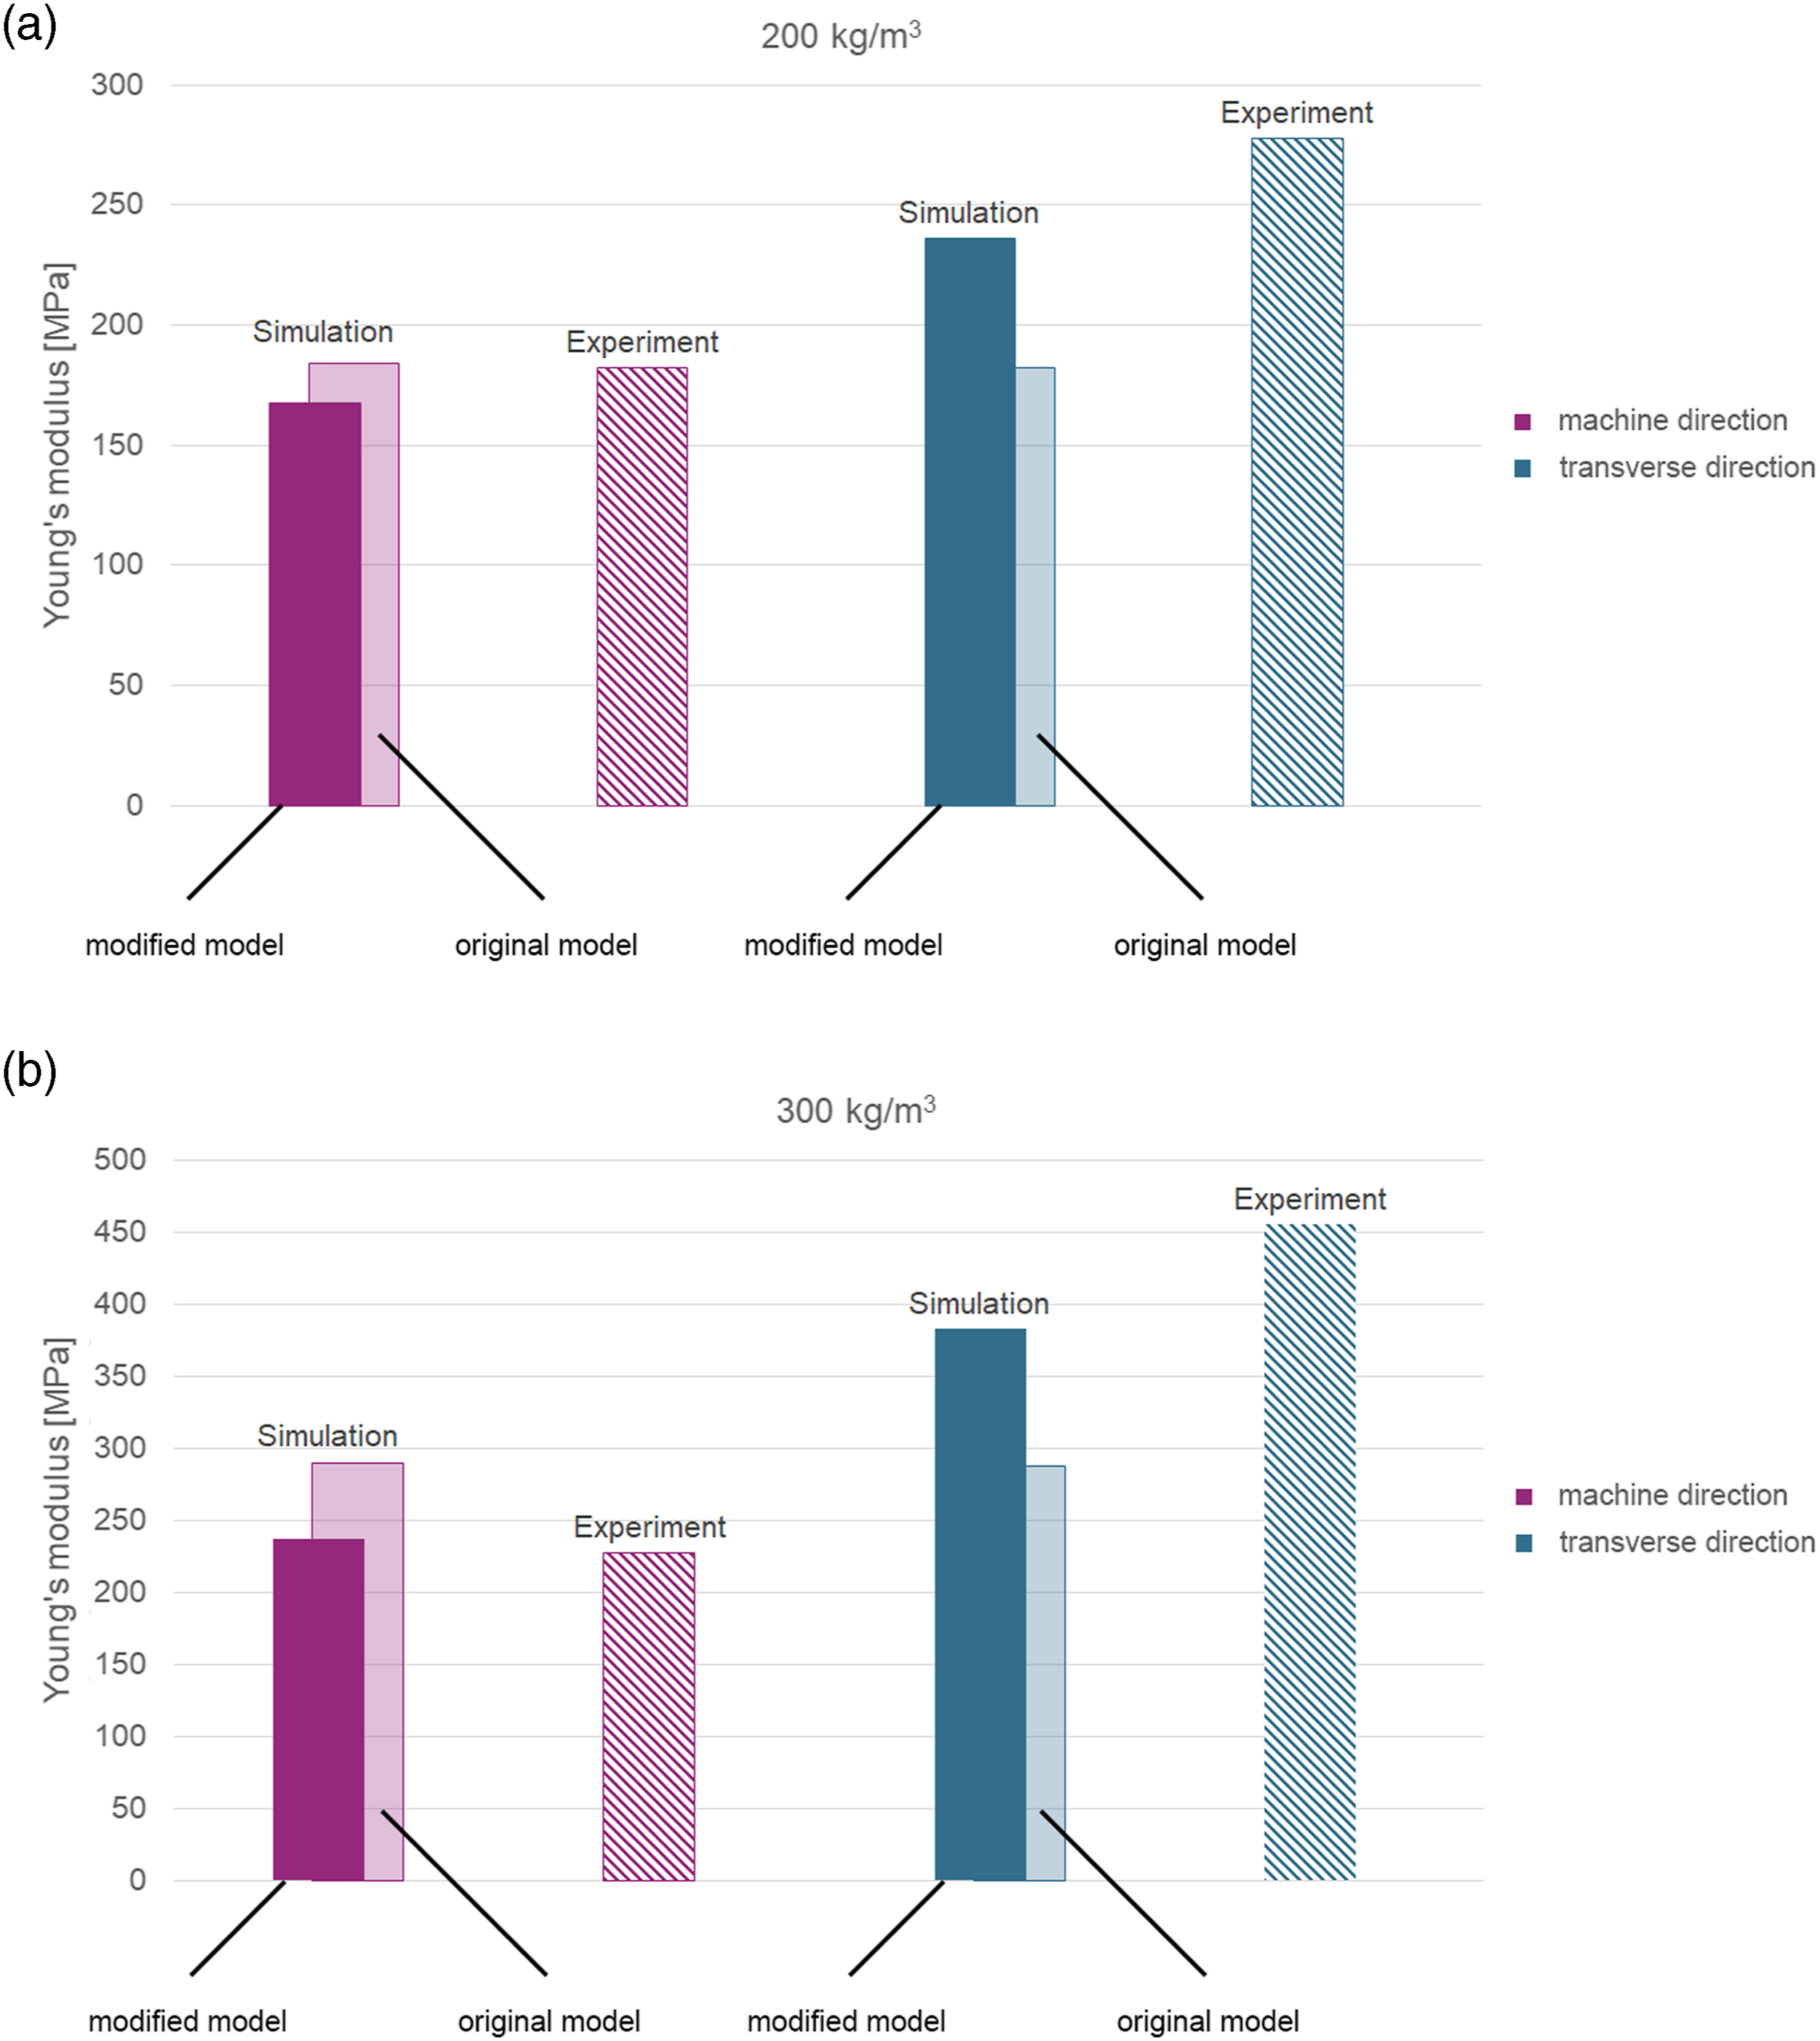
For the modified model of the foam with a density of 200 kg/m3, it can be seen that the Young’s modulus in transverse direction increased by 30%, so it is in better agreement with the experimental result than the Young’s modulus obtained by the original model. The Young’s modulus in machine direction decreased by 9%, but it is still in good agreement with the experimental result. For the foam with a density of 300 kg/m3, the results in machine and transverse direction are both improved by the modifications of the original model. It can be concluded that the simplified implementation of a direction-dependent thickness and an anisotropic cell shape is an appropriate method to incorporate the anisotropic behaviour into the model.
The influence of the direction-dependent thickness on the degree of anisotropy is investigated in more detail. Thus, several simulations with different shell thickness ratios are performed and the ratio of the modulus in machine direction to the modulus in transverse direction is evaluated. For the simulations, the model with anisotropic cell shapes is used. The ratio of the modulus in machine direction to the modulus in transverse direction indicates the degree of anisotropy: the lower the ratio, the higher the anisotropy. A ratio of one corresponds to an isotropic material behaviour. In Figure 16, the results are illustrated. The results show that the lower the shell thickness ratio, the lower the ratio of the modulus in machine direction to the modulus in transverse direction, which corresponds to a higher anisotropy. For a thickness ratio of 1, the model also shows an anisotropic behaviour which results from the anisotropic cell shapes. Influence of the shell thickness ratio on the ratio of the modulus in machine direction (MD) to the modulus in transverse direction (TD).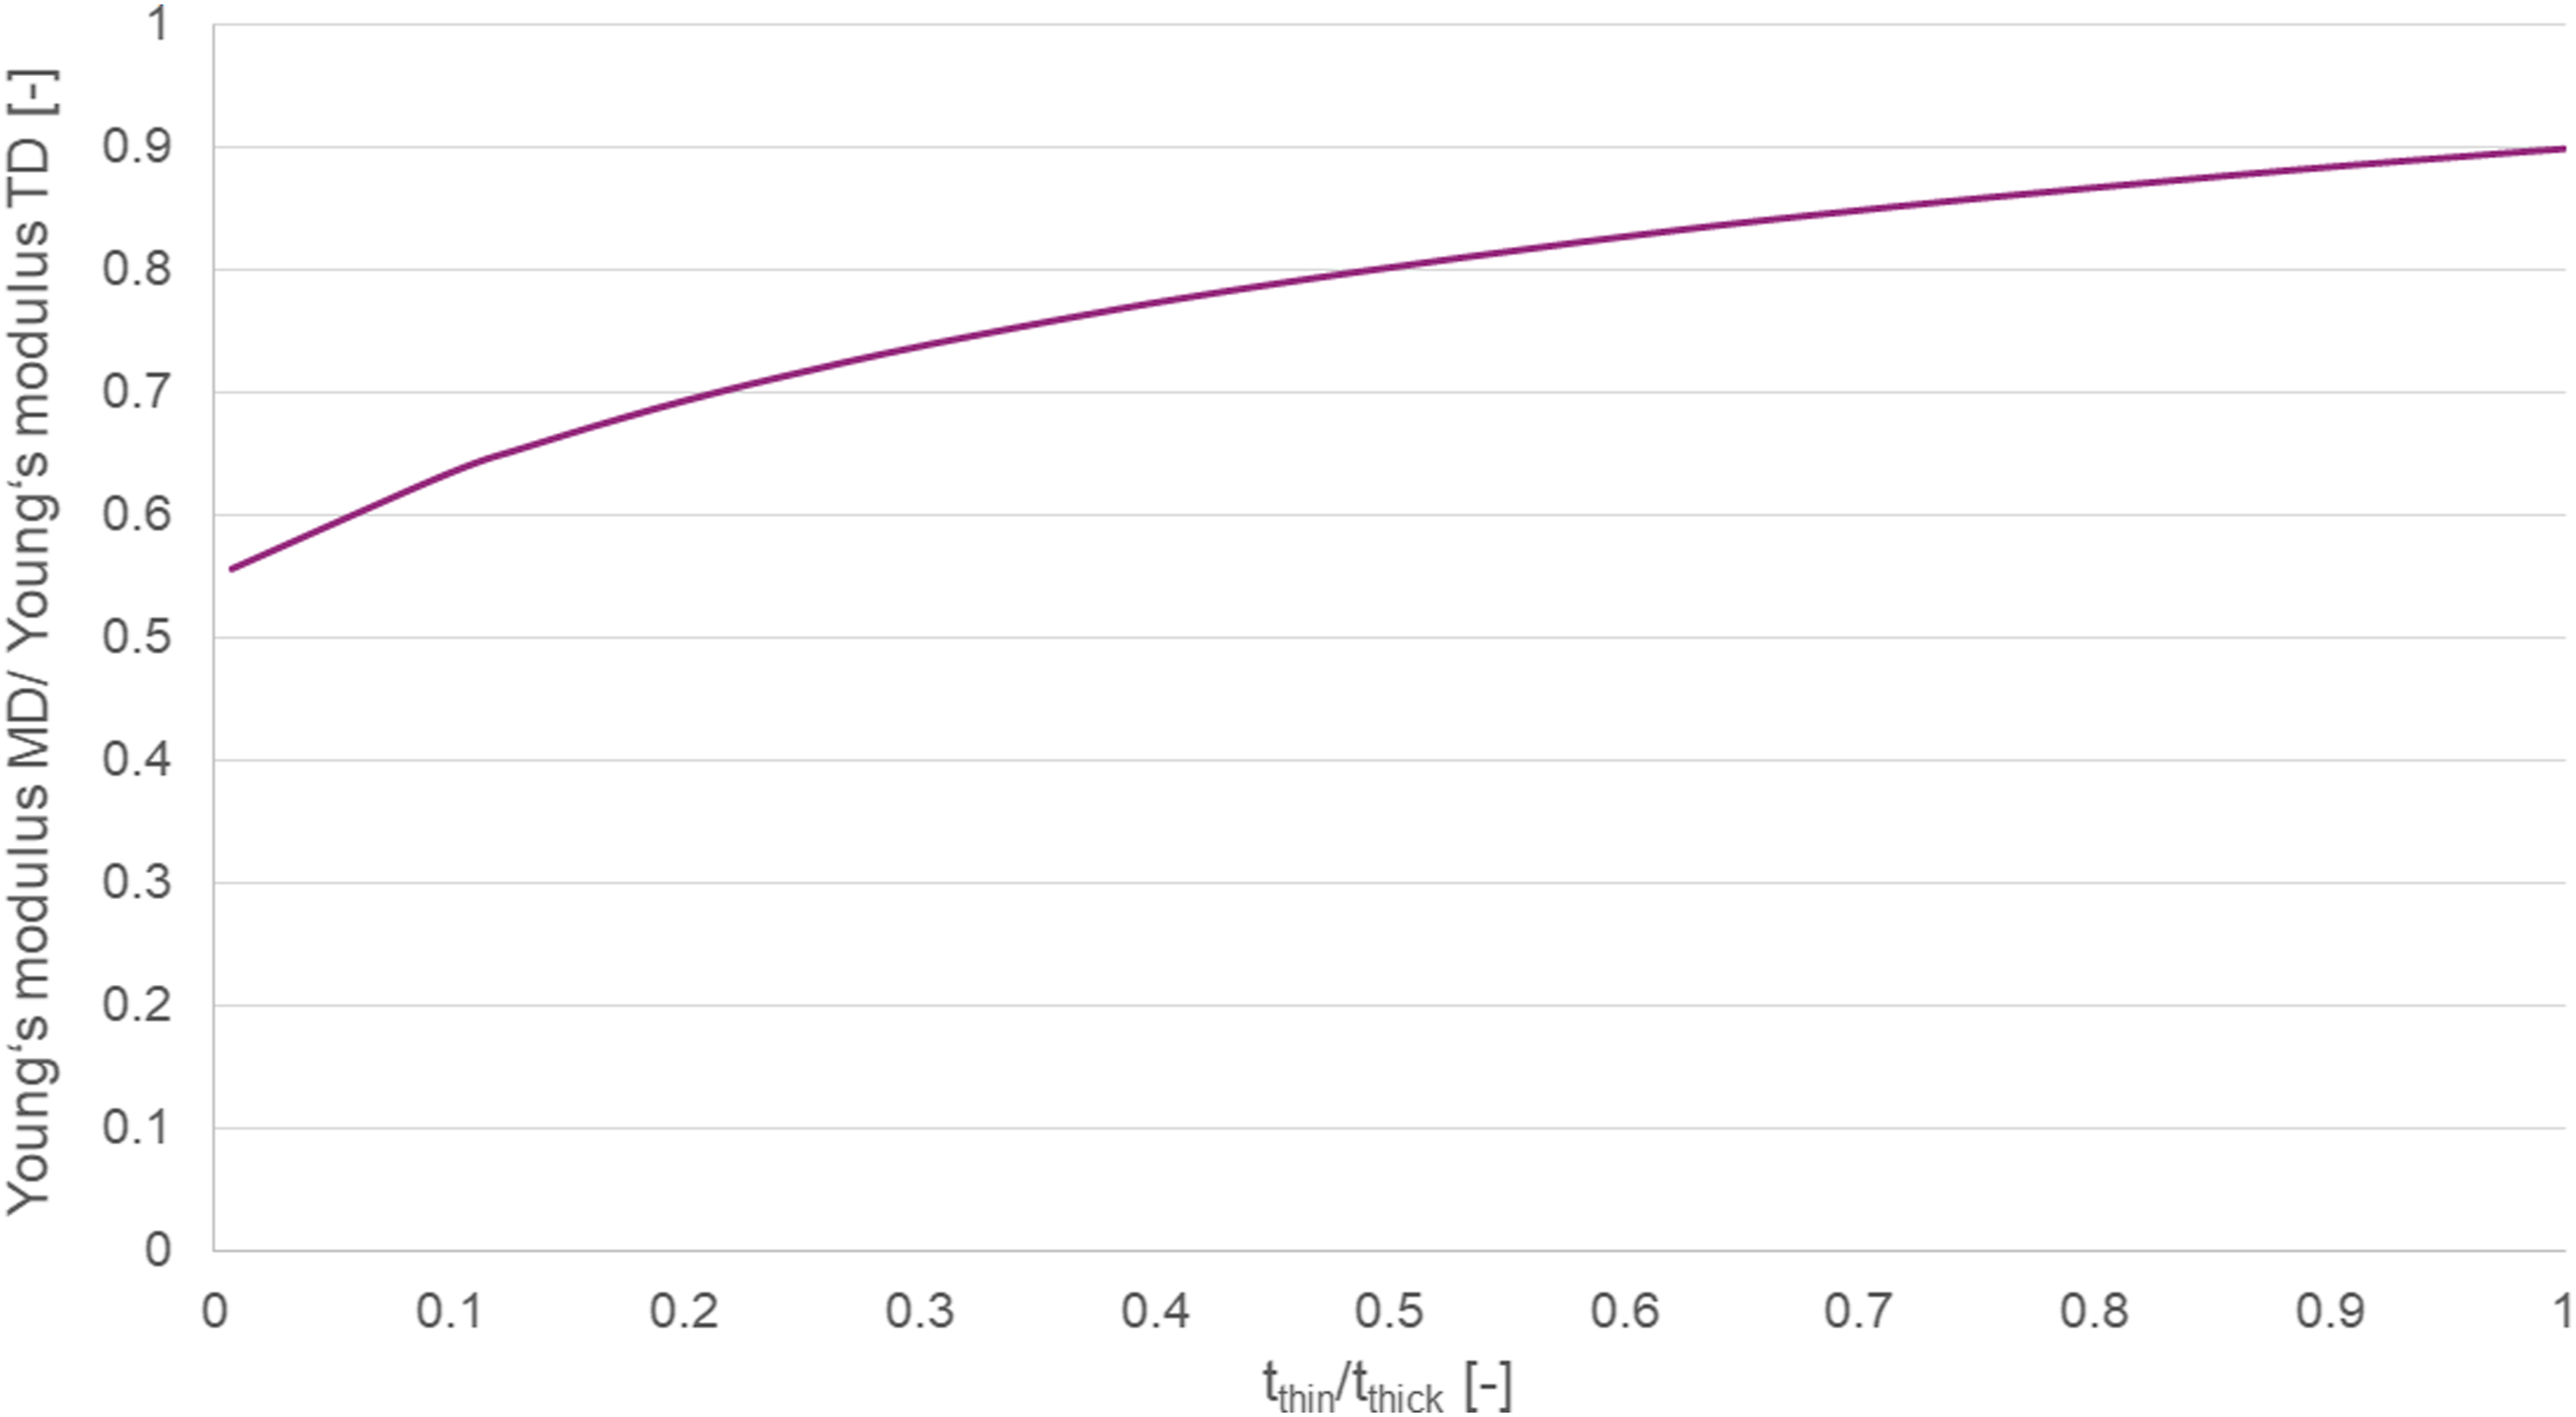
Conclusion
In this research work, the model generation of foams with low densities from CT data using Voronoi diagrams is described. The linear elastic simulation results of the created models were validated with experimental data and compared with several analytical models. The comparison showed that the Skeleton Cubic Cell Model and also the Kelvin Cell Model are proper analytical models to estimate the isotropic elastic behaviour of the investigated low density foams. The validation with the experimentally obtained Young’s modulus values indicated that the simulation models do not capture several specific microstructural features, like open cell content and cell shape distribution, thus the models were modified. In the model for the foam with a density of 100 kg/m3, the open cell content was increased according to the CT data by randomly deleting cell faces, which resulted in a lower Young’s modulus, and thus it led to a good agreement with the experimental results. The models of the foams with densities of 200 kg/m3 and 300 kg/m3 were modified to capture the anisotropic behaviour, which was experimentally investigated. The anisotropic behaviour was introduced by applying a direction-dependent cell wall thickness and by anisotropic cell shapes, which was implemented by scaling the faces. With this simple modification, the anisotropy could be captured in the model and the obtained results of the simulation models are in good agreement with the experimental results. In conclusion, it can be said that the presented approach is an efficient way to create simulation models for low density foams which capture important microstructural features. In a further study, the developed model will be utilized to investigate not only the linear elastic properties of foams (strain smaller than 1% for the investigated foam) but also the non-linear region (by implementing an elastic plastic material model) and the behaviour under complex loading conditions. Thus, the future scope is to examine if the simplified implementation of open cells and the anisotropic behaviour is also satisfactory for the non-linear region and for different loading conditions.
Footnotes
Declaration of conflicting interests
The author(s) declared no potential conflicts of interest with respect to the research, authorship, and/or publication of this article.
Funding
The author(s) received no financial support for the research, authorship, and/or publication of this article.