
Abstract
The non-linear material behaviour of low density polypropylene foams is investigated under several quasi-static loading conditions with a combined modelling technique based on computed tomography data and Voronoi diagrams. A simulation methodology for determining the linear elastic properties is introduced in Hössinger-Kalteis et al. (2021). In this paper, the methodology is extended regarding the material model, where additionally the non-linear region is considered. The model takes into account property determining microstructural features like orientation-dependent cell wall thicknesses and anisotropic cell shapes. Thus, the anisotropic material behaviour under tension and compression load is estimated for extrusion foams with different densities utilizing the microstructural simulation model. Based on the characterized behaviour under tension and compression, constitutive models are generated. These are implemented in bending test simulations due to lower computational effort. The simulation results are validated with experimental results, which shows that the model gives satisfactory results.
Introduction
The computational characterization of the mechanical behaviour of cellular materials is not an easy task because the properties are dependent on several design variables (bulk material, cell topology/shape and relative density).1,2 In literature, different modelling and simulation approaches are presented.3,4 The linear elastic properties of foams can be determined quite well with analytical models (e.g. Skeleton Cubic Cell Model, 5 Kelvin Cell Model,6,7 Isotropic Flat Plate Model,8,9 Mori Tanaka Model10,11 and Ramakrishnan-Arunachalam Model 12 ), but they are not very suitable for the estimation of the non-linear elastic region and for the characterization of the anisotropic behaviour of foams. Beside the analytical models, there are finite element models for foams which can be used to investigate the linear but also the non-linear mechanical behaviour of foams. These models can be, for example, generated directly from computed tomography (CT) scans. Computed tomography measurements are very common to investigate the foam microstructure.13,14 The advantage of this modelling approach is that the obtained microstructure is similar to the real foam microstructure because features like cell size and cell shape distributions are captured in detail.15–18 The drawbacks are the high modelling effort due to several post-processing steps and the high computational effort due to the detailed microstructure which results in a high number of elements. A further way to generate finite element models is the use of Voronoi diagrams that are a special space division technique and tessellation method, respectively.19,20 The obtained microstructure resulting from this approach is simplified compared to the microstructure of the CT models, which reduces the computational effort. The Voronoi approach is further developed in order to create models considering important microstructural features (e.g. cell size distribution and anisotropic cell shape). Cell size distributions can be implemented, for example, by using Voronoi diagrams with Laguerre geometry20–27 and anisotropic cell shapes by using Set Voronoi diagrams.28,29 In our previous research work, 1 a Voronoi-based approach is presented, where microstructural features like cell size distribution, anisotropic cell shape, cell wall thickness distribution and open cell content are considered. Computed tomography measurement results are utilized as input for the Voronoi diagrams to get specific information of the microstructure to replicate the cell size distribution of the investigated low density extrusion foam. Depending on the foam density, the foam shows a certain open cell content and anisotropic mechanical properties due to anisotropic cell shapes and cell wall thickness distributions resulting from the manufacturing process.30,31 These features are implemented in a simplified way (orientation-dependent shell thickness and direction-dependent scaling of the microcell) and thus considered in the model. The comparison of the results of the linear elastic simulations and the experiments shows that the developed model is suitable for the determination of the linear elastic properties of low density foams.
In this research work, the non-linear mechanical behaviour of low density foams under tension and compression load is investigated using models obtained by the above described approach which is based on Voronoi diagrams combined with CT data. 1 The simulation results are validated with experimental results to evaluate the accuracy of the model. Moreover, constitutive material models are generated from the tensile and compressive test simulation results of the microstructural model, which are used for conducting bending test simulations. In contrast to the tensile and compressive test simulations, the real specimen dimensions have to be used for the bending test simulations. If the whole specimen was modelled with detailed microstructure, the modelling and computational effort would be prohibitively high. Thus, no bending test simulations with the microstructural model are performed. A computer with 8 cores and 3.8 GHz was used to perform all simulations. The simulation time varies from minutes (for the constitutive model) to several hours (for the microstructural model).
Tensile and compressive test simulation
In the following section, the methodology for the tensile and compressive test simulations is presented.
Modelling and simulation methodology
Microstructural models are created for three extrusion foams with different densities (100 kg/m3, 200 kg/m3 and 300 kg/m3) with the CT data–based Voronoi approach. This is discussed in detail in Hössinger-Kalteis et al. (2021),
1
and therefore, only a short overview is given here (Figure 1). Overview of the computed tomography data–based Voronoi approach.
1
.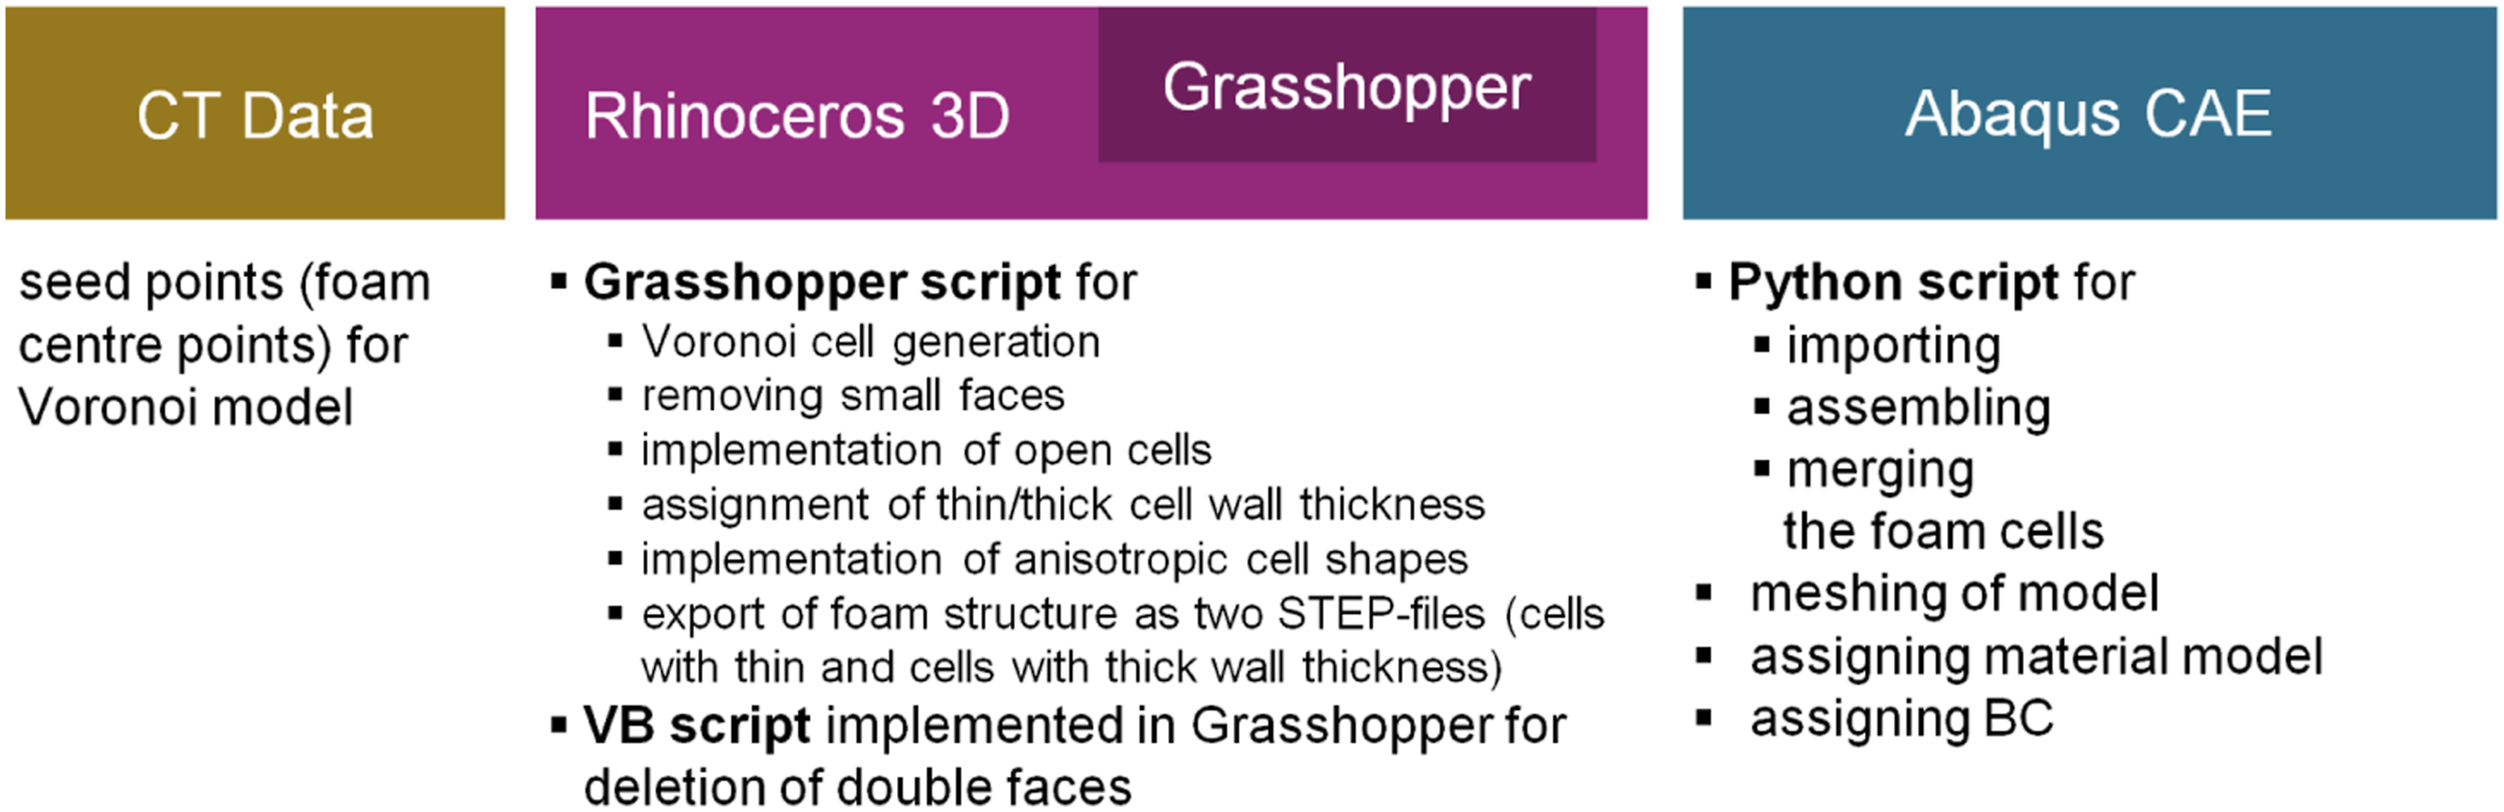
3D shell models of low density foams are created with Voronoi diagrams in the software Rhinoceros 3D (Robert McNeel & Associates) and its plug-in Grasshopper. From CT measurement results (X-ray CT with an isometric voxel size of 3 μm), the cell centre points are identified which are used as input for the Voronoi diagrams. This enables the generation of a microstructure with a cell size distribution similar to the real foam microstructure. For the foam with a density of 100 kg/m3, the experimentally investigated open cell content of 20% is modelled by deleting 20% of the cell wall faces. For the foams with densities of 200 kg/m3 and 300 kg/m3, the open cell content is negligible. The experimental tensile test results of the foam with a density of 100 kg/m3 show an isotropic behaviour, whereas an anisotropic behaviour is observed for the foams with densities of 200 kg/m3 and 300 kg/m3. In the CT scans, it can be seen that the cell wall thickness is not constant and the cell shape is anisotropic caused by the extrusion process (Figure 2(a)). Illustrations of (a) the microstructure of the foam with a density of 200 kg/m3 obtained from computed tomography scans and (b) the microstructure obtained by the Voronoi diagram approach; cell faces with thinner (blue) and thicker (purple) cell wall thickness.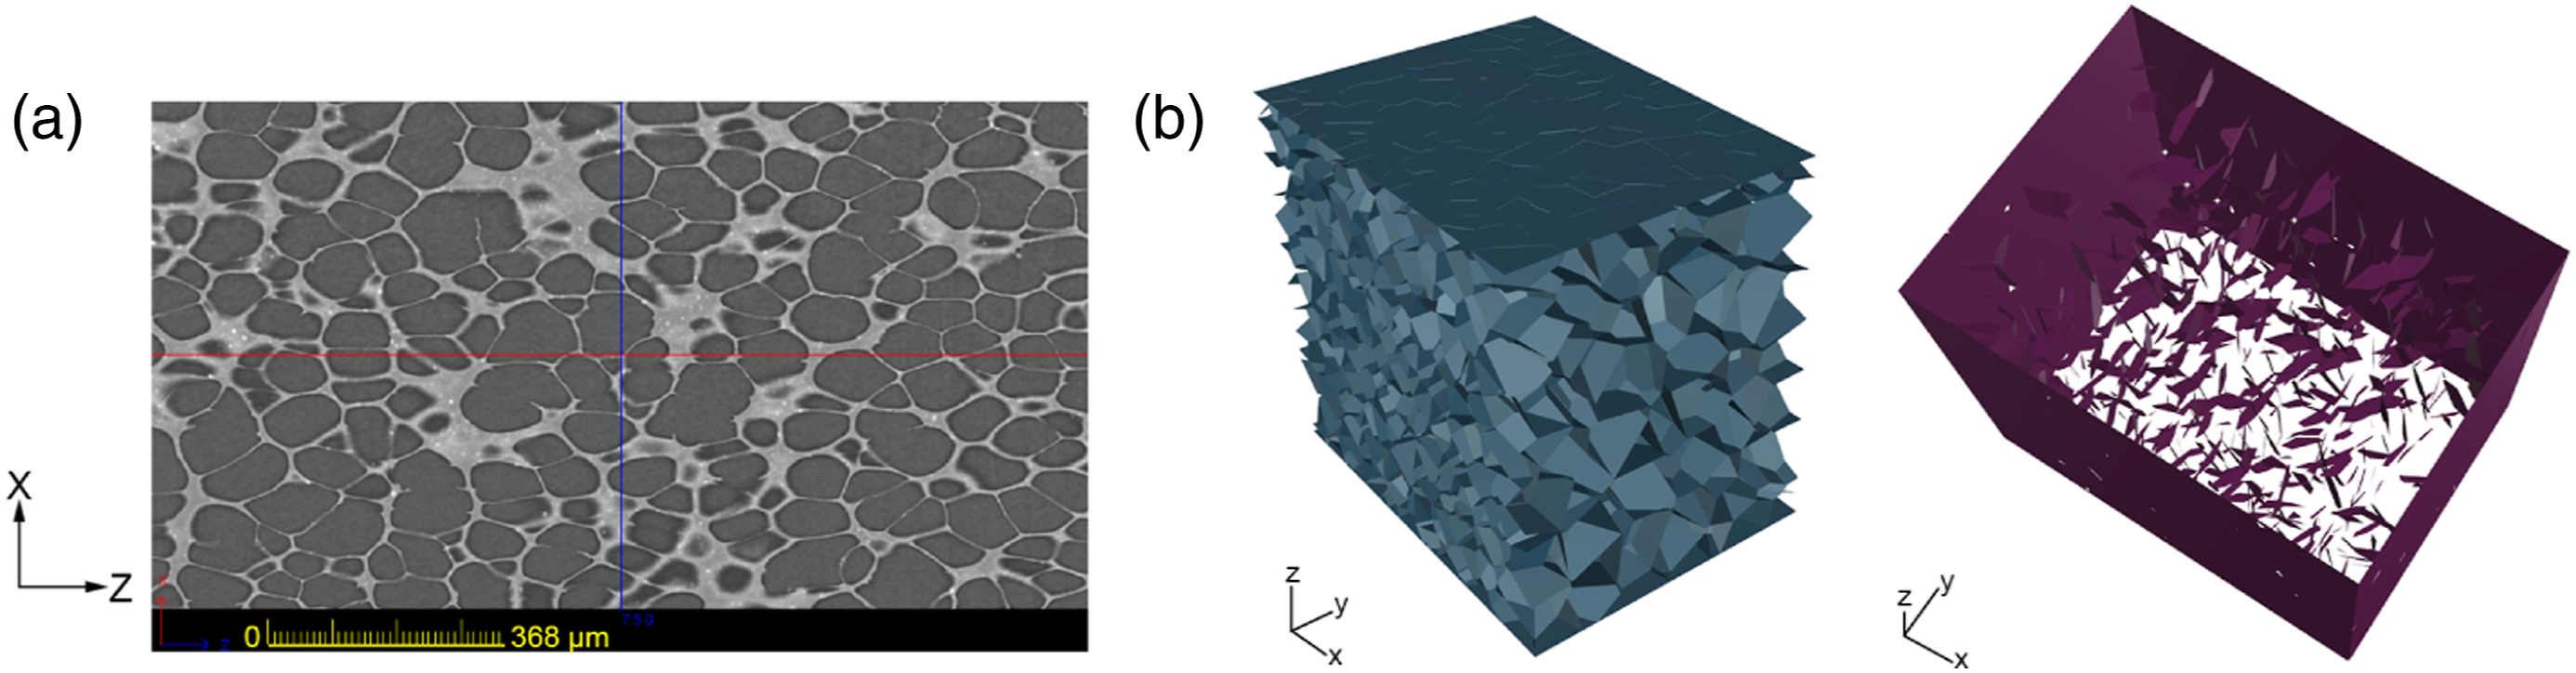
The degree of anisotropy is evaluated from CT scans. The average aspect ratio (average aspect ratio of a specific plane in the thickness direction of the microcell; an average aspect ratio of one would mean an isotropic cell shape) of the foam cells is determined. It is lower for the foam with a density of 300 kg/m3 than for the foam with a density of 200 kg/m3, which causes a more pronounced anisotropic behaviour. The values fluctuate through the thickness meaning a lower value in the boundary regions than in the middle region (for the foam with a density of 300 kg/m3, the value is approximately 0.4 in the boundary region and approximately 0.65 in the middle region). The varying cell wall thickness and the anisotropic cell shape are not easily implemented in the simulation models, and therefore these microstructural features are implemented in a simplified way by an orientation-dependent shell thickness (Figure 2 (b)), by compressing the faces in the machine (extrusion) direction, and by stretching the faces in thickness and transverse direction. The dimensions of the simulation models are small (e.g. for the foam with a density of 100 kg/m3 the dimensions are 3 mm ×3.5 mm × 3 mm in machine, thickness and transverse direction) compared to the dimensions of the specimen used for the experiments (ISO 527-2 typ 1B), otherwise the computational effort would be too high. Nevertheless, it has to be verified if the simulation models are representative for the entire foam microstructure.32,33 For the investigation of the mechanical behaviour of the extrusion foams under tension and compression load, the elastic plastic material model (Mises yield surface, isotropic hardening and associated plastic flow Illustration of the elastic plastic material model used for the tensile and compressive test simulations.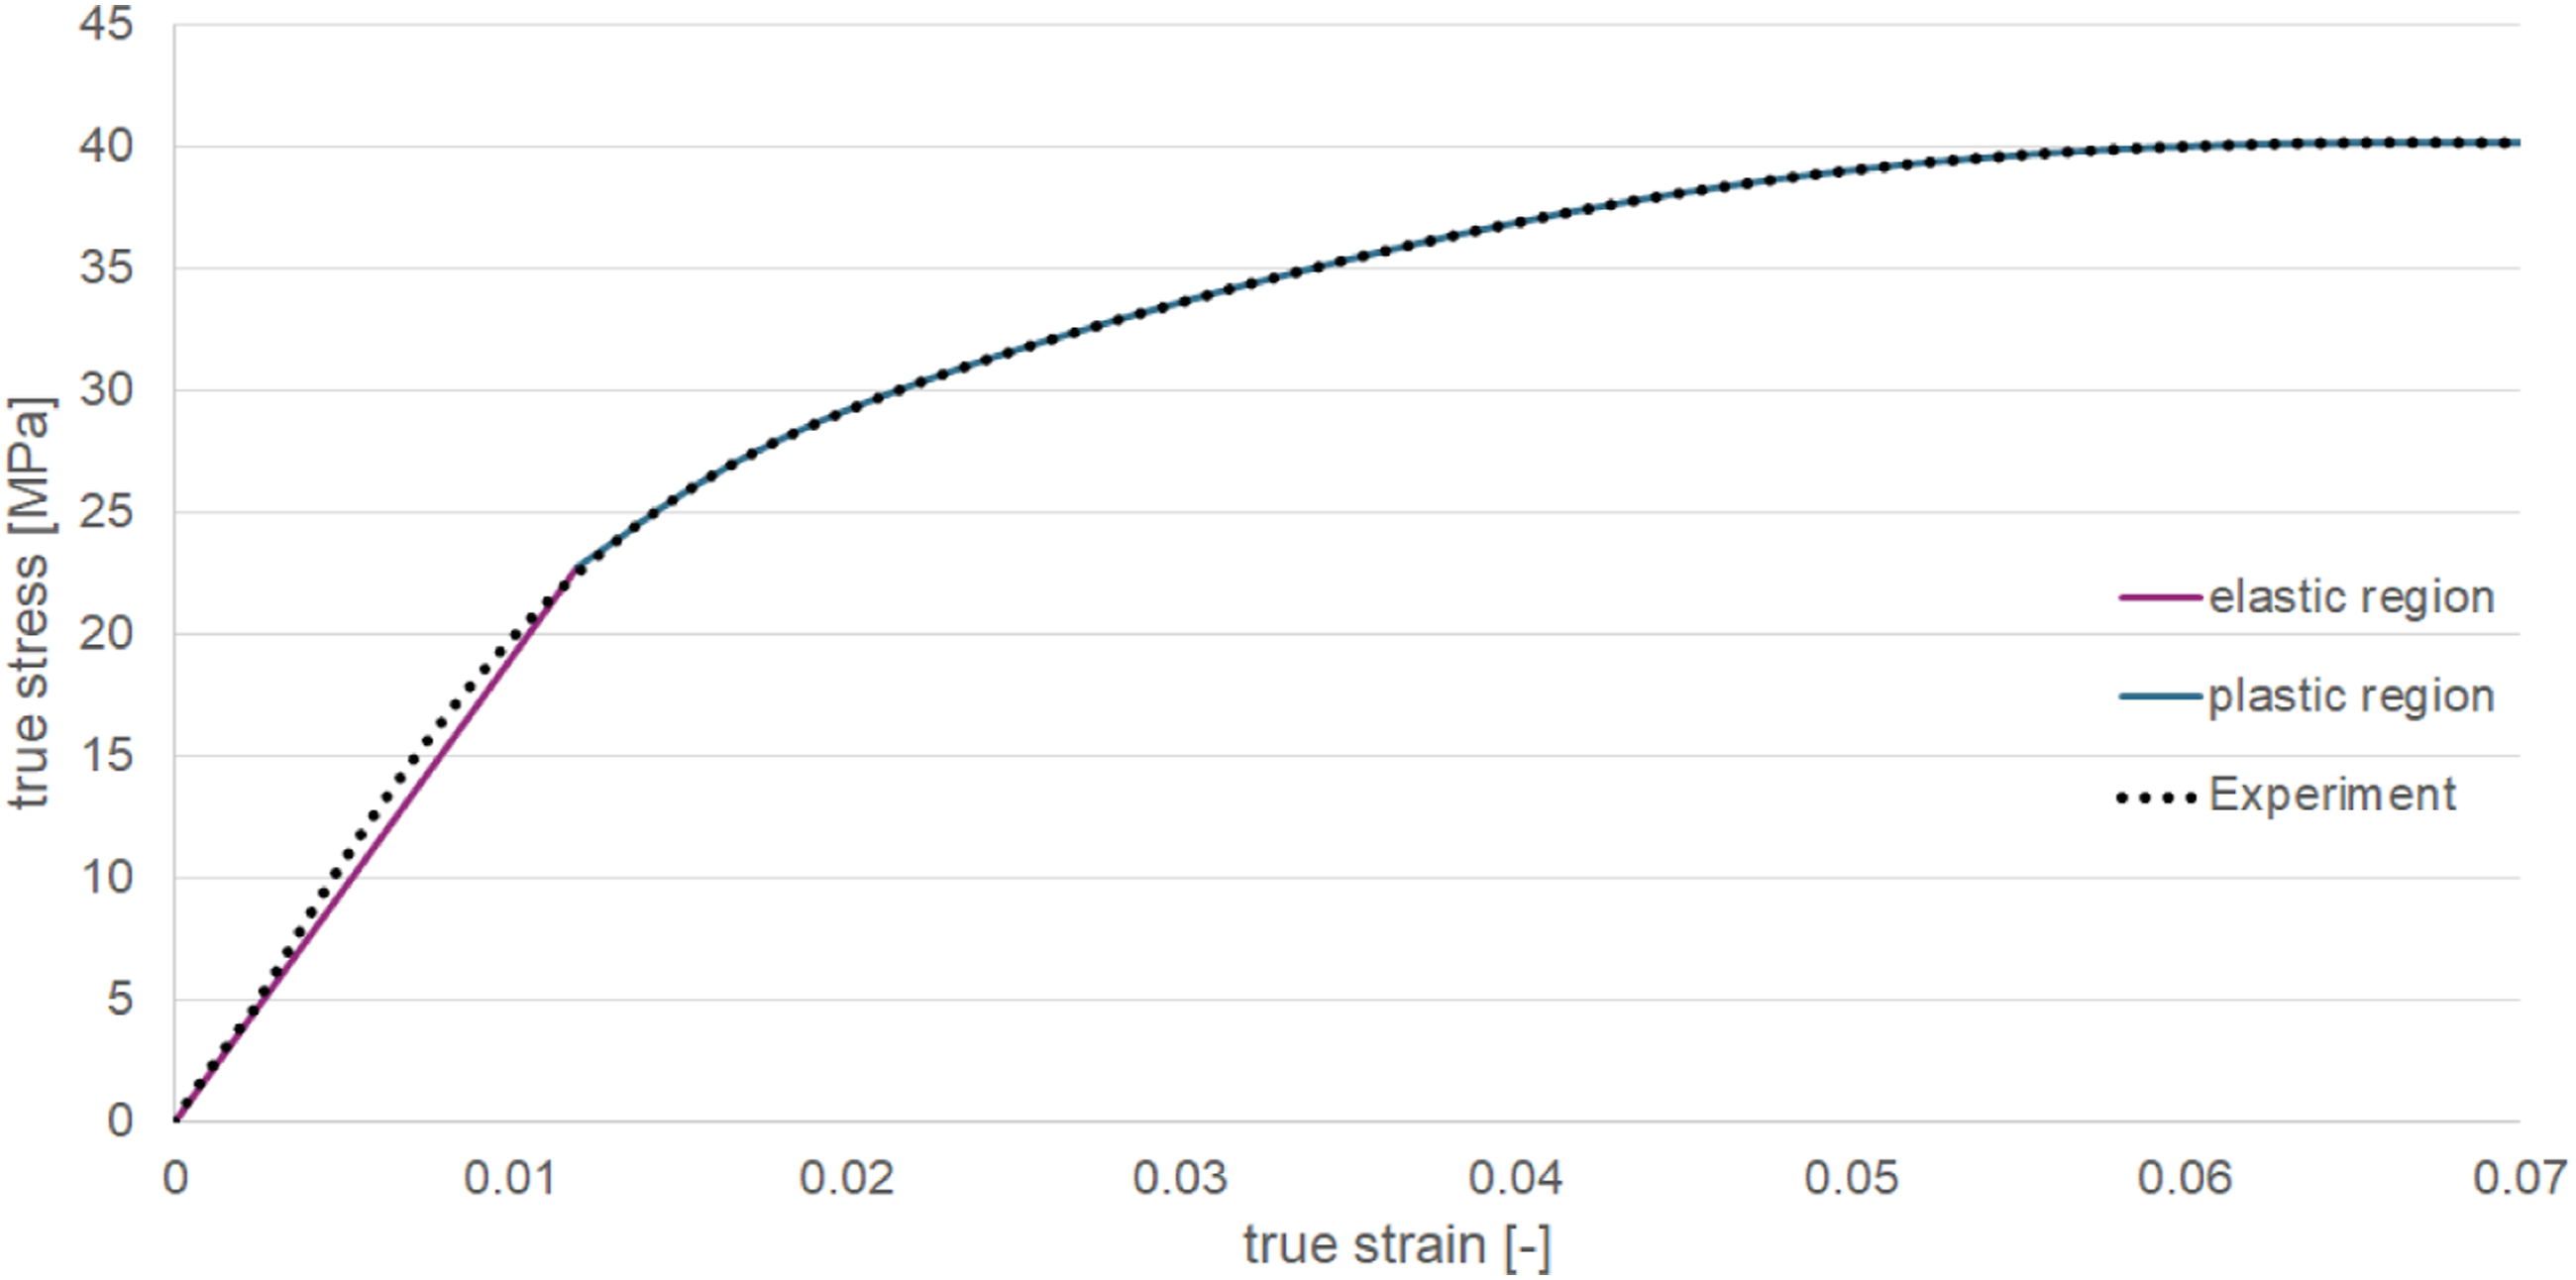
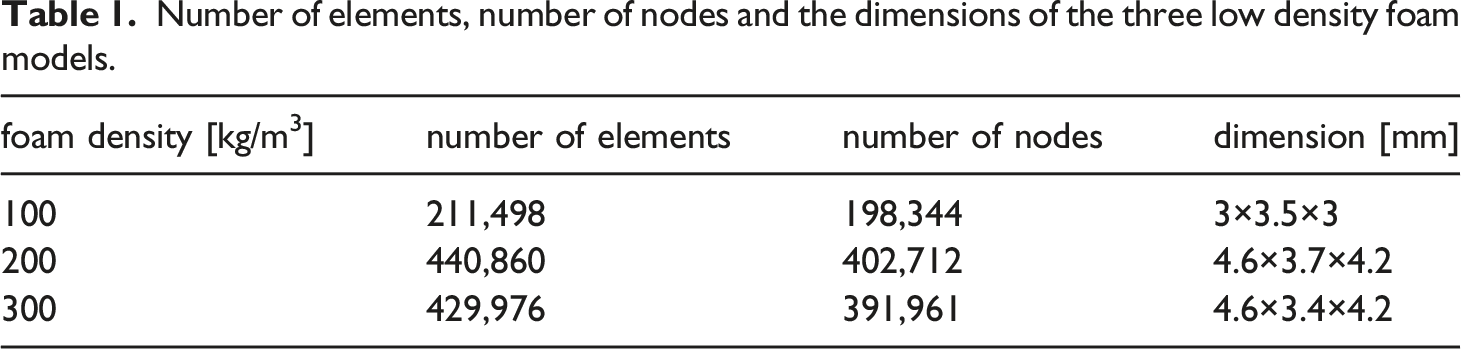
In Figure 4, the simulation set ups for the tensile and compressive test simulations, which are performed in the finite element solver Abaqus, are shown. For these simulations, the microstructural models are used. The tension load is transferred using a reference point (RP2) with a kinematic coupling constraint to the foam. The foam is clamped (encastre) at the bottom through a reference point (RP1) (Figure 4 (a)). For the compressive test simulations, plates (analytical rigid) are modelled, where one plate is used for transferring the load to the foam and the other plate functions as support (Figure 4 (b)). To model the contact between the plates and the specimen, a general contact definition Simulation set up for (a) tensile test and (b) compressive test simulation. Number of elements, number of nodes and the dimensions of the three low density foam models.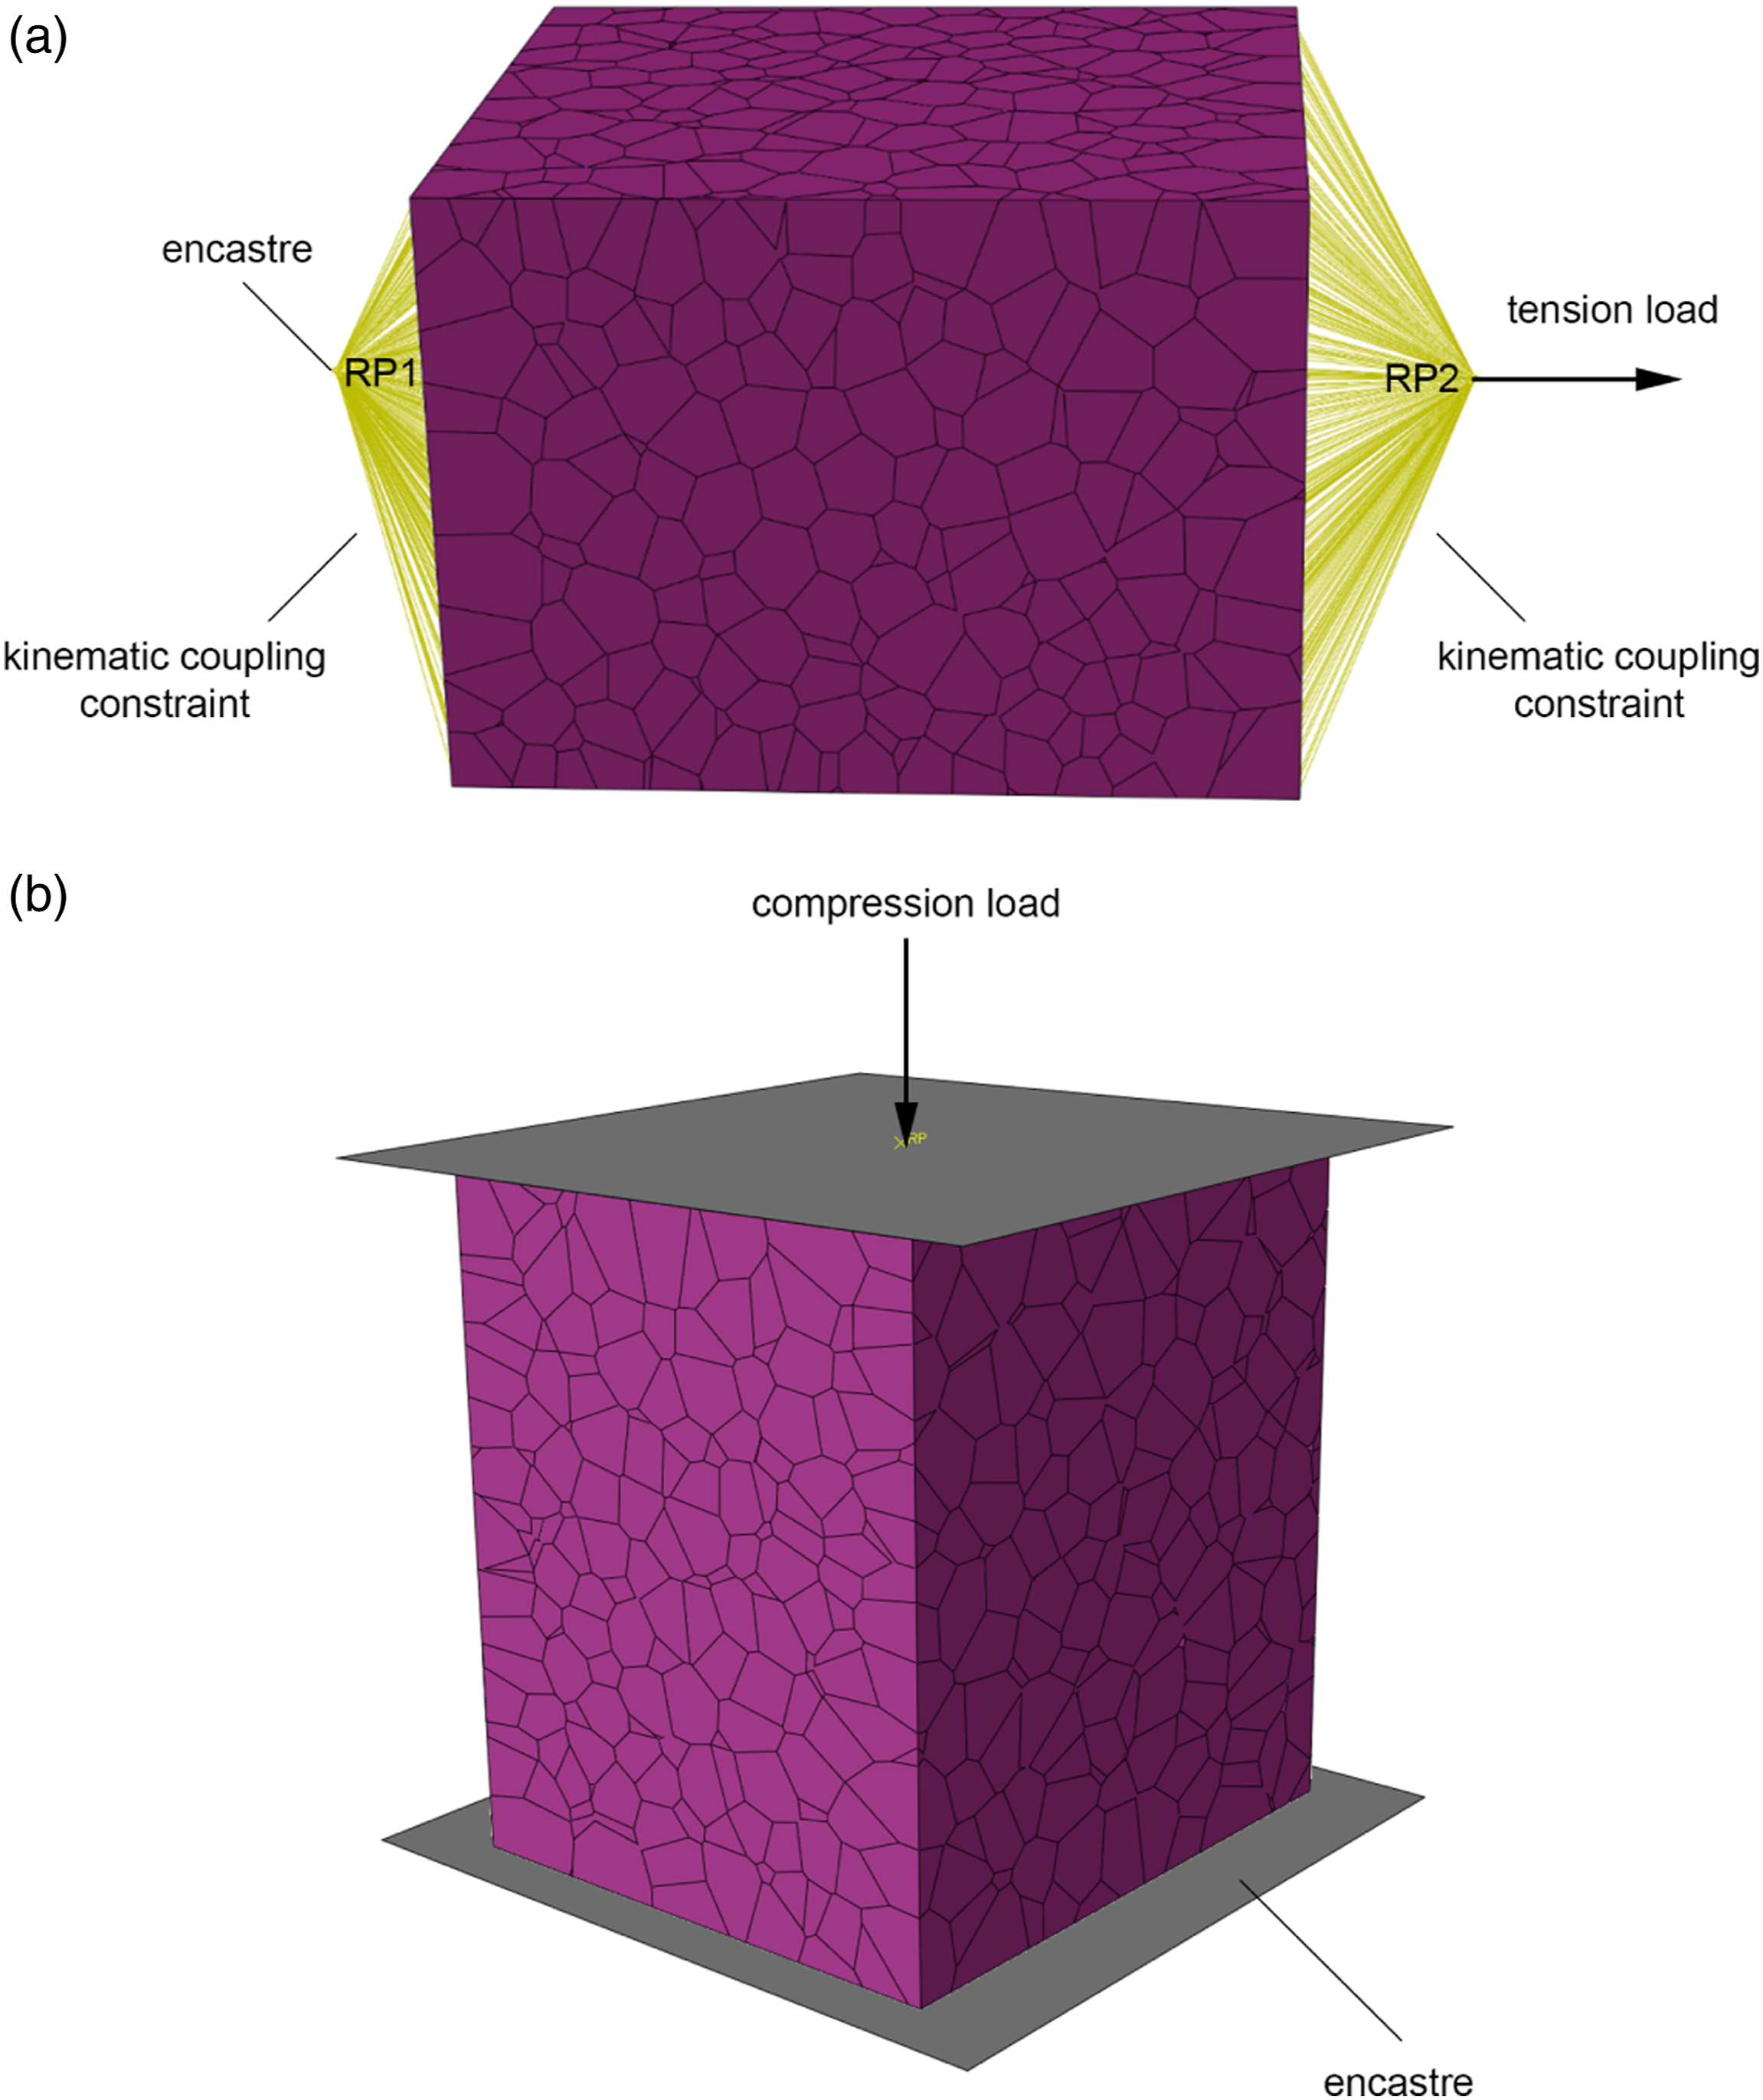
The CT results show that the measured foam microstructure exhibits non-perfectly straight (wrinkled) cell walls (Figure 5) which are not considered in the model yet. These imperfections have severe influence on the mechanical properties of the foam.8,38,39 Wrinkled cell walls buckle prior to perfectly straight cell walls under compression load. This is considered in the compressive test simulation by implementing the results of an eigenvalue buckling prediction analysis which is performed in Abaqus.
34
Computed tomography scan result of the foam with a density of 200 kg/m3.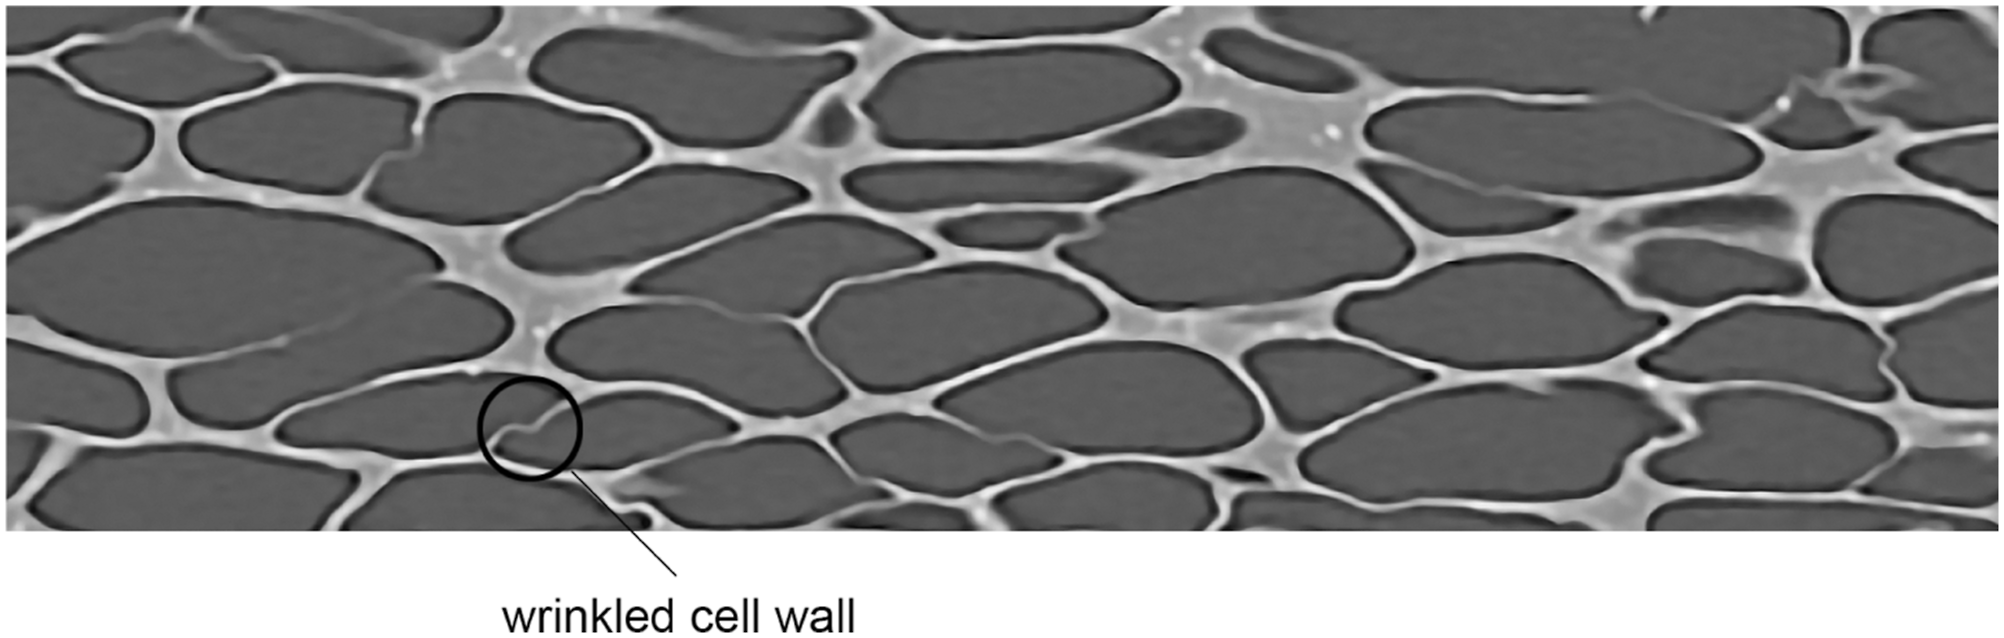
Results and discussion
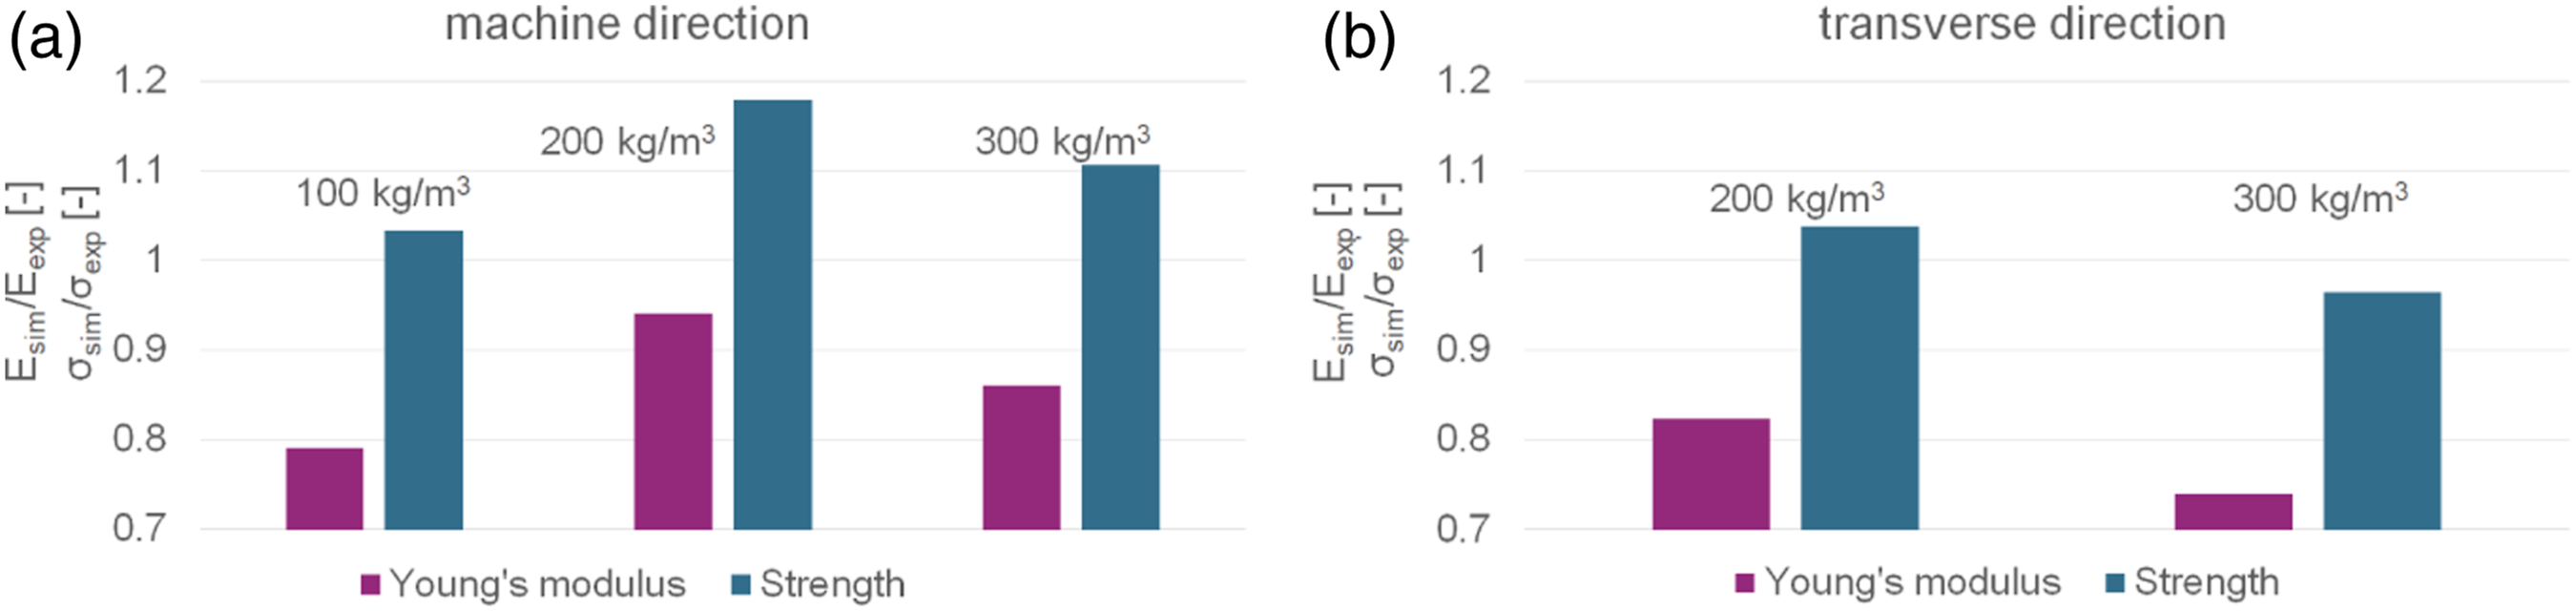
Tensile and compressive test simulations are performed for polypropylene foams with three different densities (100 kg/m3, 200 kg/m3 and 300 kg/m3). Experimental tensile test data are used to validate the tensile test simulations. The tensile tests were performed on a ZwickRoell Z100 testing machine with a 1 kN load cell. The displacement is measured with an extensometer (ZwickRoell MultiXtens II HP). The anisotropic behaviour of the foam under tension and compression load is also investigated for the foams with densities of 200 kg/m3 and 300 kg/m3. Therefore, the simulations are performed in the machine direction and transverse to the machine direction. In Figure 6, the results and the validation with the experimental results of the tensile test simulations are shown. The shown nominal stresses and nominal strains are calculated with the dimensions of the specific specimen, as if it were a non-porous material. So the nominal stress is the ratio of the force in the loading direction and the original cross-section (e.g. for the foam with a density of 100 kg/m3, the cross-section of the simulation model is 3.5 mm ×3 mm). This is necessary to enable the validation with the experimental results as the dimensions of the specimens used for the experiments vary and the dimensions are far bigger than the dimensions of the specimens used for the simulations. In Figure 7, the ratios of Young’s modulus values obtained by simulation (Esim) to the experimentally determined Young’s modulus values (Eexp) and the ratios of the strength values Comparison of the tensile test simulation results with experimental results for the foams with densities of (a) 100 kg/m3, (b) 200 kg/m3 and (c) 300 kg/m3. Ratios of Young’s modulus values (Esim/Eexp) and strength values (σsim/σexp) in (a) machine and (b) transverse direction.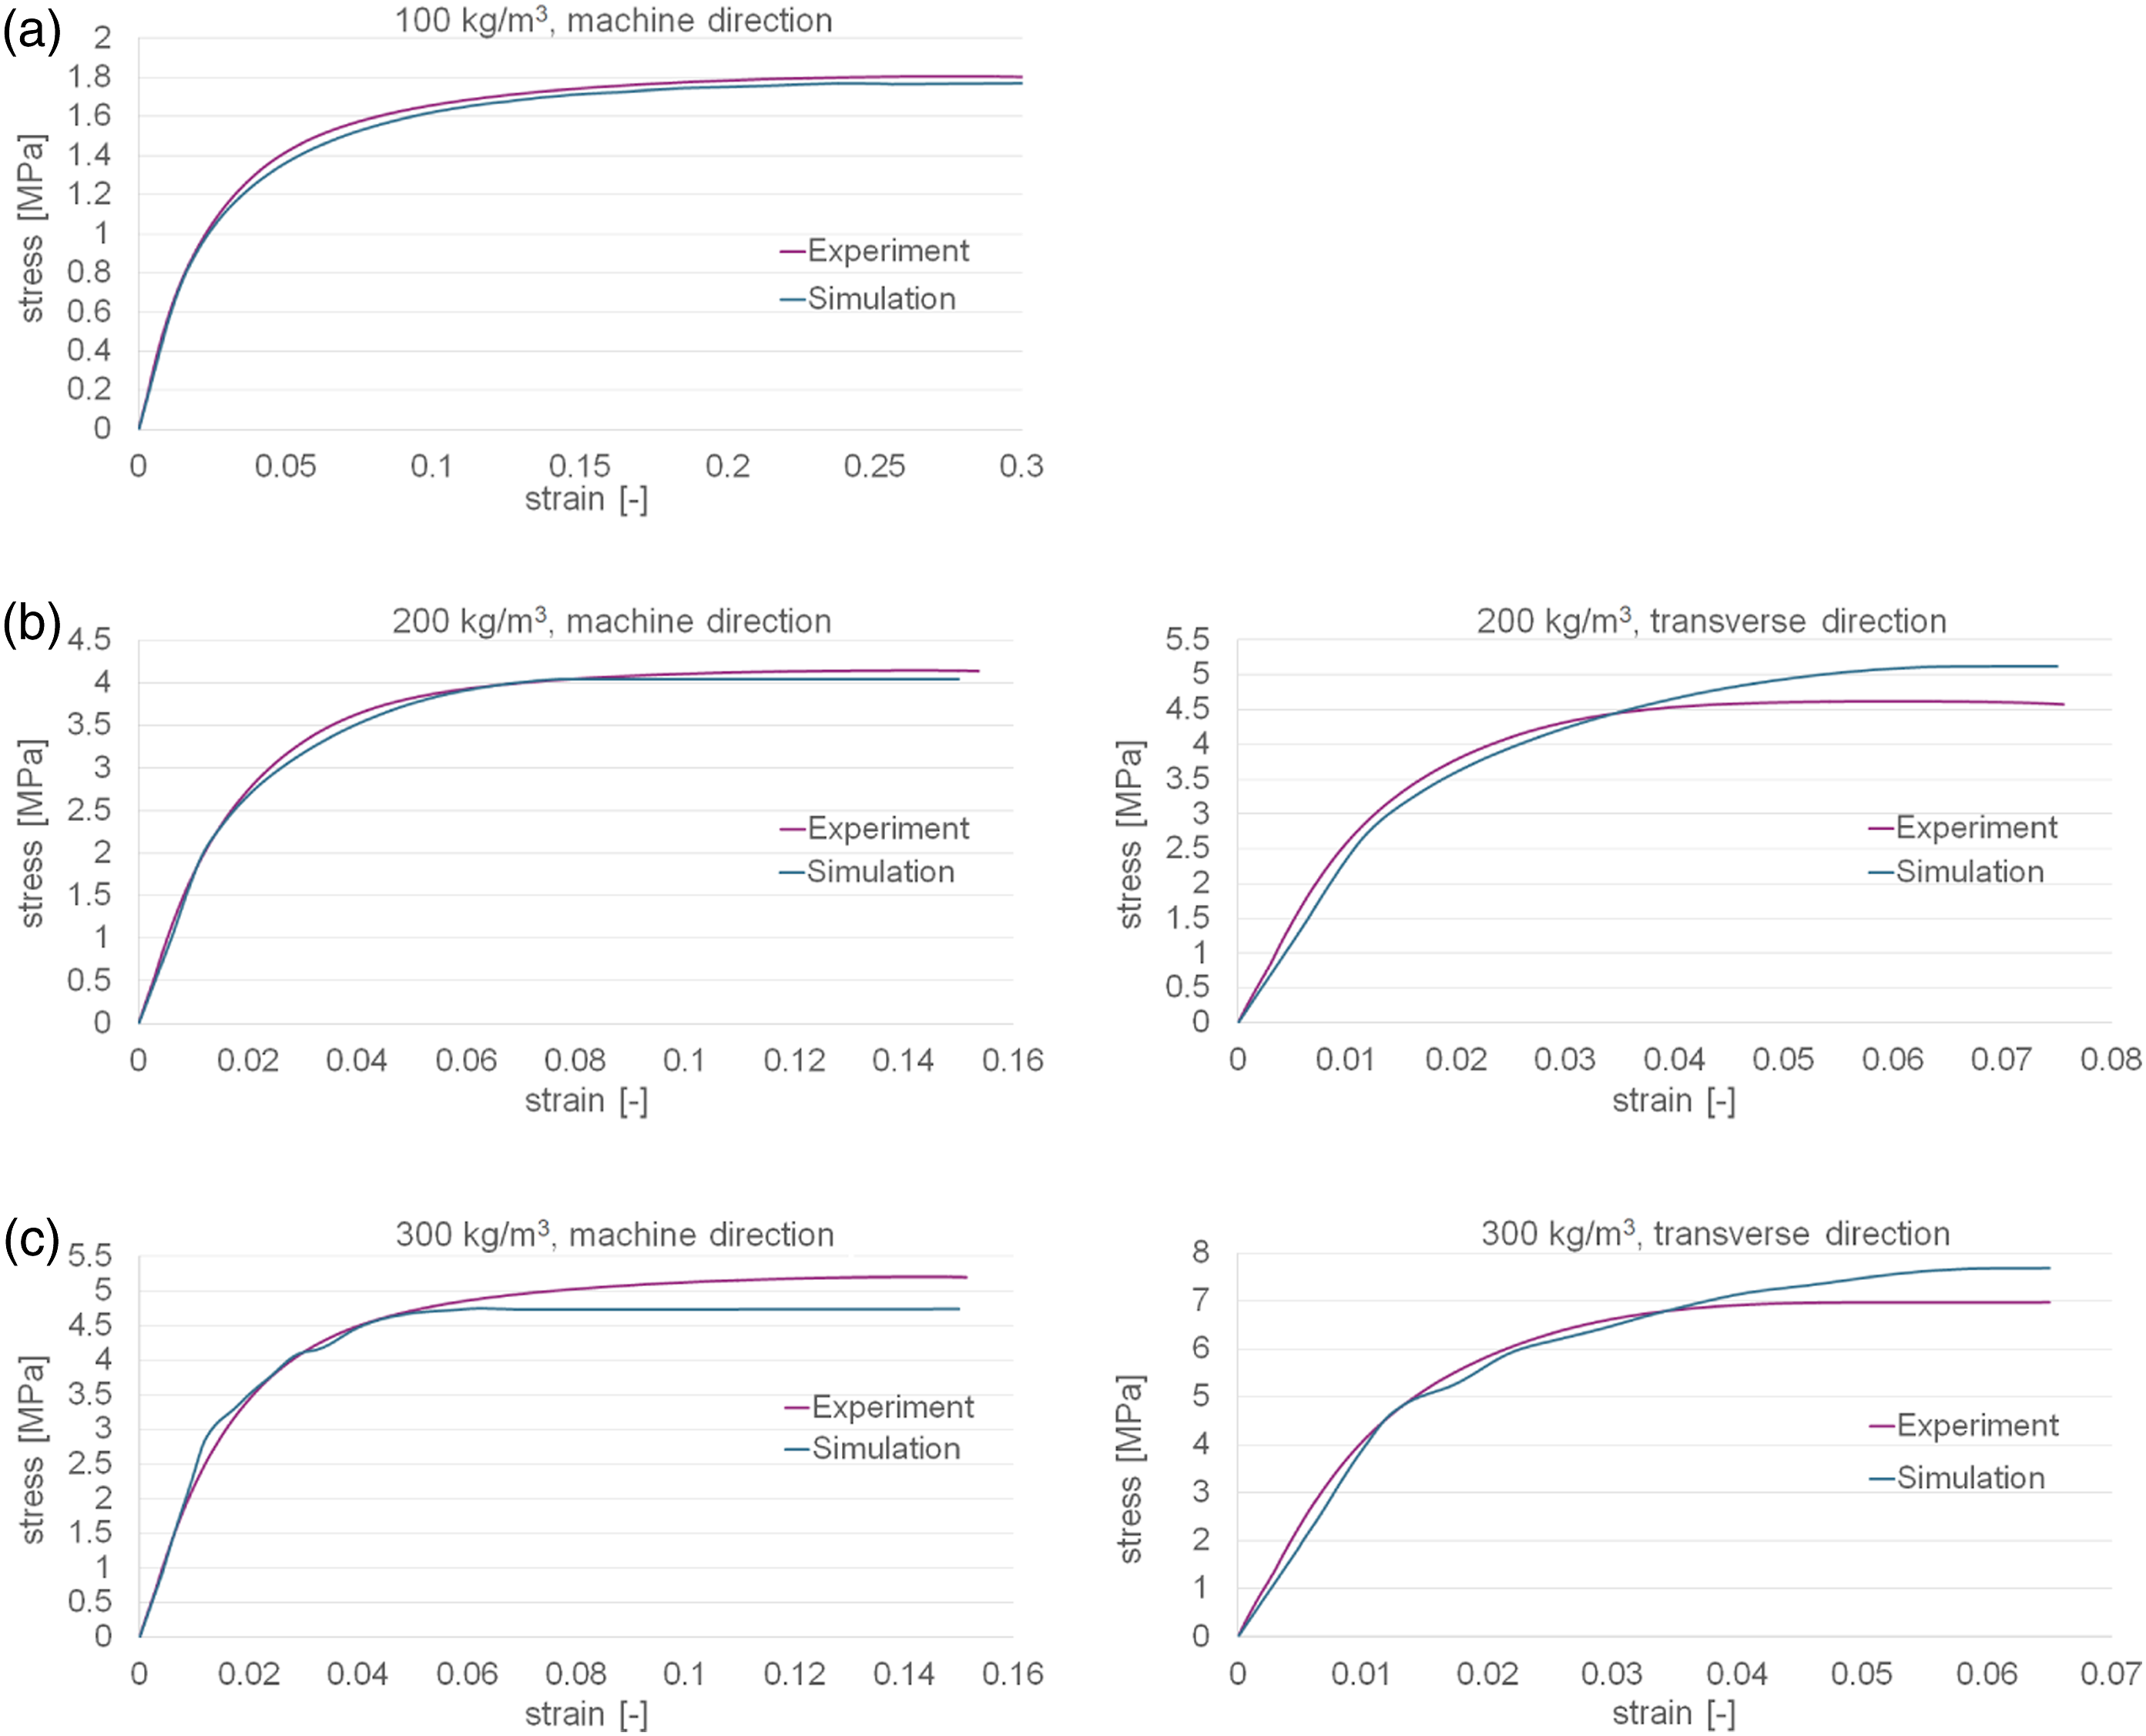
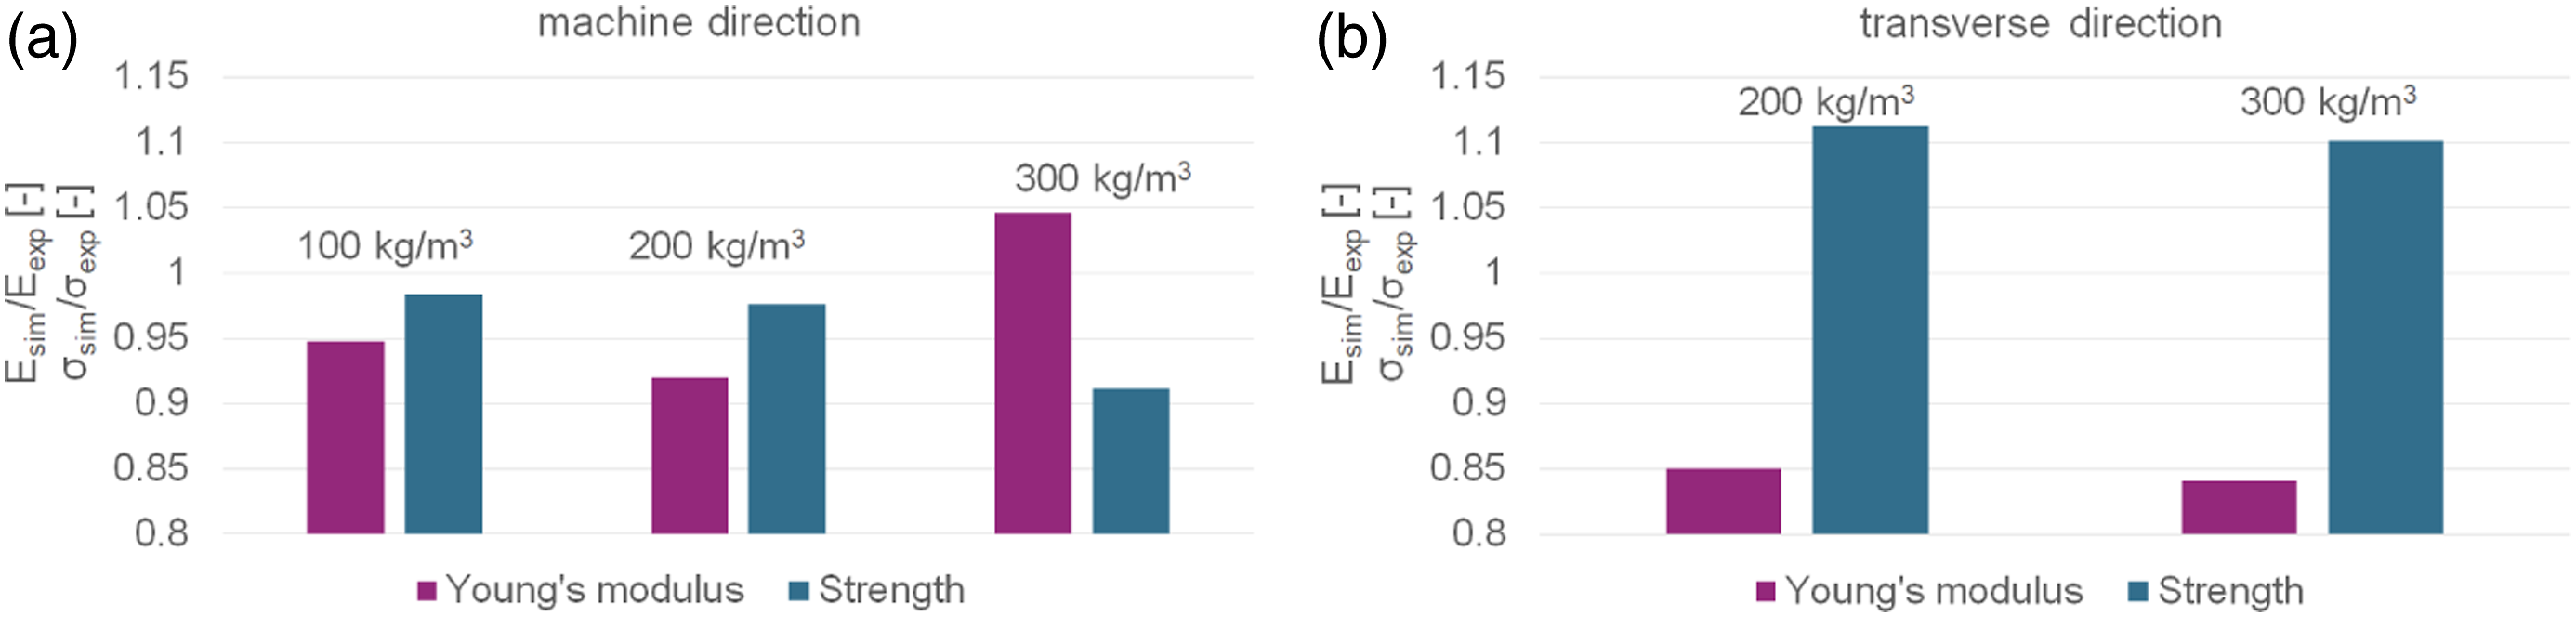
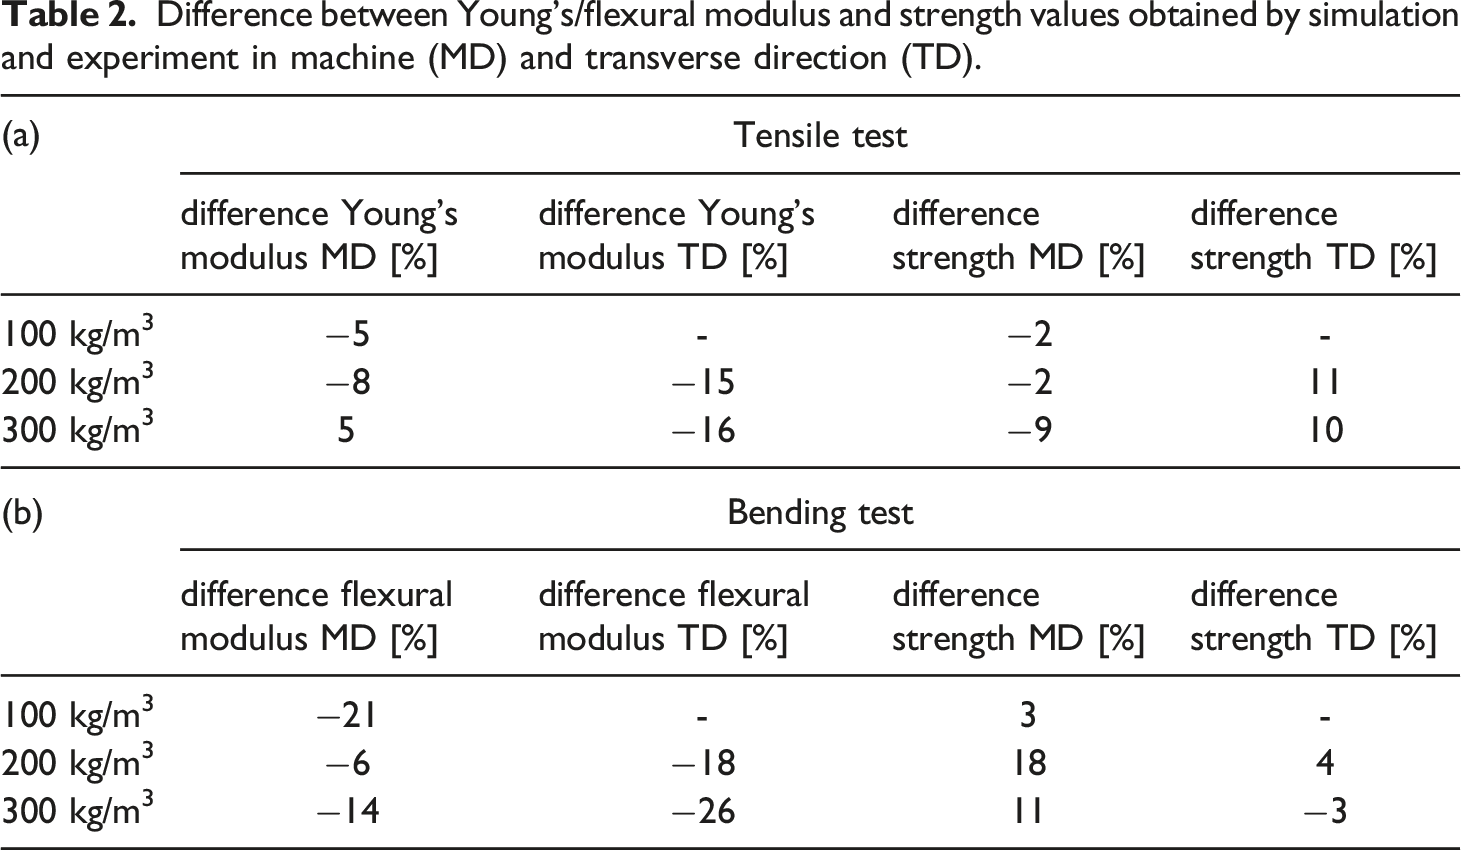
The validation shows that for the foam with a density of 100 kg/m3 the simulation result is in a very good agreement with the experimental result. Also the simulation result in the machine direction of the foam with a density of 200 kg/m3 represents the result of the experiment well. Even the anisotropic behaviour is reproduced well considering an acceptable underestimation of the stiffness (15%) as well as an overestimation of the strength (11%) in the transverse direction. The stiffness in the machine direction of the foam with a density of 300 kg/m3 obtained with the simulation model is similar to the experimentally observed stiffness, whereas in the transverse direction, it is underestimated (16%). The strength in the machine direction is lower (9%) and the strength in the transverse direction determined using the simulation is higher (10%) than the strength investigated experimentally. Nevertheless, also for this foam, the highly anisotropic behaviour can be reproduced well. From the validation, it can be concluded that the investigated region of each foam used to create the simulation model is representative for the entire foam microstructure. In Figures 8 and 9, the compressive test simulation results of the foams with the different densities in machine and transverse directions can be seen (stresses and strains are equally calculated as for the tensile tests). Additionally, illustrations of the von Mises stress of the deformed foams at different global stress levels (GSL) are shown in Figure 10 (machine direction) and Figure 11 (transverse direction). The global stress level indicates a certain position on a specific stress–strain curve. For low stress levels, the deformation is scaled for better visualization of the local deformations in the foam. The GSL and the deformation scale factors (DSF) are specified in the figures. The last microcell of each foam and loading direction illustrates the deformation state of the foam at the highest simulated strain level. Comparison of the compressive test simulation results in the machine direction of the foams with densities of 100 kg/m3, 200 kg/m3 and 300 kg/m.3. Comparison of the compressive test simulation results in the transverse direction of the foams with densities of 200 kg/m3 and 300 kg/m3. Illustrations of the von Mises stress of the deformed foams with densities of (a) 100 kg/m3, (b) 200 kg/m3 and (c) 300 kg/m3 at different global stress levels (GSL) in the machine direction (DSF = deformation scale factor); strain increases from left to right. Illustrations of the von Mises stress of the deformed foams with densities of (a) 200 kg/m3 and (b) 300 kg/m3 at different global stress levels (GSL) in the transverse direction (DSF = deformation scale factor); strain increases from left to right.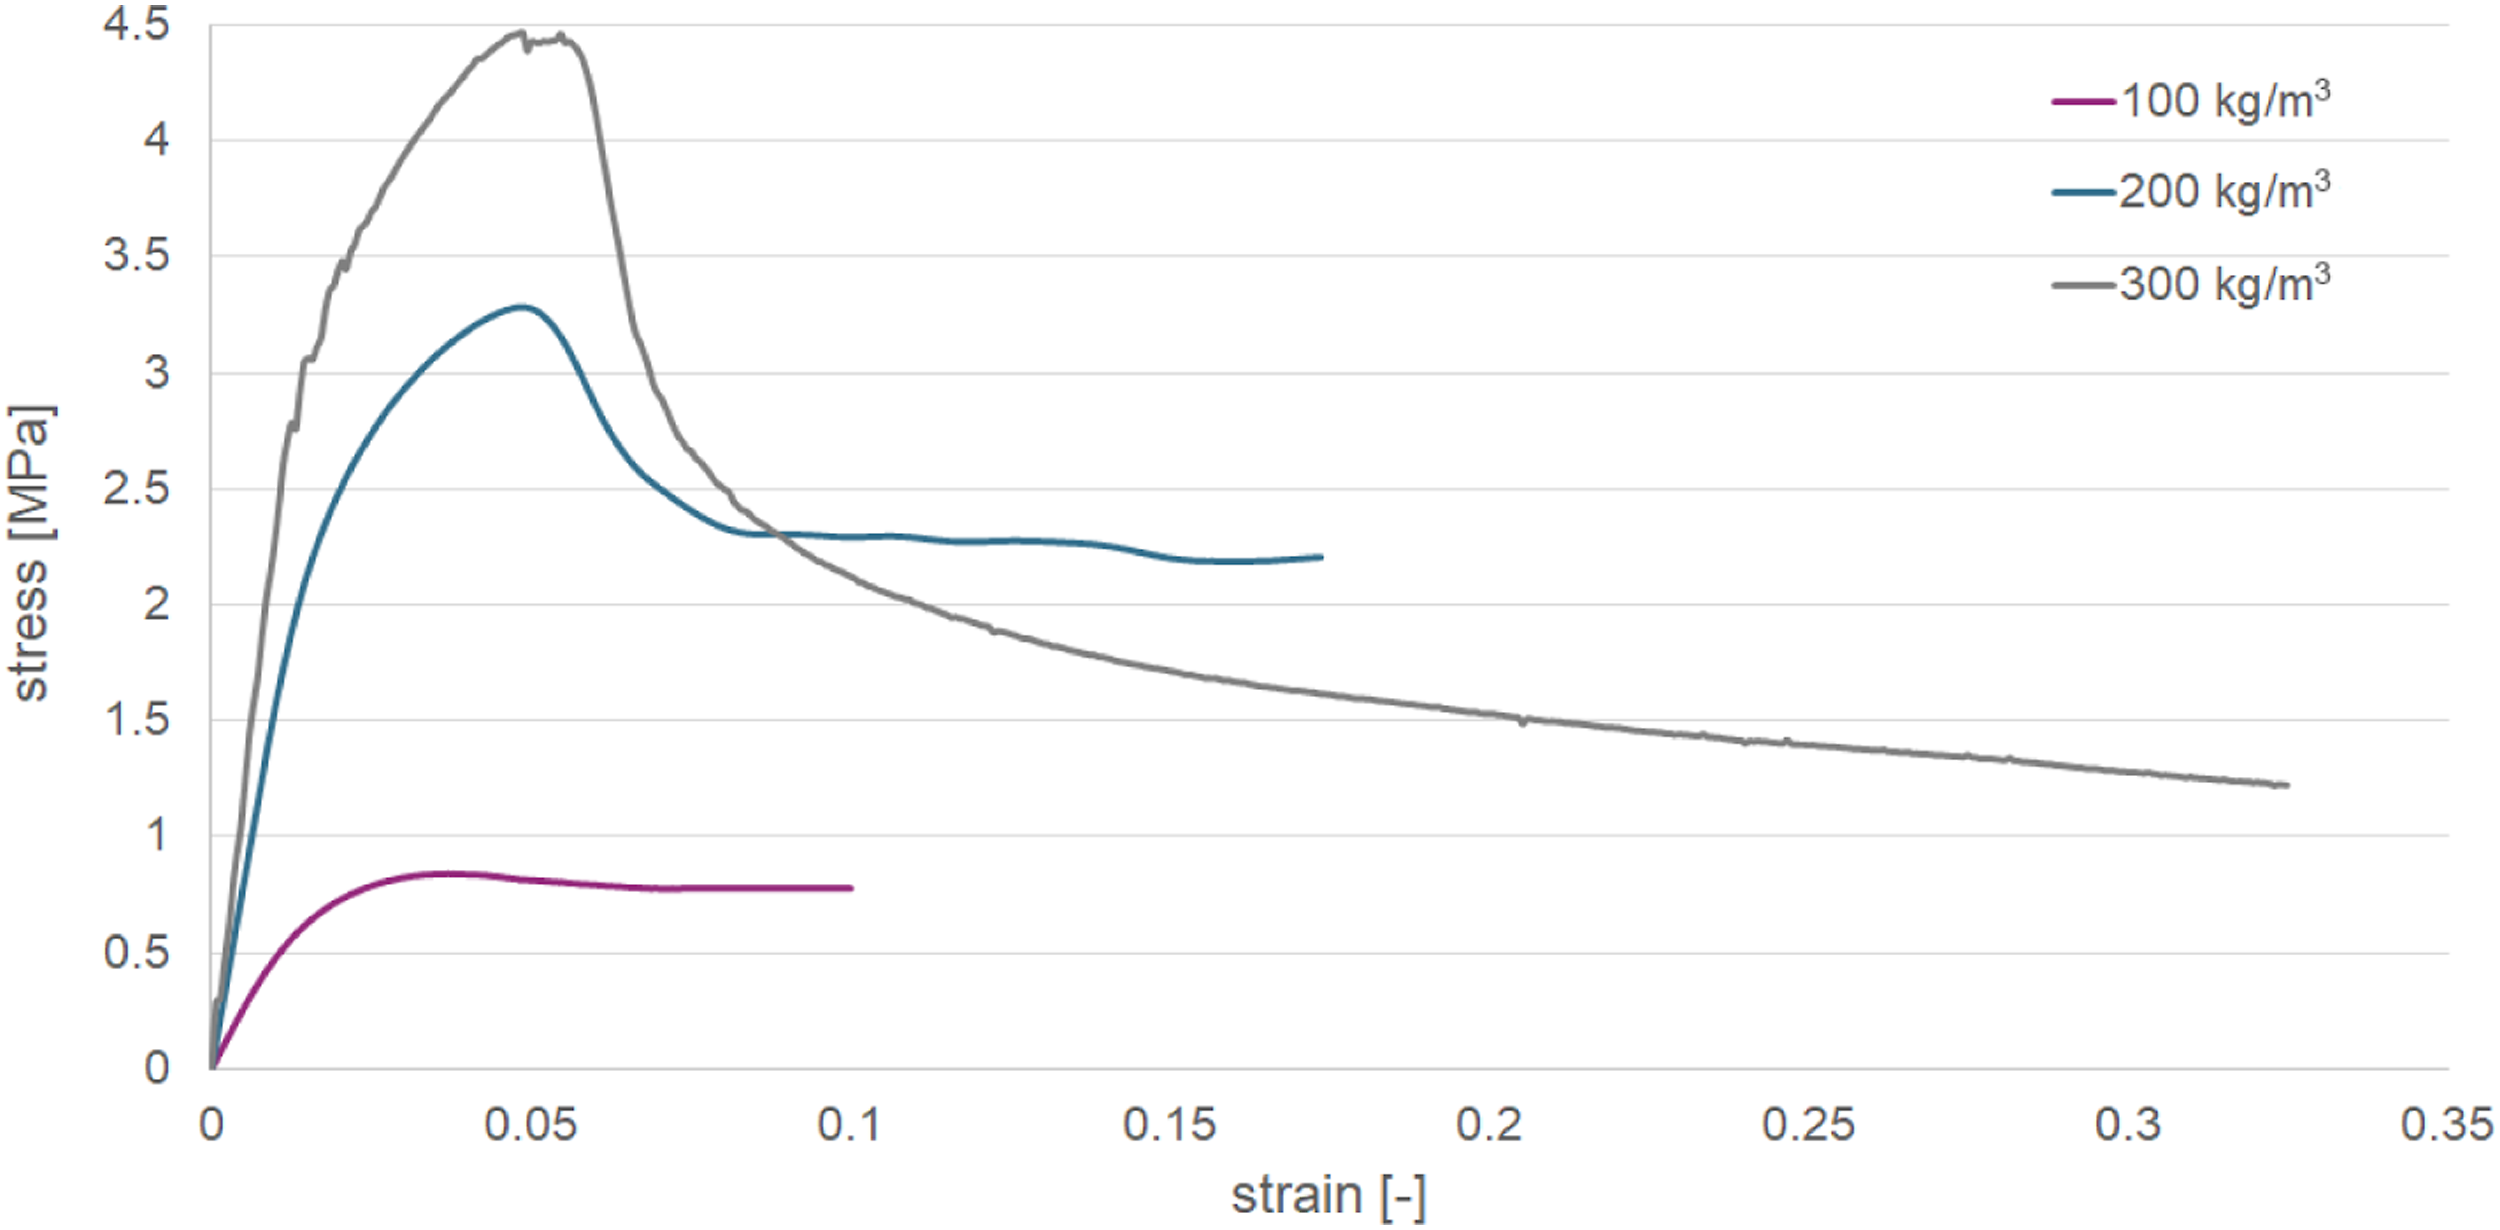
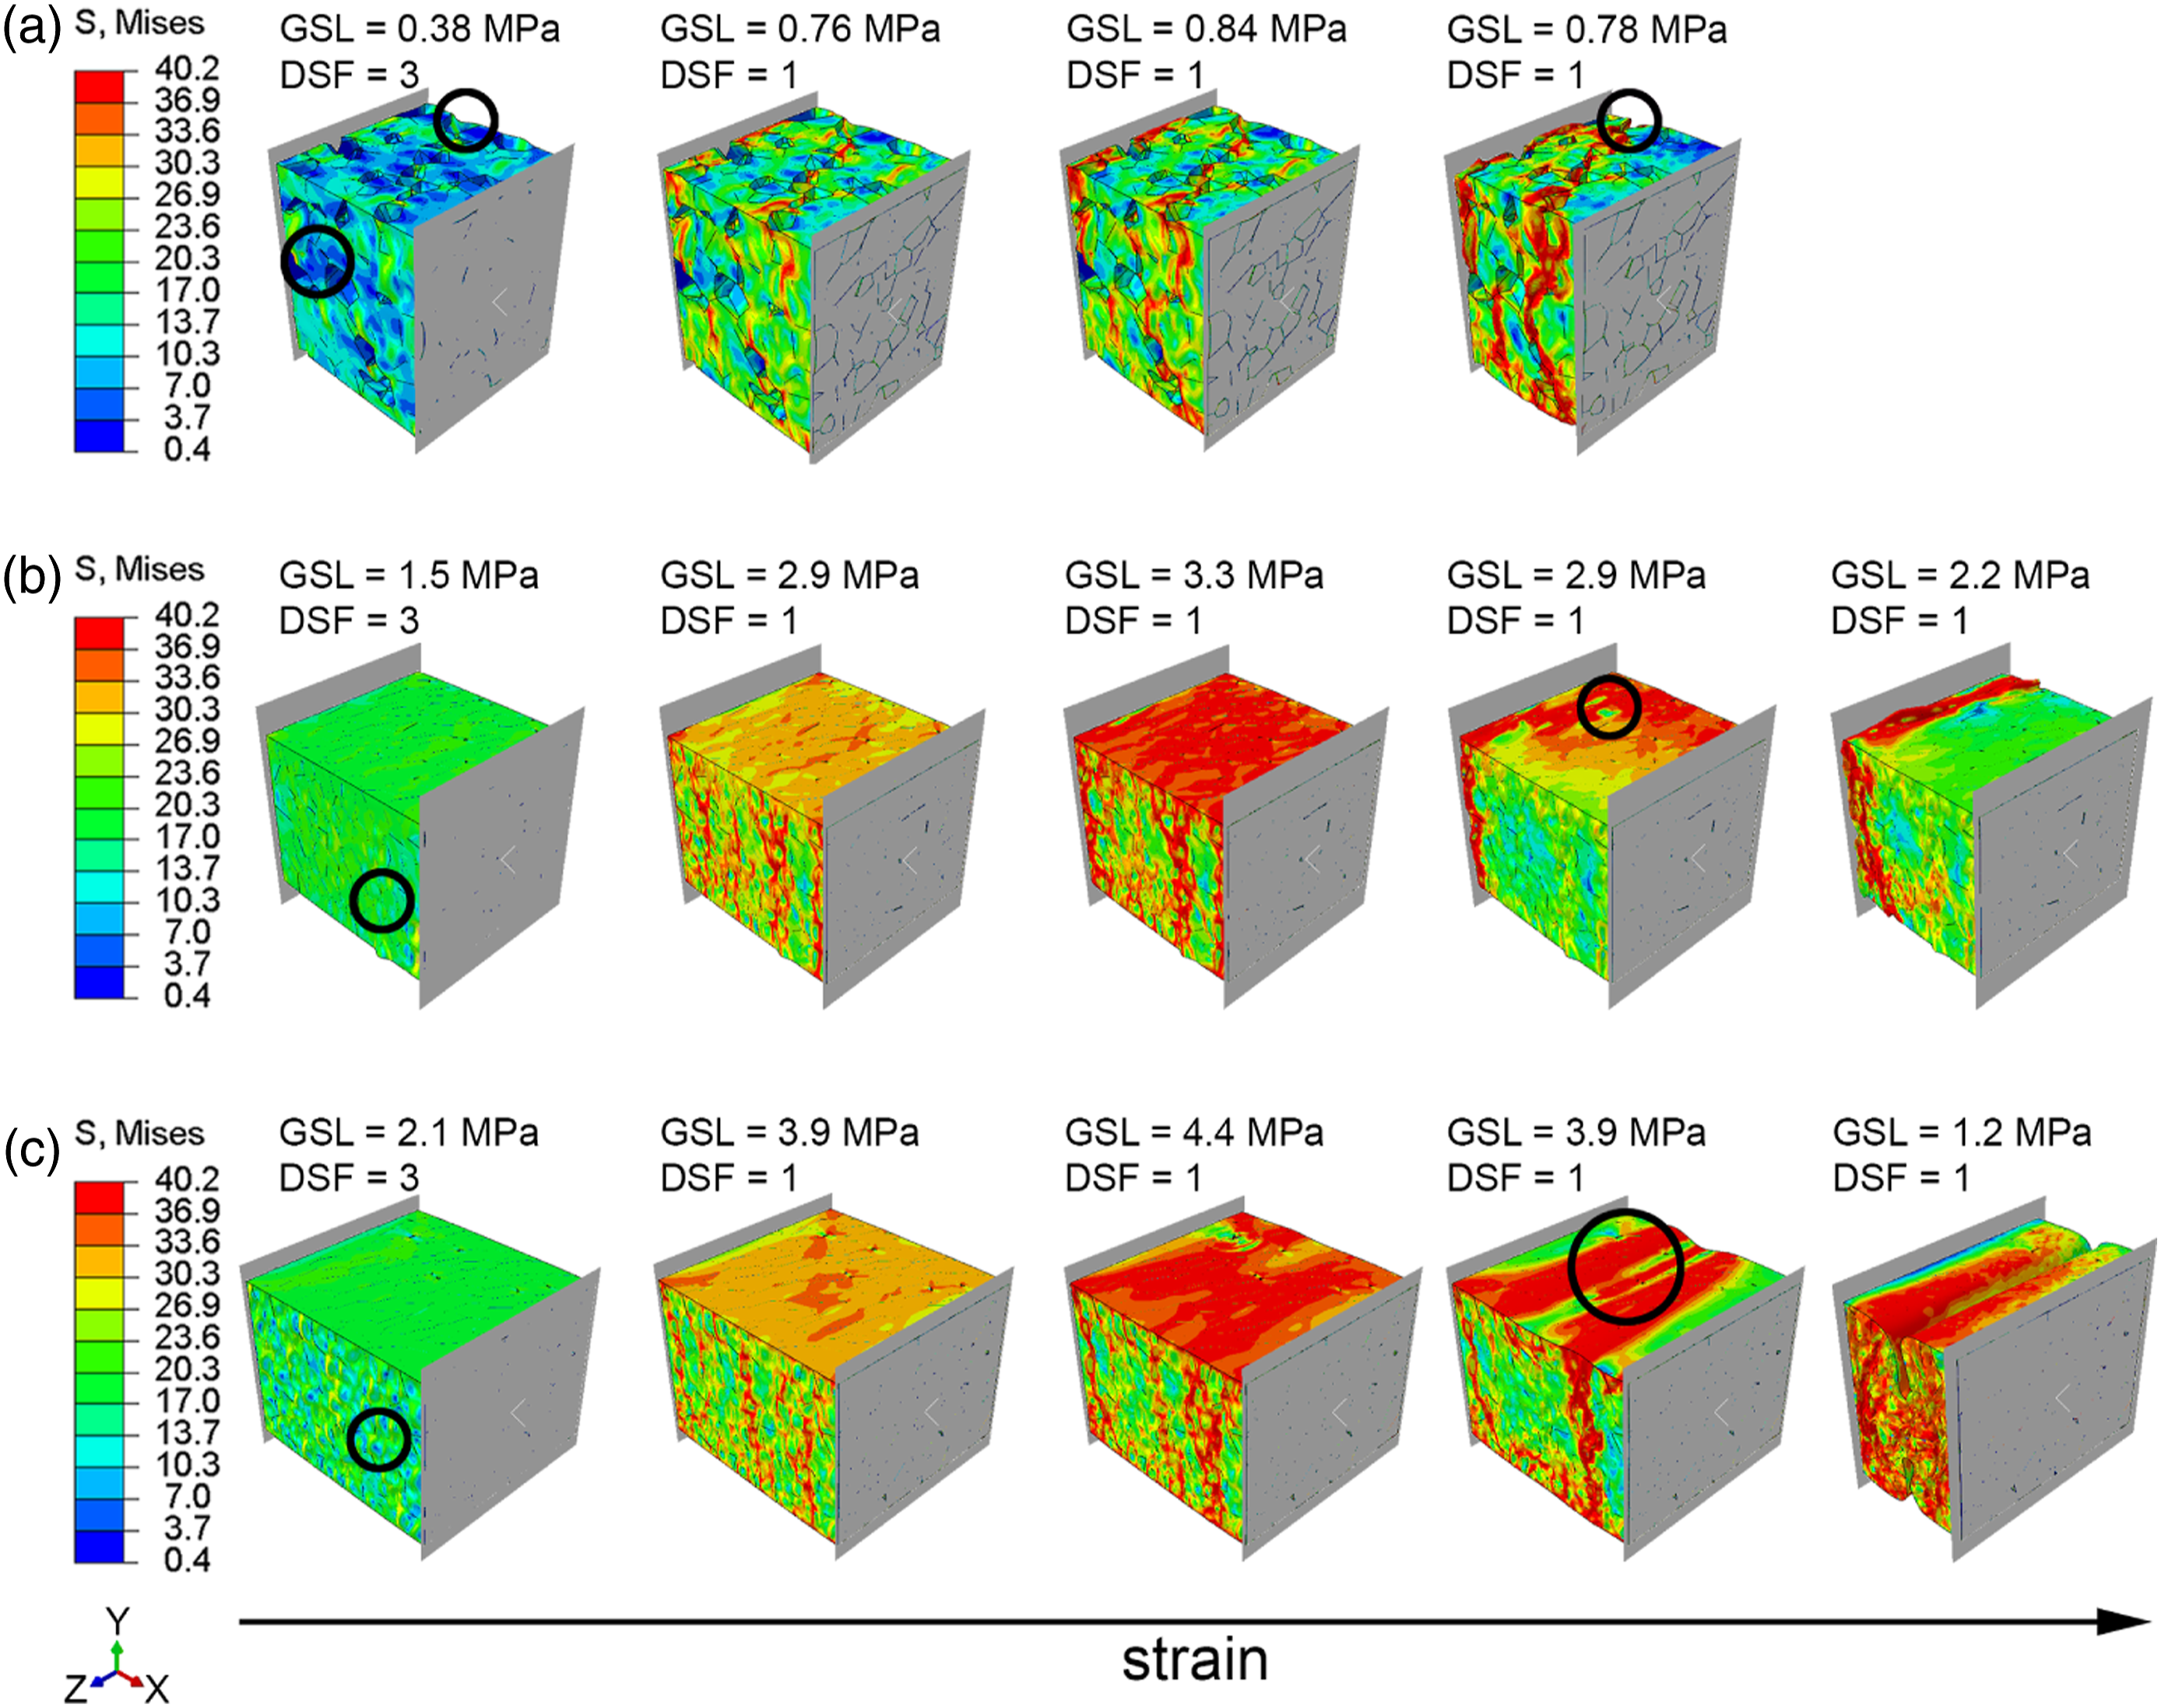
The result of the compressive test in machine direction of the foam with a density of 100 kg/m3 shows that the cell walls buckle (especially in the regions of open cells) already at low stress/strain levels due to their low thickness (Figure 10(a), GSL = 0.38 MPa marked with a black circle). The buckling gets more severe for higher stress/strain levels. A stress plateau is formed at 0.78 MPa due to the collapse of the cells (Figure 10(a), GSL = 0.78 MPa marked with a black circle).
In the foam with a density of 200 kg/m3, the thin cell walls buckle at low stress/strain levels (Figure 10(b), GSL = 1.5 MPa marked with a black circle), whereas the thick cell walls start to buckle after reaching a peak stress at 3.3 MPa (Figure 10(b), GSL = 2.9 MPa marked with a black circle). The buckling increases with increasing strain and finally the foam cells start to collapse in the vicinity of the boundary, and thus a stress plateau at 2.2 MPa is formed.
The foam with a density of 300 kg/m3 shows a similar deformation behaviour as the foam with a density of 200 kg/m3 up to the peak stress. The thin cell walls start to buckle for low stress/strain levels (Figure 10(c), GSL = 2.1 MPa marked with a black circle) and the thick cells buckle after reaching the peak stress at 4.4 MPa (Figure 10(c), GSL = 3.9 MPa marked with a black circle). The difference in the deformation of the two foams (200 kg/m3 and 300 kg/m3) is that the foam with a density of 300 kg/m3 does not form a stress plateau. The stress continuously decreases and the foam cells collapse over the entire cross-section in the middle of the microcell. It is speculated that for higher strains
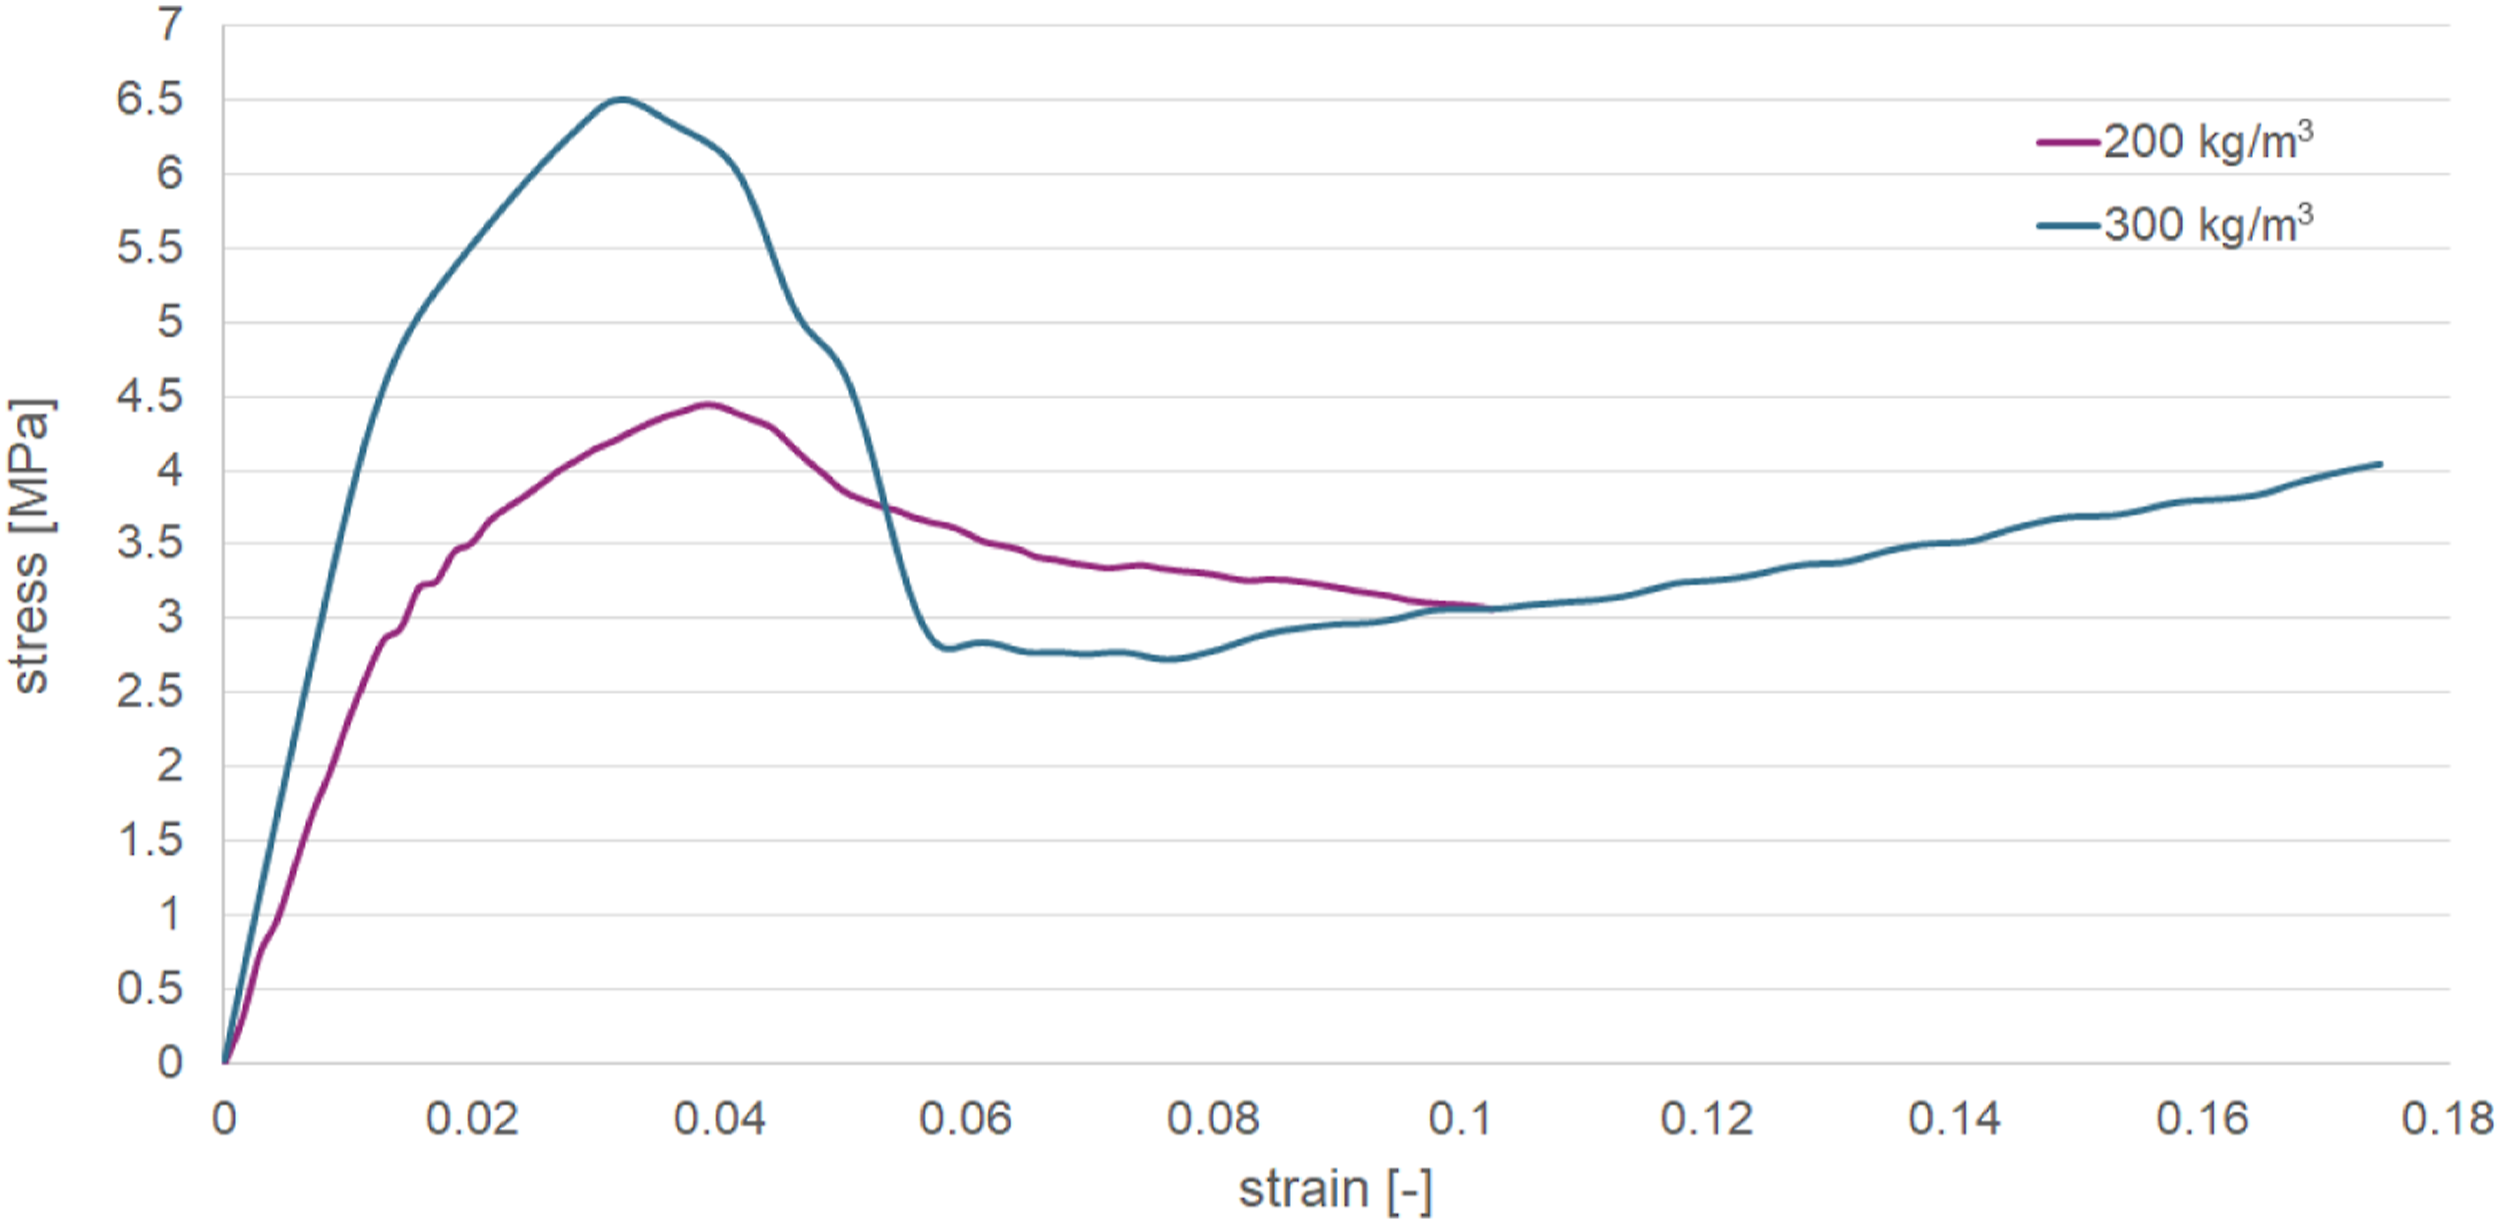
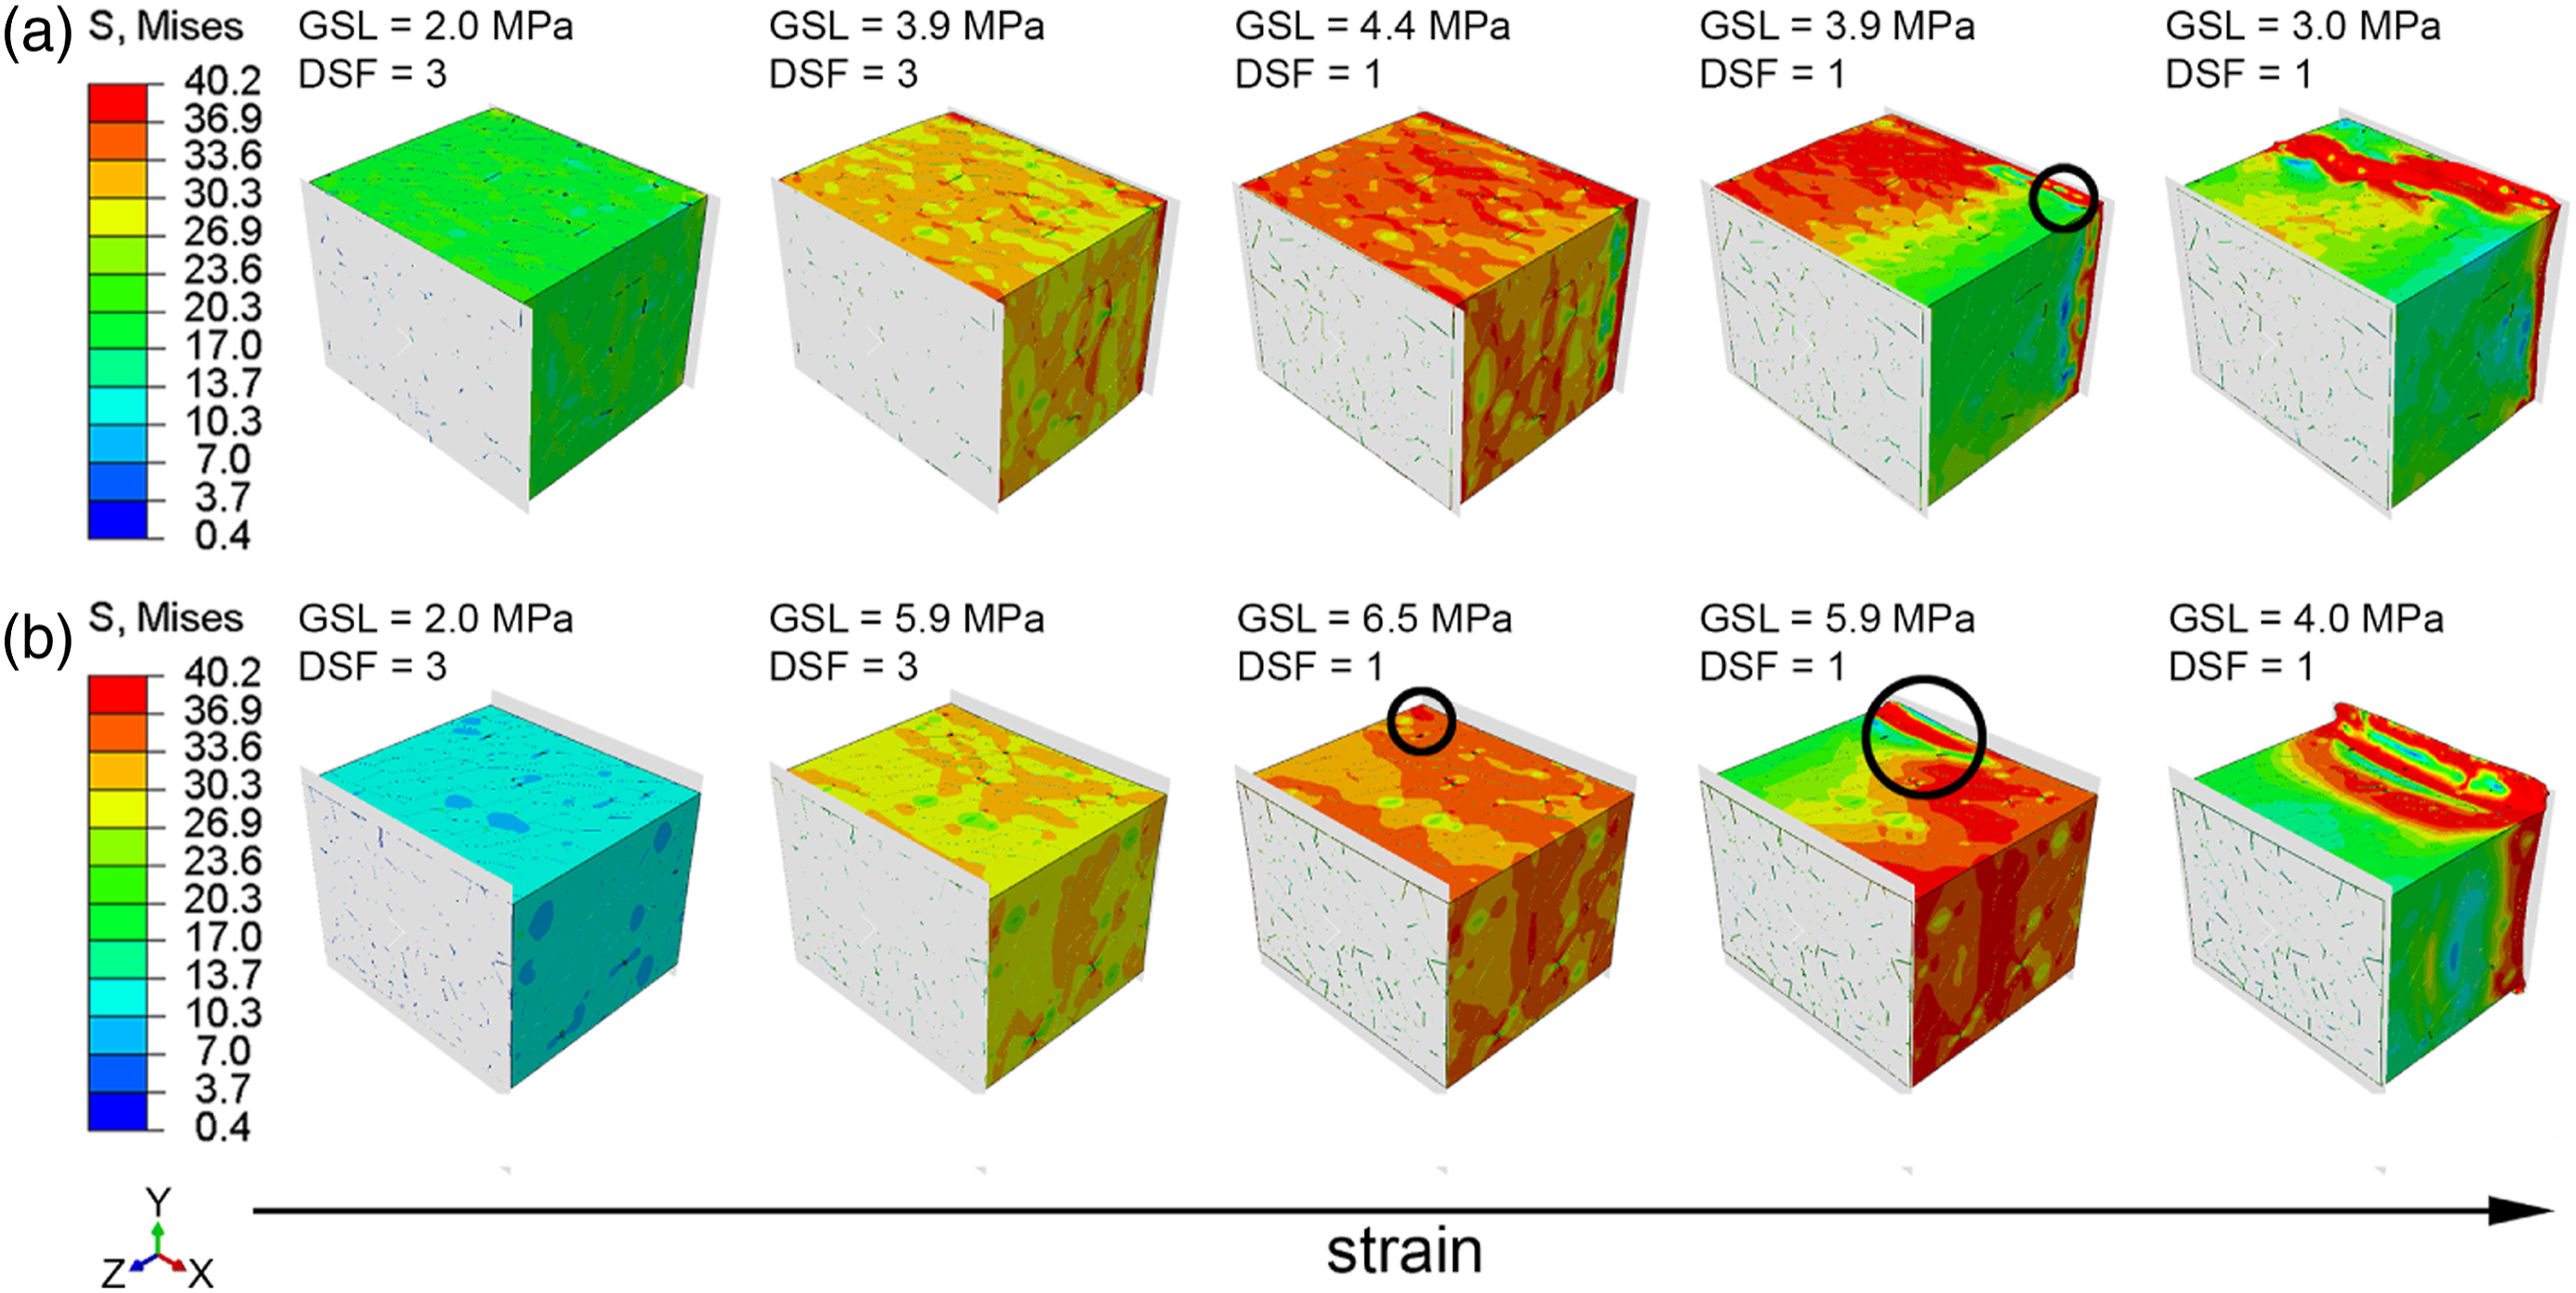
The investigation of the deformation behaviour of the foams with densities of 200 kg/m3 and 300 kg/m3 under compression load in the transverse direction shows that the cell walls do not buckle until the peak stress is reached (Figure 11).
This is caused due to the higher cell wall thickness in the transverse direction than in the machine direction. For the foam with a density of 200 kg/m3, it is observed that the stress slightly decreases, after the peak stress at 4.4 MPa is reached. The foam cells start to buckle (Figure 11 (a), GSL = 3.9 MPa marked with a black circle), and for higher strain levels, they collapse in the vicinity of the boundary as it was already observed in the compressive test result in the machine direction. The foam with a density of 300 kg/m3 reaches a peak stress at 6.5 MPa. At this peak stress, the cell walls buckle (Figure 11 (b), GSL = 6.5 MPa and GSL = 5.9 MPa marked with a black circle) which causes the stress to steeply drop to 2.8 MPa. The foam cells start to collapse at the boundary and the stress slowly increases again.
In Figure 12, the ratios of the compressive strength Illustration of the ratio of the compressive strength to the tensile strength in machine and transverse direction for the foams with densities of 100 kg/m3, 200 kg/m3 and 300 kg/m3.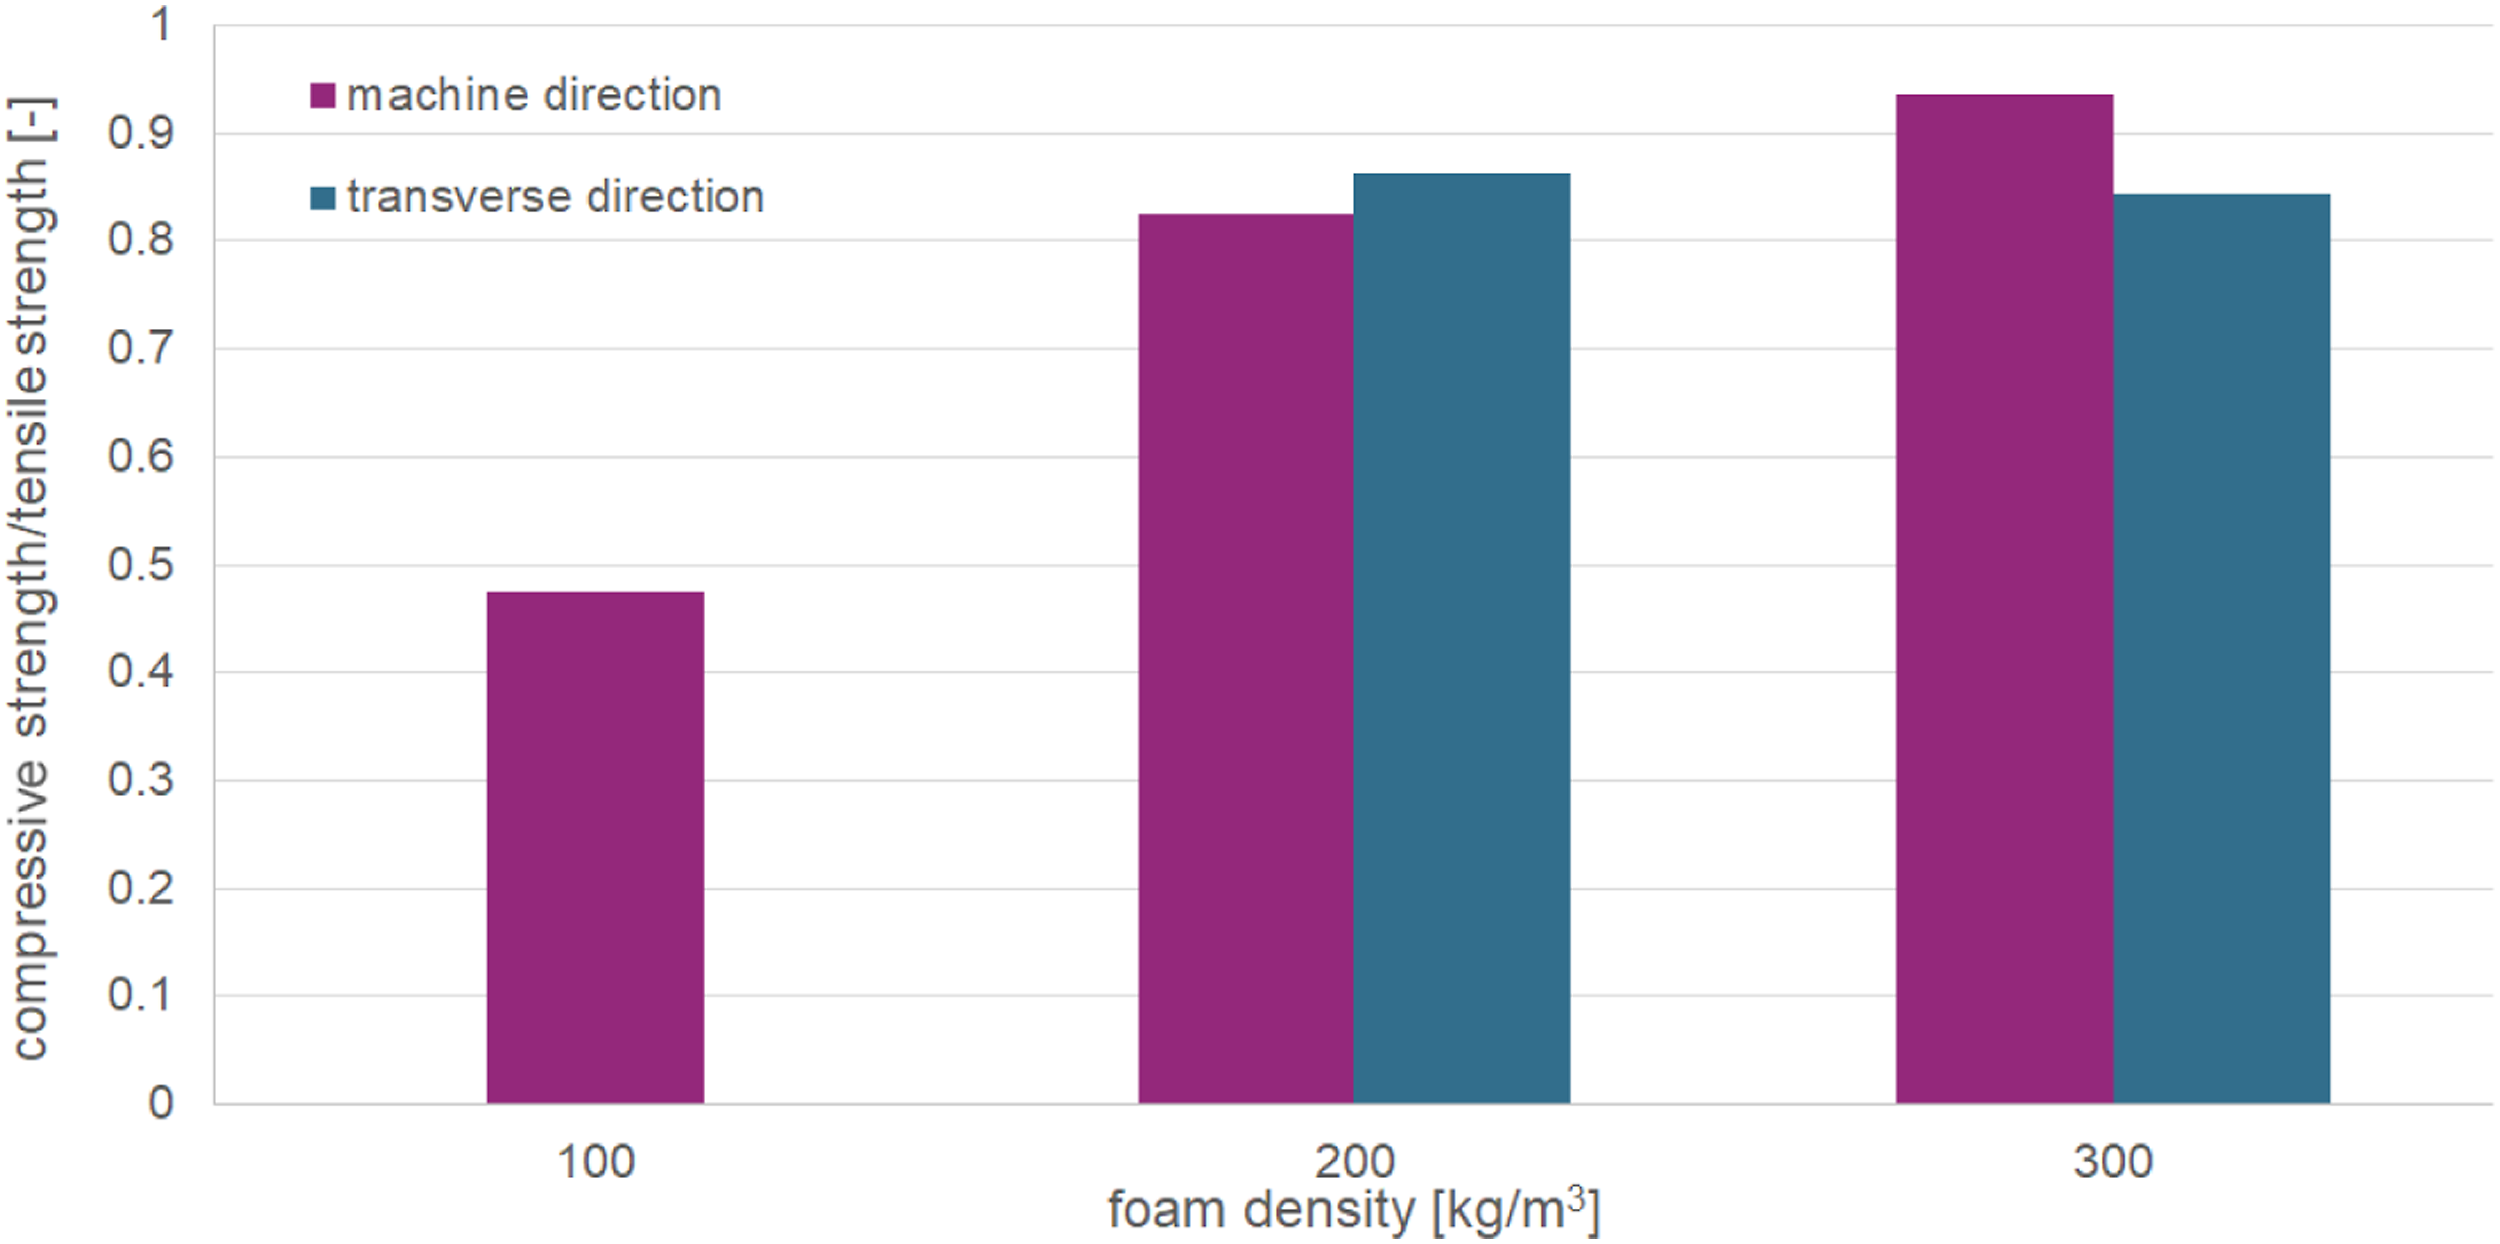
The ratio of the foam with a density 100 kg/m3 is significantly lower than for the other two foams. It is assumed that this is caused by the distinctive buckling especially in the regions of open cells. The ratios of the other two foams are similar and nearly independent of the loading direction (machine and transverse direction).
Bending test simulation
In contrast to the specimens used for the tensile and compressive test simulations, the specimen dimensions have to be the same as in the experiment (80 mm × 25 mm ×3 mm) for the bending test simulation. They cannot be made smaller as the boundary conditions would not be the same in the simulation and in the experiment. Therefore, the microstrucutral model is not suitable for bending test simulations because if this model was used, the computational effort would be too high due to the large number of elements necessary to model the microstructure. Thus, constitutive models are generated to describe the foam behaviour under bending load.
Modelling and simulation methodology
The low density foam model (implemented in Abaqus)
34
which represents the compression and tension behaviour of low density foams is used as the constitutive material model for the bending test simulation. The simulation results of the tensile and compressive tests, so the nominal stress –strain curves, serve as input for this model. Using this model, the determination of the neutral axis is not necessary. The simulation set up for the bending test is shown in Figure 13. The long side of the specimen represents either the machine or the transverse direction, depending on the investigated direction. The supports (analytical rigid) are encastred and on the top striker the load is applied. A general contact definition is implemented in the model.
34
The specimen is meshed with linear hexahedral elements (element type in Abaqus: C3D8R). The mesh size is chosen so that there are 8 elements over the thickness, resulting in 28,248 elements. Simulation set up for bending test simulation.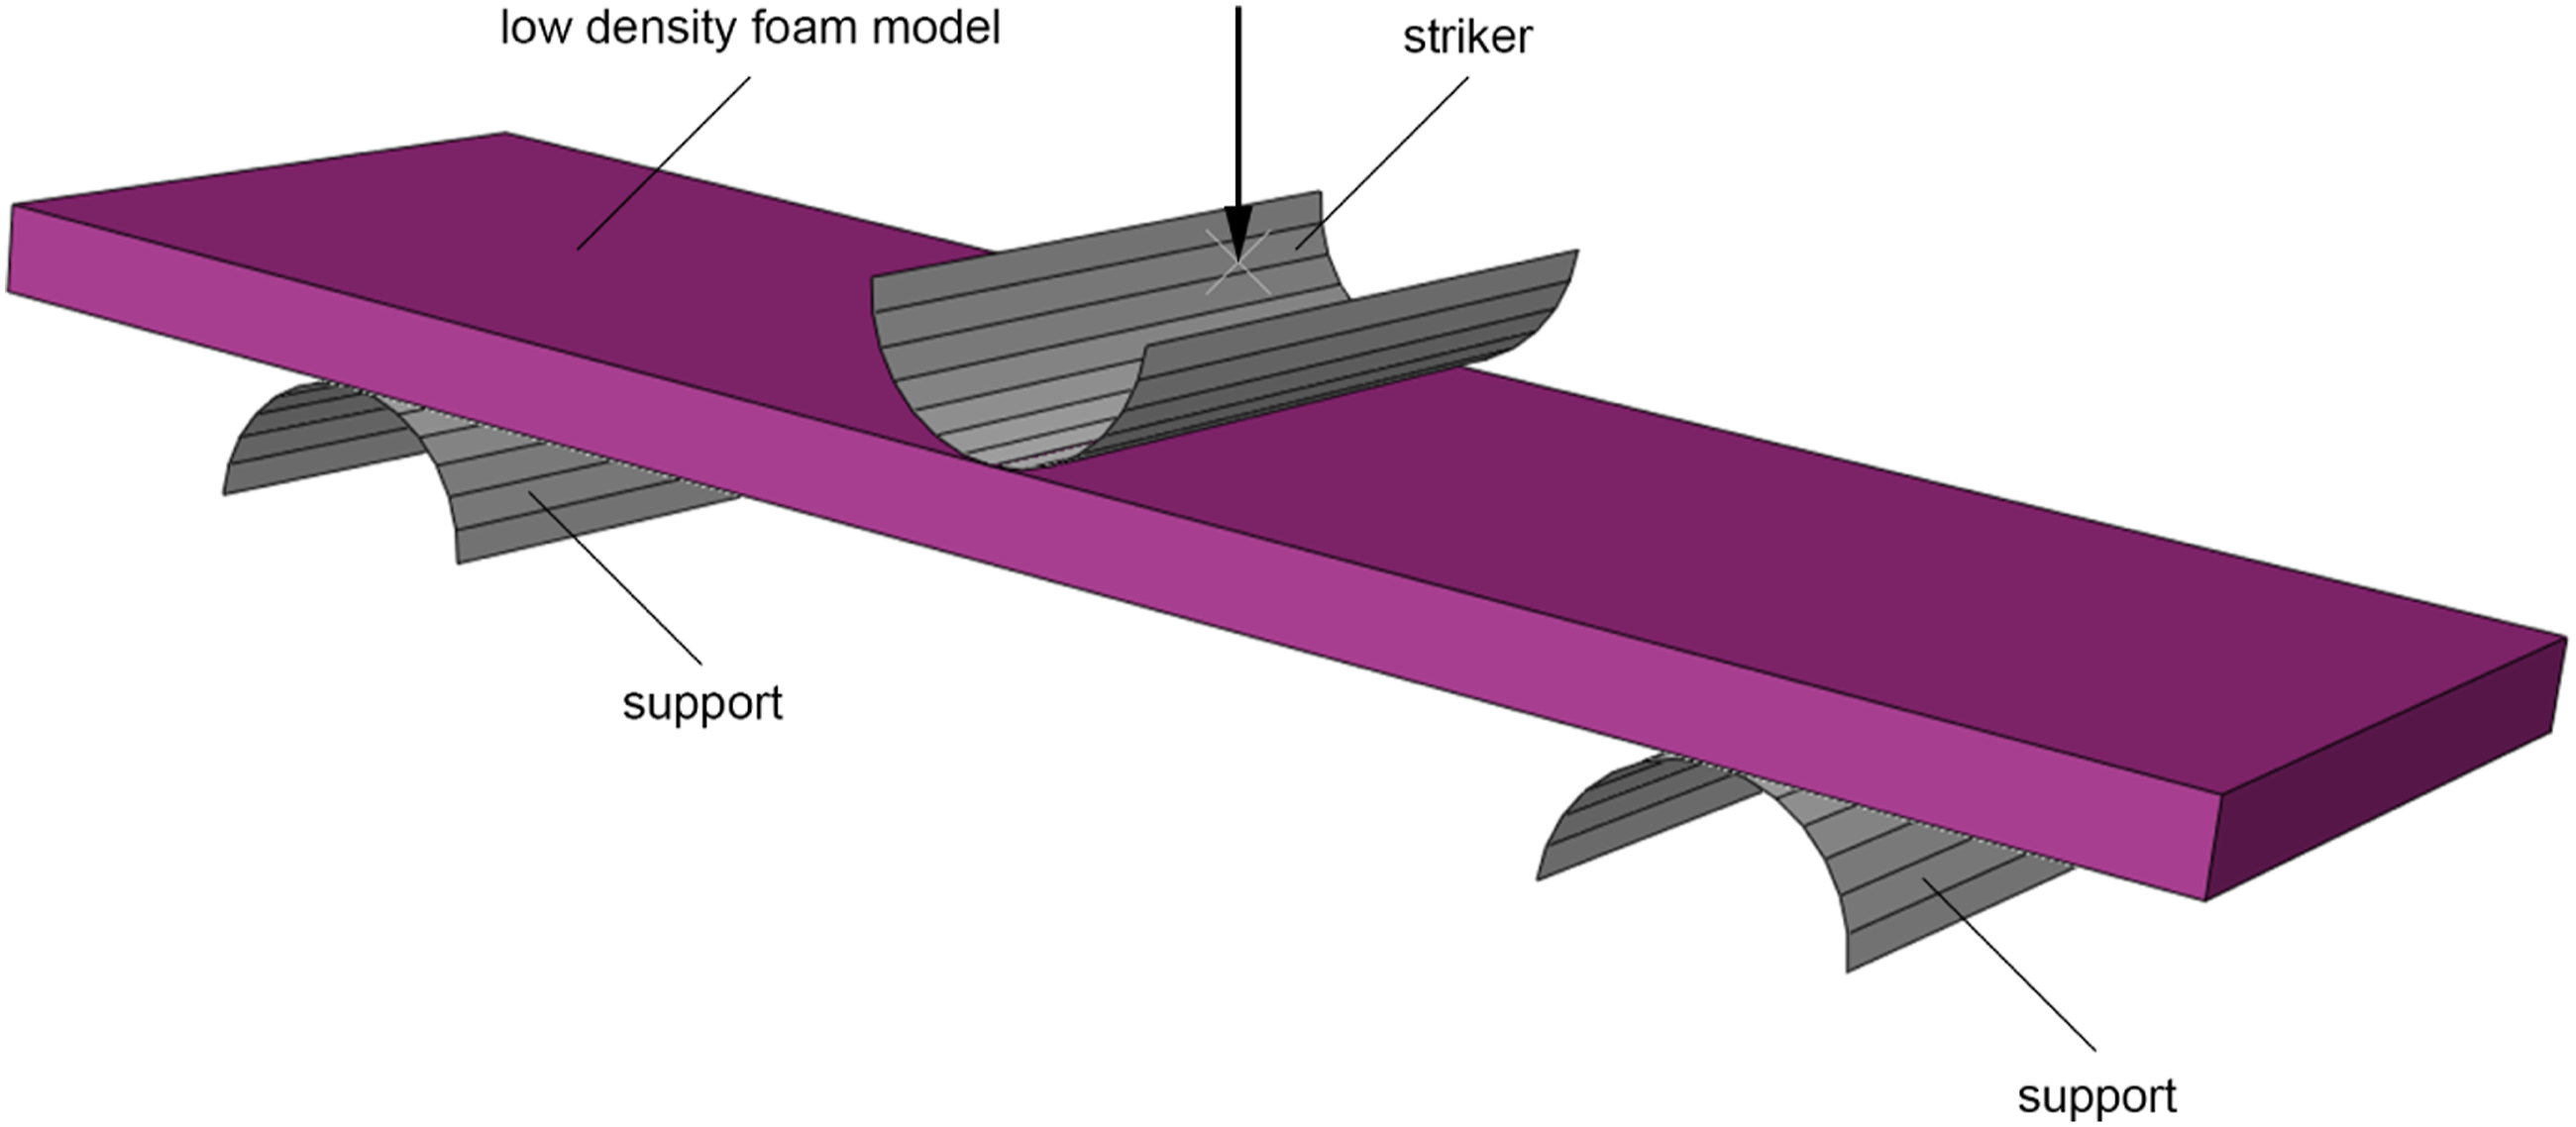
Results and discussion
Finite element simulations are performed for the three foams (100 kg/m3, 200 kg/m3 and 300 kg/m3) to investigate the bending behaviour. The simulation results and the validation with experimental results (ISO 178:2013) are shown in Figure 14. Similar to the tensile and compressive tests the original specimen dimensions are used for the stress and strain calculations. The experiments were conducted on a ZwickRoell Z010 testing machine with a 500 N load cell. For the displacement measurement, an extensometer (ZwickRoell 3-point bending sensor) was used. Additionally, in Figure 15 the ratios of the flexural modulus values obtained by simulation (Esim) to the experimentally determined flexural modulus values (Eexp) and the ratios of the strength values Comparison of the bending test simulation results with experimental results for the foams with densities of (a) 100 kg/m3, (b) 200 kg/m3 and (c) 300 kg/m3. Ratios of the flexural modulus values (Esim/Eexp) and strength values (σsim/σexp) in (a) machine and (b) transverse direction.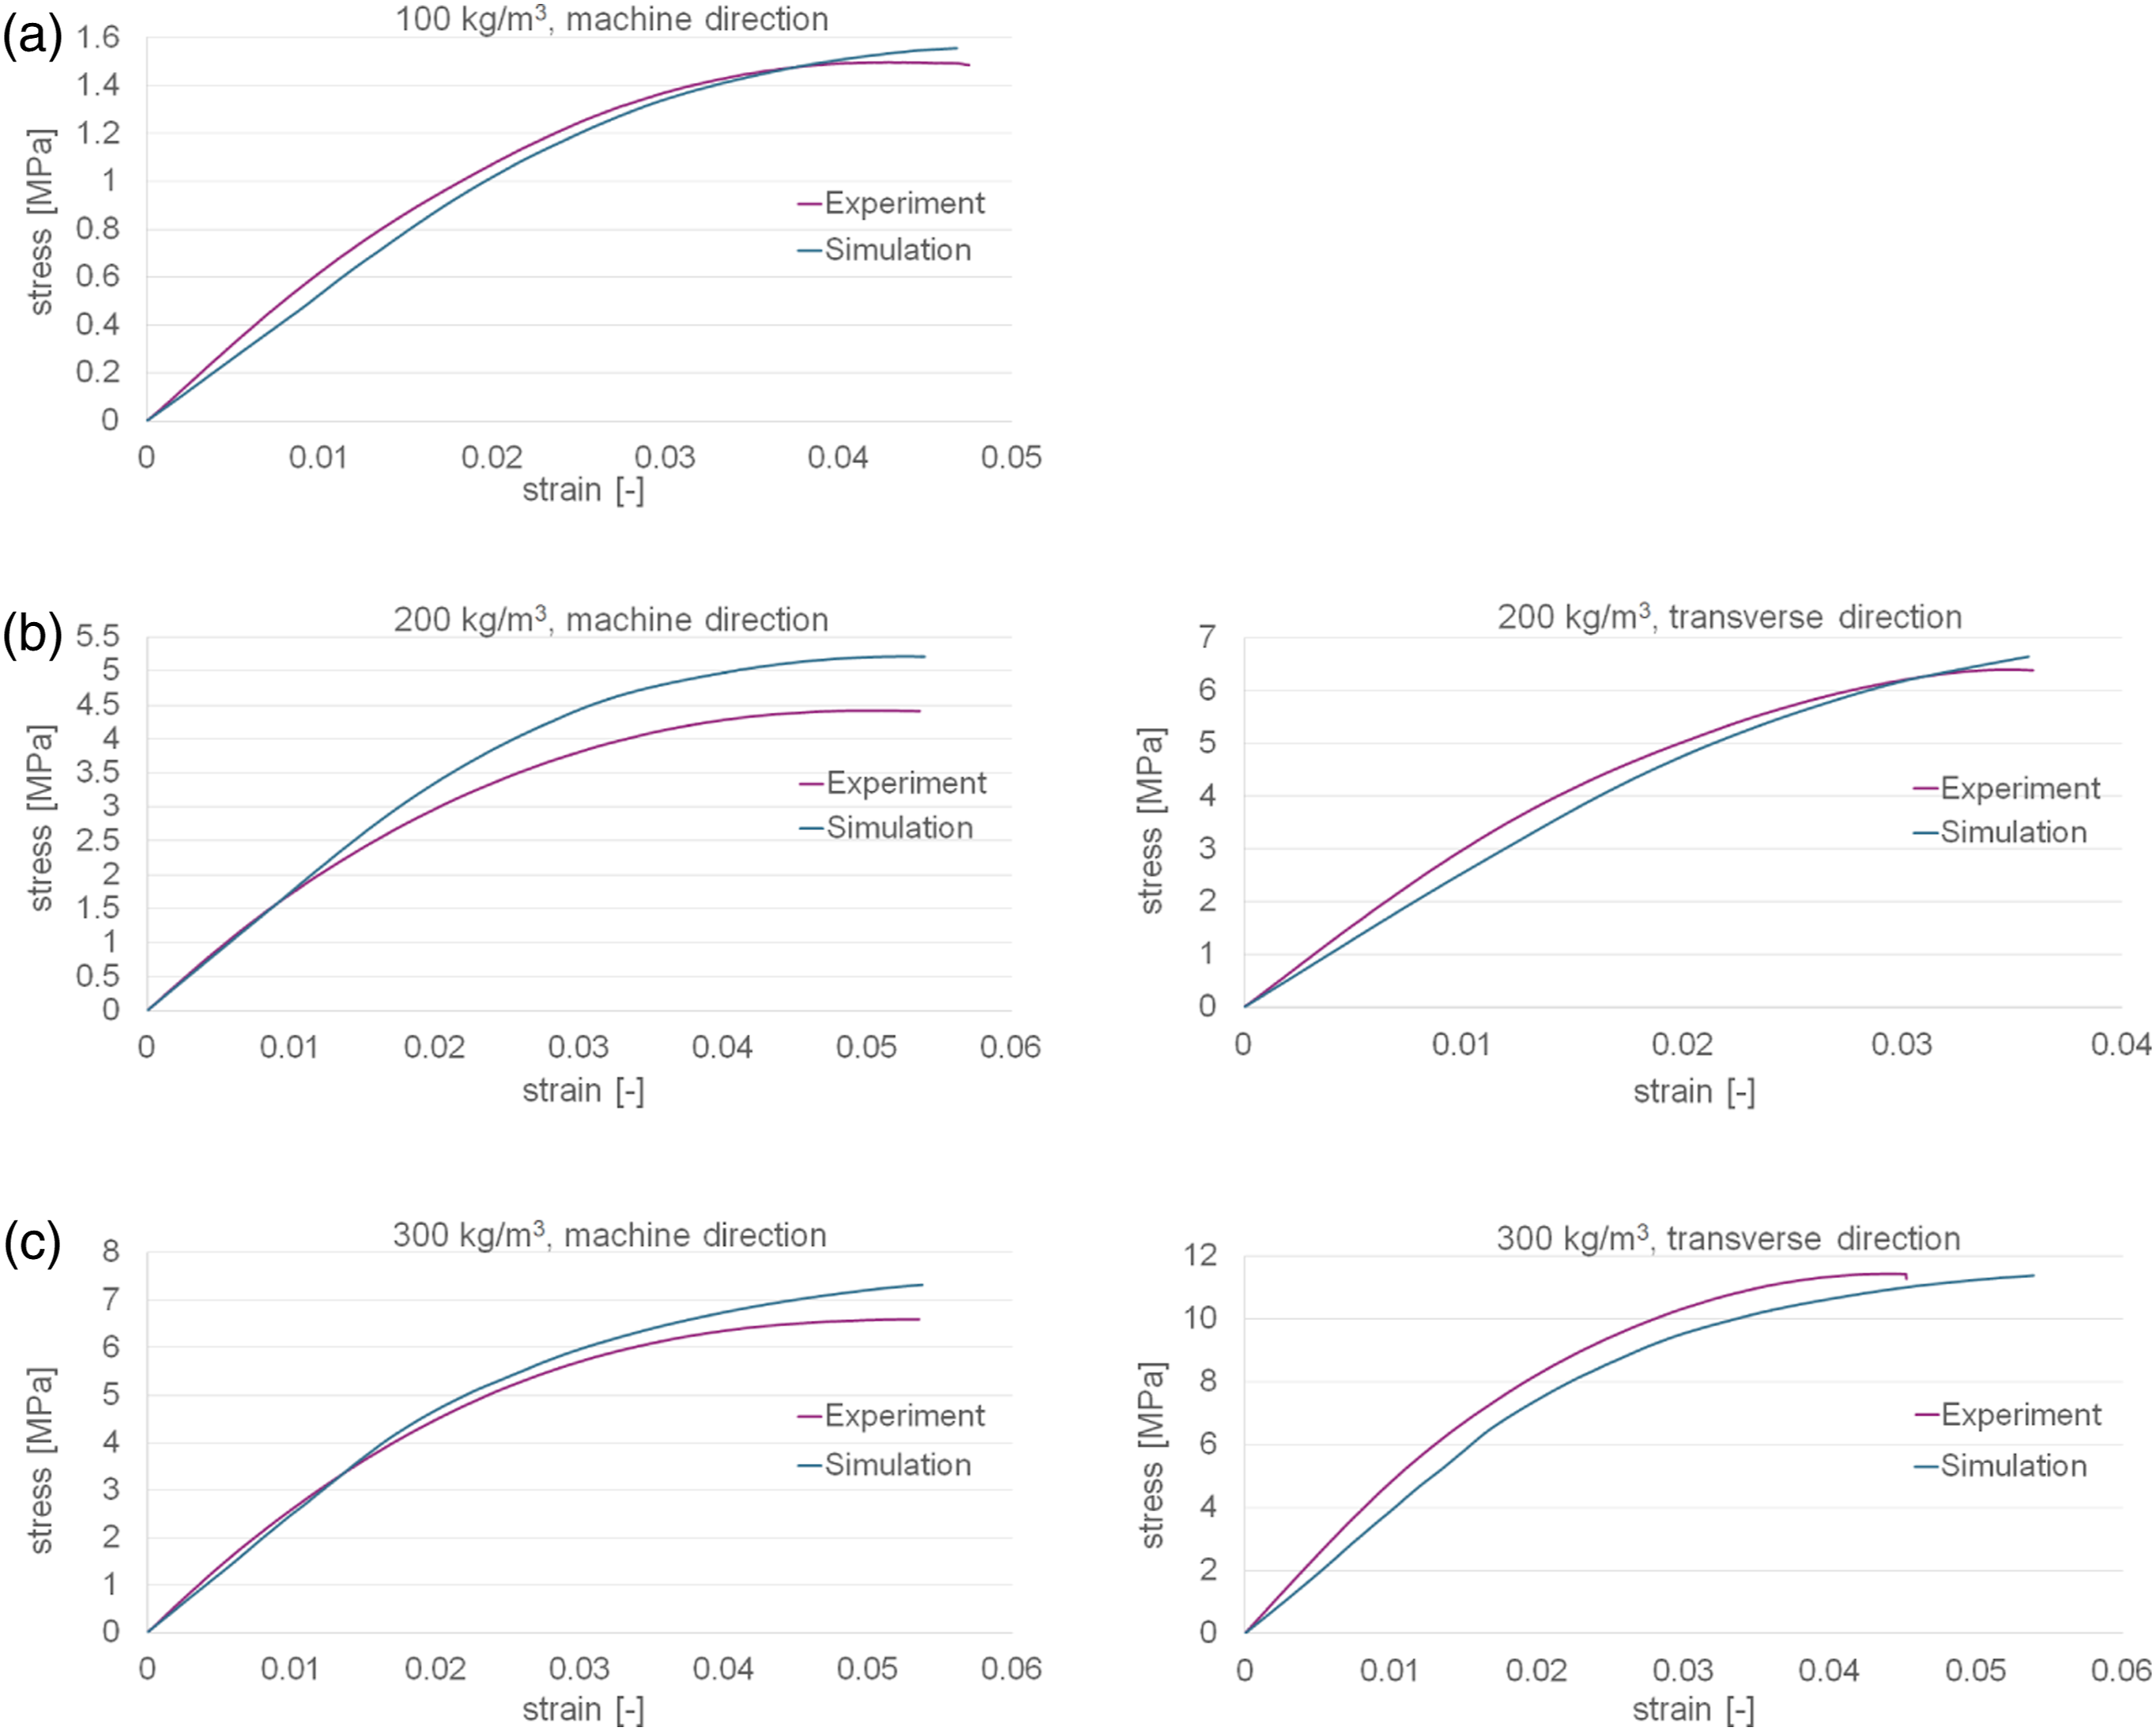
The stiffness estimated by the simulation of the foam with a density of 100 kg/m3 is below the stiffness obtained by the experiment (21%). The strength value is in good agreement with the experimental result. The bending stiffness in the machine direction for the foam with a density of 200 kg/m3 is similar to the experimentally obtained result, whereas the stiffness in the transverse direction is lower (18%) than the experimental one. This may be caused by the input for the material model where the tensile stiffness obtained by simulation is slightly lower than the tensile stiffness evaluated from the experiment. The bending strength in the machine direction is overestimated (18%) by the simulation, whereas in the transverse direction, it is well reproduced. Comparing the stiffness of the foam with a density of 300 kg/m3 with the experimental results, similar trends as for the foam with a density of 200 kg/m3 are found. The strength of the foam with a density of 300 kg/m3 in machine and transverse directions is in good agreement with the experimental result. It can be concluded that the bending behaviour in the machine direction and transverse direction of the foams can be reproduced well with the constitutive model, which was obtained from the compressive and tensile test simulation results. Therefore, with the validation of the bending test results, the compressive test simulations are indirectly validated and so the validation with experimental compressive tests is no longer necessary. It is assumed that these results depict the real foam compression behaviour well. Also the tensile tests are indirectly validated with the validation of the bending test simulations but they are already validated with experimental tensile tests.
Conclusion
Difference between Young’s/flexural modulus and strength values obtained by simulation and experiment in machine (MD) and transverse direction (TD).
The validation of the simulation results of the foam with 100 kg/m3 shows that the results are in good agreement with the experimental results which suggests that the open cells were implemented well in the model. Furthermore, it can be seen that the anisotropic behaviour of the foams with densities of 200 kg/m3 and 300 kg/m3 can be well reproduced, although the microstructural features, like anisotropic cell shape and cell wall thickness distribution are approximated and implemented in a simplified way. From this, it is assumed that the utilized microstructure of each foam model is representative for the entire foam microstructure. Moreover, the utilization of the presented constitutive modelling approach for simulations where the specimen’s dimensions are too large using the microstructural models is an efficient way as shown for the bending test simulations. Nevertheless, there is potential for the improvement of the introduced methodology as some results deviate from the experimental results like the bending stiffness in the transverse direction. The improvement includes the implementation of the microstructural features in more detail, which is the scope of future research work.
Footnotes
Declaration of conflicting interests
The author(s) declared no potential conflicts of interest with respect to the research, authorship, and/or publication of this article.
Funding
The author(s) disclosed receipt of the following financial support for the research, authorship, and/or publication of this article: This work was supported by the Project no. TKP2020-NKA-04 has been implemented with the support provided from the National Research, Development and Innovation Fund of Hungary, financed under the 2020-4.1.1-TKP2020 funding scheme.