
Abstract
Nowadays, there are several methods to obtain simulation models for foams which consider important microstructural features. This research study presents a method to obtain low density foam models directly from computed tomography (CT) data. Finite element meshes are created from CT measurement results of a polypropylene extrusion foam with two different densities. Sensitivity studies with regard to the tension behaviour are performed with the microstructural models. The study shows that the tension behaviour highly depends on the examined area of the foam because the microstructure and density vary through the foam. Furthermore, the simulation results are validated with experimental results. The validation shows that the tension behaviour of the investigated foams characterised by the simulation approach is in good agreement with the experimentally observed behaviour and that specific microstructural characteristics (e.g. anisotropic cell shapes) are captured in the model.
Introduction
Several methods to develop simulation models for foams are presented in literature. 1 Basically, there are two modelling approaches 2 : constitutive models3-8 and direct models.9-17 The methods differ in the way the microstructure is described. In the constitutive models the foam microstructure is approximated by a homogeneous medium whereas in the direct models the microstructure is described in detail. One direct method is to create finite element models directly from computed tomography (CT) data. A mesh representing the foam microstructure is extracted from CT measurement results. Different software and methods are presented in literature11,18 in order to obtain a mesh suitable for finite element simulations. However, they all have in common a preliminary segmentation based on the grey values of the area of interest. In general, it can be distinguished between three different ways to generate volume meshes. 18 One approach is a mesh generation based on the centre coordinates of each cell (estimated by CT) in beam or plate element structure. This way is comparable to the meshes used by the Voronoi approach.13,19 Another way is to generate a cubic mesh directly out of the voxels/elements obtained from CT data. But this method leads to a high number of elements and probably to an inaccurate geometric representation. 20 Furthermore, a tetrahedral mesh of the actual shape can be generated, but the implementation of such meshing technique is more difficult. 18 As reported for a trabecular bone sample by Ulrich et al. 21 the tetrahedral mesh approach is more accurate compared to a voxel mesh. A comparison of different meshing approaches is also presented in Veyhl et al. 22 comparing voxel, tetrahedron, hexahedron and mixed meshes generated for metallic foams. New approaches for the mesh generation are also presented in Zhu et al. 23 and Niu et al. 24 Another approach to create a volume mesh is based on starting with the creation of a 2D triangle mesh. Then a 3D tetrahedral mesh is generated by filling the interior of the surface mesh. 20 Investigations using various approaches are also reported for polymer foams, 25 aluminium foams,26,27 as well as for different medical and biological applications, for example modelling a neuropathic foot.28,29 The direct CT modelling approach is costly due to the need of several post-processing steps and software applications. But in return the CT models exhibit microstructures which are similar to the real foam microstructure because features like cell size and cell shape distributions are captured in detail.11,12,30 Due to the precise description of the microstructure the number of elements, and therefore the computational effort is high compared to other direct methods, where the microstructure is modelled in a more simplified way. The computation time can be decreased by the utilisation of small simulation models but the models have to be still large enough to represent the entire foam microstructure.31,32 It may be necessary to investigate several regions if the microstructure varies through the foam to determine the foam properties. In this research work finite element meshes and simulation models, respectively for low density extrusion foams with two different densities are created directly from CT data. Tensile test simulations are performed with the models and validated with experimental results. Therefore, conclusions regarding the applicability of the methodology can be drawn.
Mesh generation methodology
In the following, the developed mesh generation methodology from CT data is described. Solid finite element meshes are created for two low density extrusion foams (200 kg/m3 and 300 kg/m3) made of a high melt strength polypropylene. For this the software Avizo™, Version 2019.4 (Thermo Fisher Scientific Inc.) and the corresponding XWind Extension are utilised. The extension enables the generation of a tetrahedral mesh for finite element simulations based on 3D data. In this case, the 3D data is obtained by X-ray CT with an isometric voxel size of 3 µm at a laboratory CT device of the University of Applied Sciences Upper Austria. Some pre-processing steps of the original volume data are carried out with the software VGSTUDIO MAX, Version 3.3.5 (Volume Graphics GmbH), including the application of an adaptive Gauss filter. This filter enables local smoothing without destroying relevant structures, for example edges. Furthermore, the volume is reduced by cutting a region of interest (ROI) with a size of approximately 3 mm × 3 mm × 3 mm, not including the surface of the foam sample (Figure 1). The shown ROI (marked with a purple rectangle) in Figure 1 was filtered by an adaptive gauss filter, so slight differences can be observed especially in the air regions (less noise).
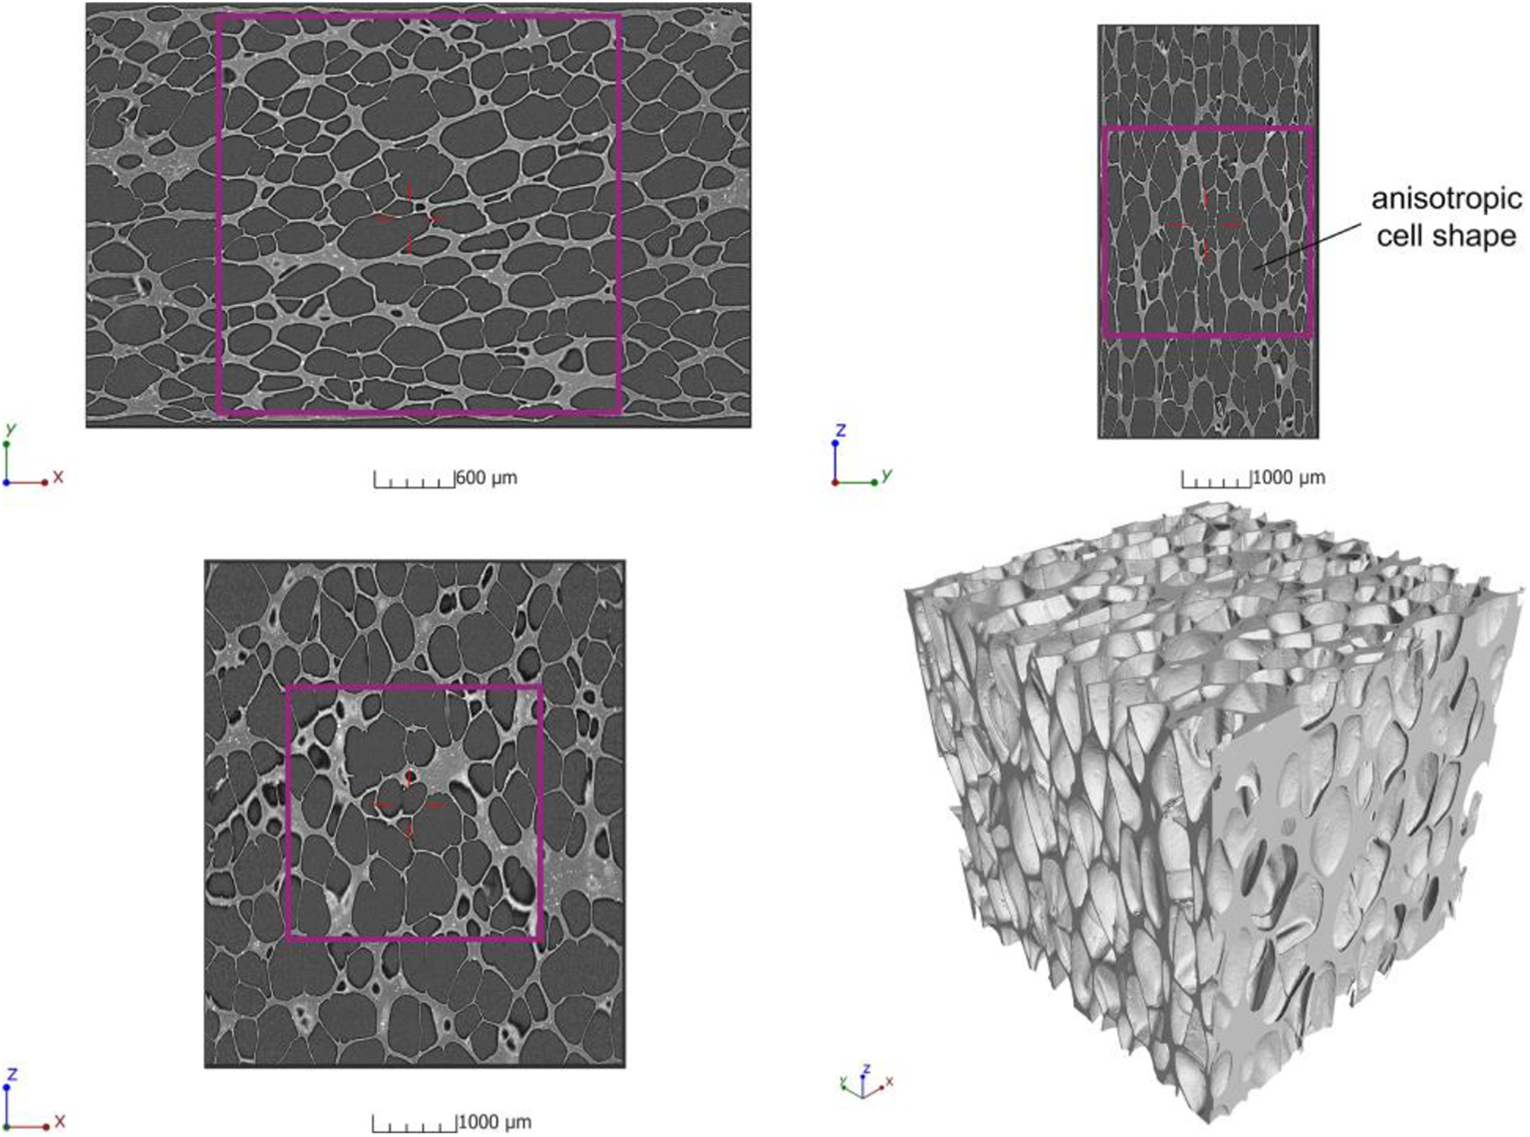
Sectional images and 3D rendered ROI of the foam with a density of 200 kg/m3.
The foam data is segmented with the thresholding tool of the segmentation editor in Avizo™. 33 In the publication of Plank et al. 34 different threshold methods and the applicability of such a procedure are discussed. In this study, for the foam samples an ISO-50 threshold (grey value at 50% between background and material peak, see Figure 2) is used, which means that all voxels with a higher grey value than the ISO-50 value are labelled, and therefore the foam structure can be segmented.
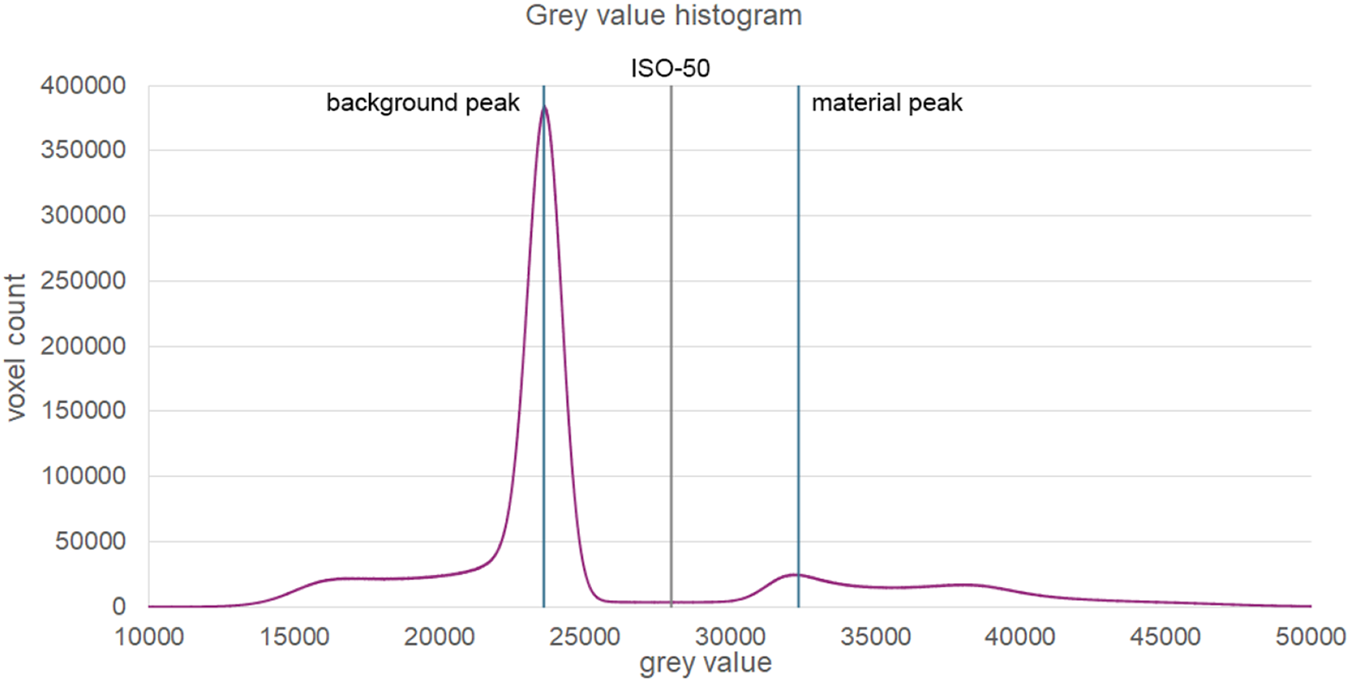
Grey value histogram with marked background and material peak, as well as the ISO-50 threshold value.
The labelled data is used for the generation of the mesh. The fast meshing option was selected and a low meshing quality was used, such that the number of tetrahedrons does not become too large (approximately 3 million elements). These options led to a facet size of 120 µm, a facet distance of 6 µm and a cell size of 120 µm. Facet size and cell size specify the upper bounds for the radii of a circle circumscribing the surface facet and the circumradii of a tetrahedron element, respectively. The software generates a mesh with small elements (minimum element size is ∼0.35 µm) close to a curved surface and large elements (largest element size is ∼0.17 mm) away from it. With the facet distance, the approximation error between boundary and subdivision surface can be controlled. 33
Simulation methodology
The obtained meshes can be used to perform finite element simulations. Hereafter, the simulation methodology is described. The meshes are imported into the finite element solver Abaqus (Dassault Systèmes). In the models a few elements are present which are not connected with the models. This is especially the case in the regions of thin cell walls and in the boundary area. These elements are deleted because they do not alter the simulation results but would affect the simulation time. As already mentioned, the models have approximately 3 million tetrahedral elements. If simulations were performed with these models the computational effort would be high, also because there are several distorted elements (due to the complex geometry) which reduce the simulation speed. Thus, the number of elements has to be reduced which is done by partitioning the model into several regions and by analysing the regions separately. This minimises the computation time (computation time is approximately 1–2 days on a computer with 8 cores and 3.8 GHz), nevertheless the entire foam structure is investigated. Figure 3(a) shows the partition of the foam in x-direction which is the extrusion (machine) direction. The dimension of one partition is approximately 3 mm × 1.5 mm × 1.5 mm. Anisotropic behaviour is expected due to anisotropic cell shape caused by the production process (Figure 1). 35 Thus, the mechanical behaviour of the foam is also investigated in z-direction, which is the direction transverse to the machine direction. The partition of the foam in this direction is shown in Figure 3(b).
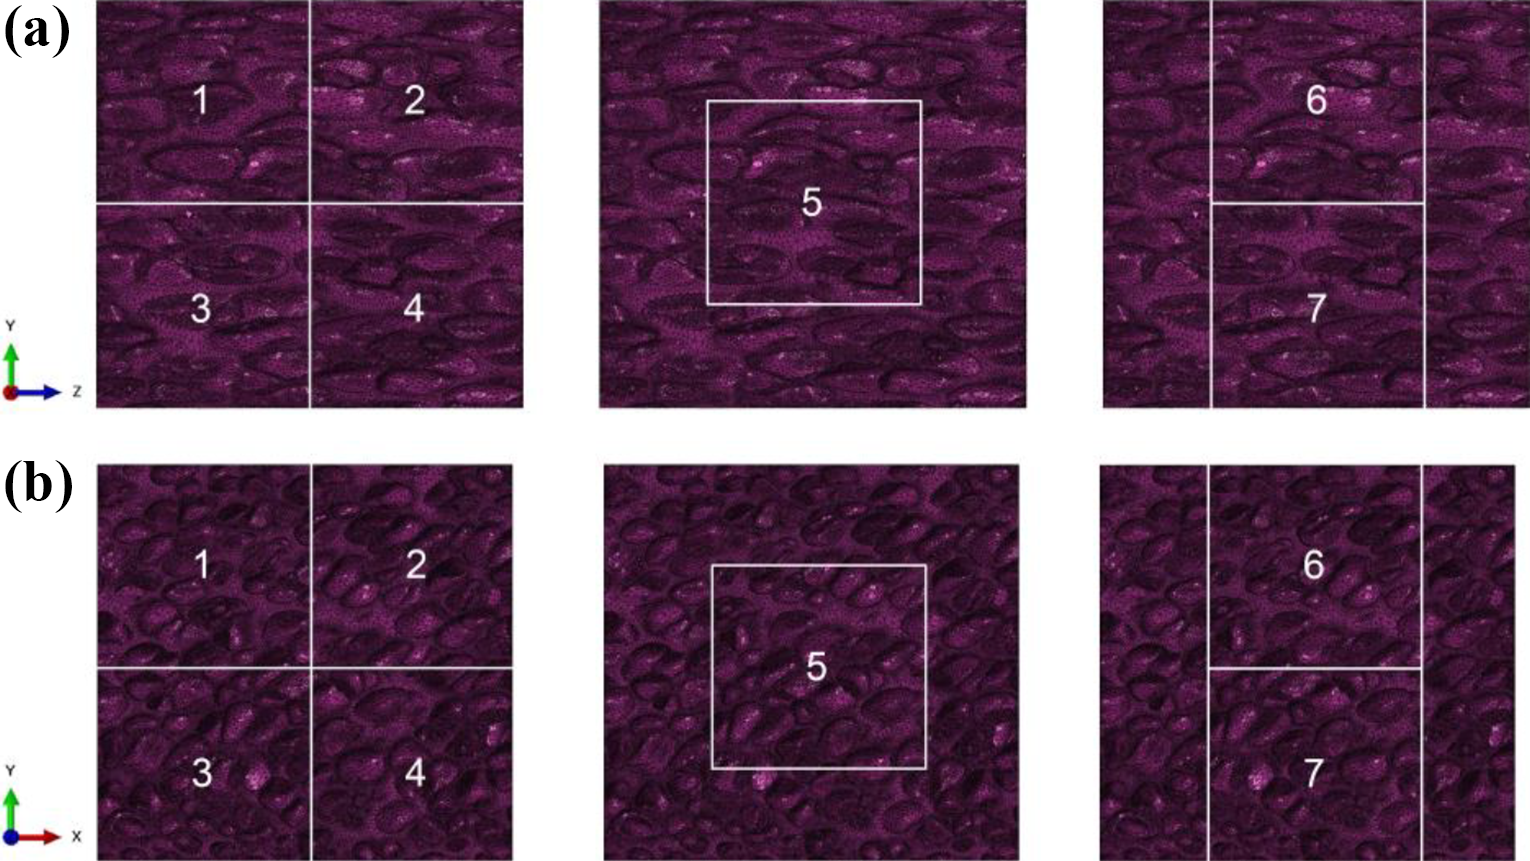
Illustration of the 14 regions the foam is partitioned: (a) machine direction and (b) transverse direction.
The dimension of one foam partition in transverse direction is approximately 1.5 mm × 1.5 mm × 3 mm. A total of 14 simulation models are generated for each foam (200 kg/m3 and 300 kg/m3) in order to characterise the entire foam. One foam partition has approximately 750,000 linear tetrahedral elements (element type in Abaqus: C3D4), which is equivalent to about one quarter of the elements of the entire foam model.
Density distribution of the foam partitions
The foam partitions are investigated regarding their densities. Figure 4 illustrates the density ratio of each foam partition which is the ratio of the density of the foam partition to the density of the entire foam. The density ratios allow for the determination if the specific foam partition has a higher or lower density than the entire foam. Moreover, the average density and the standard deviations are shown. Thus, the density distribution through the foam can be investigated. The parts in machine direction (MD) are designated as MD1–MD7 and in transverse direction (TD) TD1–TD7. It can be seen that foam partitions 5 (MD5 and TD5) have a significantly lower density ratio than the other foam partitions for both foams. The foam partitions of the foam with a density of 200 kg/m3 have higher average density ratios and lower standard deviations than the foam partitions of the foam with a density of 300 kg/m3. Therefore, it can be concluded that the density distribution in the foam with a density of 200 kg/m3 is more homogeneous. In transverse direction the foams exhibit higher standard deviations than in machine direction.
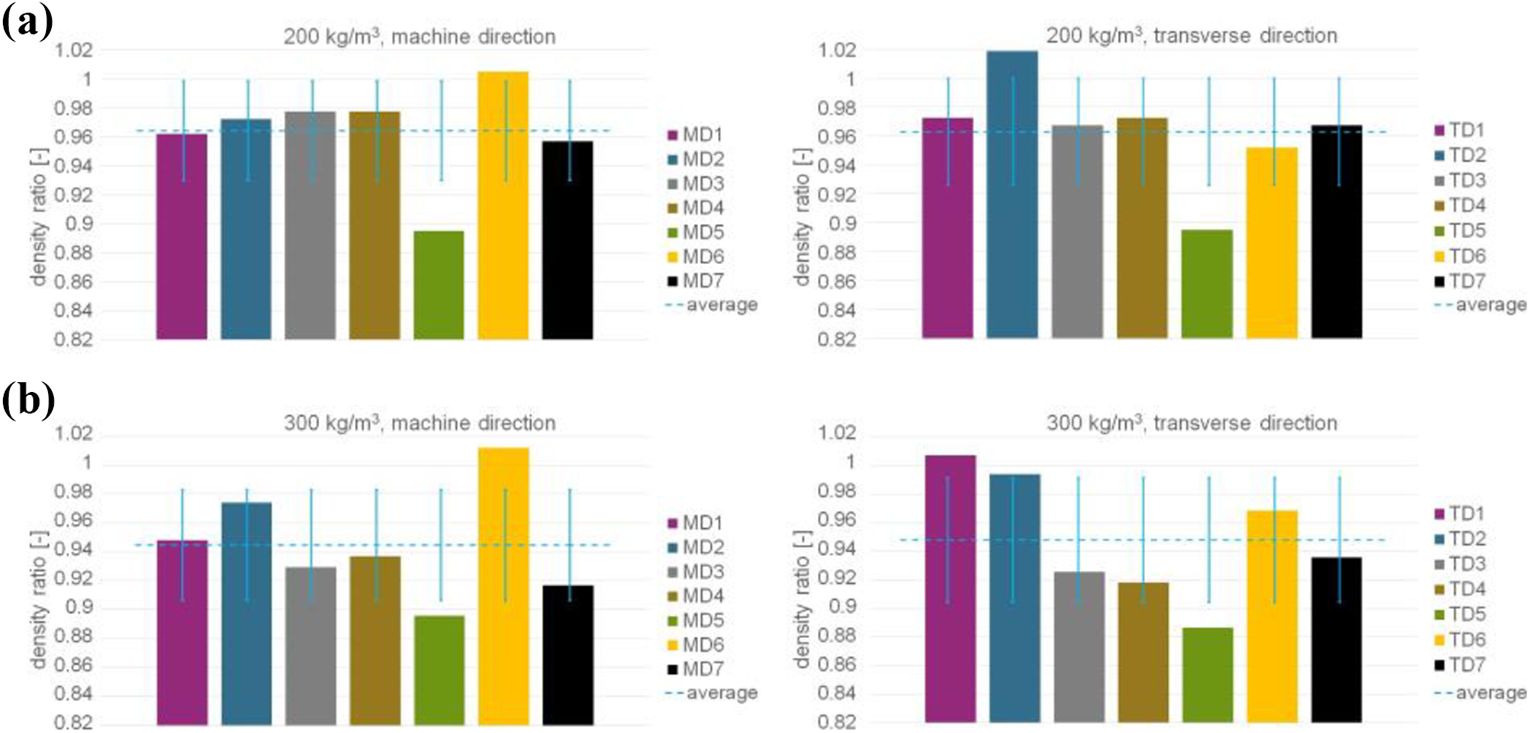
Illustration of the density ratios and the average density ratios with standard deviations of the partitions of the foams with densities of (a) 200 kg/m3 and (b) 300 kg/m3, left: machine direction and right: transverse direction.
Simulation set up
It is expected that the mechanical properties vary for the different partitions due to the density distribution through the foam. Simulations are performed for each of the 14 foam partitions because it is assumed that one single foam partition is not representative for the entire foam microstructure. The simulation set ups for the tensile test simulations in machine and transverse direction are shown in Figure 5. Reference points are created which are connected to the foam structure with a kinematic coupling constraint. The kinematic constraint causes that all the nodes on the specific loading plane are constrained to the rigid body motion of the reference node. 36 One reference point (RP1) is clamped (encastre; all degrees of freedom are blocked) and the tension load is applied to the other (RP2) by a displacement in the specific loading direction.
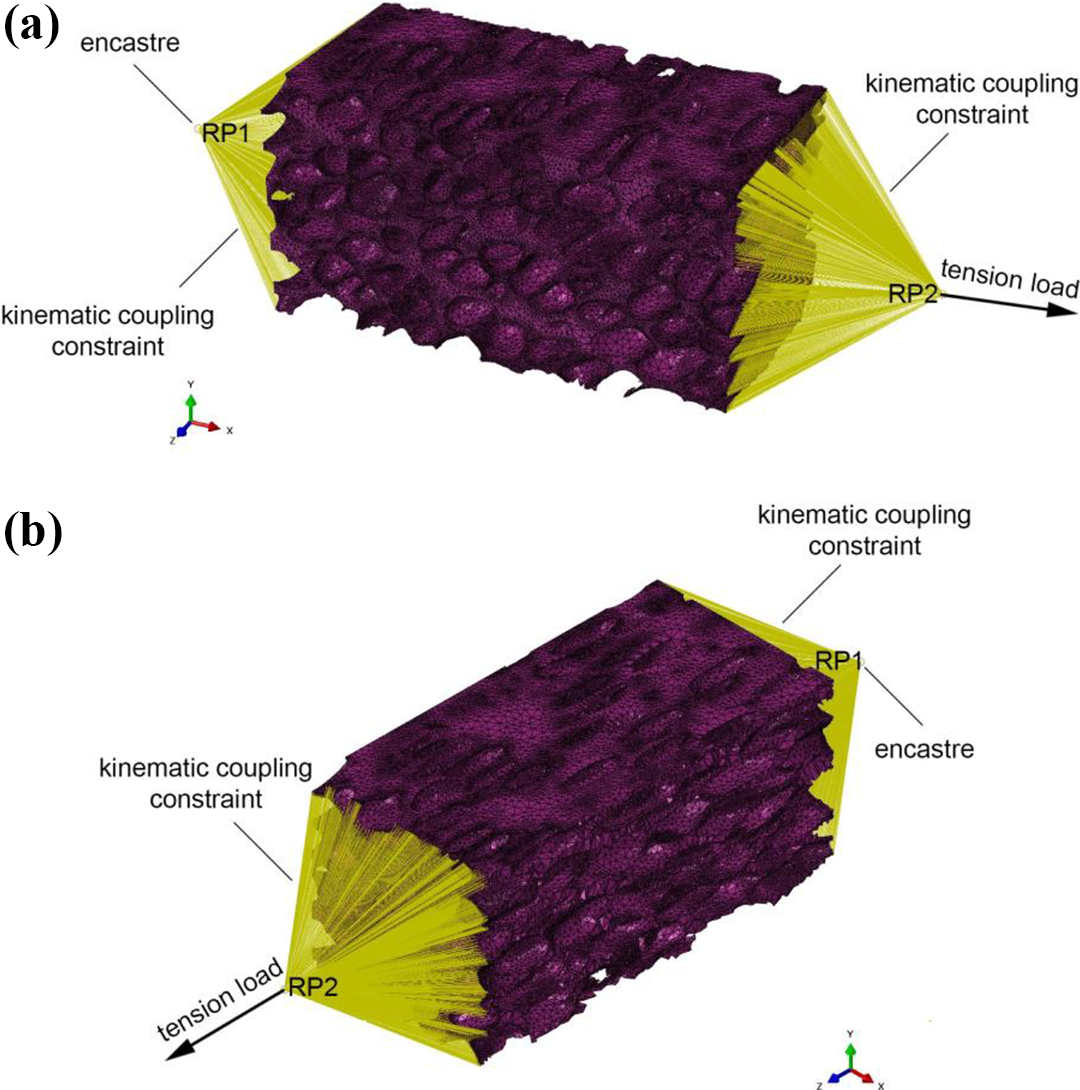
Illustration of the simulation set up for the tensile test in (a) machine direction and (b) transverse direction.
The material model used for the simulations is an elastic plastic material model (implemented in Abaqus) obtained from experimental tensile test results of the foam bulk material (ISO 527-1:2012, true stress–true strain values). The material model is illustrated in Figure 6. The Young’s modulus is determined between 0.0005 and 0.0025 strain (Young’s modulus = 1898 MPa) and the Poisson’s ratio is assumed to be 0.4. The plastic material model is based on the von Mises yield surfaces with associated plastic flow and isotropic hardening. 36 The yield stress is defined as the transition point from linear to non-linear behaviour. This transition point is chosen, so that the experiment is represented by the material model with the lowest deviation.
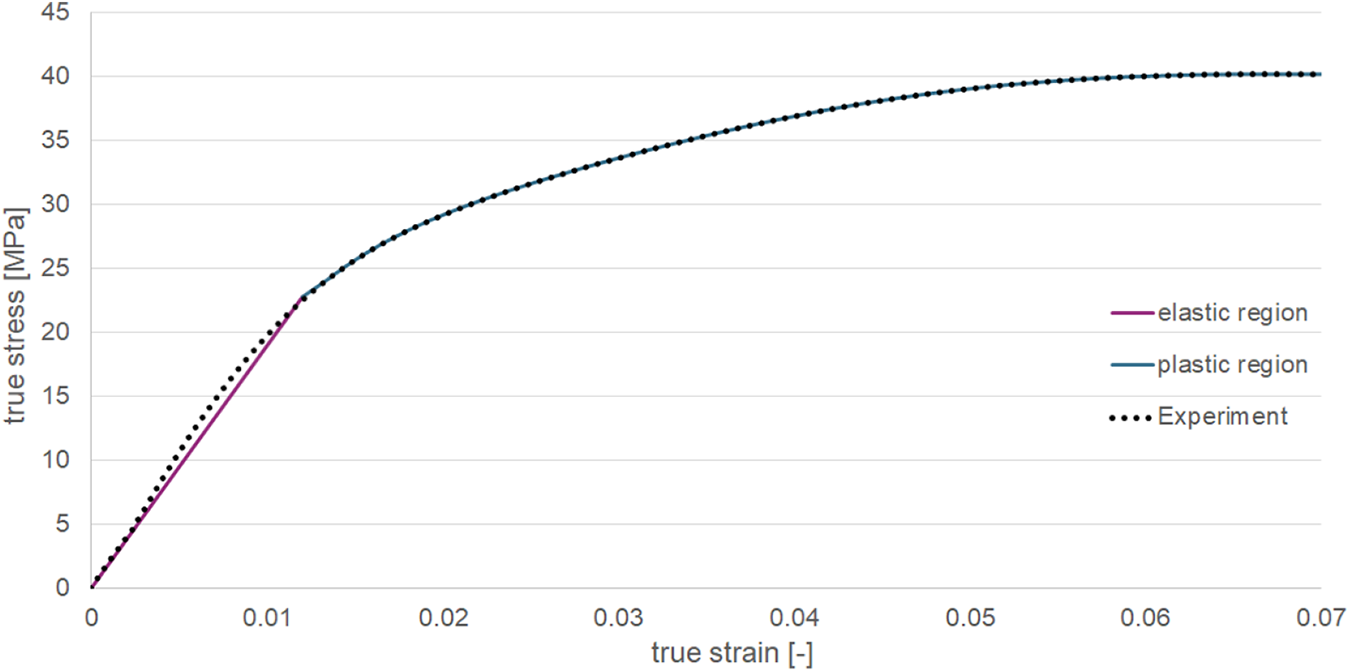
Illustration of the elastic plastic material model used for the tensile test simulations.
Results and discussion
In the following, the simulation results are discussed and validated with the experimental results of the foams. The specimen type 1B-(ISO-527-2) is used for the experiments and five test repetitions are performed according to ISO 527-1/-2.
In Figure 7, the simulation results of the foam with a density of 200 kg/m3 in machine direction are shown. In Figure 7(a), the stress-strain curves of the seven regions are illustrated. In Figure 7(c), the ratios of the Young’s modulus values obtained by simulation (Esim) to the experimentally determined Young’s modulus values (Eexp) and the ratios of the strength values ≙ maximum stress) obtained by simulation (Ssim) to the experimentally determined strength values (Sexp) ≙ maximum stress) are illustrated. It can be seen that the stiffness of the foam partitions are in good agreement with the experimentally obtained stiffness, especially the foam partitions MD1, MD4 and MD6 ≙ MD7). All determined stress values are lower compared to the experimental stress values. Foam partition MD5 shows the greatest deviation from the experimental results. The strength is significantly lower which is already expected due to the low density of this foam partition. For the foam partitions MD2 and MD3, which have similar densities, equal stress-strain curves are evaluated. Also the stress-strain curves of the foam partitions MD6 and MD7 are identical, although the density of foam partition MD7 is lower than the density of foam partition MD6. It is assumed that in foam partition MD7 the cells are more aligned in machine direction than in foam partition MD6 which causes similar stiffness values despite different densities. In Figure 7(b), the average curve of the results of the foam partitions MD1–MD7 is shown. It can be seen that the stiffness is in good agreement with the experimentally obtained stiffness but the stress values for strains >0.02 are lower than the experimental stress values which is already observed for the stress-strain curves of the single foam partitions.
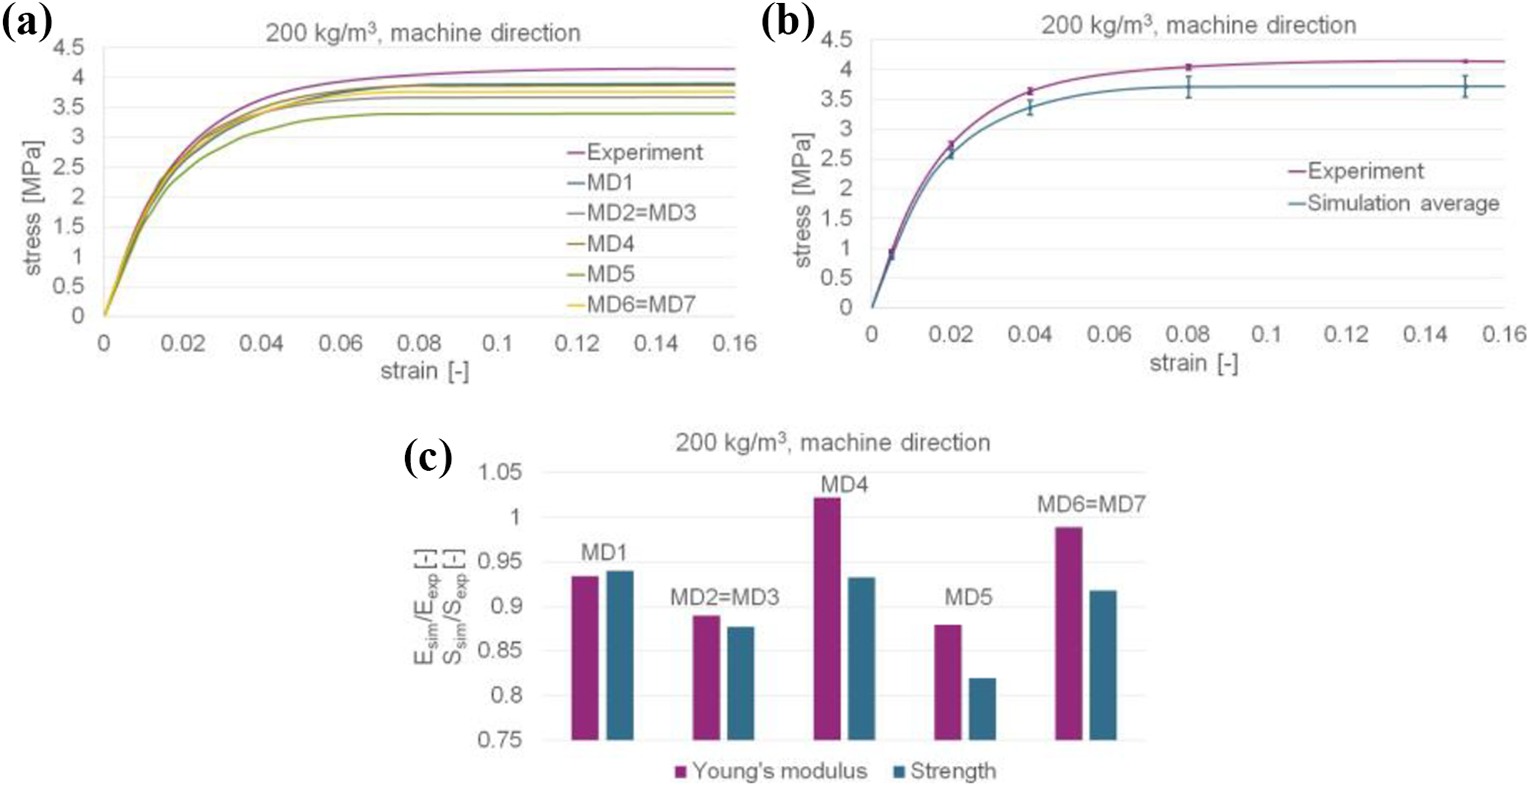
Comparison of the simulation results in machine direction of the foam with a density of 200 kg/m3: (a) stress-strain curves, (b) average stress-strain curve with standard deviations and (c) ratios of the Young’s modulus values (Esim/Eexp) and strength values (Ssim/Sexp) of the foam partitions MD1–MD7.
Furthermore, the standard deviations of the simulation and experimental results at 0.005, 0.02, 0.04, 0.08 and 0.15 strain are depicted. The experimental standard deviations at the examined strain values are all below 0.05 MPa. The standard deviations of the simulation results for strains ≤0.02 are lower than 0.07 MPa but at higher strains increase to 0.18 MPa.
The simulation results of the foam partitions MD1–MD7 of the foam with a density of 300 kg/m3 are depicted in Figure 8(a) and the comparison of the Young’s modulus ratios (Esim/Eexp) and strength ratios (Ssim/Sexp) are shown in Figure 8(c). Foam partition MD6 estimates the highest modulus and strength values due to the highest density. Also the foam partitions MD1 and MD2 have significantly higher modulus and strength values than the other partitions which is also caused by the high density of both foam partitions. The results of the foam partitions MD3–MD5 and MD7 are in good agreement with the experimental result. The foam partitions MD3 and MD4, which exhibit similar densities, have equal stress-strain curves. The foam partitions MD5 and MD7, which have the lowest densities compared to the other foam partitions, show similar results as the results obtained by the foam partitions MD3 and MD4. In Figure 8(b), the average stress-strain curve of the foam partitions MD1–MD7 is shown. The validation with the experimental curve shows that the stiffness is estimated well. However, the stress values at strains >0.005 are overestimated. Similar to the experimental result of the foam with a density of 200 kg/m3, also the experimental result of the foam with a density of 300 kg/m3 shows small standard deviations (<0.04 MPa) at the strains 0.005, 0.02, 0.04, 0.08 and 0.15. The standard deviations of the simulation results at these strains are significantly higher (0.11 MPa at strain 0.005 and 0.33 MPa at strain 0.02) and increase with higher strains (0.43 MPa for strains >0.02).
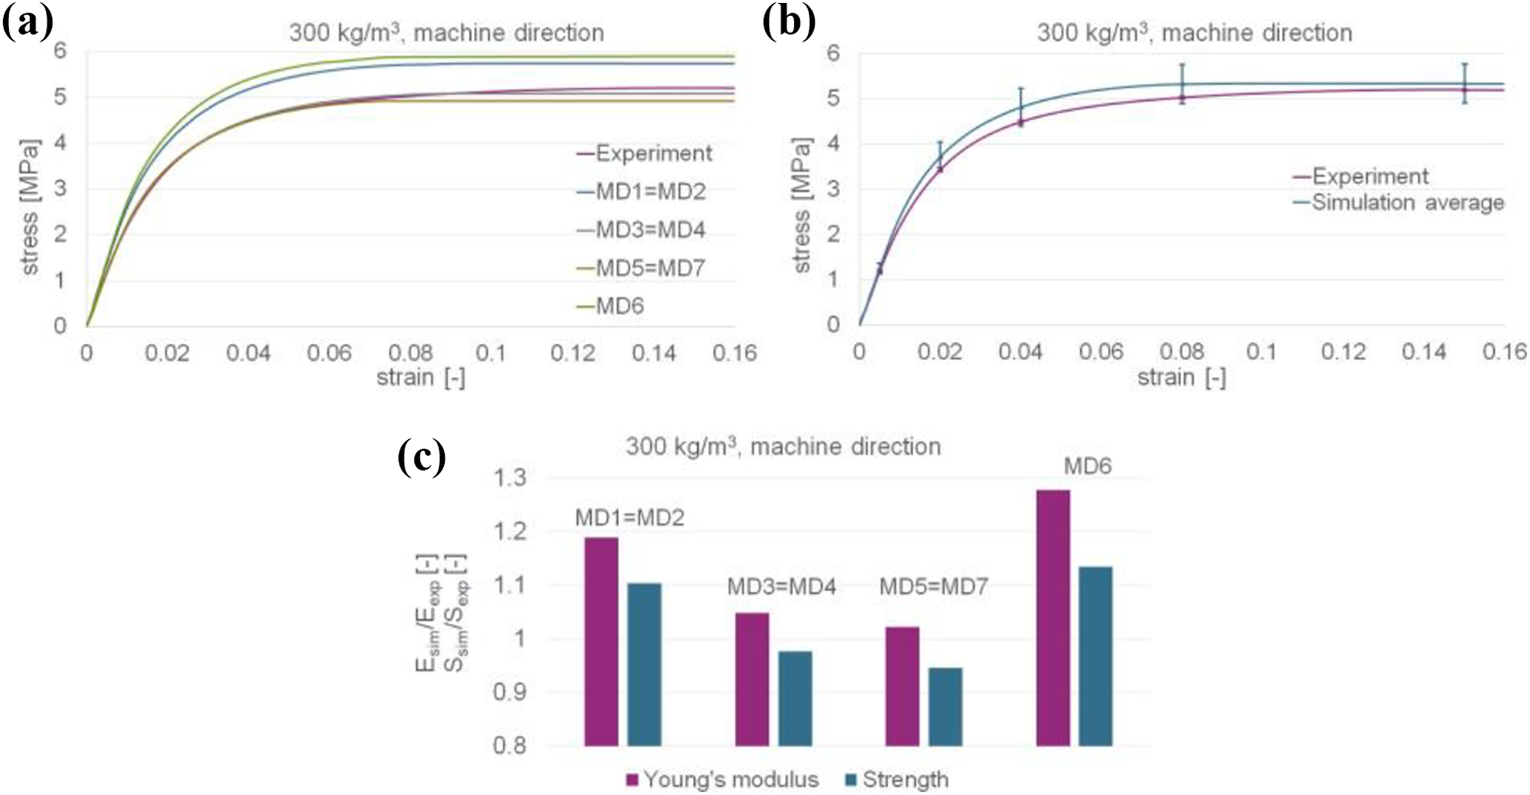
Comparison of the simulation results in machine direction of the foam with a density of 300 kg/m3: (a) stress-strain curves, (b) average stress-strain curve with standard deviations and (c) ratios of the Young’s modulus values (Esim/Eexp) and strength values (Ssim/Sexp) of the foam partitions MD1–MD7.
In Figure 9(a) and (c), the simulation results in transverse direction of the foam partitions TD1–TD7 of the foam with a density of 200 kg/m3 are shown.
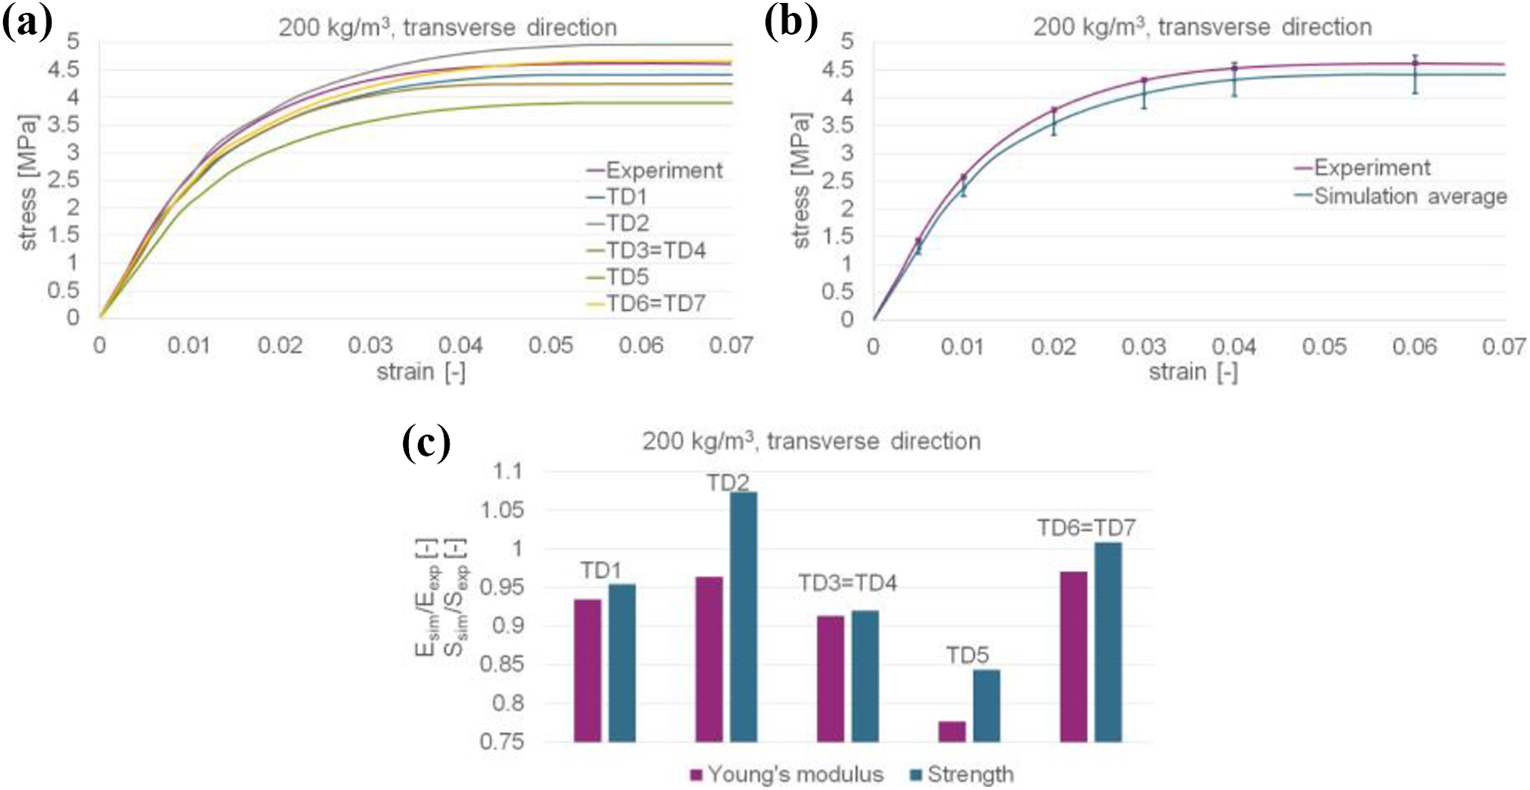
Comparison of the simulation results in transverse direction of the foam with a density of 200 kg/m3: (a) stress-strain curves, (b) average stress-strain curve with standard deviations and (c) ratios of the Young’s modulus values (Esim/Eexp) and strength values (Ssim/Sexp) of the foam partitions TD1–TD7.
It can be seen that the estimated Young’s modulus and strength values of all foam partitions with the exception of foam partition TD5 agree well with the experimentally determined values. The stiffness of foam partition TD5 is lower and also the strength is underestimated which is caused by the low density. Foam partition TD2 shows the highest strength value due to the high density. The foam partitions TD3 and TD4 have similar densities which results in identical stress-strain curves. The simulation results of the foam partitions TD6 and TD7 are in good agreement with the experimental results. The comparison of the average stress-strain curve (Figure 9(b)) with the experimental stress-strain curve shows that the stiffness is underestimated by the simulation and also the stress values for strains >0.005 are lower than the experimentally obtained stress values. Furthermore, the standard deviation of the simulation results (for the strains 0.005, 0.01, 0.02, 0.03, 0.04 and 0.06) increases for higher strains (from 0.1 MPa at strain 0.005 to 0.34 MPa at strain 0.06) whereas the standard deviations of the experimental results are below 0.035 MPa, also for higher strains.
The simulation results in transverse direction of the foam partitions TD1–TD7 of the foam with a density of 300 kg/m3 are illustrated in Figure 10(a) and (c).
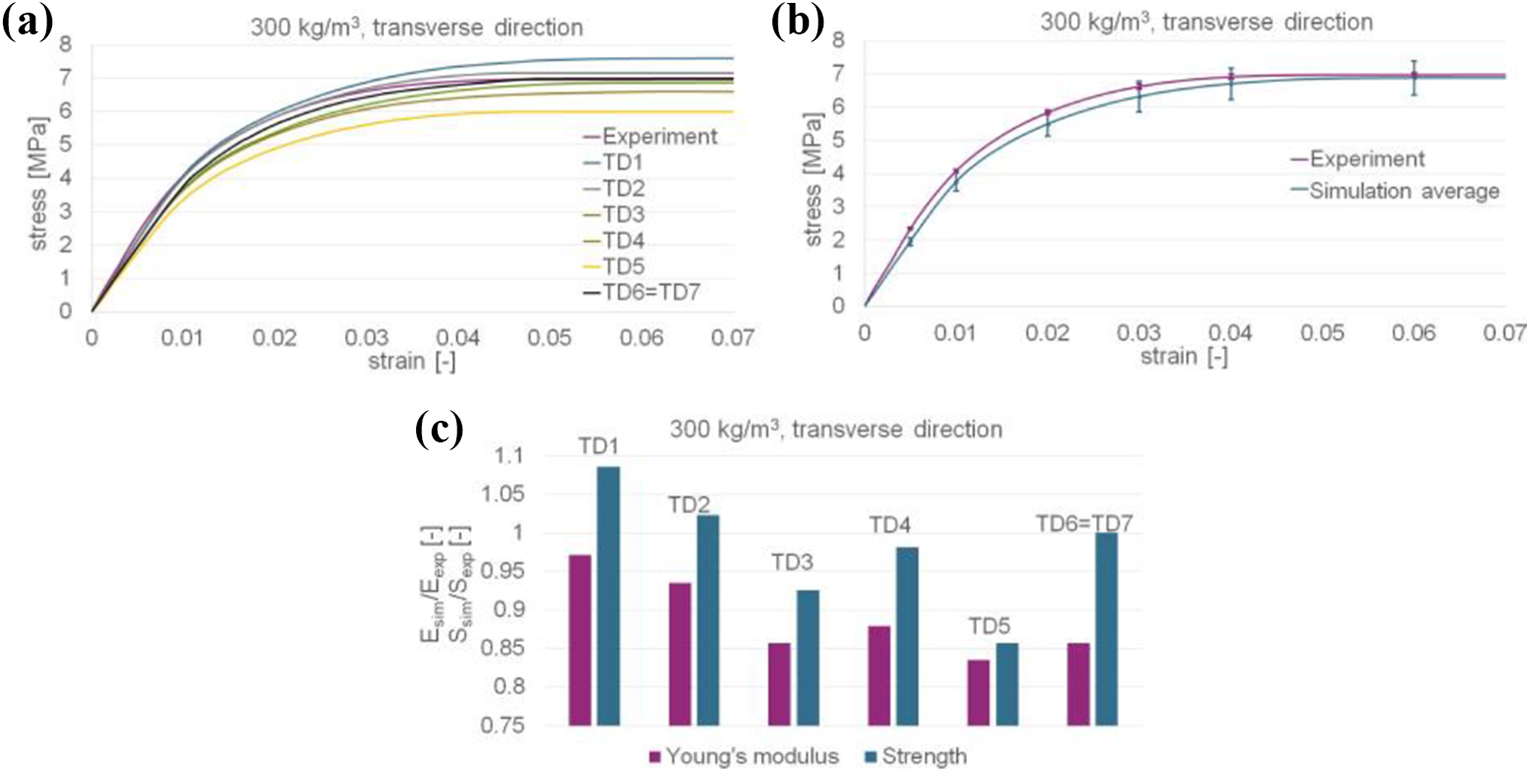
Comparison of the simulation results in transverse direction of the foam with a density of 300 kg/m3: (a) stress-strain curves, (b) average stress-strain curve with standard deviations and (c) ratios of the Young’s modulus values (Esim/Eexp) and strength values (Ssim/Sexp) of the foam partitions TD1–TD7.
The stiffness values obtained by the foam partitions TD1 and TD2 are similar to the experimentally determined stiffness. The foam partitions TD3–TD7 underestimate the stiffness. Foam partition TD1 which has the highest density shows the highest strength value whereas foam partition TD5 which has the lowest density shows the lowest strength value. The foam partitions TD6 and TD7 have identical stress-strain curves and the estimated strength value corresponds well to the experimental one. In Figure 10(b), the average stress-strain curve of the simulation results of the foam partitions TD1–TD7 are shown. The average stiffness and the stress values for strains <0.04 are lower than the experimental stiffness and stress values but the averaged stress values for strains >0.04 correspond well with the experimental stress values. For the experimental result the standard deviations are very low (<0.08 MPa at all examined strains), as already observed for the other experimental results. The averaged result from the simulations shows higher standard deviations especially for strains >0.01 (<0.3 MPa for strains ≤0.01 and up to 0.5 MPa for strains >0.01).
Conclusion
A modelling technique for low density foams is introduced. Finite element meshes for foams with two different densities were created directly from CT measurement results with the software Avizo™ and the corresponding XWind Extension. Due to the large number of elements of the obtained models, they are partitioned into 14 parts (7 parts in machine direction and 7 parts in transverse direction). A further advantage of the partitioning, beside the reduction of the number of elements, is that the density distributions of the foams can be investigated. It was observed that the density varies through the foam and that the foam partitions MD5 and TD5, which are located in the centre of the ROI have the lowest density. Tensile test simulations were performed and the results were validated with experiments. Variances in the stress-strain curves of a specific loading direction (machine or transverse direction) of the foam partitions from the foam with a specific density (200 kg/m3 and 300 kg/m3) were observed. Some foam partitions show the same tension behaviour due to the same density. Nevertheless, there are also foam partitions which have different densities but a similar stress-strain respond. There, it is assumed that other microstructural characteristics, beside the density (e.g. anisotropic cell shapes), influence the foam’s behaviour. The simulation results of the foam partitions were averaged. The averaged curves in machine direction estimate the stiffness well whereas in transverse direction the stiffness is slightly underestimated. The strength value in machine direction of the averaged curve for the foam with a density of 200 kg/m3 is underestimated and for the foam with a density of 300 kg/m3 it is slightly overestimated. For both foams in transverse direction the averaged stress-strain curves show slightly lower strength values than the experiments. In general, the simulation results are in good agreement with the experimental results for both foams.
Summarising, it can be concluded that the presented methodology is a suitable method to investigate the mechanical behaviour of low density foams. Even the anisotropic behaviour (higher stiffness and strength values in transverse direction than in machine direction) which is caused by the manufacturing process can be reproduced well. Nevertheless, the modelling effort is rather high due to the extensive data preparation and also the simulations demand significant computing resources. Furthermore, the ROI has to be chosen carefully because it was shown that the density varies through the foam which influences the stress-strain respond. From the validation with experimental results it is concluded that small simulation models (e.g. 3 mm × 1.5 mm × 1.5 mm) can be utilised if several regions at different positions of the foam microstructure are investigated. The single foam partitions are not representative but as it was shown in this research work the average result of multiple partitions (here seven) is representative for the entire microstructure.
The future task will be to characterise the mechanical behaviour of high density foams with the introduced methodology to evaluate if it is also applicable for these foams.
Footnotes
Declaration of conflicting interests
The author(s) declared no potential conflicts of interest with respect to the research, authorship, and/or publication of this article.
Funding
The author(s) disclosed receipt of the following financial support for the research, authorship, and/or publication of this article: Financial support was provided by the Austrian research funding association (FFG) under the scope of the COMET programme within the research project ‘Photonic Sensing for Smarter Processes (PSSP)’ (contract # 871974). This programme is promoted by BMK, BMDW, the federal state of Upper Austria and the federal state of Styria, represented by SFG.