
Abstract
As foams have become very important in several areas and since characterizing their properties is a crucial task, a finite element simulation model for high-density closed cell foams based on computed tomography (CT) measurements is developed. The model includes realistic microstructural features like cell size distribution due to the utilization of CT data. Moreover, a ‘skin-core-skin’ microstructure resulting from the manufacturing process (injection moulding) of the foams is also considered in the model. The mechanical behaviour of the foam’s core layer under tension and compression load is characterized based on the microstructural model to develop constitutive material models of the foam. These constitutive models enable further mechanical characterization of the foam with less computational effort. Compression and bending test simulations of injection moulded foams with three different densities are validated with corresponding experimental results. Thus, conclusions can be drawn regarding the reliability, applicability and possible further extensions of the high-density foam model.
Introduction
The foam microstructure and therefore foam properties highly depend on the manufacturing process (e.g. extrusion 1 ) and its parameters.2,3 The characterization of the foam behaviour can be done computationally. Several modelling approaches are presented in literature.4,5 One group are the constitutive models where the foam behaviour is described by a homogeneous medium.6–11 The microstructure of the foam is not modelled in detail and only approximated by a constitutive model resulting in simulation models with low computational effort. The second group of modelling methods for cellular materials is the direct modelling approach.12–17 Here, the microstructural features (like cell edge, cell face, etc.) are considered in detail in the model. Therefore, microstructural mechanisms are captured but keeping the computational effort within limits is a crucial task for this approach. The microstructural model has to be small enough to minimize the computation time but large enough to be representative for the entire foam microstructure.18,19 For low density foams, a proper approach to obtain a microstructural model is the Voronoi diagram. 17 The classical Voronoi approach leads to microstructures which deviate from the real microstructure. Thus, in literature there are several variations and extensions of the classical Voronoi tessellation to better approximate the geometry of real foams.20–22 A further way to obtain a direct foam model is to directly utilize computed tomography (CT) data. There, the real foam microstructure is depicted in a finite element model.23,24 This approach is also applicable for high-density foams. In this research study, a computed tomography based direct modelling approach for high-density injection moulding foams is developed capturing important microstructural features characteristic for high-density foams (e.g. skin-core-skin structure). The finite element model is not directly obtained from the CT measurement results but geometrical parameters are extracted and used as input for the modelling.
Constitutive models are derived from the simulation results performed with the direct model. These are further utilized for simulations where the specimen’s dimensions are too large to model the microstructure in detail.
Investigation of the foam microstructure
The bulk material of the investigated foams is a low viscosity polypropylene homopolymer. The foams are produced by injection moulding with chemical blowing agents. The mould is volumetrically filled with the polymer gas mixture and a pressure drop is generated with a certain opening stroke of the cavity which enables the gas to expand in the polymeric melt and to create a foam, which density depends on the opening stroke (core-back technology).
25
Foams with three different densities (700 kg/m3, 590 kg/m3 and 540 kg/m3) resulting from the opening strokes 2.3 mm, 2.7 mm and 3 mm are manufactured. Computed tomography (CT) measurements are conducted for the manufactured foams to investigate the foam microstructure (Figure 1). The CT scans were performed with a Phoenix Nanotom scanning device from GE Sensing & Inspection Technologies at a voltage of 80 kV, with a current of 140 μA and a number of projections of 1700. The voxel size was 5 μm and the integration time at the detector was 750 ms. Illustrations of the microstructures obtained from CT scans of the foams resulting from opening stroke: (a) 2.3 mm, (b) 2.7 mm and (c) 3 mm.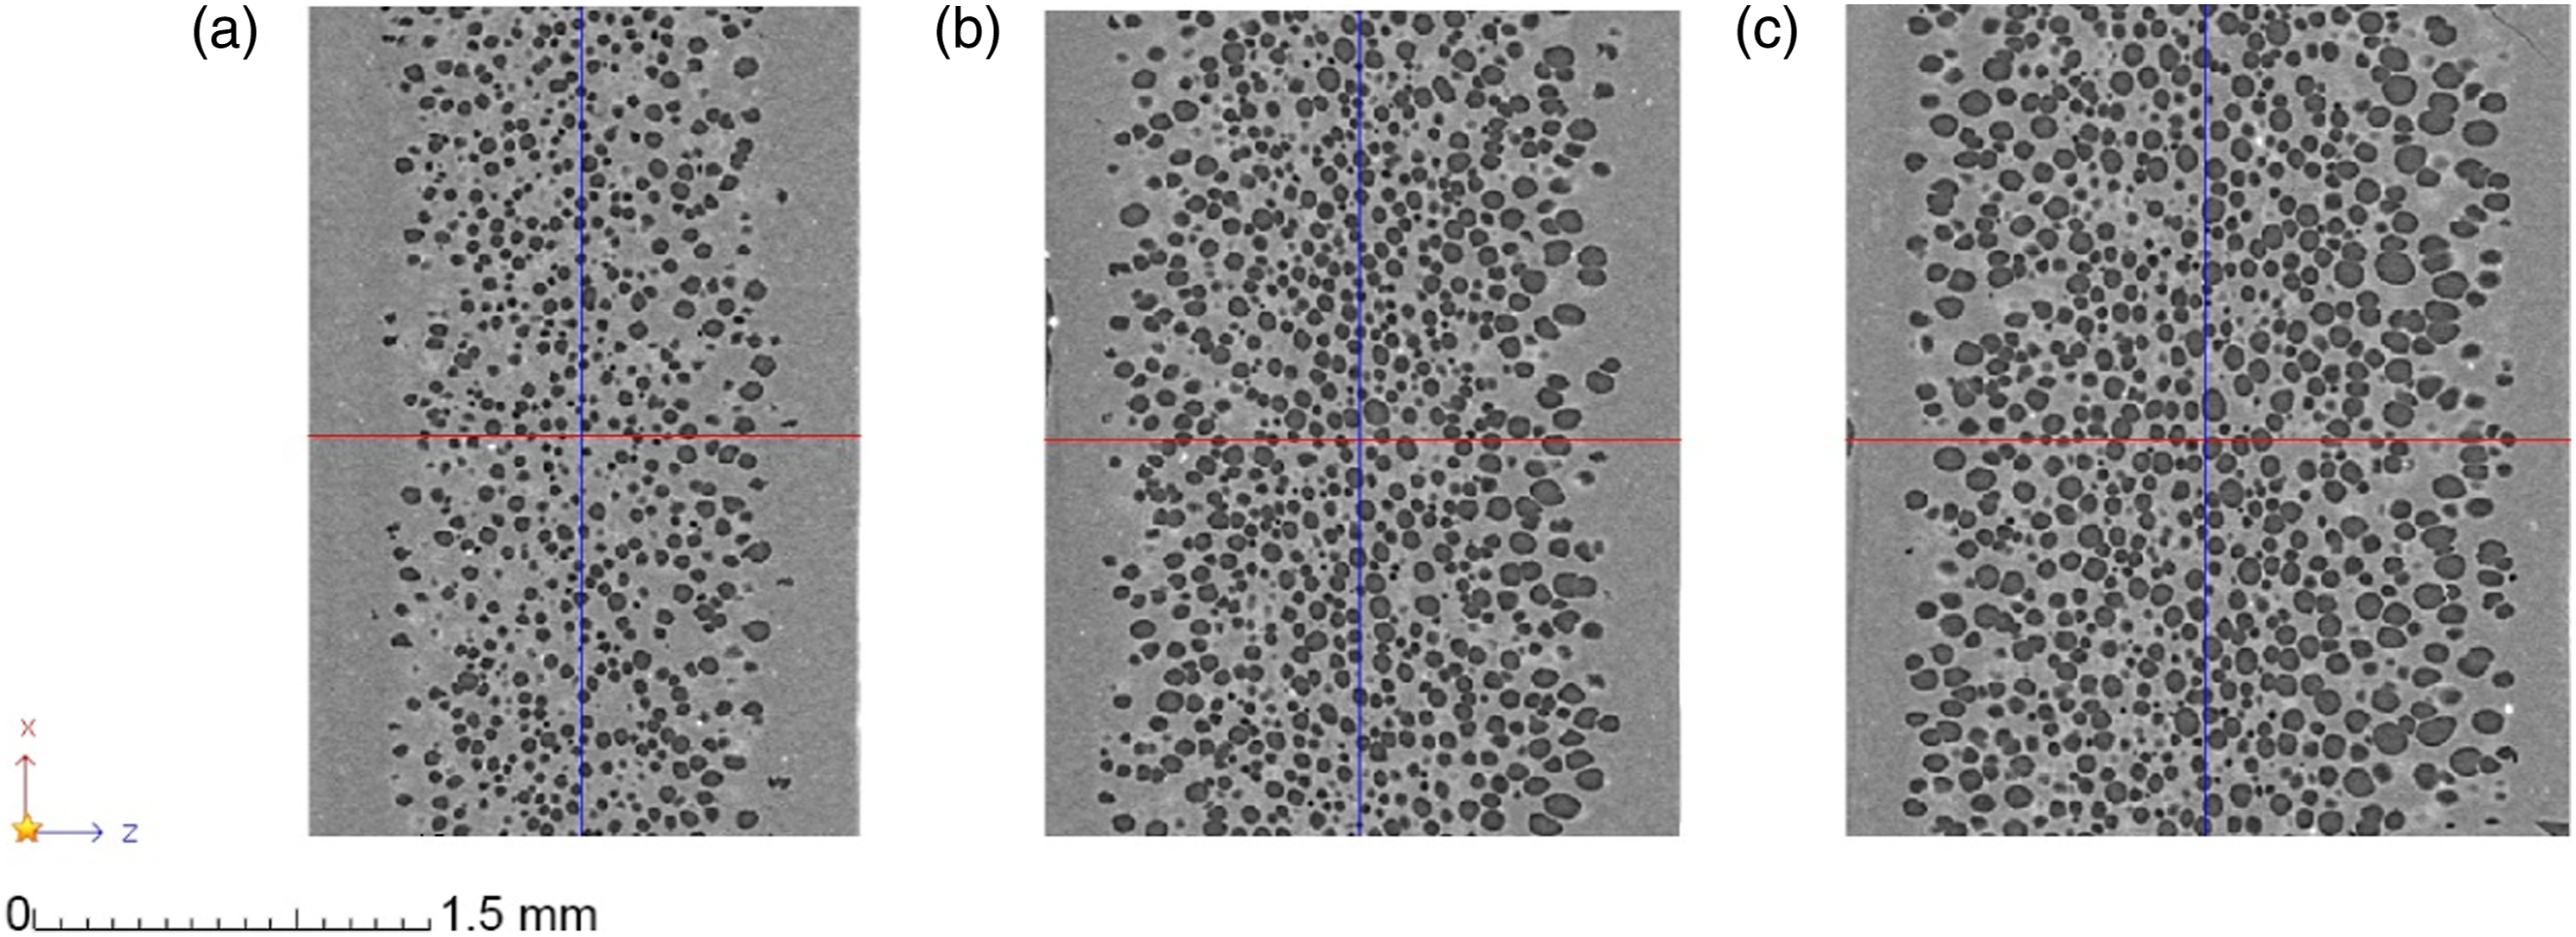
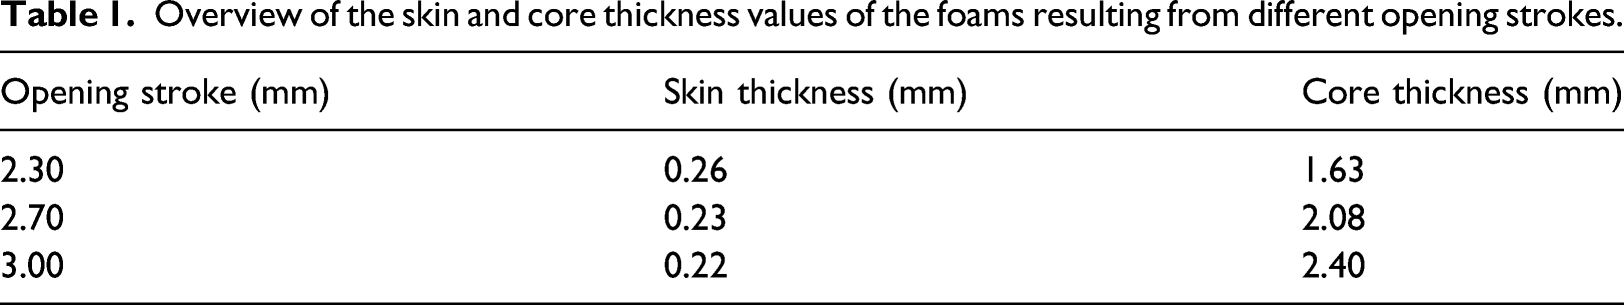
Overview of the skin and core thickness values of the foams resulting from different opening strokes.
In Figure 2, the relationship between foam density and opening stroke is illustrated. It can be seen that there is a non-linear dependence of the foam density on the opening stroke for the investigated foams. The density decreases more steeply between the opening strokes 2.3 mm and 2.7 mm than between the opening strokes 2.7 mm and 3 mm. Illustration of the relationship between foam density and opening stroke.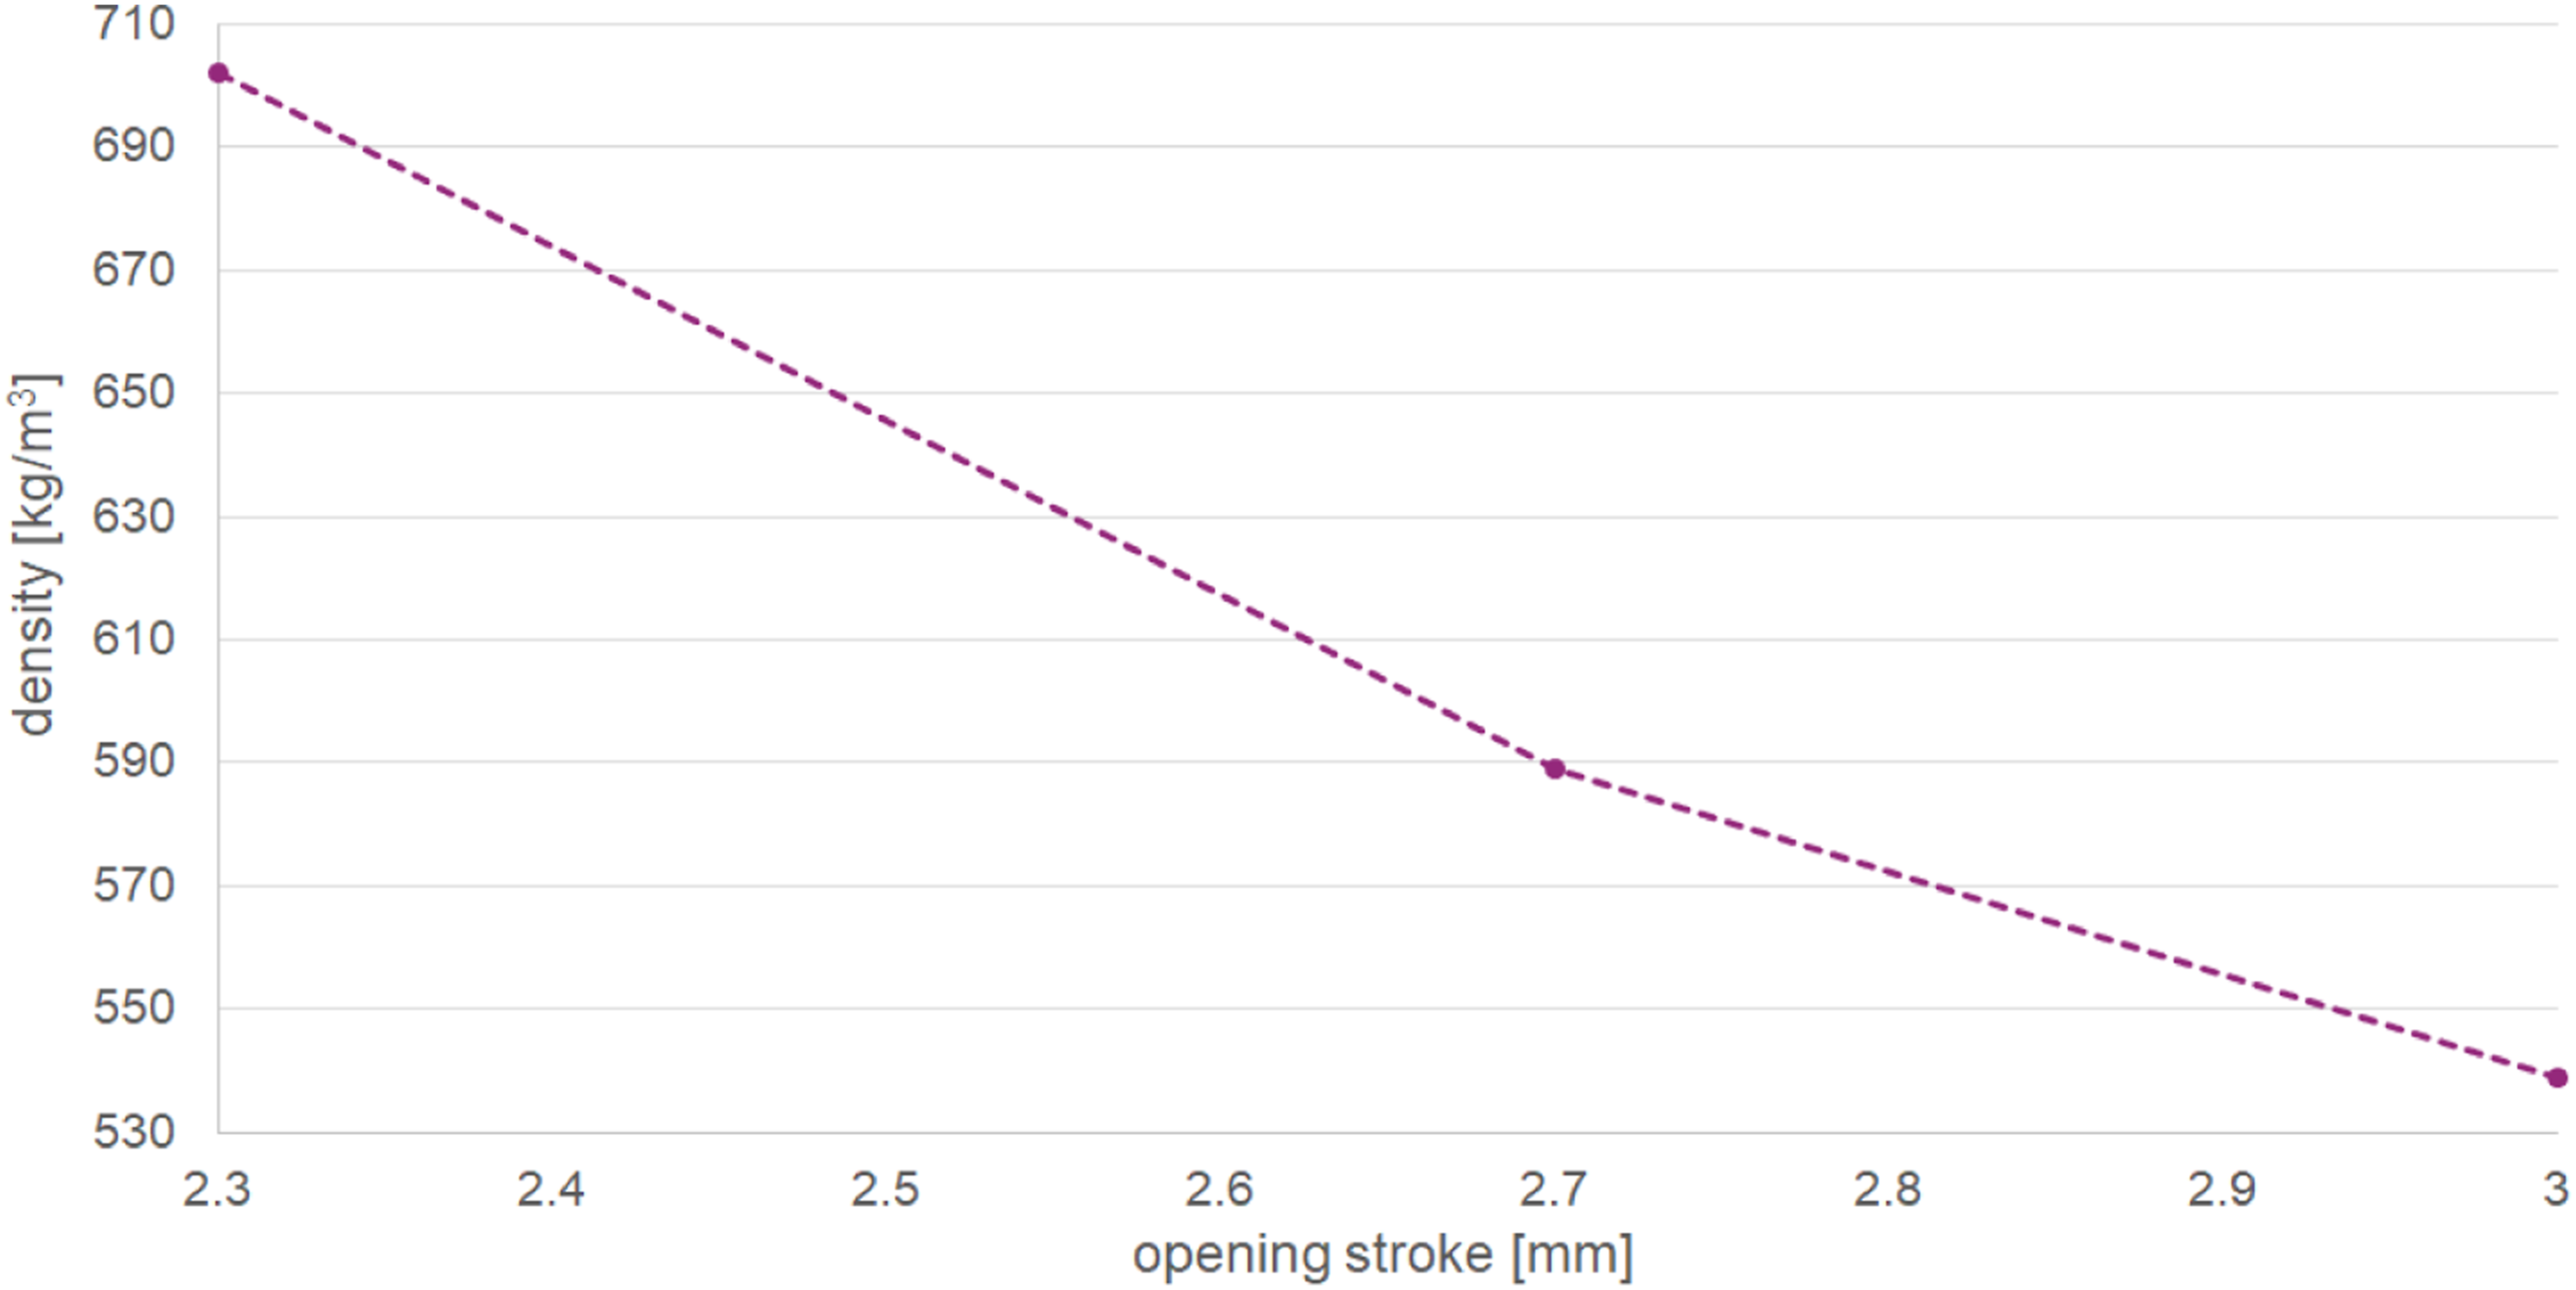
Modelling methodology
In the following section, the model development for high-density foams based on CT data is described. In Figure 3, an overview of the main steps of the methodology is illustrated. Overview of the main steps of the high-density foam model generation.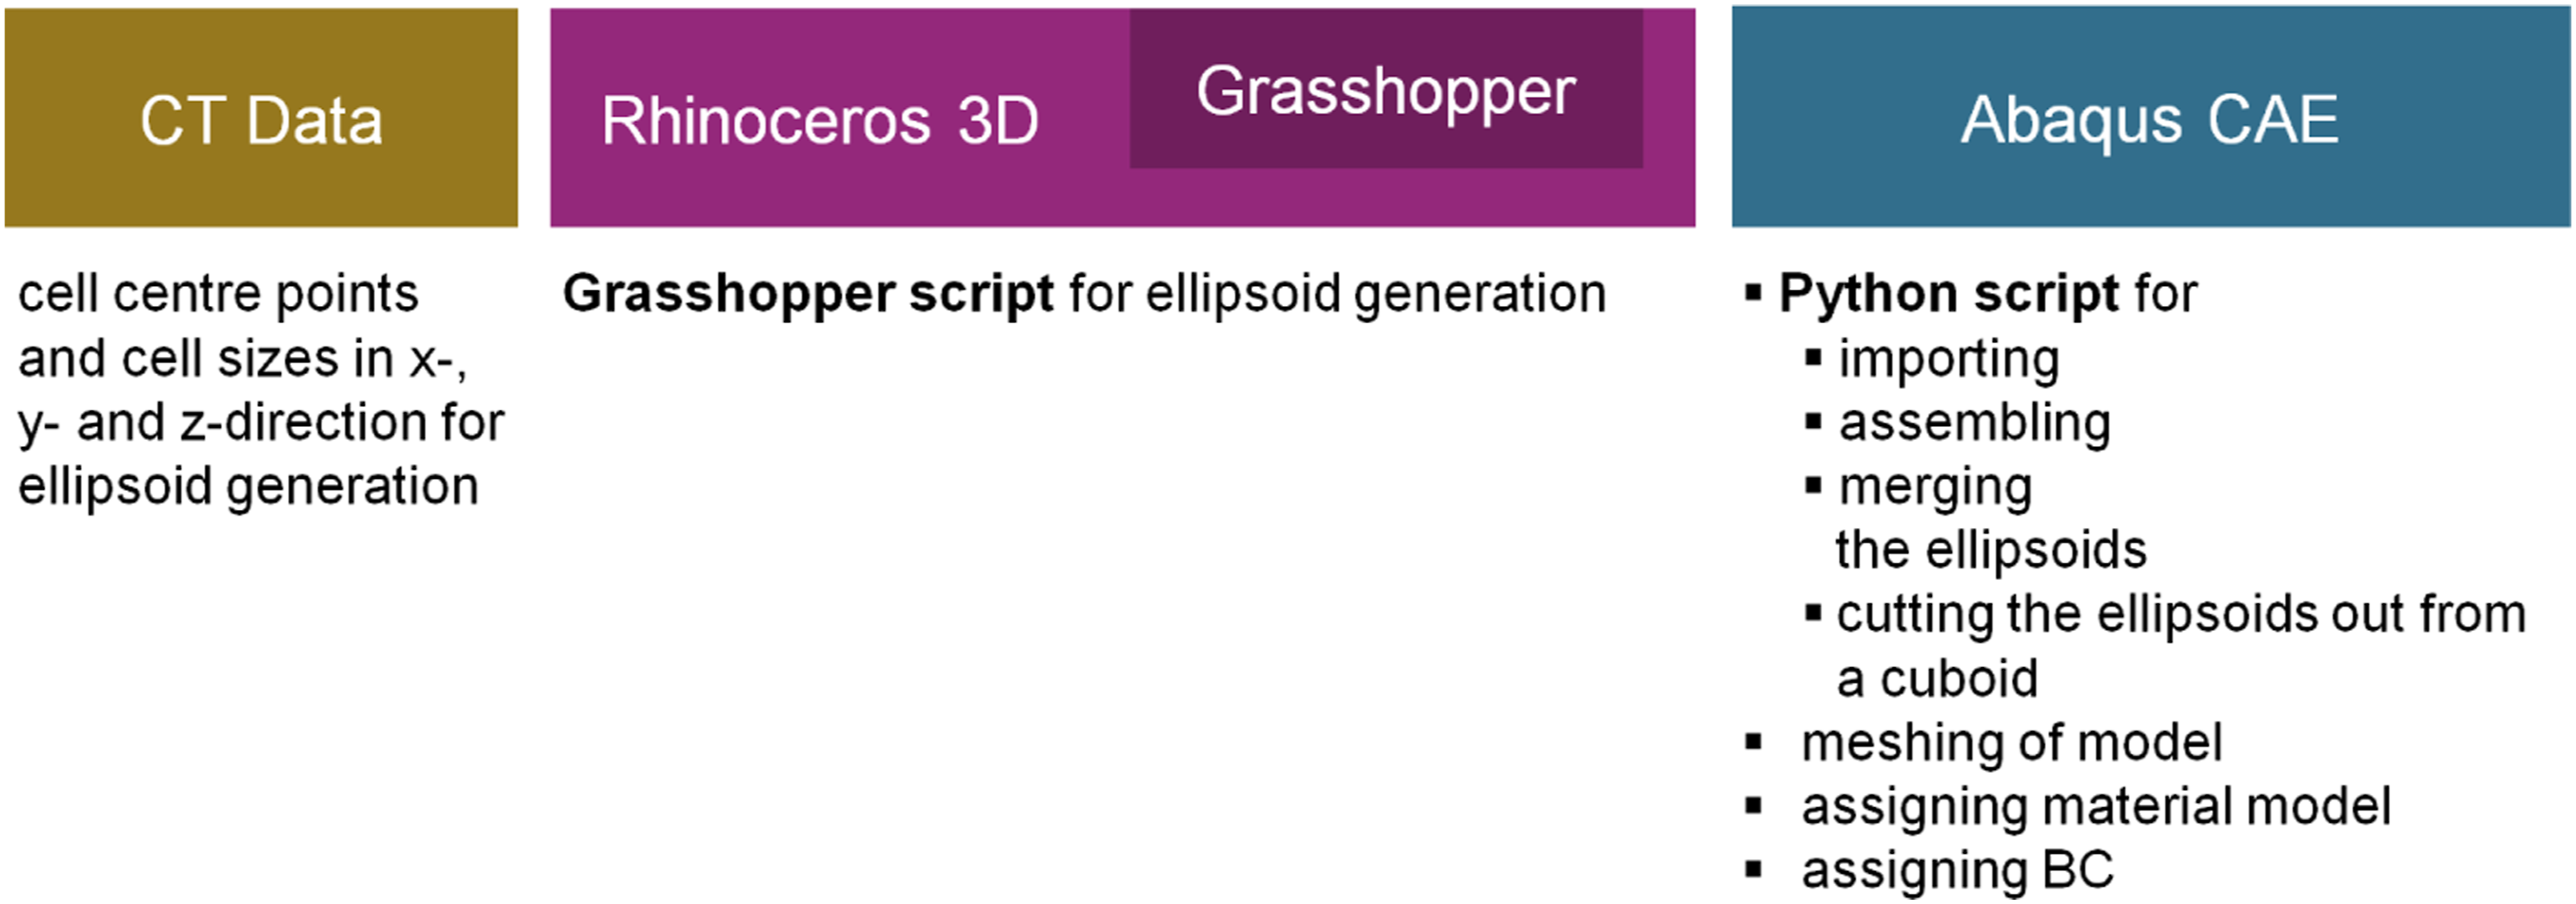
The cell shape is a crucial design variable for foams,
3
and thus the cells are modelled as ellipsoids, which sizes and positions are defined using CT data. They are specified through the centre point and the sizes in x-, y- and z-direction obtained from CT measurements (Figure 4). Definition of an ellipsoid by the centre point and the sizes in x-, y- and z-direction.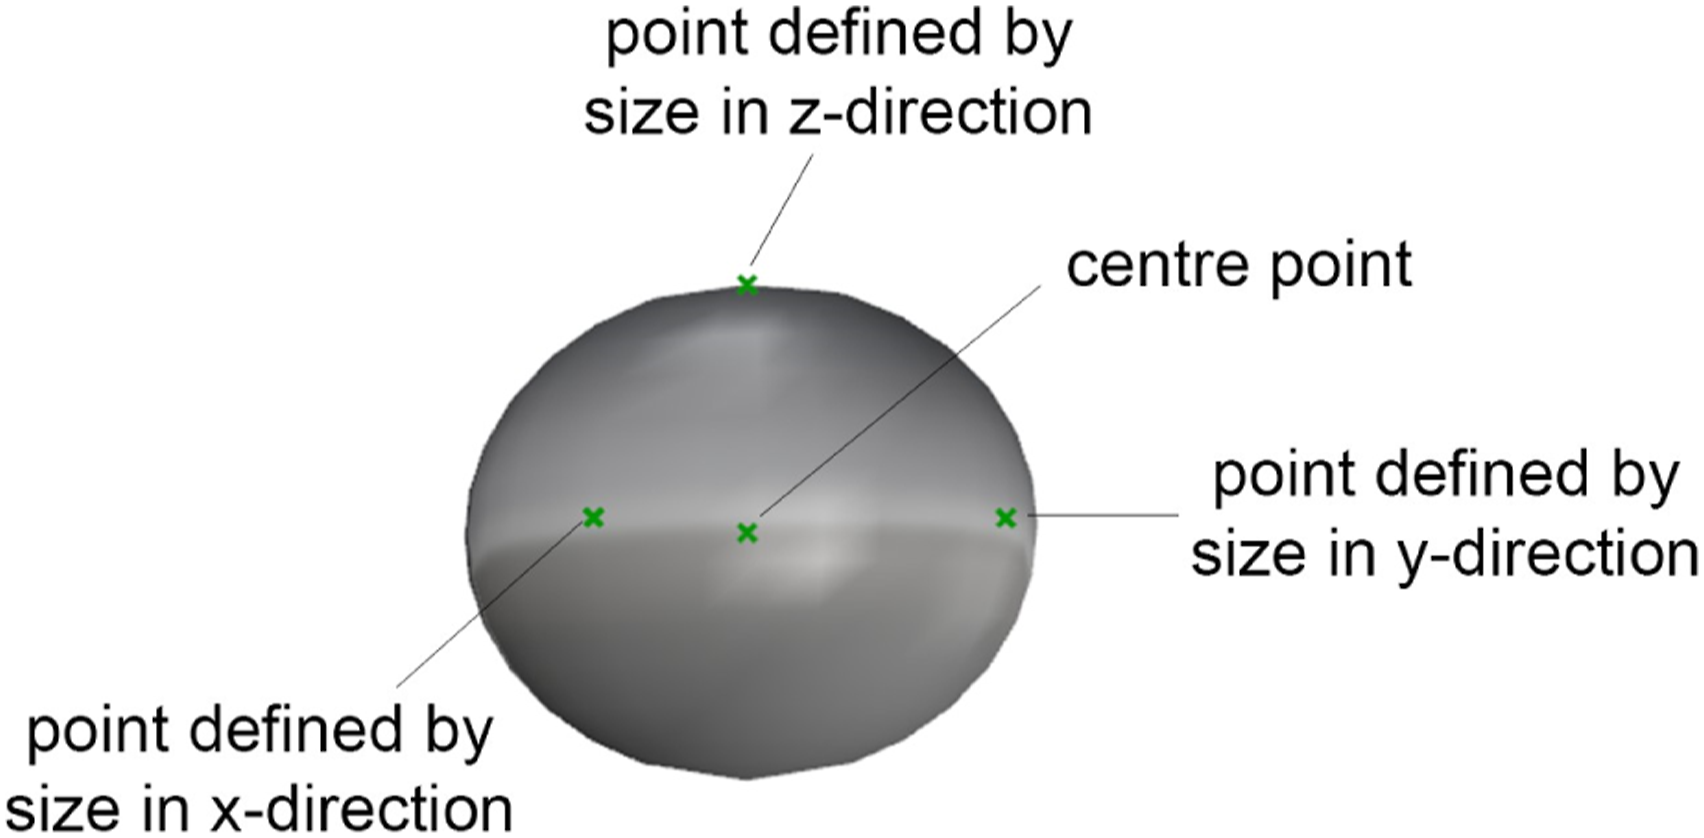
These parameters are determined in the same way as described in Kastner et al. (2011). 29 For the separation of the air and polymer phase, a global threshold method is utilized. A threshold is chosen in this way that the air to polymer ratio equals the measured material density. The cells are segmented by a watershed approach, so that each cell is transferred into a separated object.
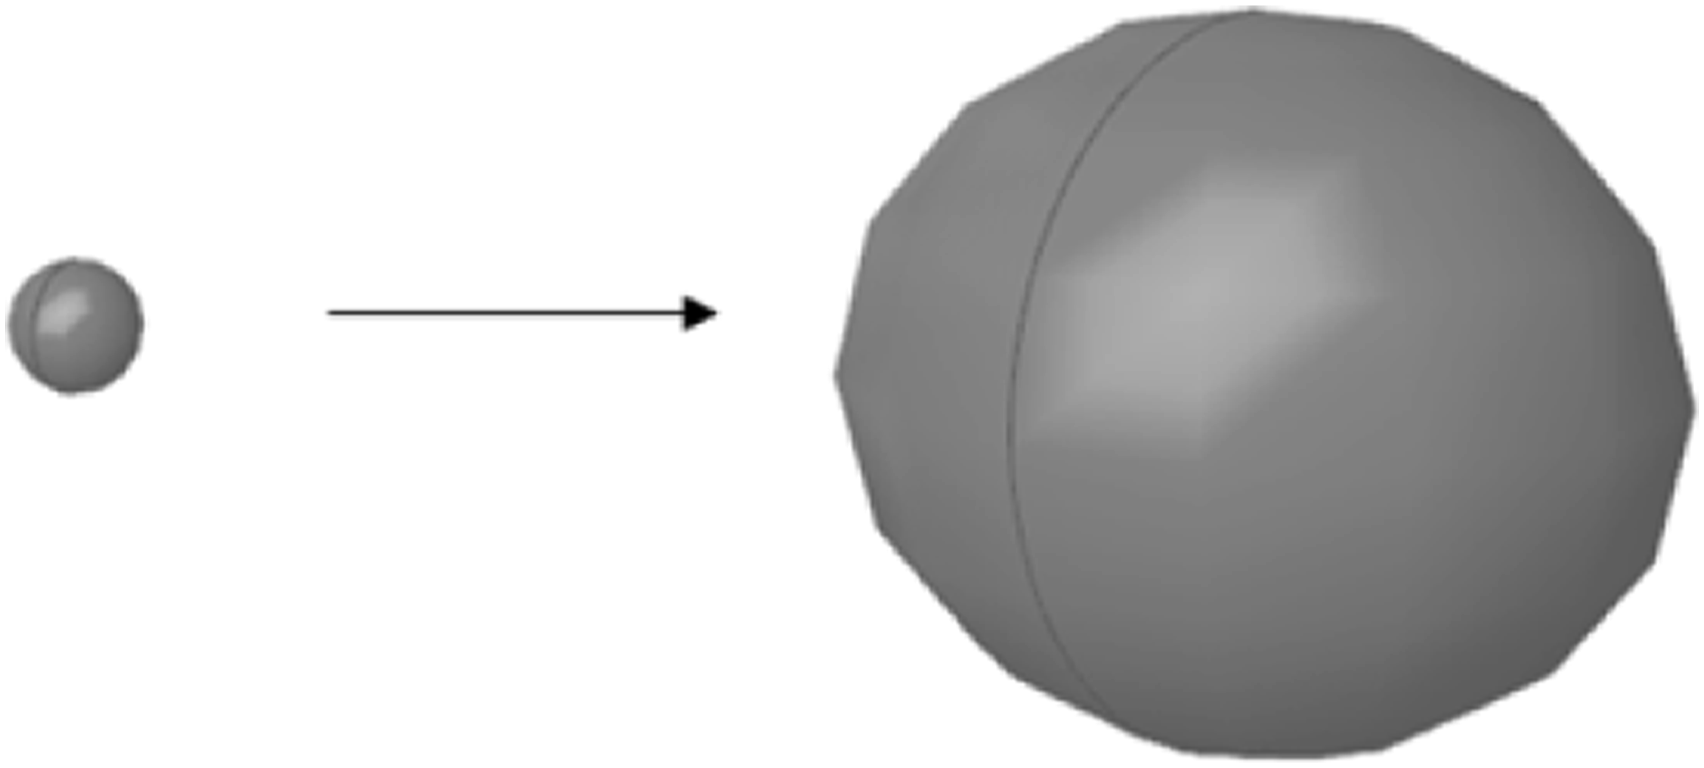
For the generation of the ellipsoids, the software Rhinoceros 3D (Robert McNeel & Associates) and its plug-in Grasshopper are used. The procedure is depicted in Figure 5. Points are generated based on the xyz coordinates of the centre points gained from the CT scans. Spheres with uniform diameter are placed on these points. Then, the spheres are non-uniformly scaled to obtain the ellipsoids (Figure 6). The scaling values in x-, y- and z-direction are defined by the cell sizes which are determined from the CT scans. Illustration of the generation of ellipsoidal shaped foam cells for high-density foams in Grasshopper. Scaling of one selected sphere in x-, y- and z-direction to obtain an ellipsoid.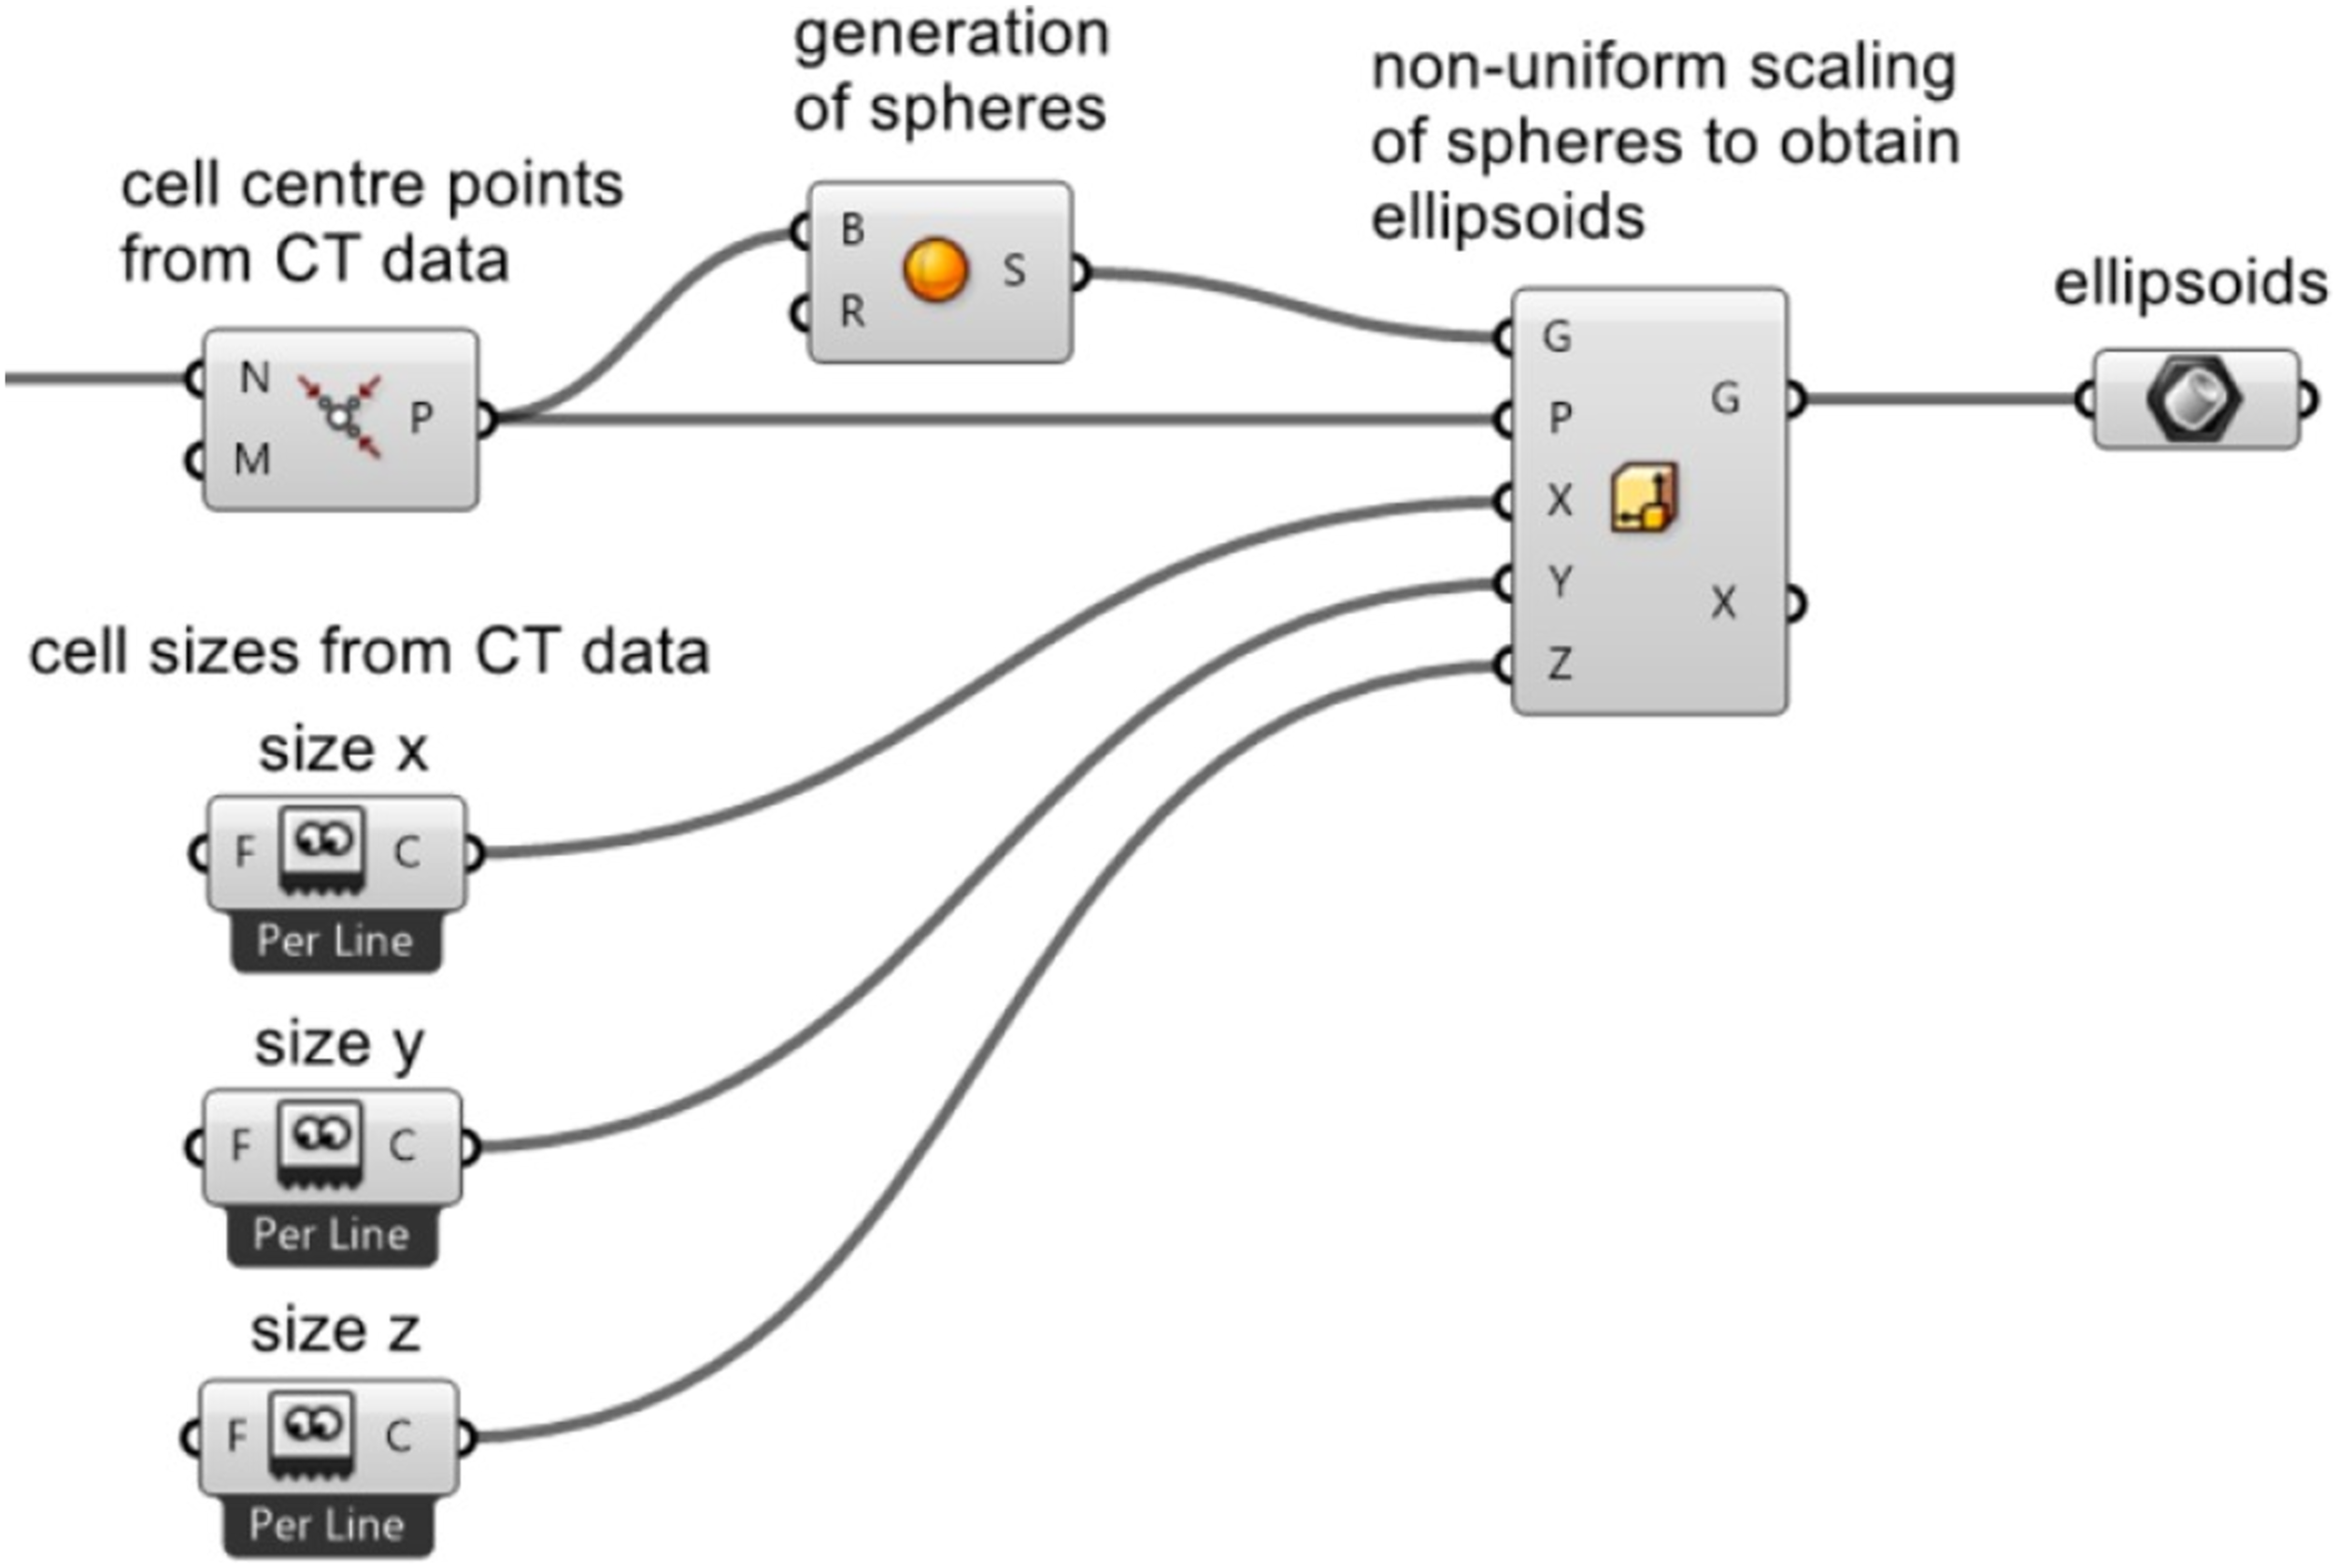
Beside the ellipsoidal cell shape also the observed skin-core-skin microstructure is included in the model. In the finite element software Abaqus (Dassault Systèmes), the created ellipsoids are merged and cut out from a cuboid which dimensions are defined from the CT scans (Figure 7). Methodology of generating the microstructural foam model.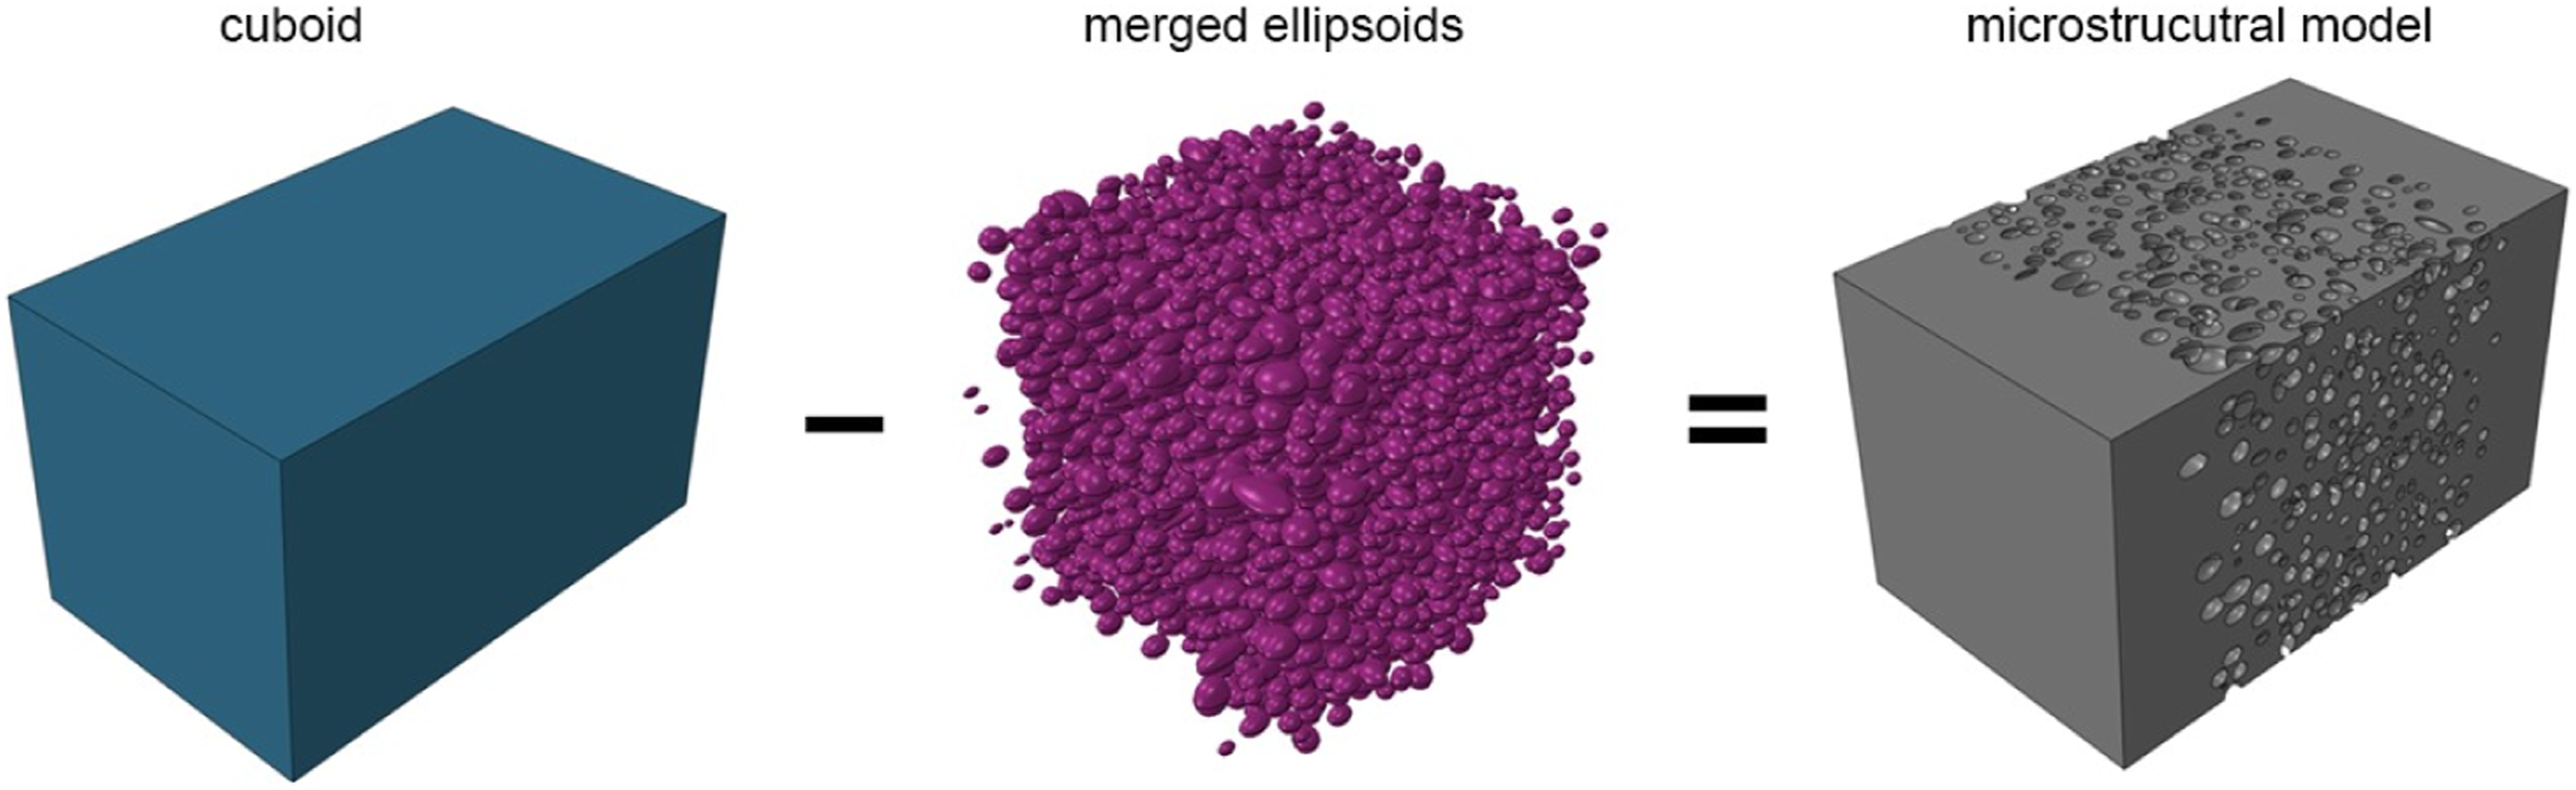
This results in a microstructural model of the high-density foam where also the skin-core-skin structure through the thickness (z-direction) as it is observed in the CT scans (Figure 1) is considered. The obtained models are meshed, a material model and the boundary conditions (BC) for the specific loading conditions are assigned. The detailed simulation methodologies and simulation results for specific loading conditions are described and discussed in the next sections. All simulations were performed on a computer with eight cores and 3.8 GHz. The microstructural simulations took several hours, whereas the constitutive models only several minutes.
Compressive test simulation
Simulation methodology – microstructural model
With the described procedure simulation models with three different densities are created (opening stroke 2.3 mm, 2.7 mm and 3 mm). The experimental compressive test specimens have the dimension l x b x h, where l and b are constant with 10 mm and h is the thickness which results from the opening stroke (e.g. for the foam resulting from opening stroke of 2.3 mm the thickness is 2.15 mm due to shrinkage). The thickness h of the specimen is much lower compared to the other dimensions. The ratio l/h and b/h, respectively, is larger than 1. The thickness of the computational models generated from CT data and used for the simulations is equal to the thickness of the experimental specimens but the other dimensions (l and b, l = b) are much smaller. Thus, the ratio l/h and b/h, respectively, is smaller than 1. It is important that the ratio of the dimensions of the specimens used in the simulation and in the experiment are similar, otherwise effects can occur in the simulation which are not present in the experiment (e.g. buckling effects due to the slender simulation specimen) and vice versa. The increase of the dimensions l and b would increase the computational effort. Therefore, the core layer is partitioned into three layers so that the ratio l/h and b/h is larger than 1.
In Figure 8, the microstructural models for the foams resulting from opening stroke 2.3 mm, 2.7 mm and 3 mm with the partitioned core layers are illustrated. Additionally, the density distributions through the thickness of the three foams are shown. It can be seen that core layer 2 has the lowest density. Core layers 1 and 3 have similar densities whereby for the foam resulting from opening stroke 3 mm core layer 3 has a slightly higher density than core layer 1. Furthermore, it can be observed that the higher the opening stroke, the lower the densities of the core layers. Illustration of the microstructural models for the foams resulting from opening stroke 2.3 mm, 2.7 mm and 3 mm with the partitioned core layers and the density distributions through the thickness.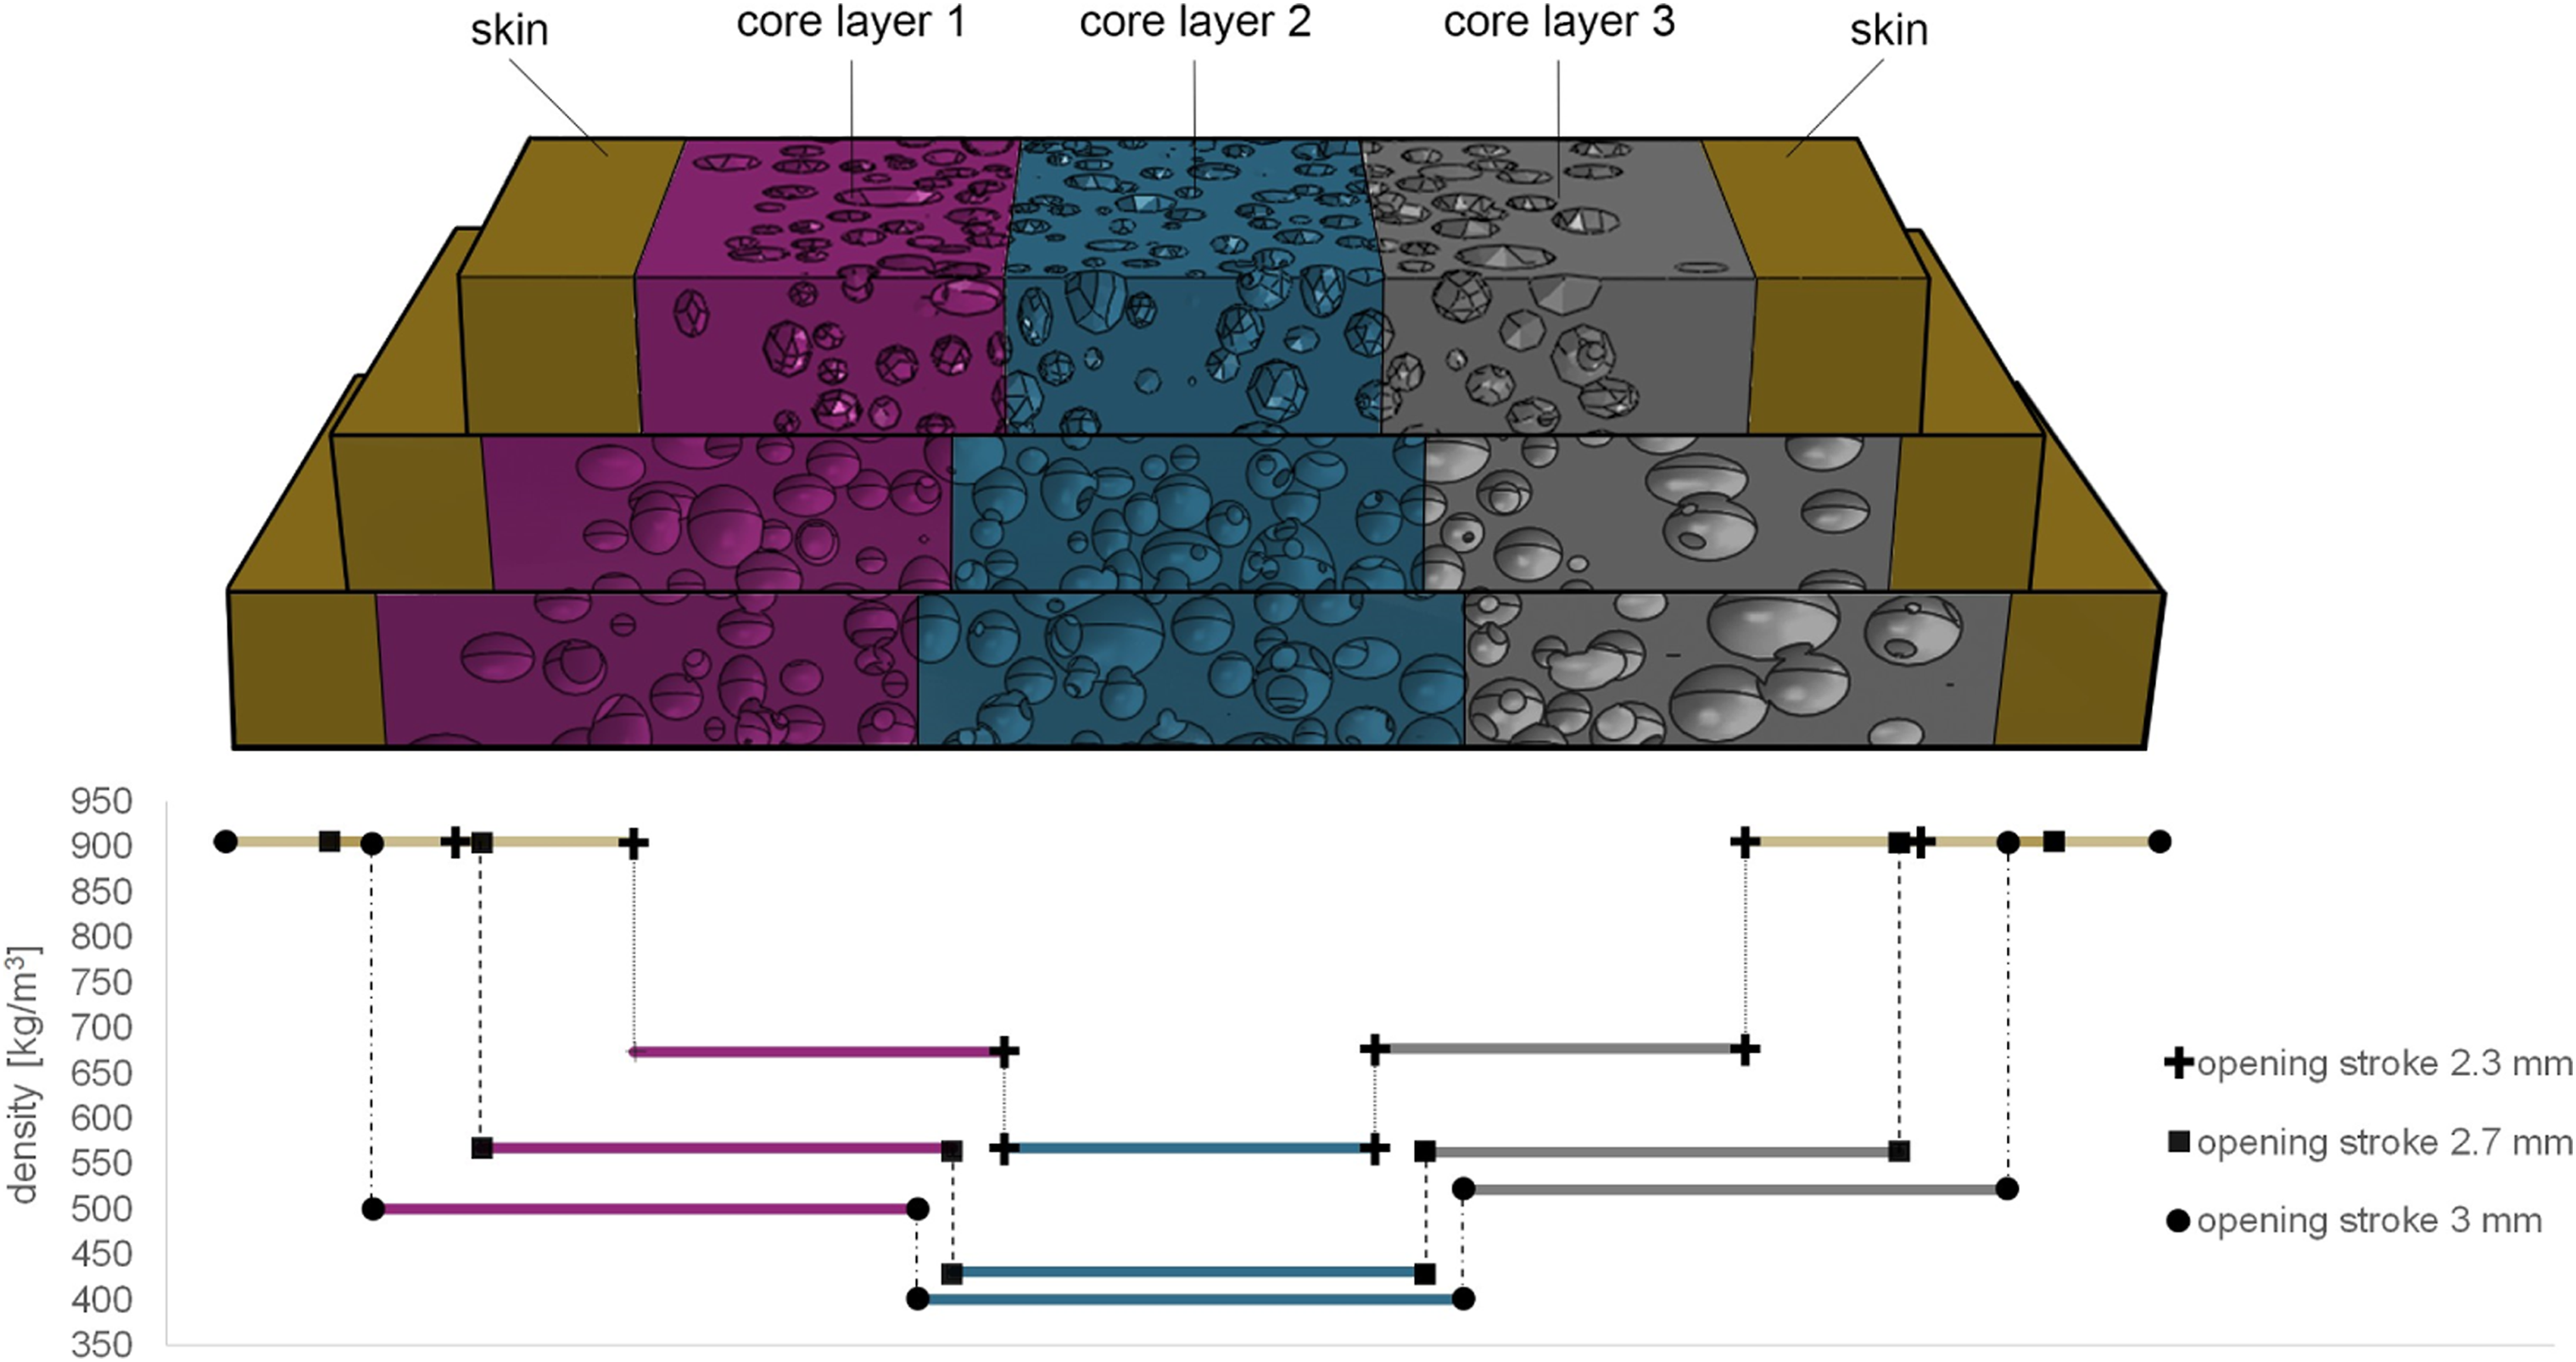
For each core layer, a compressive test simulation is performed. An elastic plastic material model (implemented in Abaqus) obtained from compressive tests of the bulk material (ISO 604:2002, true stress – true strain values) is used as input for the simulations (Figure 9). Therefore, the compression/tension asymmetry of the bulk material30,31 is considered. Illustration of the elastic plastic material model used for the compressive test simulations.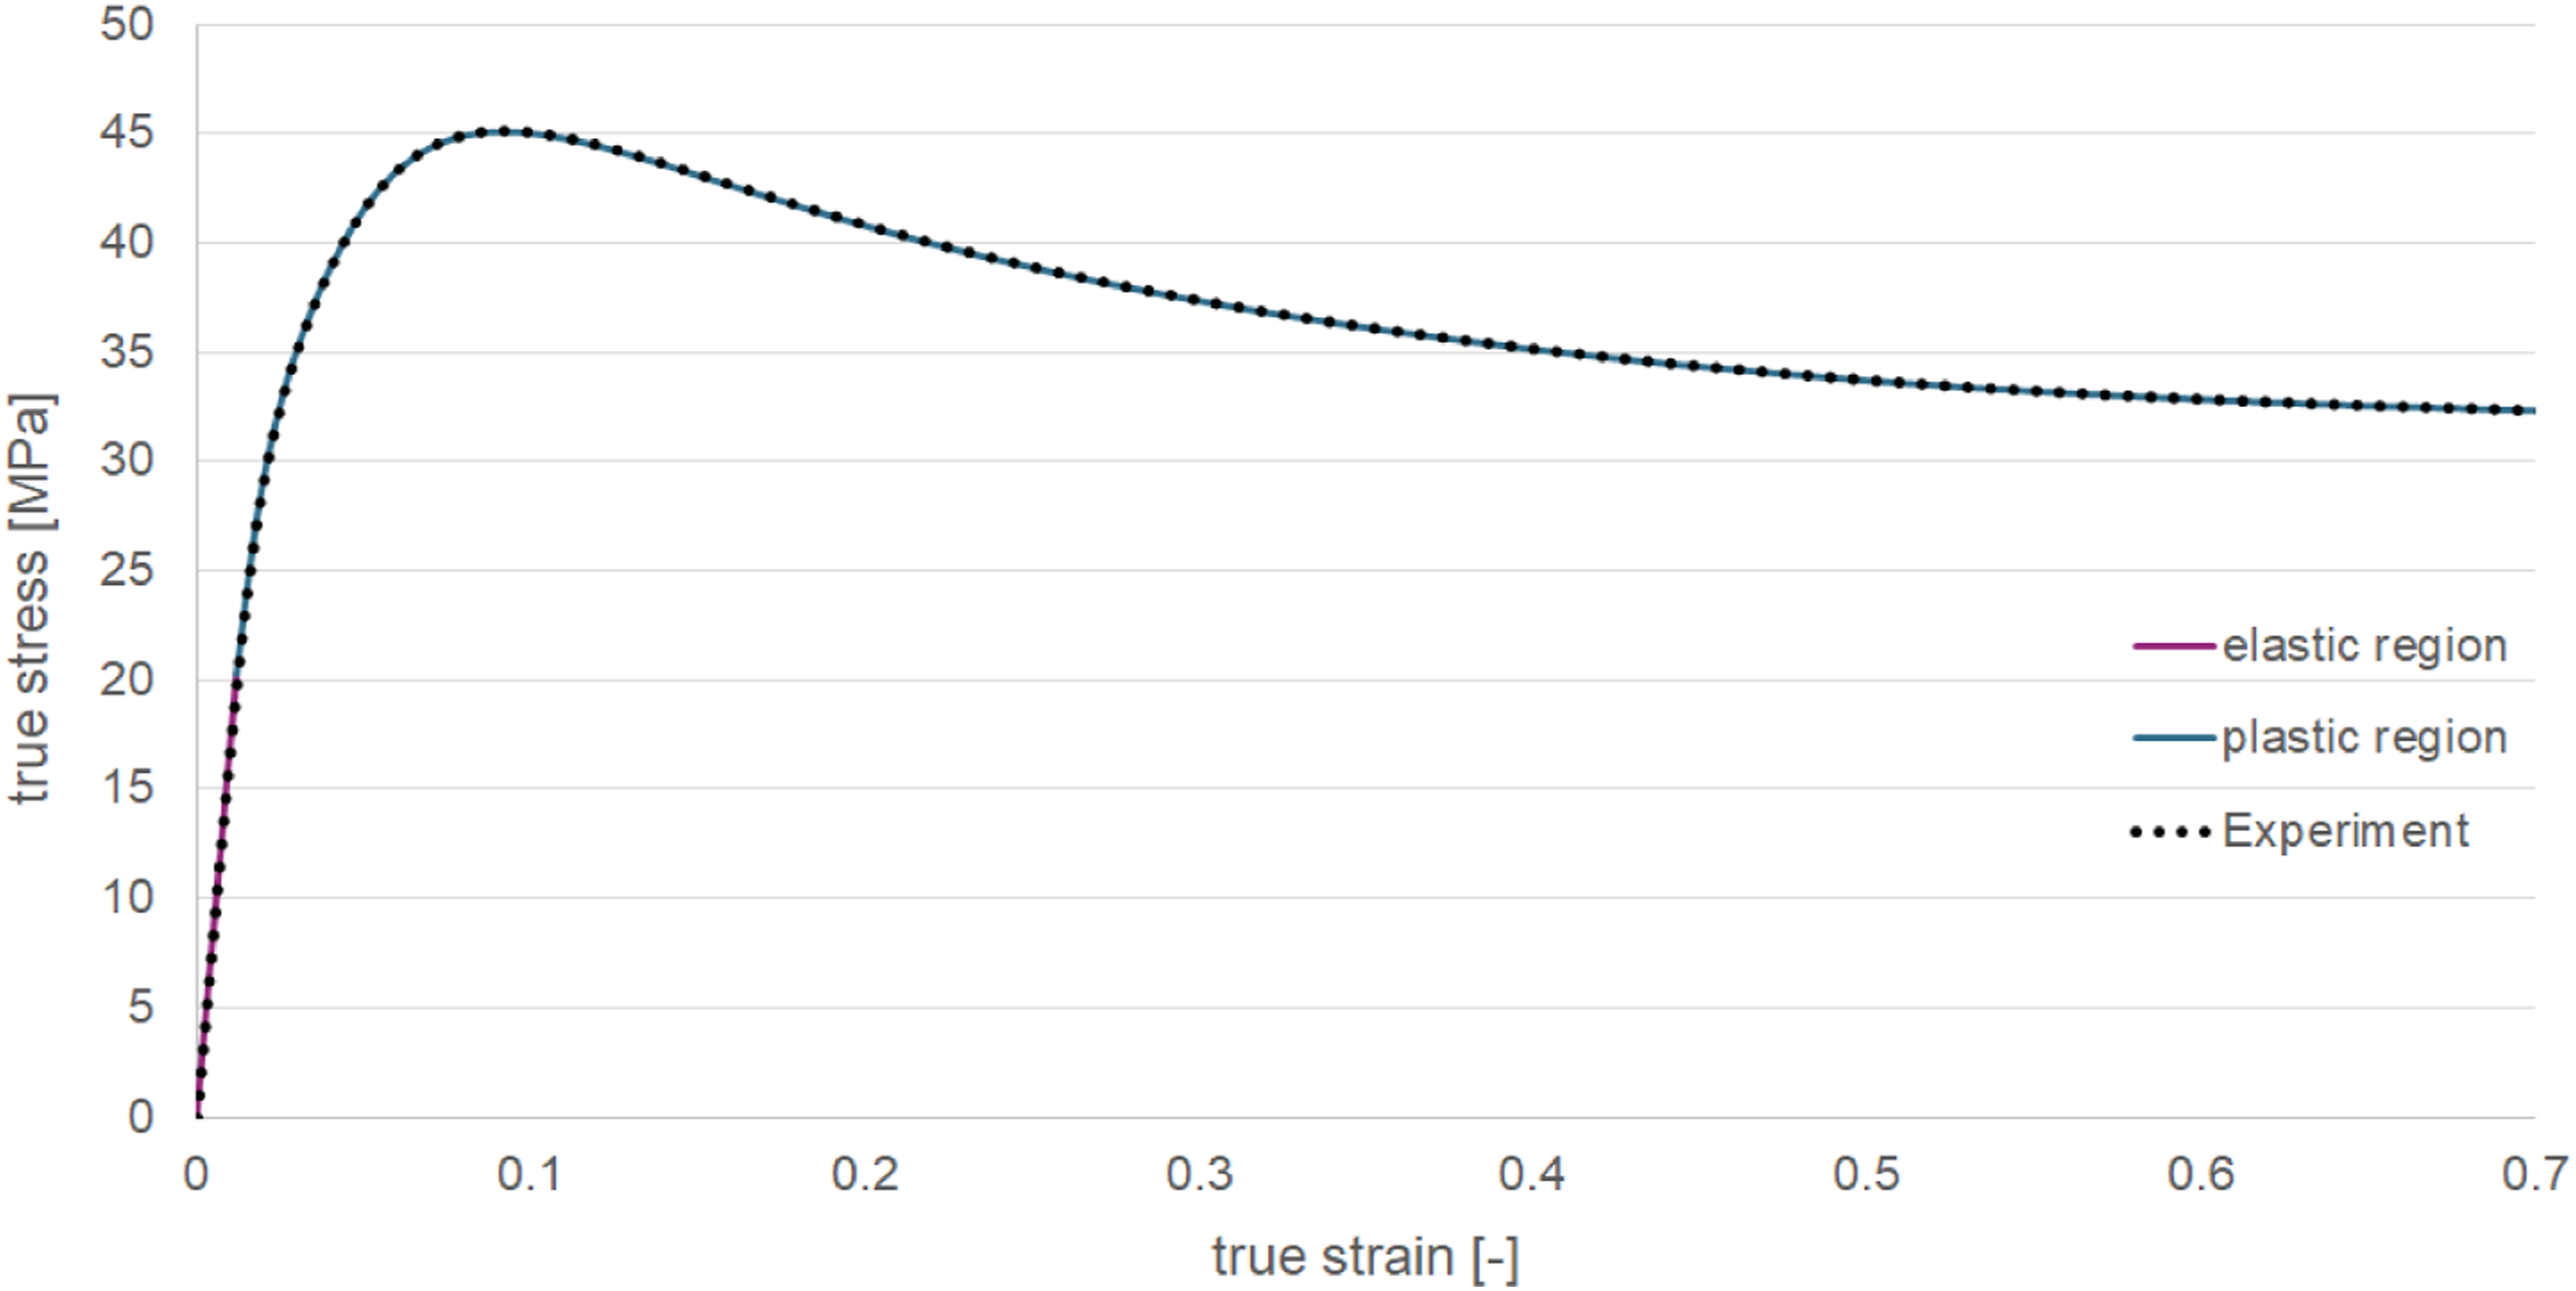
The Poisson’s ratio is assumed to be 0.4 and the Young’s modulus is determined between 0.0005 and 0.0025 strain. The yield stress, defined as the transition point from linear to non-linear behaviour, is chosen in a way, that the experiment is represented by the material model with the lowest deviation.
The simulation set up for the compressive test is depicted in Figure 10. Illustration of the simulation set up for the compressive test simulations of the core layers.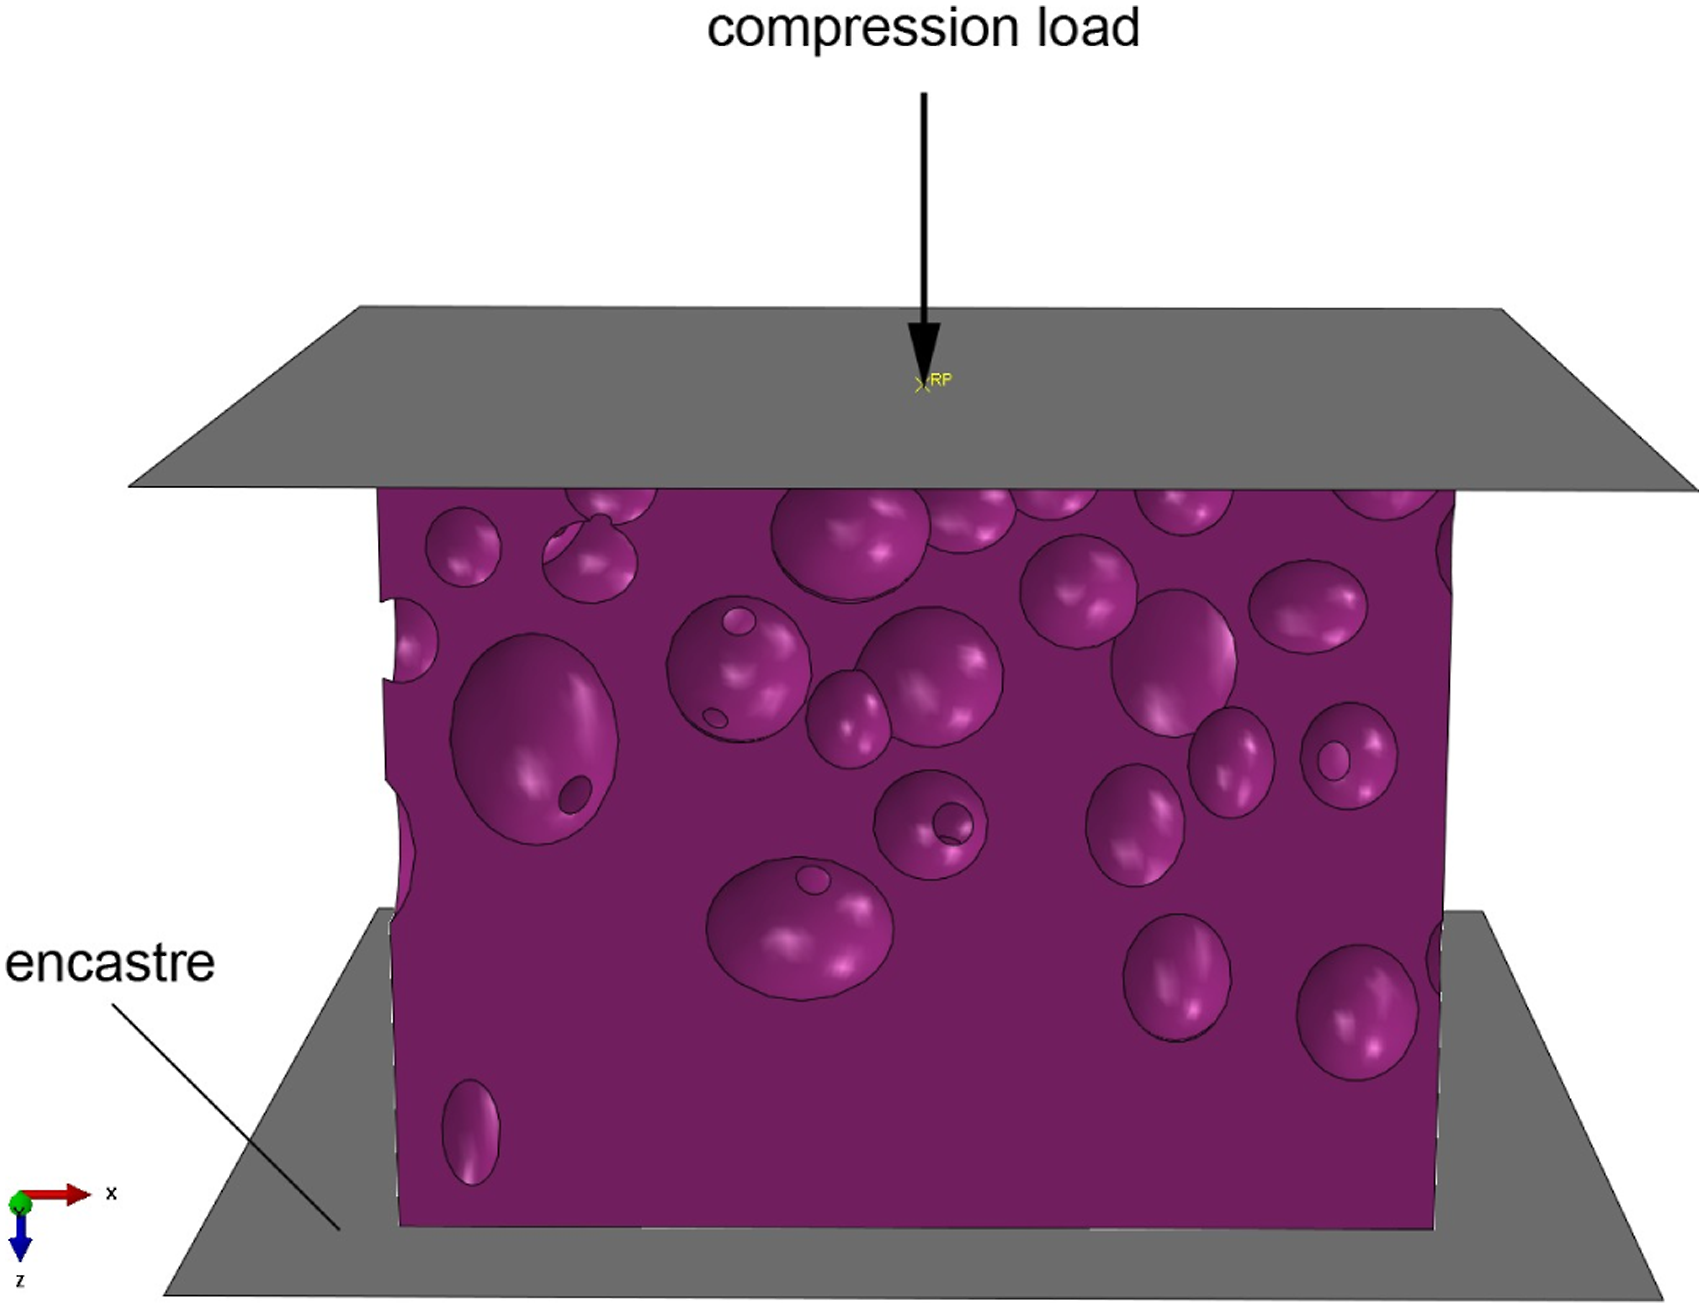
The upper plate transfers the load to the foam and the bottom plate functions as support (all degrees of freedom are locked). A general contact definition, which is implemented in Abaqus, is applied to model the contact between the plates and the specimen. 32 The model is meshed with quadratic tetrahedral elements (element type in Abaqus: C3D10M). The minimum and maximum mesh sizes are chosen in such a way, that even the smallest foam cell could be modelled accurately but that the number of elements is as small as possible. For example, for layer 1 of the foam resulting from opening stroke 3 mm the number of elements is 439 346, where the smallest edge length is 0.017 mm and the largest 0.061 mm. In some regions, the mesh is modified manually so that the elements are not distorted.
Results and discussion – microstructural model
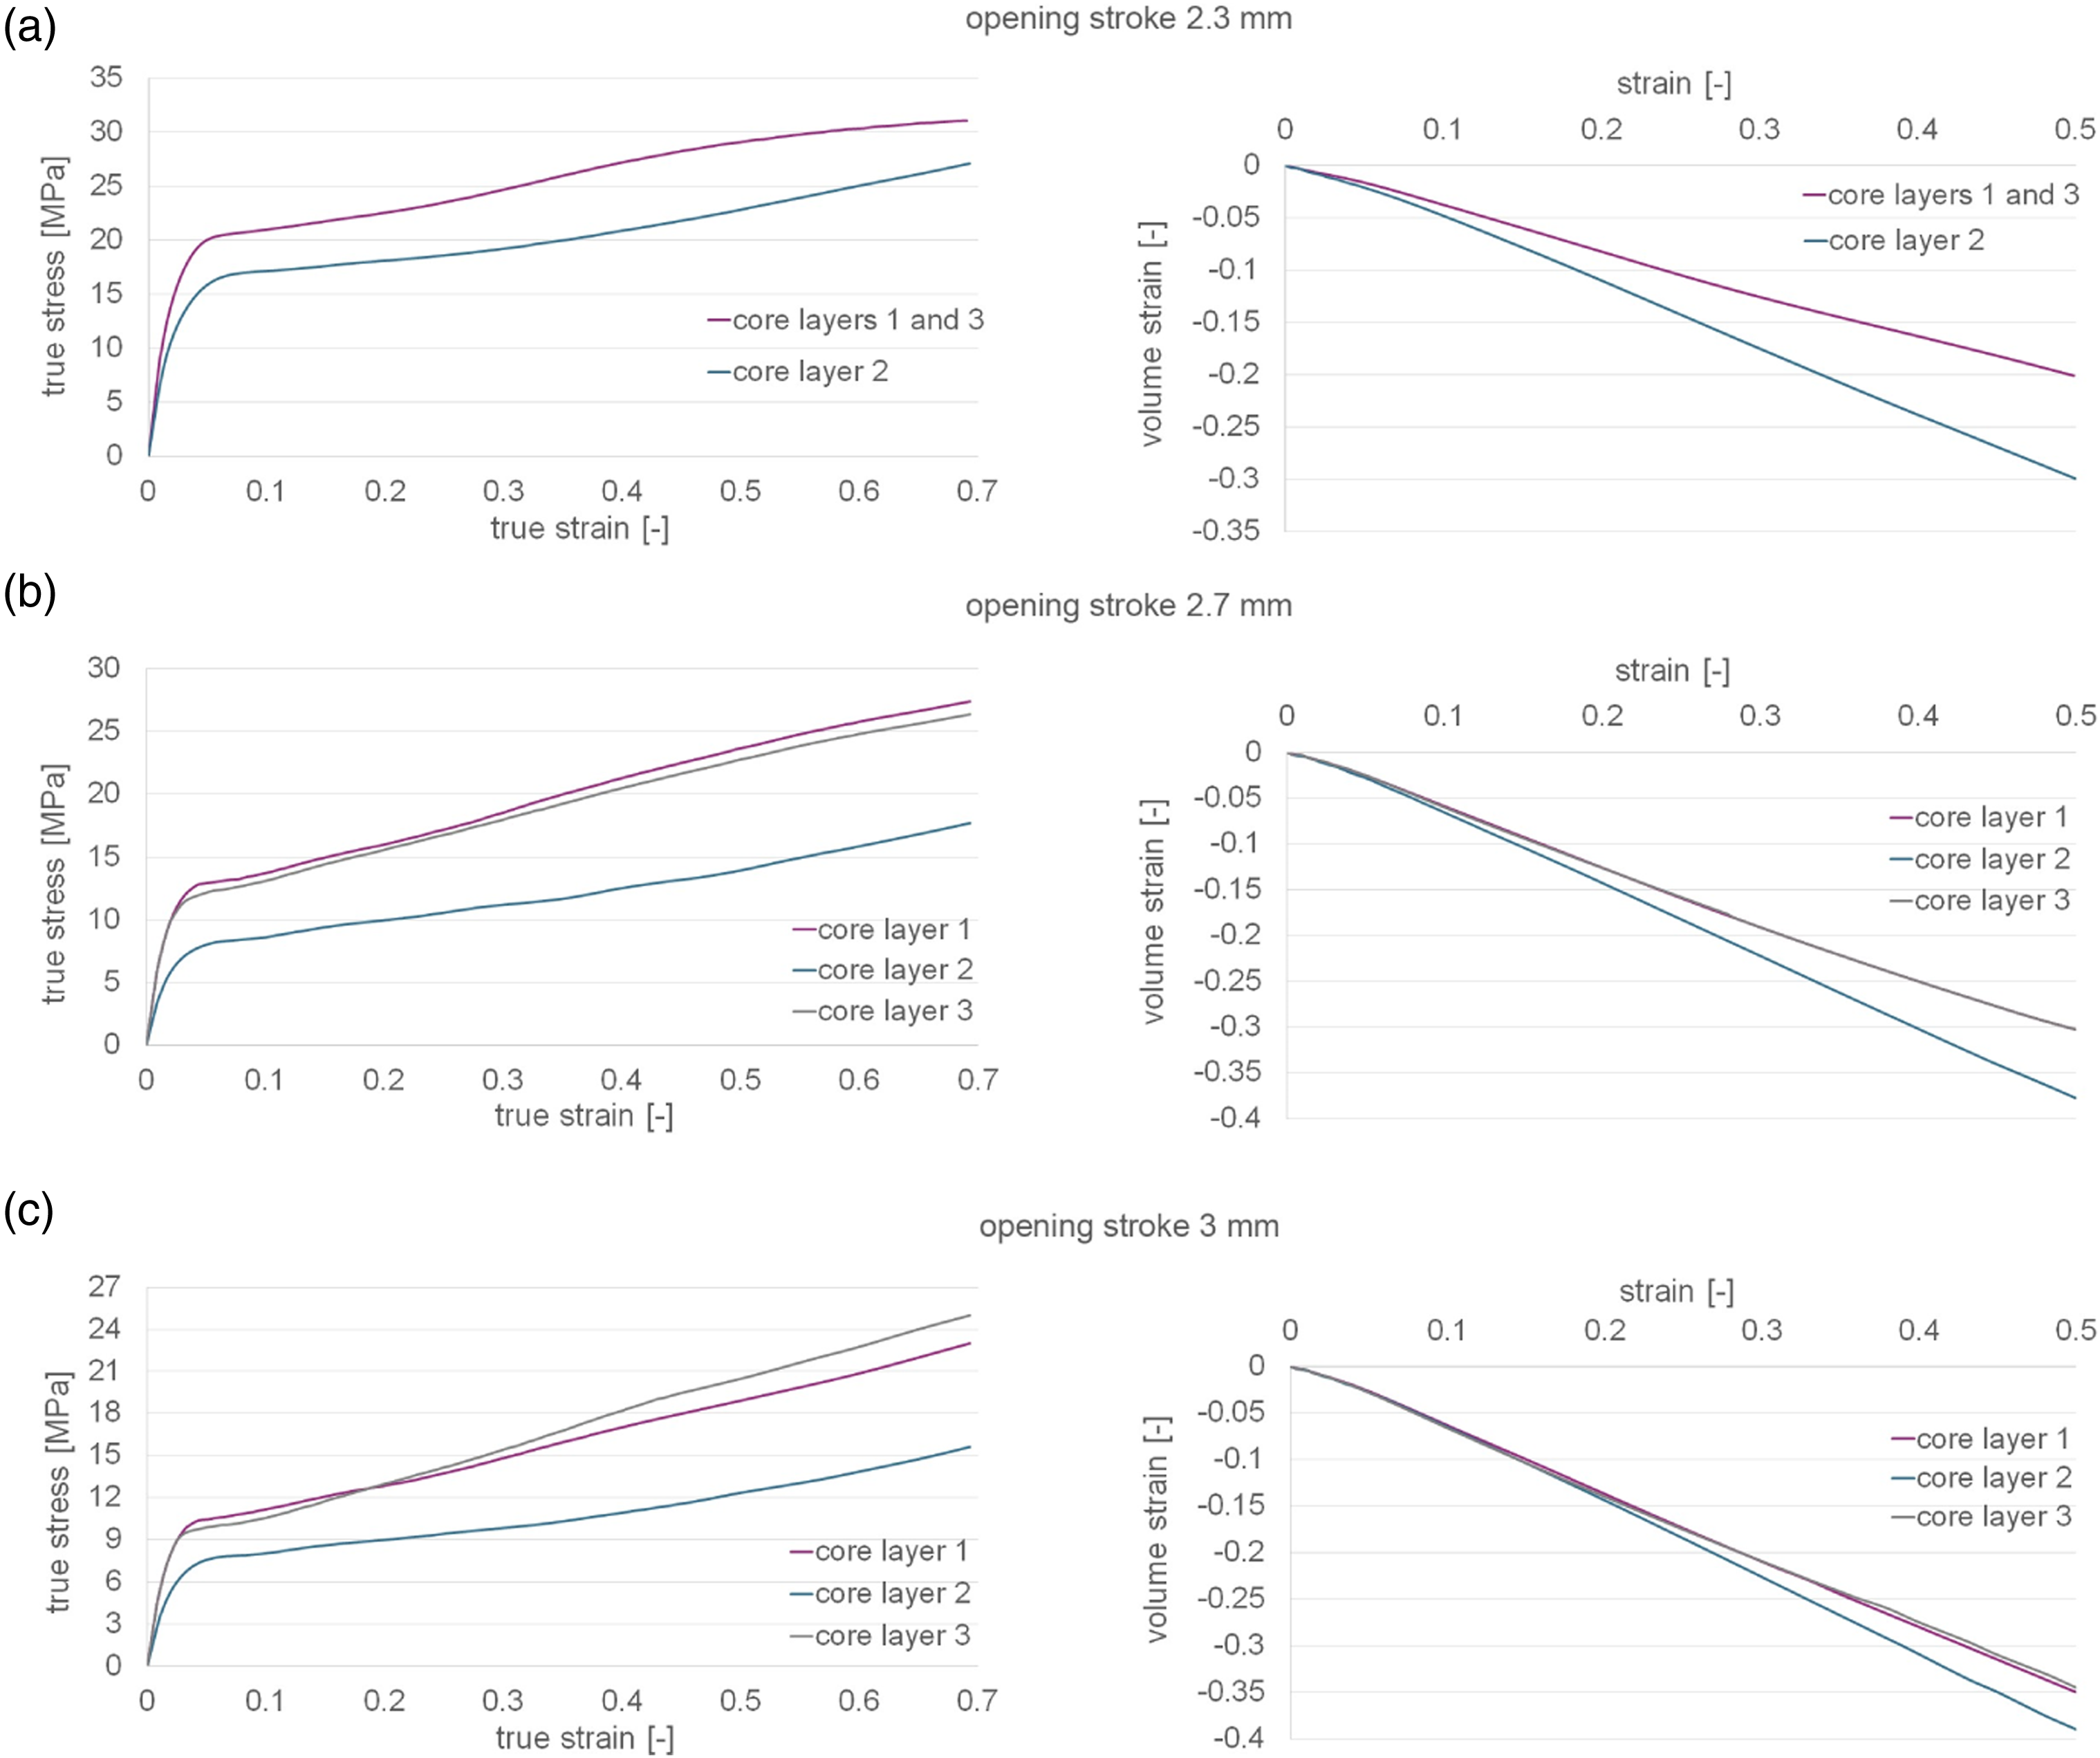
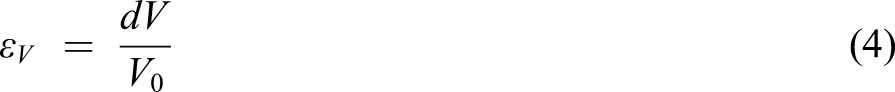
The compressive test simulation results of the core layers of the foams resulting from opening stroke 2.3 mm, 2.7 mm and 3 mm are shown in Figure 11. On the left, the true stress – true strain curves are illustrated and on the right the volume strain is depicted. The true stress (equation (1)), true strain (equation (3)) and volume strain values (equation (4)) are defined as follows Compression test simulation results of the core layers of the foams resulting from opening stroke (a) 2.3 mm, (b) 2.7 mm and (c) 3 mm; left: true stress – true strain curve, right: volume strain.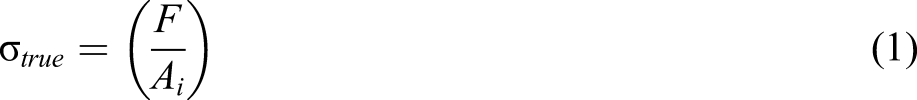

x
i
and y
i
are the actual dimensions of the specimen at a specific deformation. x0 and y0 are the initial dimensions of the specimen prior to the deformation. dx
i
and dy
i
are the average displacements of all nodes on the outer surface of the corresponding direction at a specific deformation which are evaluated from the simulation results (‘+’ for compression load which results in a bigger cross-section and ‘−‘ for tension load which results in a smaller cross-section during deformation).

The results for the core layers 1 and 3 are similar for all three foams. This is already expected because these layers have similar densities (Figure 8). Due to the lower density of core layer 2, the stress values are lower compared to the other two layers and the foam can compress more which results in a higher volume strain. The difference between the volume strains of core layer 1 (≙core layer 3) and core layer 2 decreases with increasing opening stroke. This is due to the decrease of the densities of core layer 1 and core layer 3 for higher opening strokes which causes higher compressibility of these layers and therefore higher volume strains. It can be stated that the volume strain highly depends on the foam density.
Simulation methodology – constitutive model
To investigate the compression behaviour of the entire foam (skin-core-skin), constitutive material models (elastic plastic) are created from the true stress – true strain results of the core layers. These material models function as input for a compressive test simulation, where the real specimen dimensions (10 mm x 10 mm x h) are used. The specimen is partitioned into two skin layers and three core layers (Figure 12) and meshed with linear hexahedral elements (element type in Abaqus: C3D8R). The mesh size is chosen so small that there are four elements per thickness and layer. The boundary conditions and contact definitions are the same as for the compressive test simulations of the core layers. For the skin layers, the elastic plastic material model of the bulk material obtained from experimental compressive tests is utilized (Figure 9). Illustration of the simulation set up for the compressive test simulations.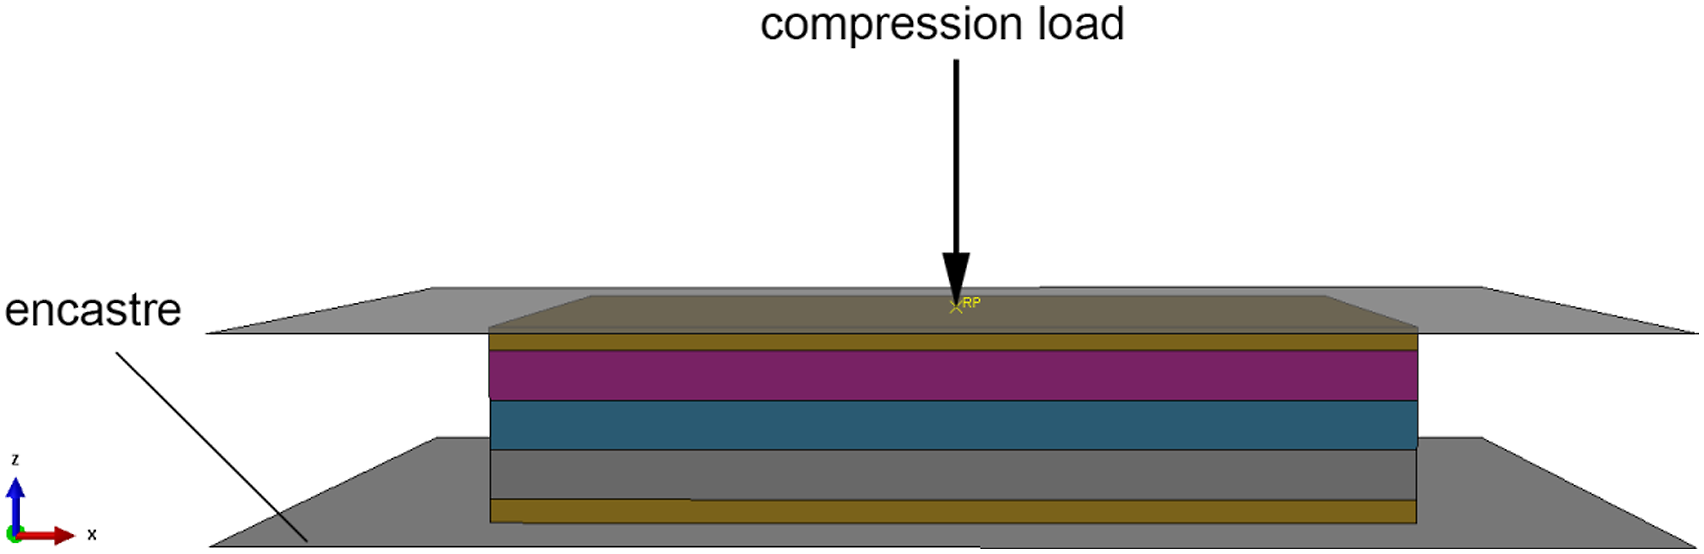
Results and discussion – constitutive model
The simulation results and their validation with experimental results (ISO 604:2002, specimens of the size of 10 mm x 10 mm x h were milled out of the injection moulded foam plates) are shown in Figure 13. The experimental tests were performed on a ZwickRoell Z010 testing machine with a 10 kN load cell. The displacement is measured with an extensometer (ZwickRoell MakroXtens II 300 mm, HP). Comparison of the compressive test simulation results with experimental results for the foams resulting from opening stroke (a) 2.3 mm, (b) 2.7 mm and (c) 3 mm.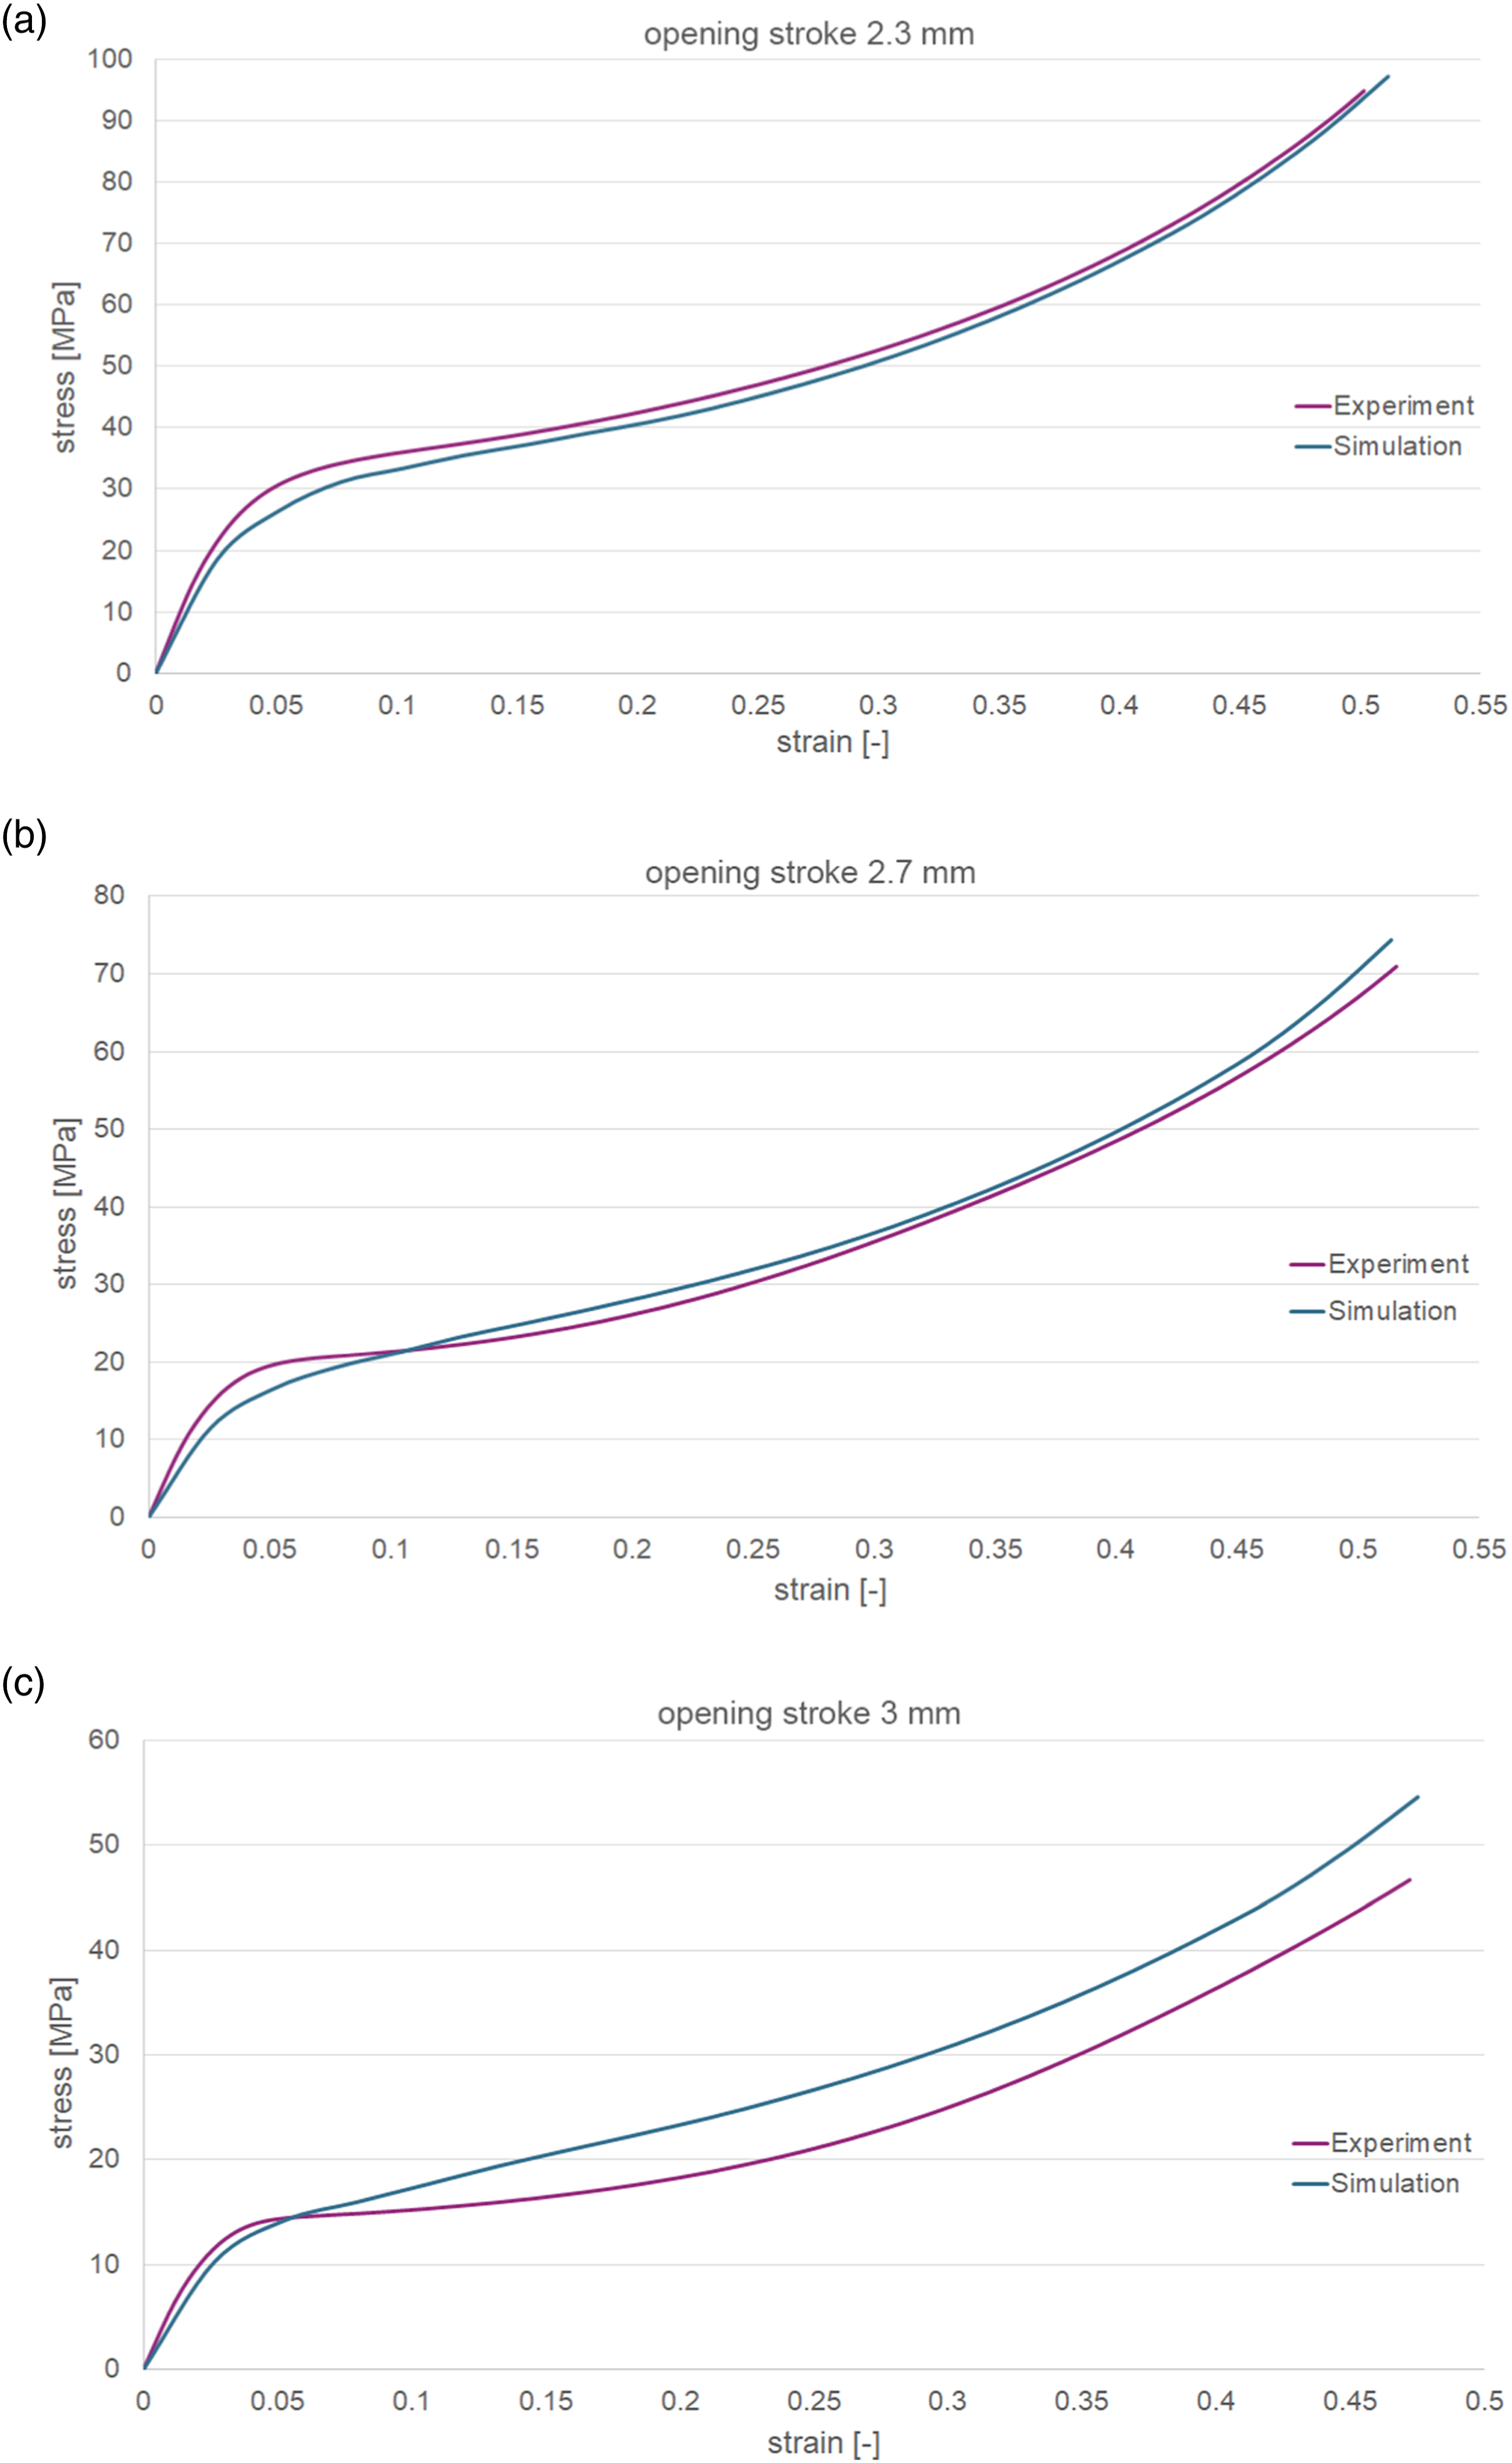
Overview of the deviations between simulation and experimental result.
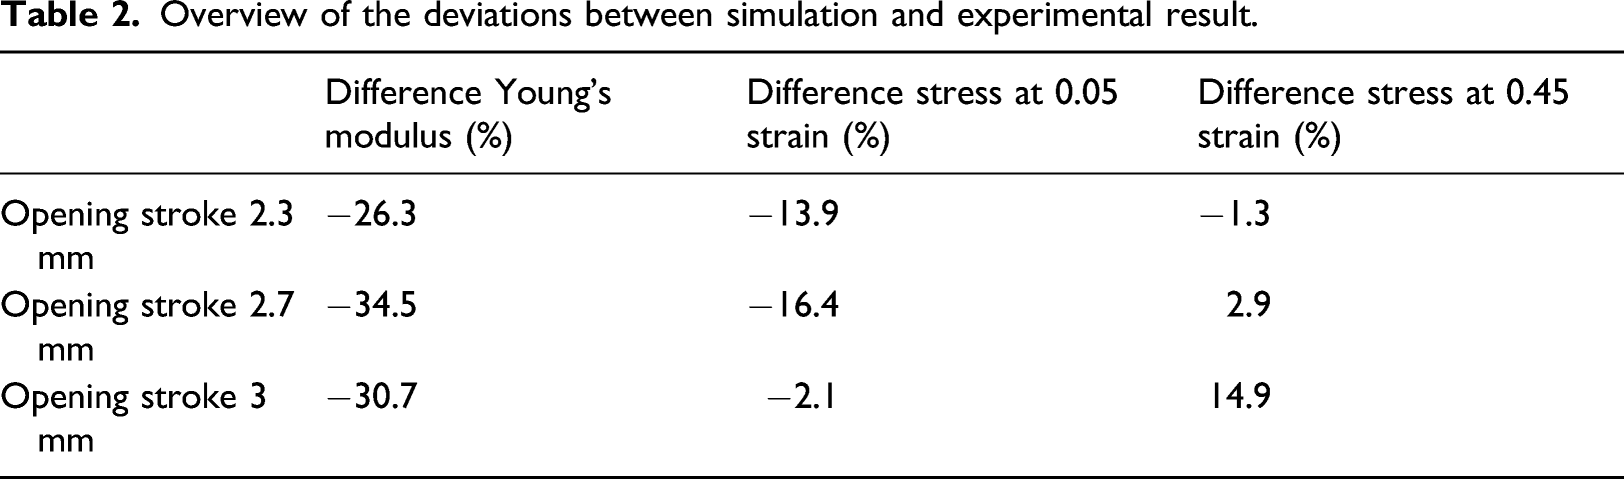
It can be seen that the Young’s modulus values for all three foams are underestimated by the simulation. For the foams resulting from opening stroke 2.3 mm and 2.7 mm, the stress values at 0.05 strain obtained by simulation are lower compared to the experimentally determined stress values whereas the stress values at 0.45 strain are in good agreement with the experimental result. The simulation result at 0.05 strain of the foam resulting from opening stroke 3 mm is similar to the experimental result. The stress at 0.45 strain is higher than the stress investigated experimentally. The simulated curve progressions of the three foams for strains > 0.1 are similar to the ones experimentally determined. This allows for the estimation of the compression behaviour of foams for high strains.
Tensile test simulation
Simulation methodology – microstructural model
Tensile test simulations are performed for the three core layers. The same microstructural simulation models are used as for the compressive tests.
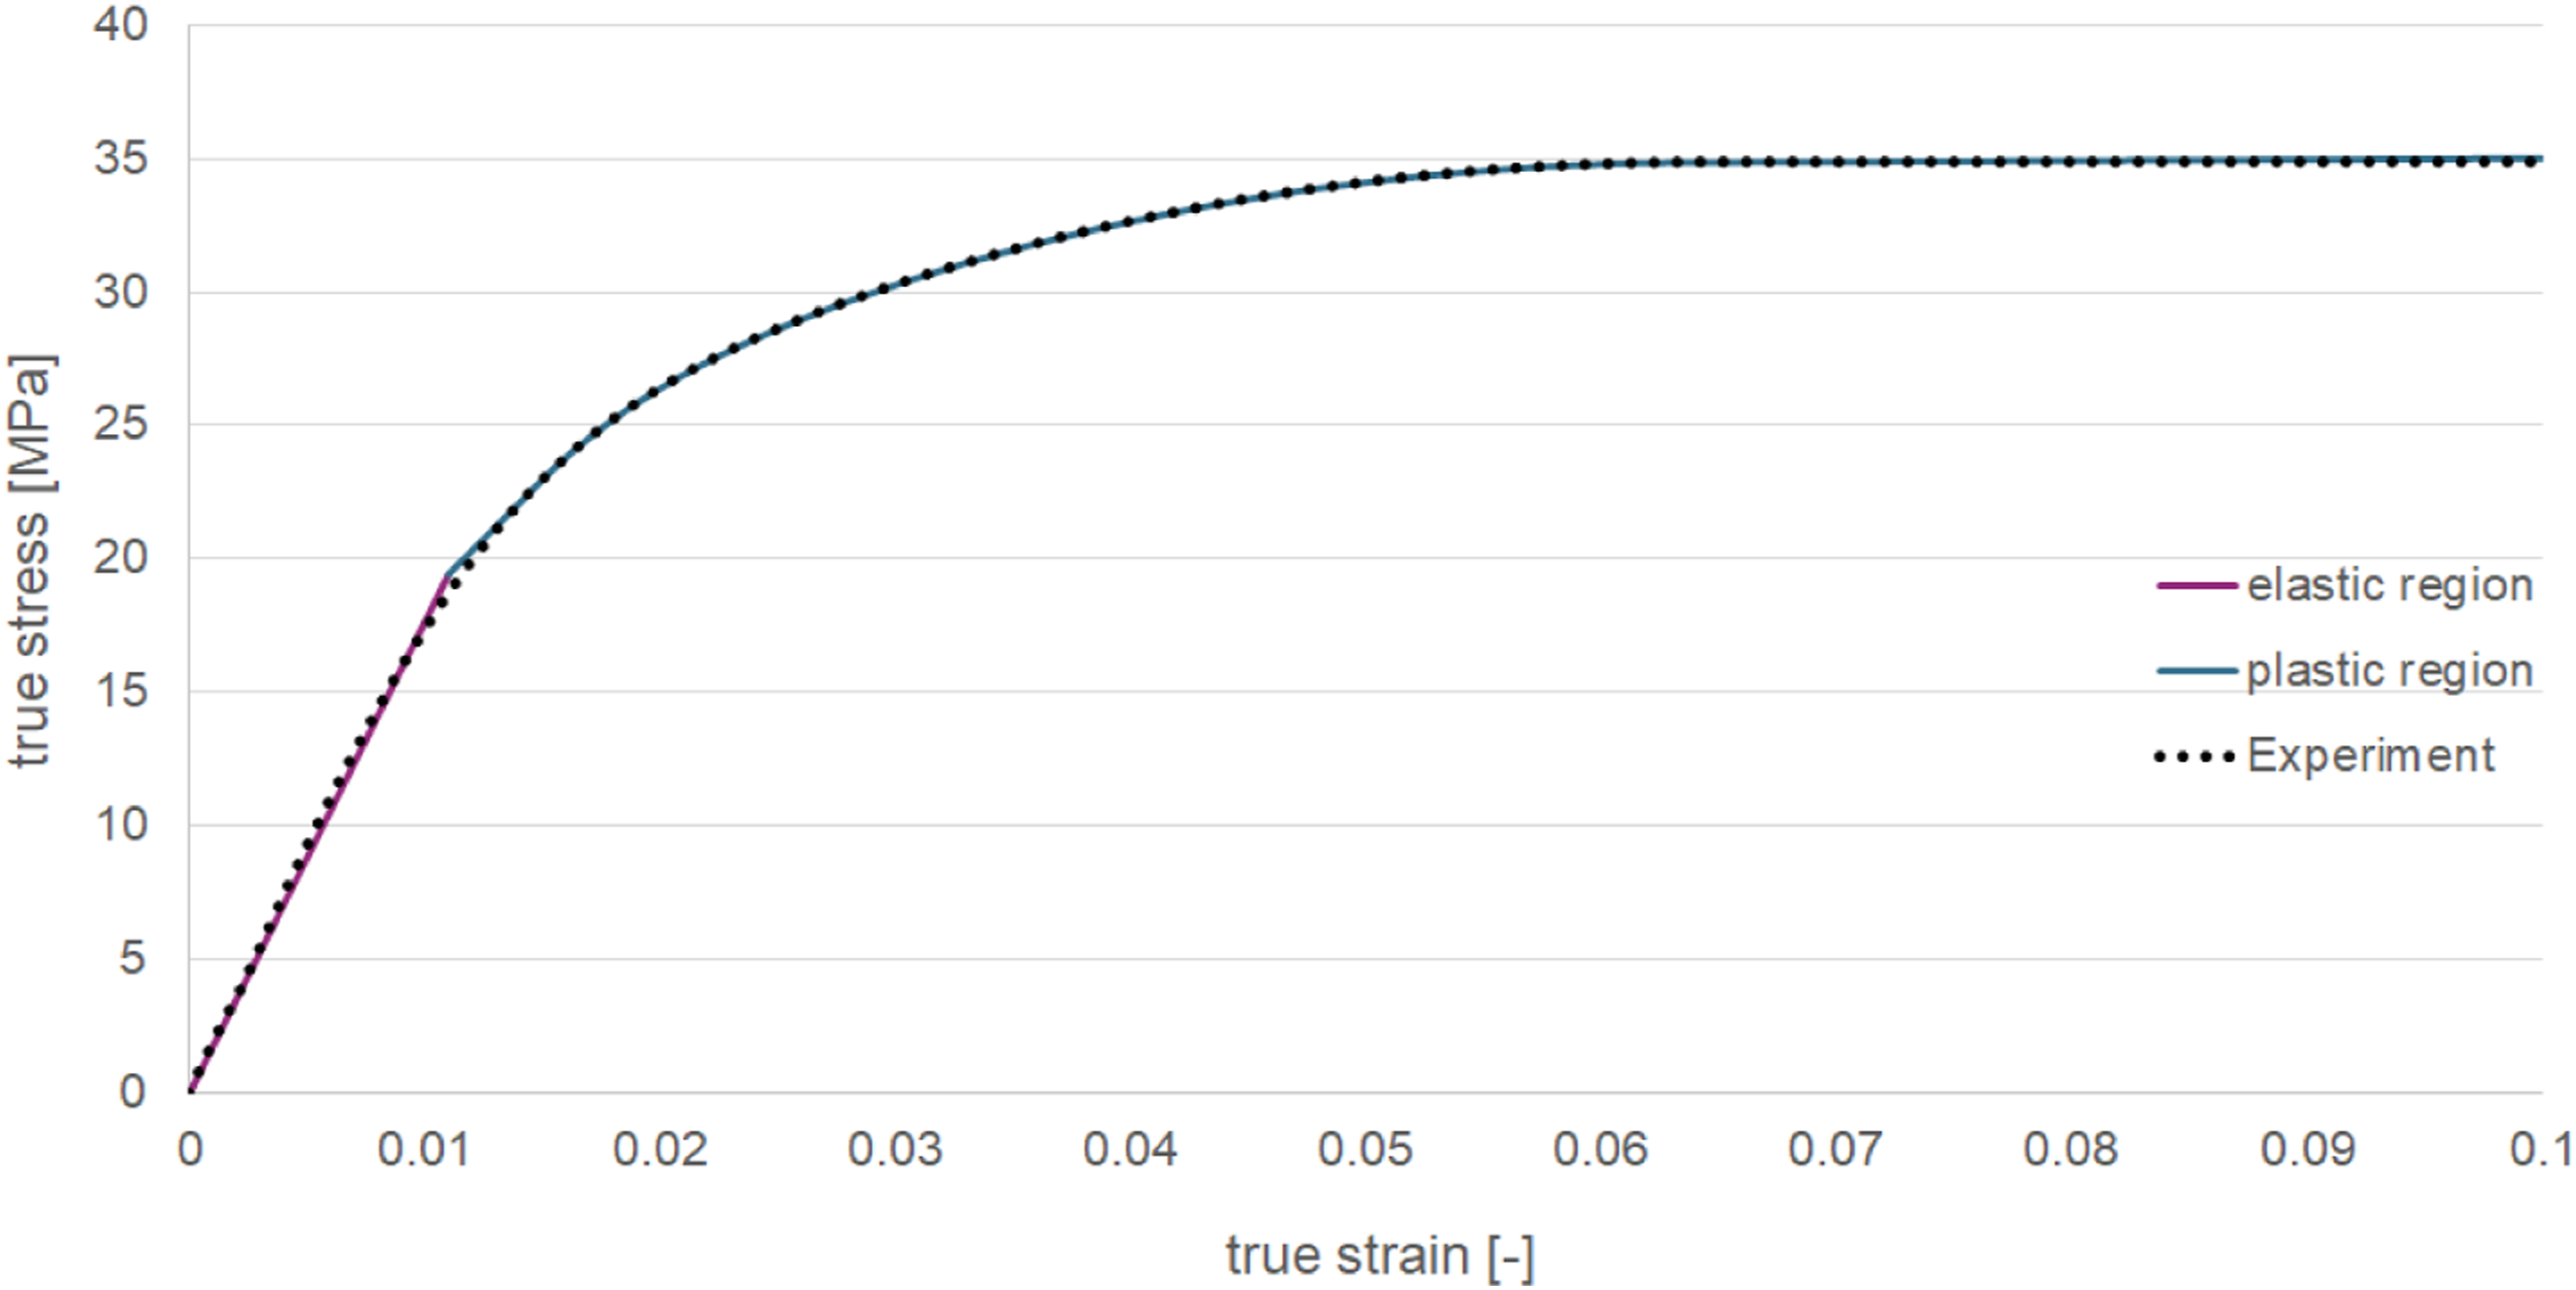
The simulation set up is shown in Figure 14. The load and clamping are applied at reference points (RP1 and RP2) which are connected to the foam with kinematic coupling constraints. At RP1, all degrees of freedom are locked (encastre). The input for the elastic plastic material model is obtained from experimental tensile test results of the bulk material (ISO 527-1:2012, true stress – true strain values) (Figure 15). The parameters of the material model are defined in the same way as the ones of the material model for the compressive test simulations. Illustration of the simulation set up for the tensile test simulations of the core layers. Illustration of the elastic plastic material model used for the tensile test simulations.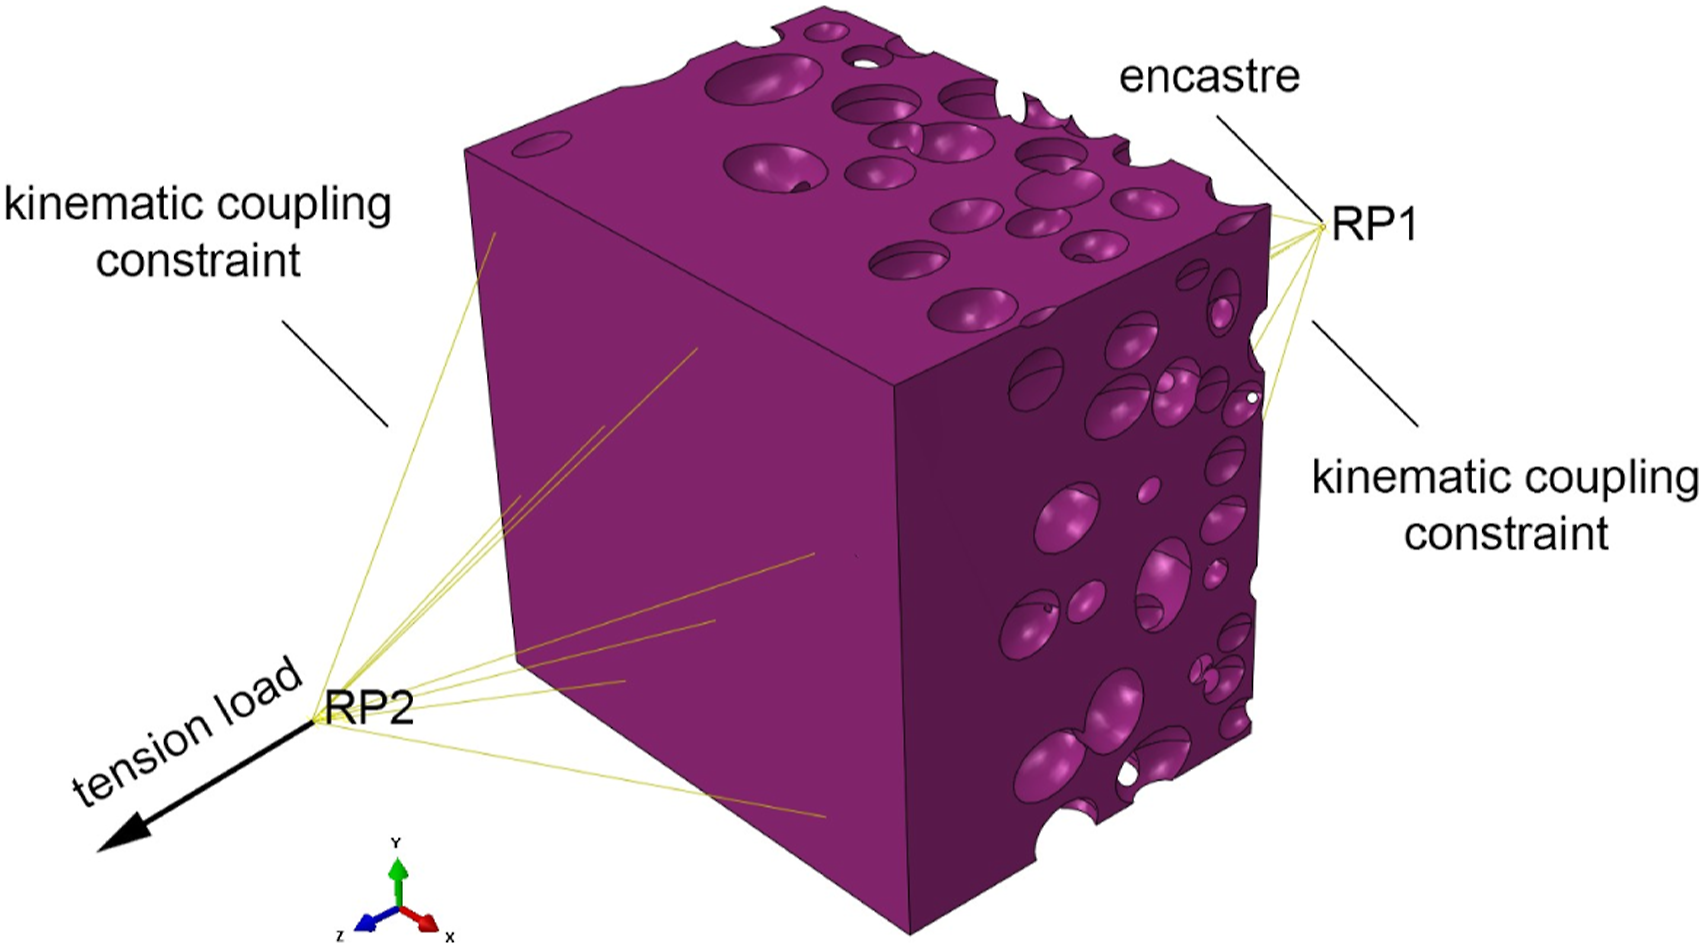
Results and discussion – microstructural model
The simulation results are depicted in Figure 16. The true stress – true strain curves are evaluated for each core layer. As it is already observed for the compressive test simulations, the results of core layers 1 and 3 are similar for all three foams. The stress values of core layer 2 is lower than the stress values of the other two layers due to the lower density. At a certain strain, the stress value stays constant. Figure 17 shows the comparison of the compression and tension behaviour (compression/tension asymmetry) of the core layers of the foam resulting from opening stroke 2.3 mm. The difference in the stiffness is negligible, whereas the differences for higher strains (> 0.02) become significant. The ratio of the stress values at strain 0.08 is 1.32 for core layers 1 and 3 and 1.26 for core layer 2. Tensile test simulation results of the core layers of the foam resulting from opening stroke (a) 2.3 mm, (b) 2.7 mm and (c) 3 mm. Comparison of the compression and tension behaviour of the core layers of the foam resulting from opening stroke 2.3 mm, (a) core layers 1 and 3 and (b) core layer 2.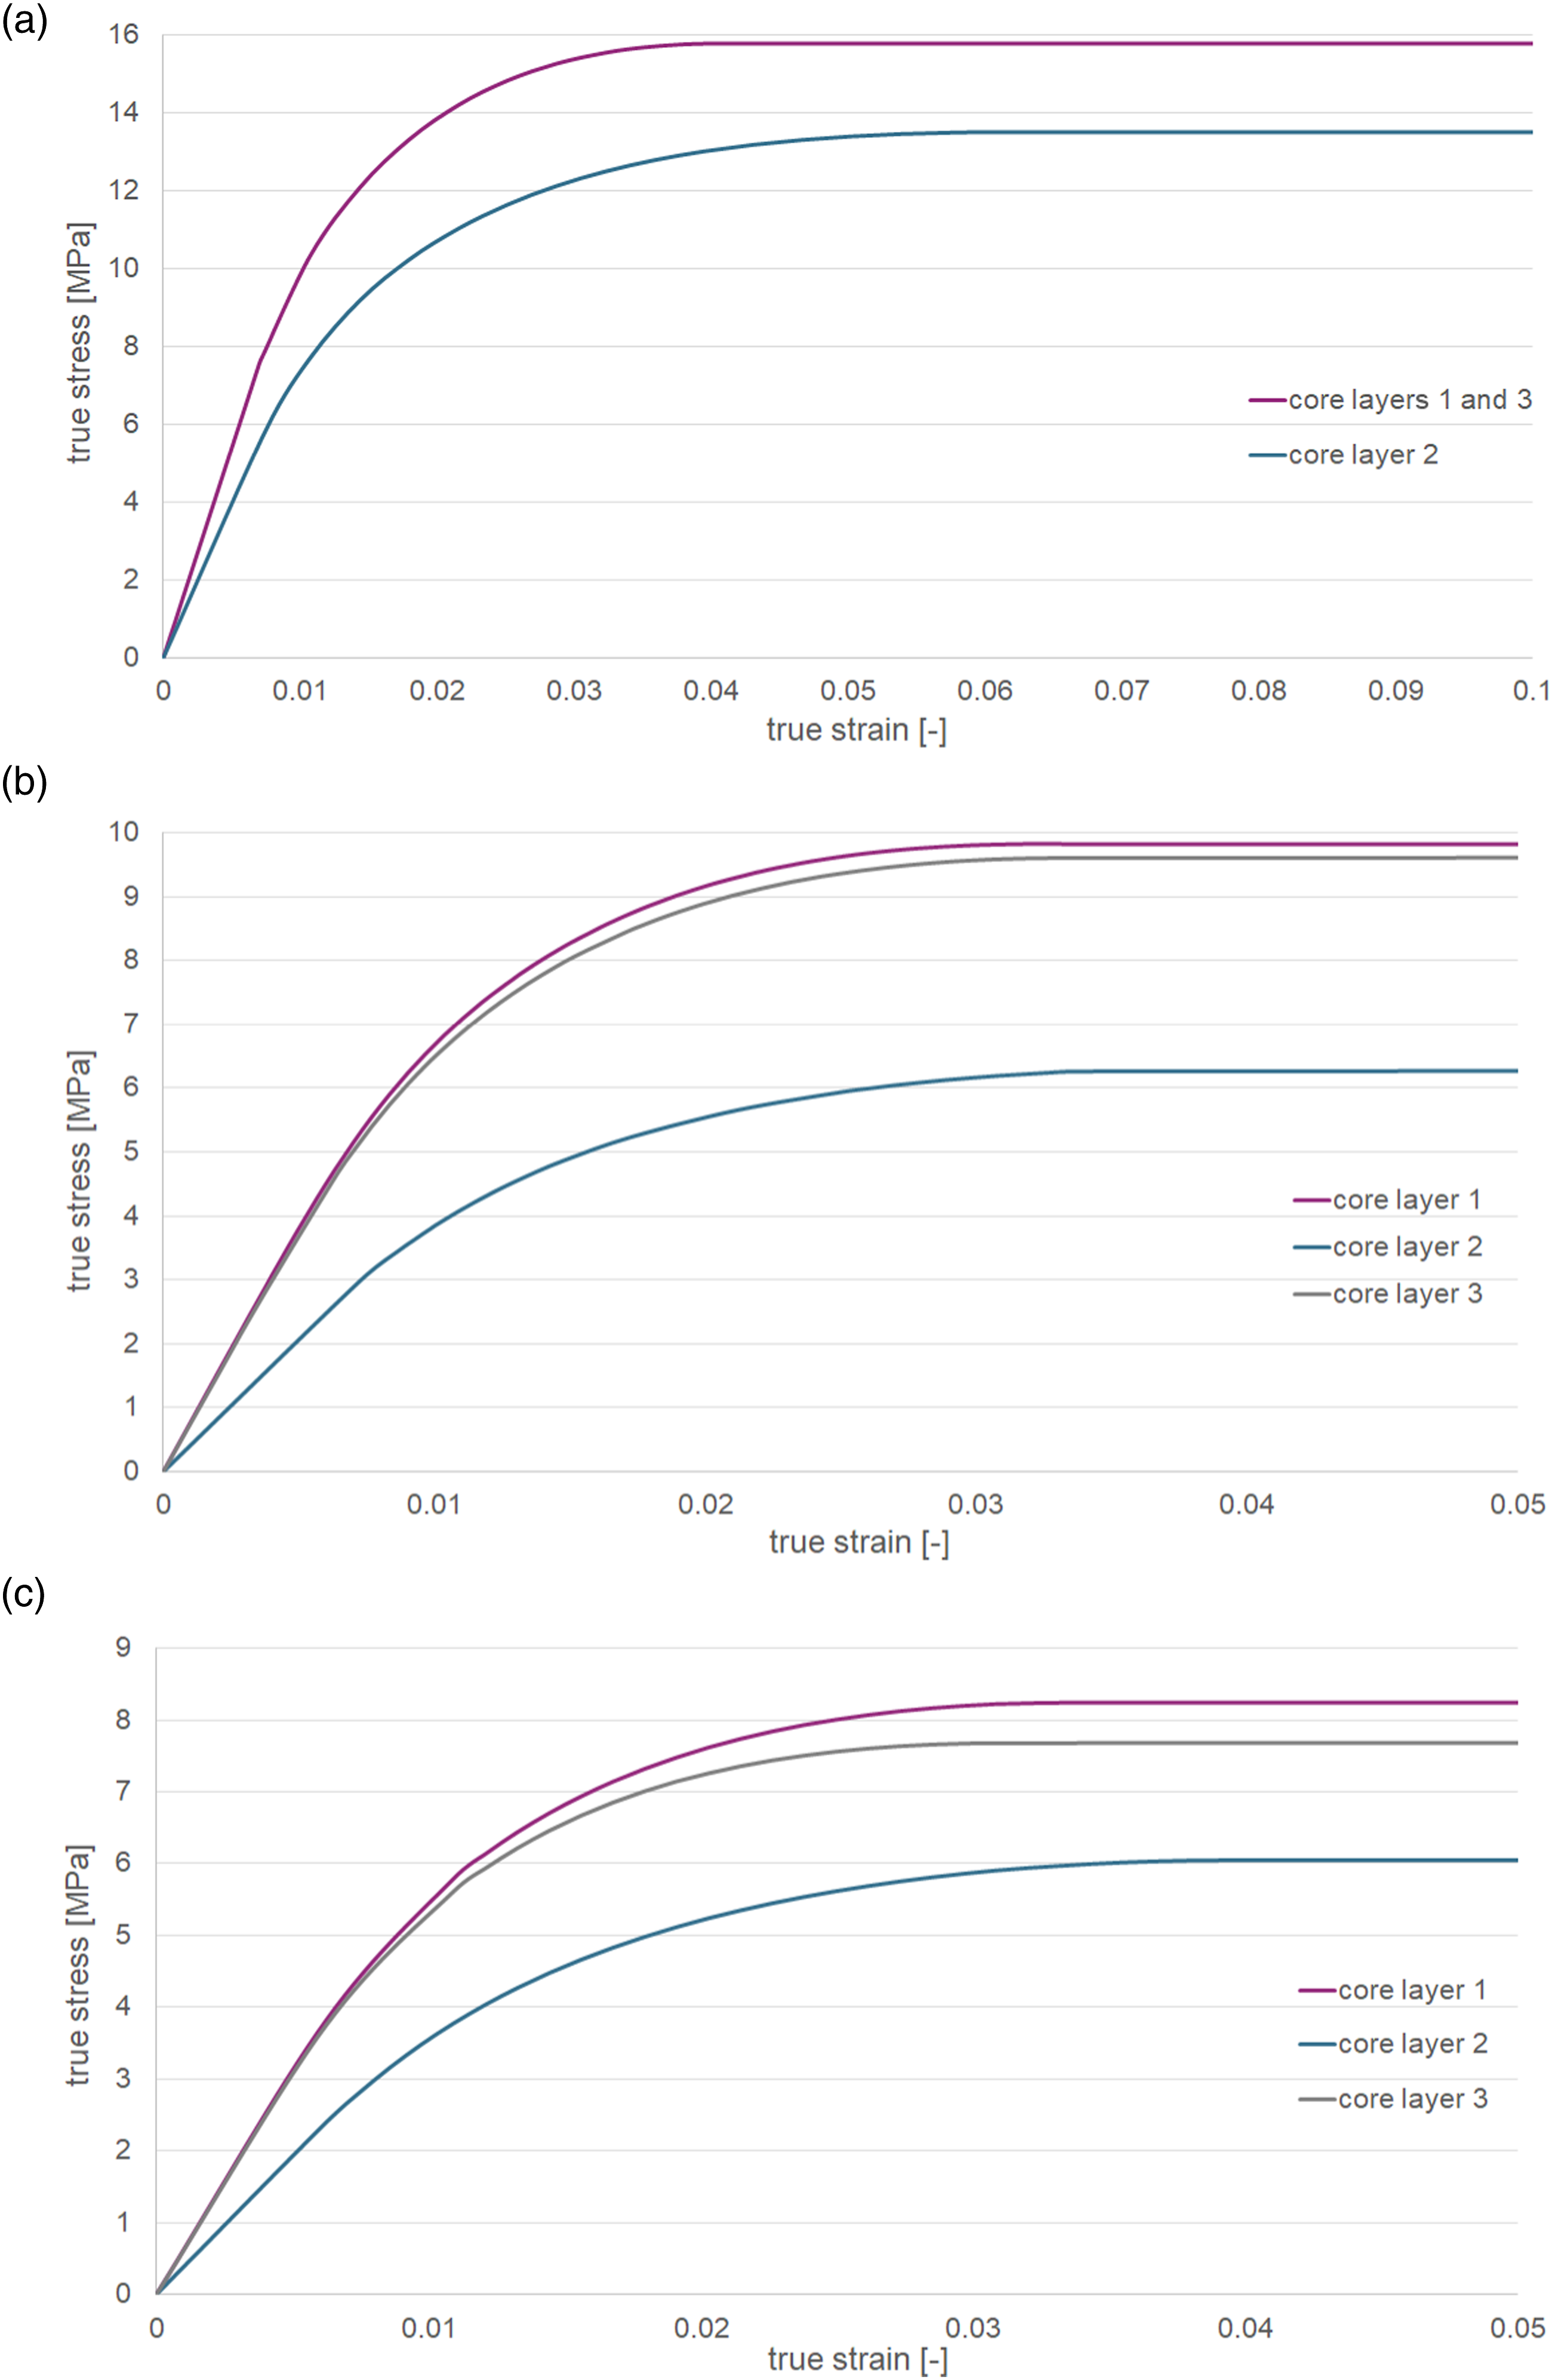
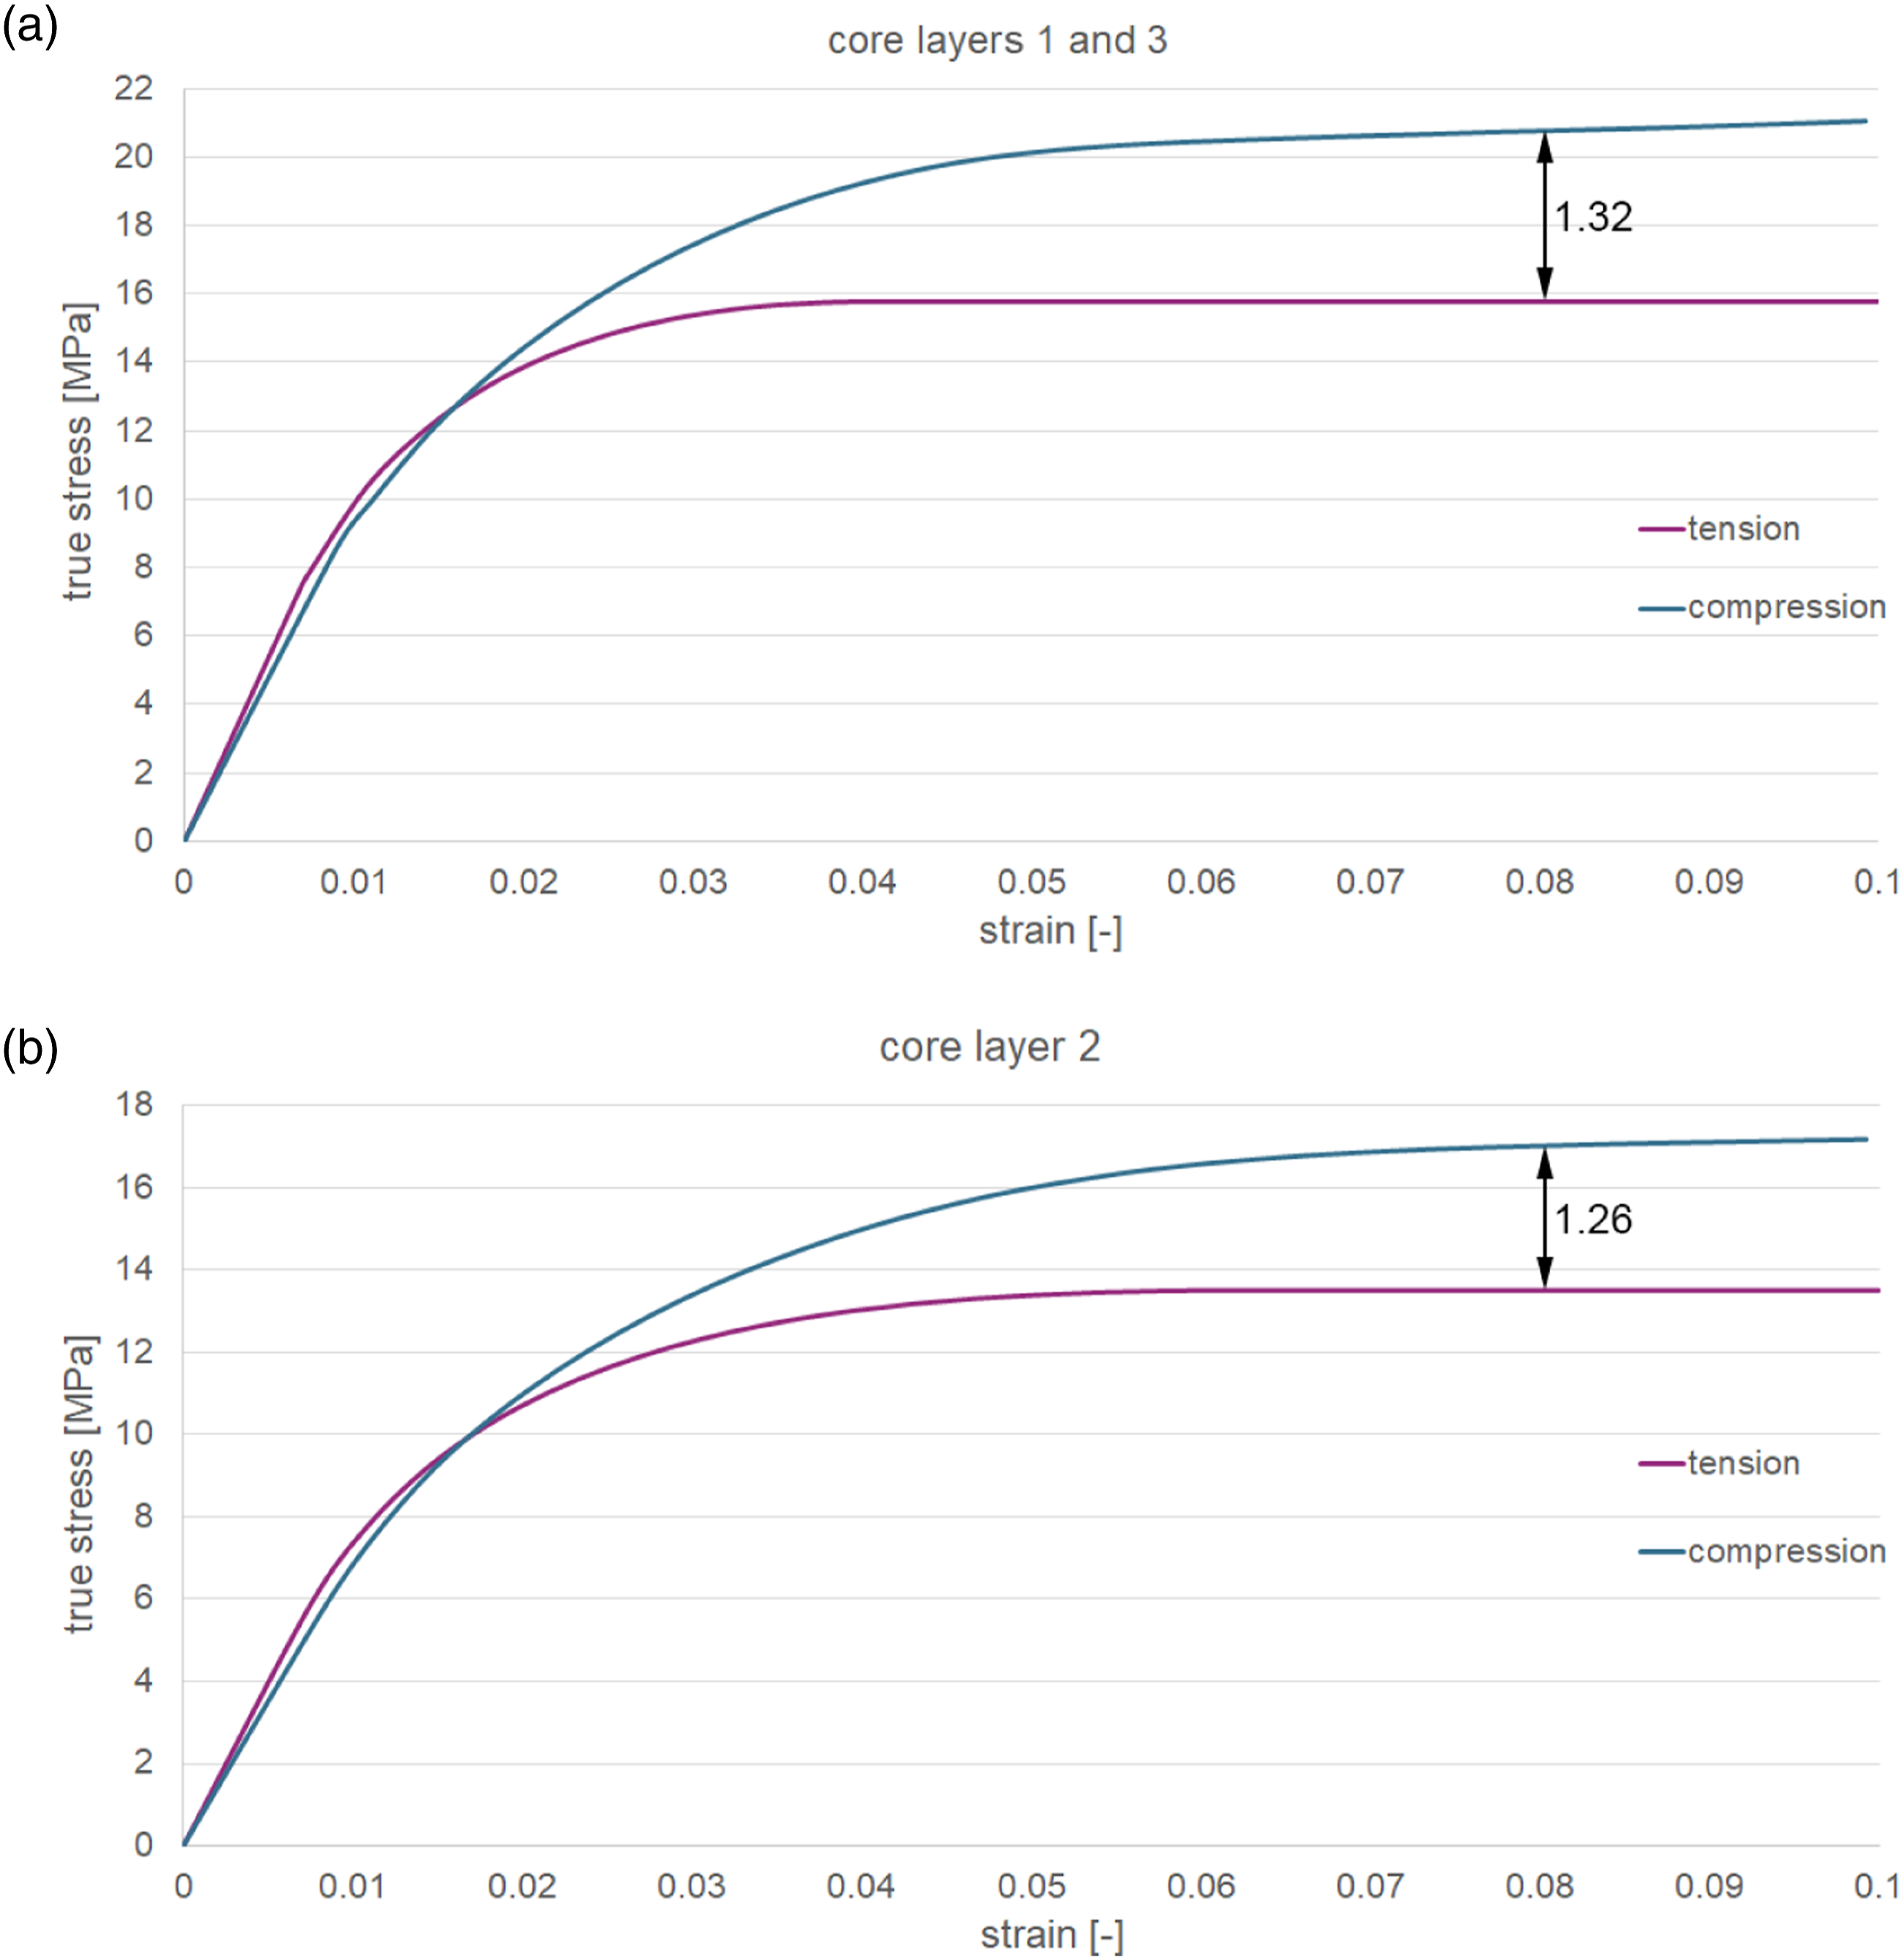
Ratios of the compressive and tensile stress values at strain 0.08 for all three foams.
For the tensile tests, no experimental results are available, thus the simulation of the entire foam (skin-core-skin) is not performed for the tensile loading. Nevertheless, the results of the simulations of the core layers are required as an input for the bending test simulations, which is described in the next section.
Bending test simulation
Simulation methodology – constitutive model
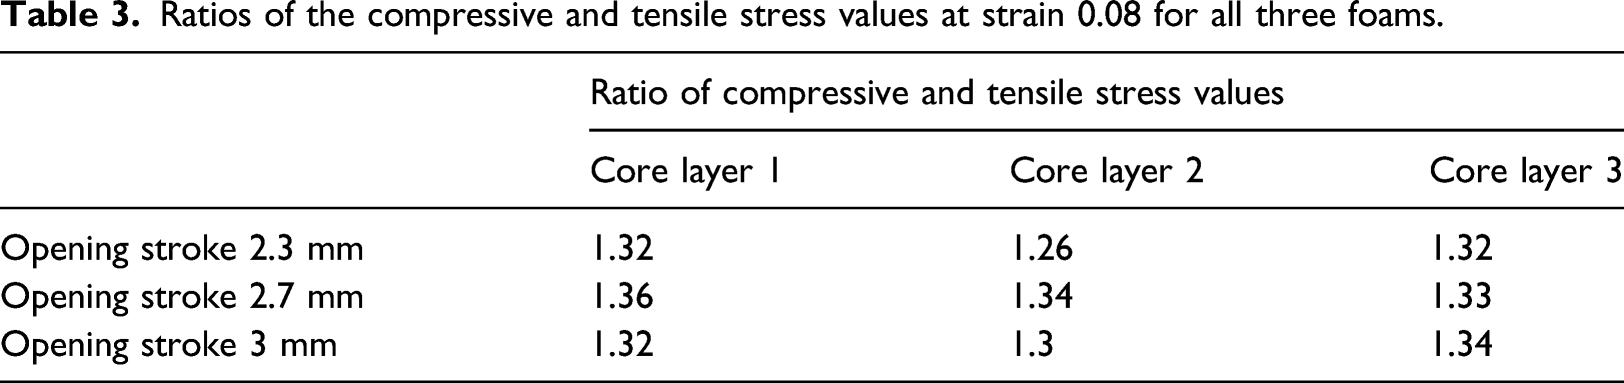
For the bending test simulations, the dimensions of the specimen used for the simulation have to be same as the dimensions of the experimental specimen. For the experimental tests, specimens with the dimensions of 80 mm x 10 mm x h were milled out of the injection moulded foam plates. Due to the large size of the specimens, a constitutive modelling approach is necessary otherwise the computational effort is too high due to the large dimensions of the specimen. The results of the compressive and tensile tests of the core layers are used as input for the material model. In Figure 18, an overview is given which material models are utilized for the bending test simulation and the simulation set up is shown. As for the compressive test simulations, a general contact definition, is applied to model the contact between the striker/supports and the specimen.
32
Overview of the material models used for the bending test simulation.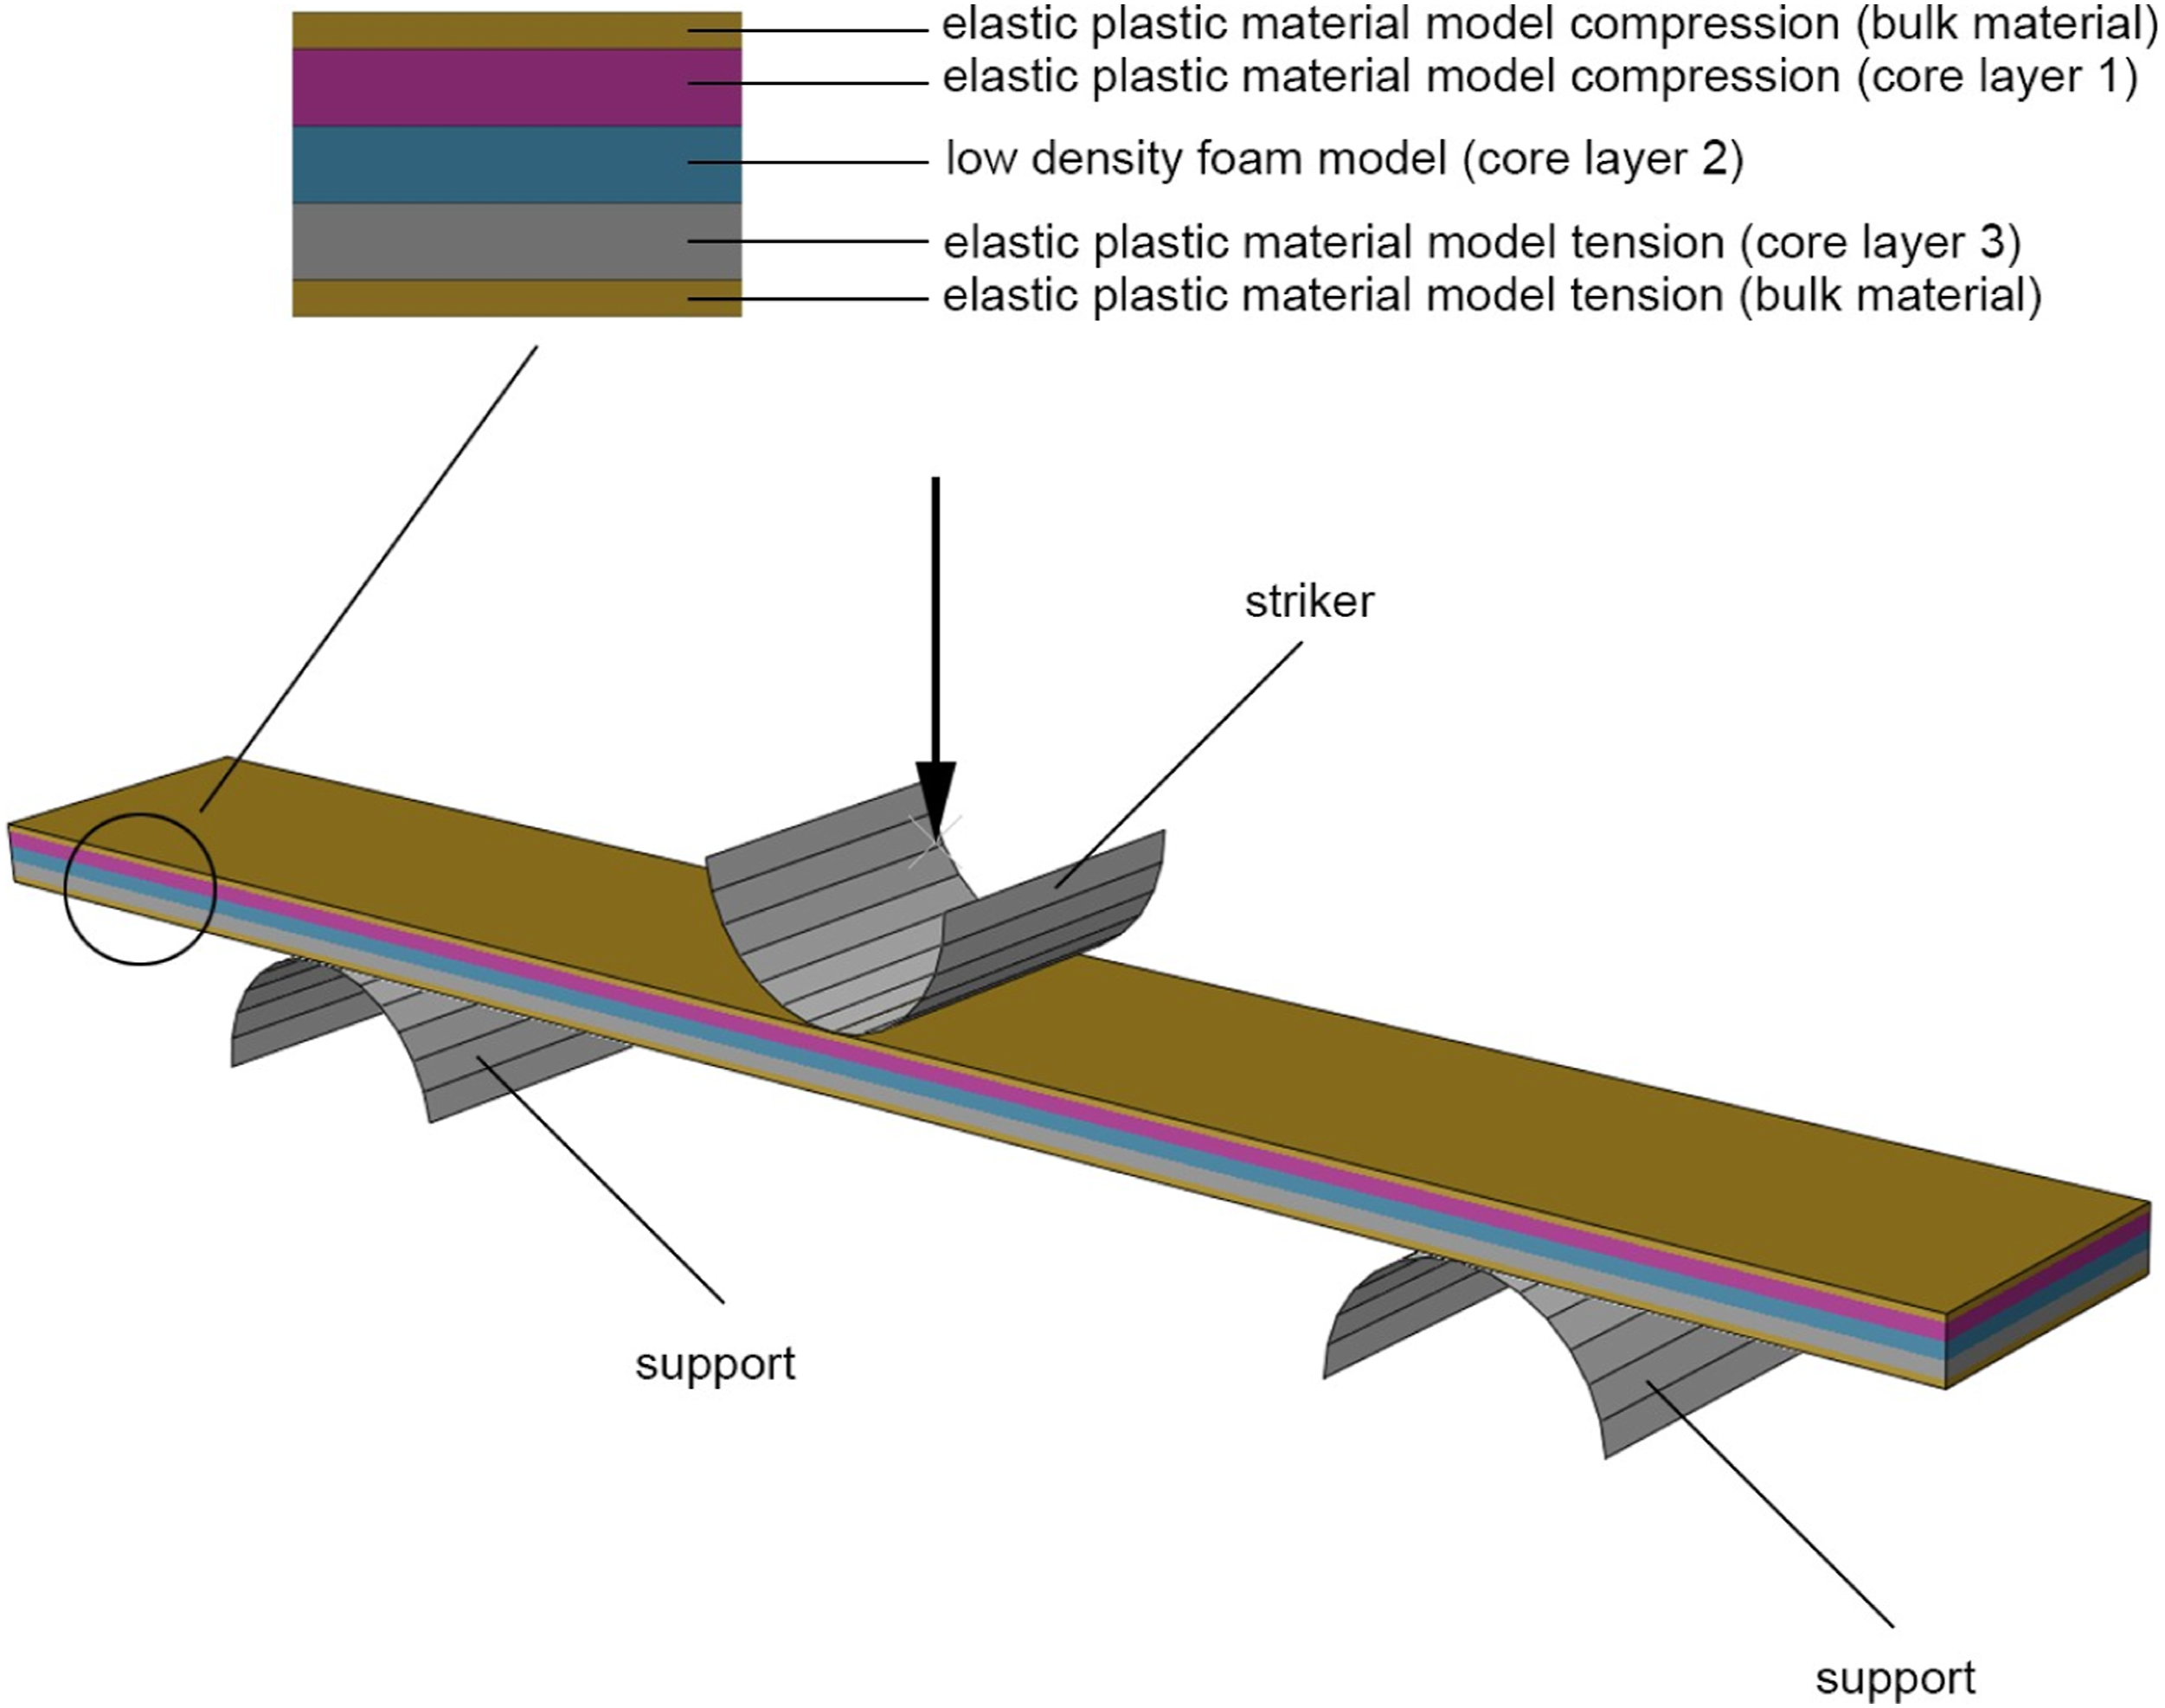
The specimen is divided into five layers: two layers represent the behaviour of the skin and the other three layers represent the behaviour of the core. The material models of the skin and core layers are as follows: • Upper skin layer: experimental compressive test result bulk material, true stress – true strain curve, elastic plastic material model. • Core layer 1: compressive test result core layer 1, true stress – true strain curve, elastic plastic material model. • Core layer 2: compressive and tensile test results core layer 2, nominal stress-strain curve, low density foam model.
32
• Core layer 3: tensile test result core layer 3, true stress – true strain curve, elastic plastic material model. • Lower skin layer: experimental tensile test result bulk material, true stress – true strain curve, elastic plastic material model.
As elastic plastic material models are used for the simulations, the different strain rates in the layers caused by the bending load are not considered. It is assumed that the differences in the strain rates are negligible due to the small specimen thickness. The use of the low-density foam model requires no further partition of core layer 2 to consider the tensile and compressive stress states in this layer and therefore the determination of the neutral axis is not necessary. The simulation model is meshed with linear hexahedral elements (element type in Abaqus: C3D8R). The mesh size is chosen so small that there are four elements per thickness for the skin layers and three elements per thickness for the core layers.
Results and discussion – constitutive model
Figure 19 shows the comparison of the bending test simulation results for the three foams and the experimental results (ISO 178:2013). The experiments were conducted on a ZwickRoell Z005 (integrated in a robot system) with a 500 N load cell. An extensometer (ZwickRoell three-point bending sensor) is utilized for the displacement measurement. The specimen was deflected until rupture or until a maximum strain of 5% was reached, whichever occurs first. The experimental results are, as for the compressive tests, the averaged results from three bending tests per foam. Here again, it is observed that the stress–strain curves are similar and the standard deviation is small (e.g. standard deviation at strain 1.5 is smaller than 0.4 MPa). From the comparison, it can be seen that for all three foams the simulation results are in a very good agreement with the experimental results. Only the strength obtained by simulation is overestimated (8.2%) for the foam resulting from opening stroke 2.3 mm. From the validation, it can be concluded that the chosen foam section for the simulation model is representative for the entire foam microstructure. The tensile and compressive tests of the core layers are indirectly validated because these results are the input data for the material models used in the bending test simulations. Due to the proper estimation of the bending behaviour of the foam, it is assumed that the behaviour of the foam core layers under tension and compression load is also predicted well. Comparison of the bending test simulation results with experimental results for the foams resulting from opening stroke (a) 2.3 mm, (b) 2.7 mm and (c) 3 mm.
Conclusion
A methodology for the generation of microstructural simulation models for high-density foams based on CT measurement results is introduced. The behaviour of foams with three different densities resulting from different opening strokes under compression, tension and bending load was investigated. For the compressive and tensile tests, the microstructural model was partitioned into three core layers and two skin layers to obtain specimens where the ratio of their dimensions is similar to the ratio of the dimensions of the specimen used for the experiments. From the simulation results of the core layers, constitutive material models were generated which were used to simulate a compressive test with a specimen which dimensions are the same as the dimensions of the experimental specimen. The validation of the compressive test simulations for the three foams showed that the Young’s modulus values are underestimated. The stress values at 0.05 strain are lower for the foams resulting from opening stroke 2.3 mm and 2.7 mm compared to the experimental result. Nevertheless, similar stress–strain response is observed for the simulations and experiments at strains > 0.05 for these foams. For the foam resulting from opening stroke 3 mm, the stress at 0.05 strain is similar to the experimentally obtained stress, whereas the stress values at strains > 0.05 are slightly overestimated. An improvement of the simulation set up with regard to the boundary conditions might be necessary to better represent the experimental results.
For the bending test simulations, constitutive material models obtained from the tensile and compressive test simulations of the core layers were used. The validation of the simulations showed that the results match the experimental results. Thus, it can be concluded that the simulation approach is suitable for investigating the mechanical behaviour of high-density foams under bending load. Furthermore, the developed methodology enables the optimization of foamed components regarding lightweight design (bending stiffness vs. weight). For all simulations, an elastic plastic material model was utilized but the simulation approach allows for the implementation of, for example, strain rate and temperature dependent material models. Therefore, it is possible to investigate the foam behaviour under more complex loading conditions (e.g. instrumented puncture test). This will be done with injection moulded foams made of a more ductile polypropylene. Hence, the model will be further validated regarding load cases and material specific characteristics.
Footnotes
Declaration of conflicting interests
The author(s) declared no potential conflicts of interest with respect to the research, authorship, and/or publication of this article.
Funding
The author(s) received no financial support for the research, authorship, and/or publication of this article.