
Abstract
Cellular materials, especially foams, are widely used in several applications because of their special mechanical, electrical and thermal properties. Their properties are determined by three factors: bulk material properties, cell topology and shape as well as relative density. The bulk material properties include the mechanical, thermal and electrical properties of the matrix. The cell topology determines if the foam exhibits stretch or bending dominated behaviour. The relative density corresponds to the foaming degree. It is defined by the cell edge length and cell wall thickness. Especially for the linear elastic properties there are many different modelling approaches. In general, these methods can be divided into two groups namely direct modelling, e.g. analytical and finite element models and constitutive modelling, e.g. models which are generated through homogenization methods. This paper presents an overview of the different modelling methods for foams. Furthermore, sensitivity studies are presented which enable the comparison of the models with regard to the estimation of the elastic properties, show the limits of those models and enable the investigation of the influence of the above mentioned factors on the elastic properties. Selected models are validated with experimental data of a low density foam regarding the Young’s modulus.
Introduction
Since foams gained interest during the past few years in many different fields of application, it is necessary to be able to characterize the properties of these cellular materials. One reason for the growing interest in foams is their low specific weight. Due to this property, foams are often used as core materials for sandwich structures, which reveal high stiffness at low specific weight.1–7 A further characteristic of foams is that they show a stress plateau over a wide range of strain under compression loading. They can undergo large compressive strains at almost constant stress. This special mechanical behaviour under compression can be efficiently used in several applications, e.g. in packaging or impact absorbers.2,8–14 Next to that, in thermal insulation applications the low thermal conductivity of foams is utilized.2,15–18 Especially closed cell foams have very low thermal conductivity. Foams also have the ability to absorb sound, and thus they are used for example in musical instruments.2,19 Furthermore, closed cell foams are often used in marine buoyancy because of their damage tolerance.2 They can ensure buoyancy even when damaged. Foams have a low loss factor per unit volume caused by their low densities but they allow the transmission of microwaves without damping or scattering. Therefore, foams can be used for skins of radio transmitters.2,20
All of these properties are determined by the following three parameters: bulk material properties, cell topology and shape as well as relative density.1 Several modelling methods were introduced and described in literature aiming to investigate the effect of these parameters on the properties of foams.2,21–24
In this paper the three design variables are described in Section “Design variables for cellular solids” and the models for cellular materials are summarized and the differences among them are pointed out in Section “Overview of modelling methods for cellular solids”. Moreover, sensitivity studies are performed to investigate the influence of the design variables on the elastic properties of closed cell foams and to compare several models for closed cell foams (Section “Investigation of the influence of the design variables on the elastic properties of closed cell foams based on FE models” and Section “Comparison of modelling methods for closed cell foams with regard to the elastic properties”). In Section “Validation of modelling methods for closed cell foams with regard to the Young's modulus” the Young’s moduli estimated by several selected models are compared with the experimentally determined Young’s modulus of a low density extrusion foam, which allows for the validation of the models.
Design variables for cellular solids
The properties of cellular materials are influenced by the material of which the foam is made, the cell topology and shape and the relative density (Figure 1).
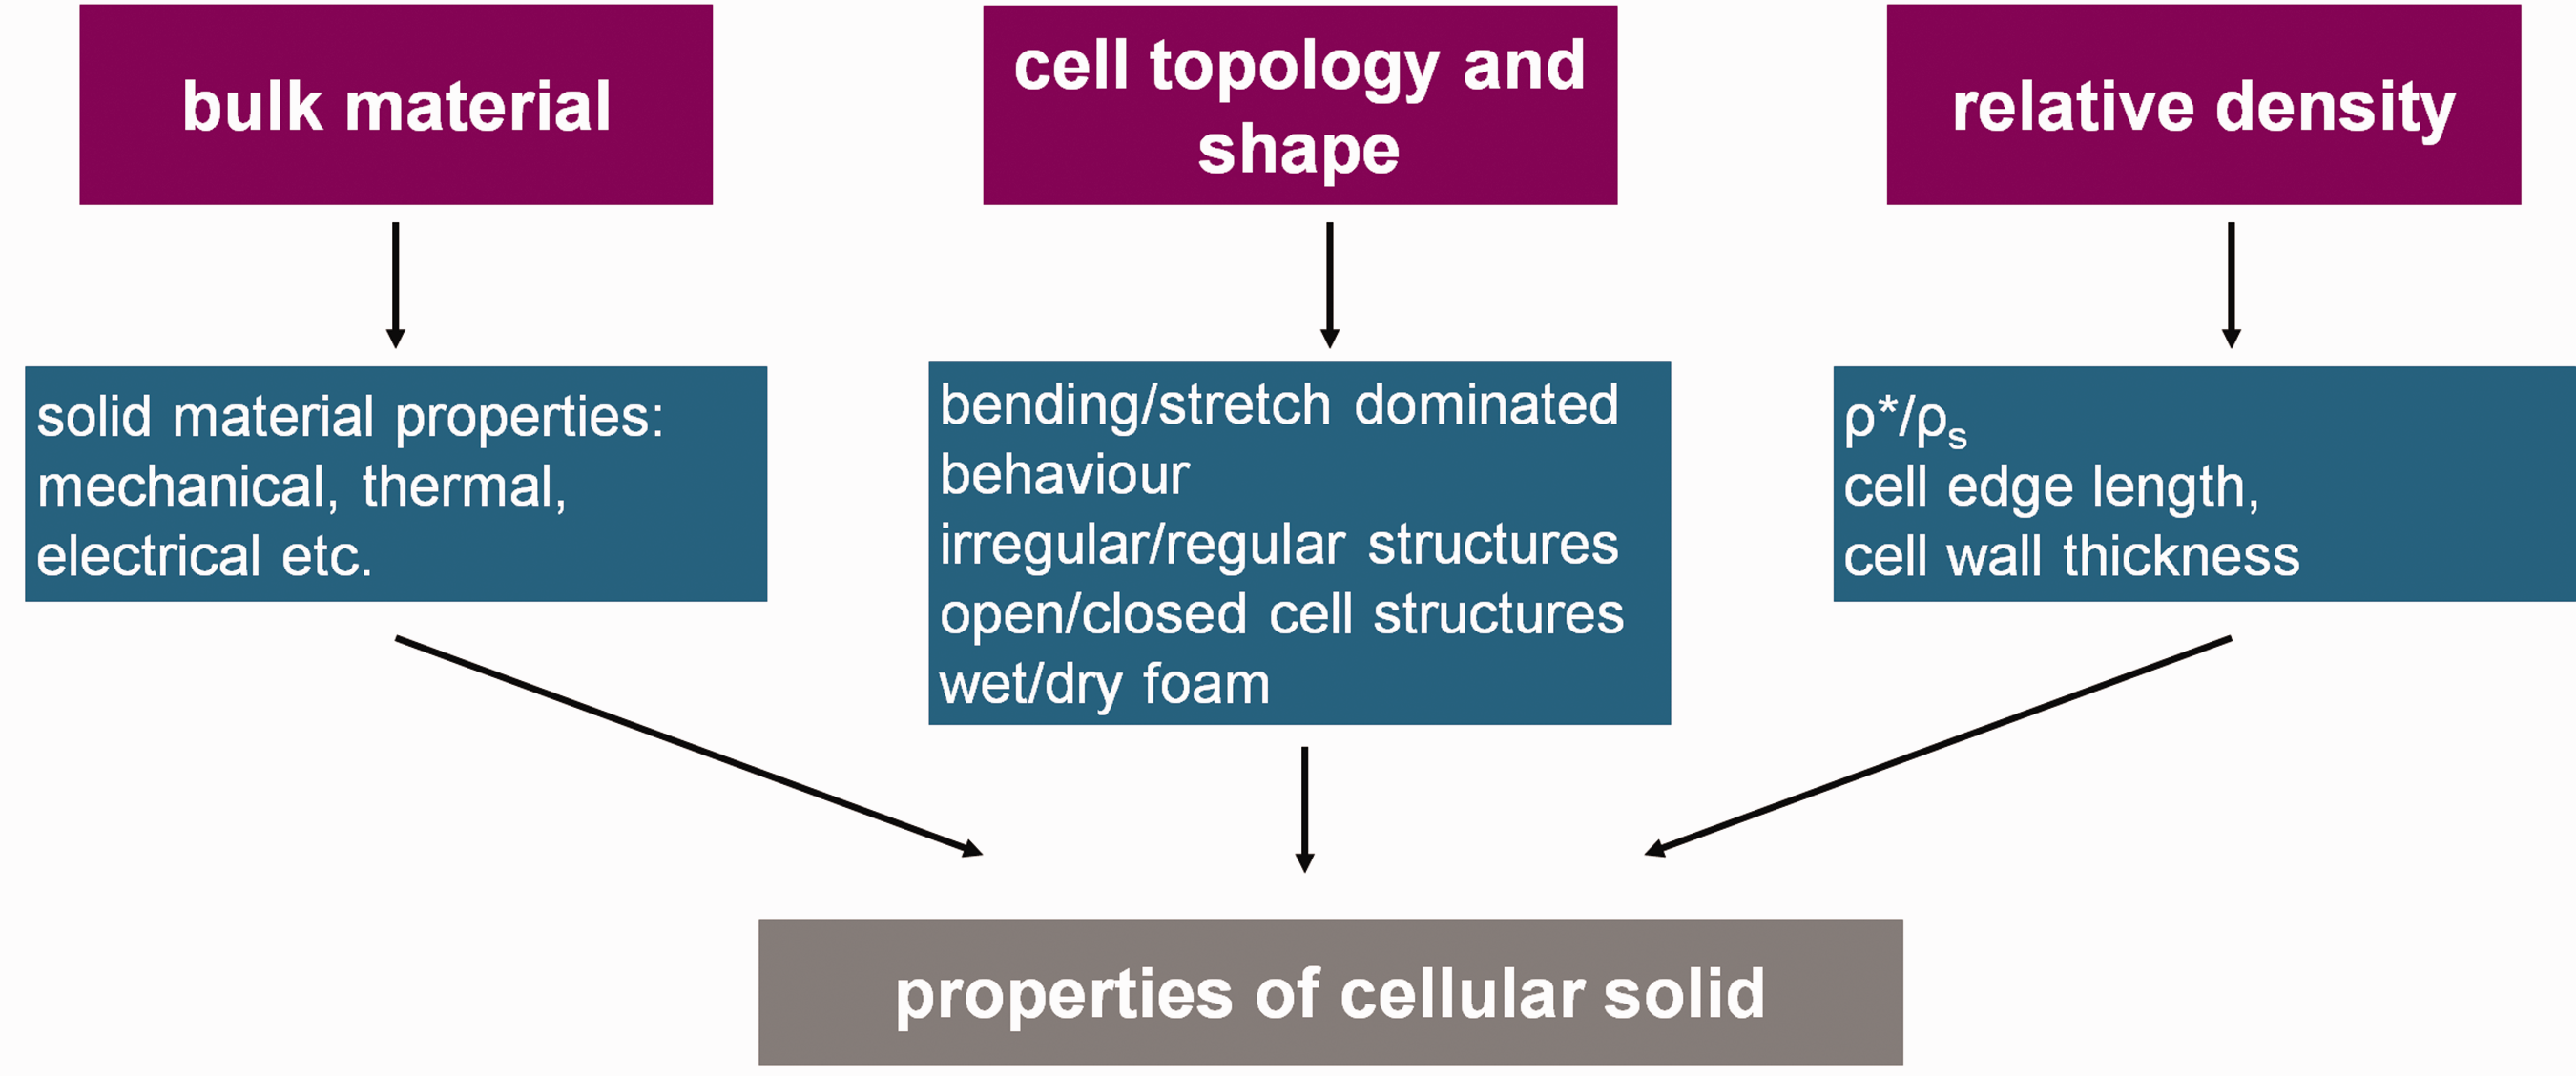
Design variables for cellular solids.1
In the following, the different variables are described.
Bulk material properties
The first design variable is the material the cellular structure is made of, i.e. the bulk material. The composition and the formulation of the bulk material determine the base properties of the cellular material.25 Furthermore, physical properties like viscosity of the bulk material influence the nucleation, growth and expansion of the gas bubbles in the melt if the cellular material is produced by foaming. The microstructure of the foam (cell topology and shape, relative density) depends on the bulk material and on processing and post-processing operations (this paper concentrates on the influence of the material properties).26 The different microstructures of a foam are described in the next section.
Cell topology and shape
In general, cellular materials can be divided according to their microstructure in irregular and regular structures (Figure 2).27 Cellular materials with an irregular structure are called foams. They exhibit a stochastic/random architecture. Cellular materials with a regular structure are called lattice structures, which exhibit a periodic/ordered architecture. Foams and lattice structures can have open or closed cells. For lattice structures, the cells can also be open only in specific directions (e.g. prismatic structure). The density of cellular materials can be constant or follow a distribution function f(x) (x is for example the thickness coordinate). Furthermore, the behaviour of the cellular material can be isotropic or anisotropic (described at the end of this section).
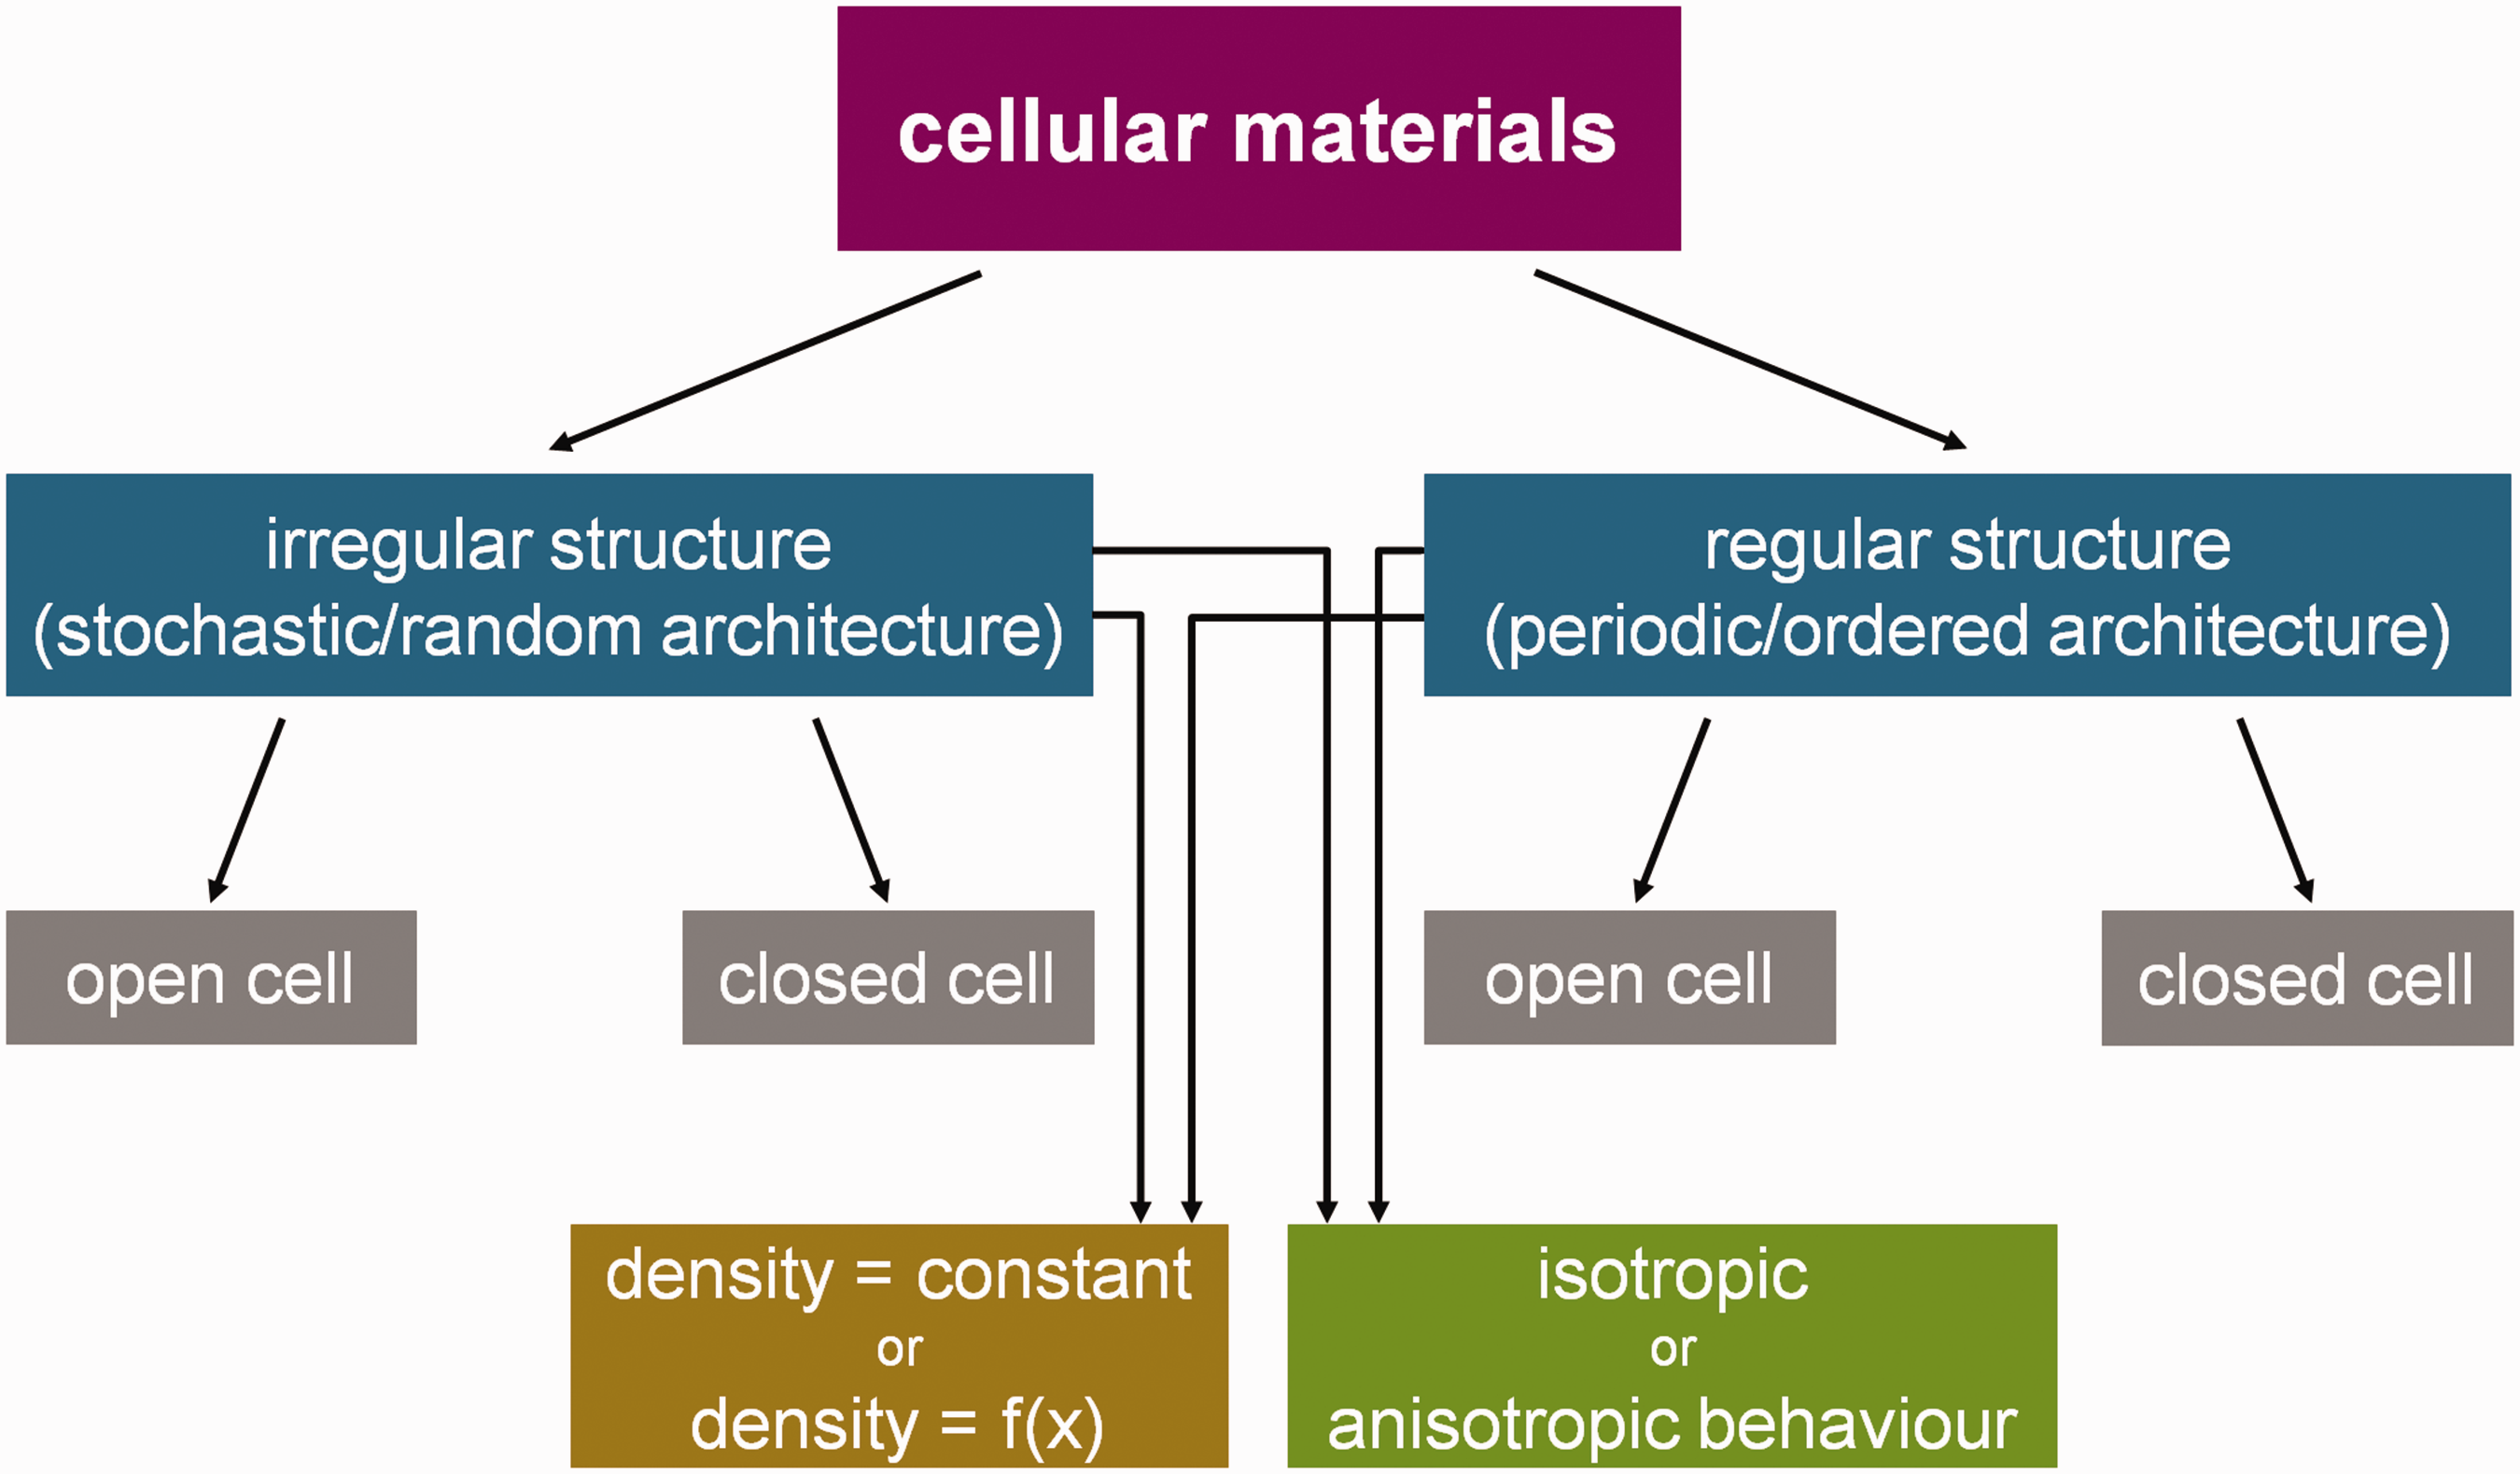
Classification of cellular materials.27
Foams and lattice structures differ in the way they deform. Foams, whether open- or closed cell, show a bending dominated behaviour whereas lattice structures show a stretch dominated behaviour. In Figure 3 the different behaviours under compression are depicted for cellular materials made of a linear elastic – ideal plastic bulk material.1,2 The deformation behaviour is determined by the topology of the cells. A cellular material with open cells consists of struts connected by joints. If the connectivity level of the joints is low, i.e. only a few struts meet at a joint, the struts bend during compression and the deformation mechanism is bending dominated. The bending of the struts significantly reduces the stiffness of the structure. For regular structures the connectivity of joints is usually high. The struts stretch during compression instead of bending. As a result, the stretch-dominated structures are stiffer than the bending dominated structures.1 The influence of the cell topology on the mechanical properties is high whereas on the thermal and electrical properties the influence is negligible.1 The dependence of modulus and strength on the relative density for bending and stretch dominated structures is described in Section “Relative density”.
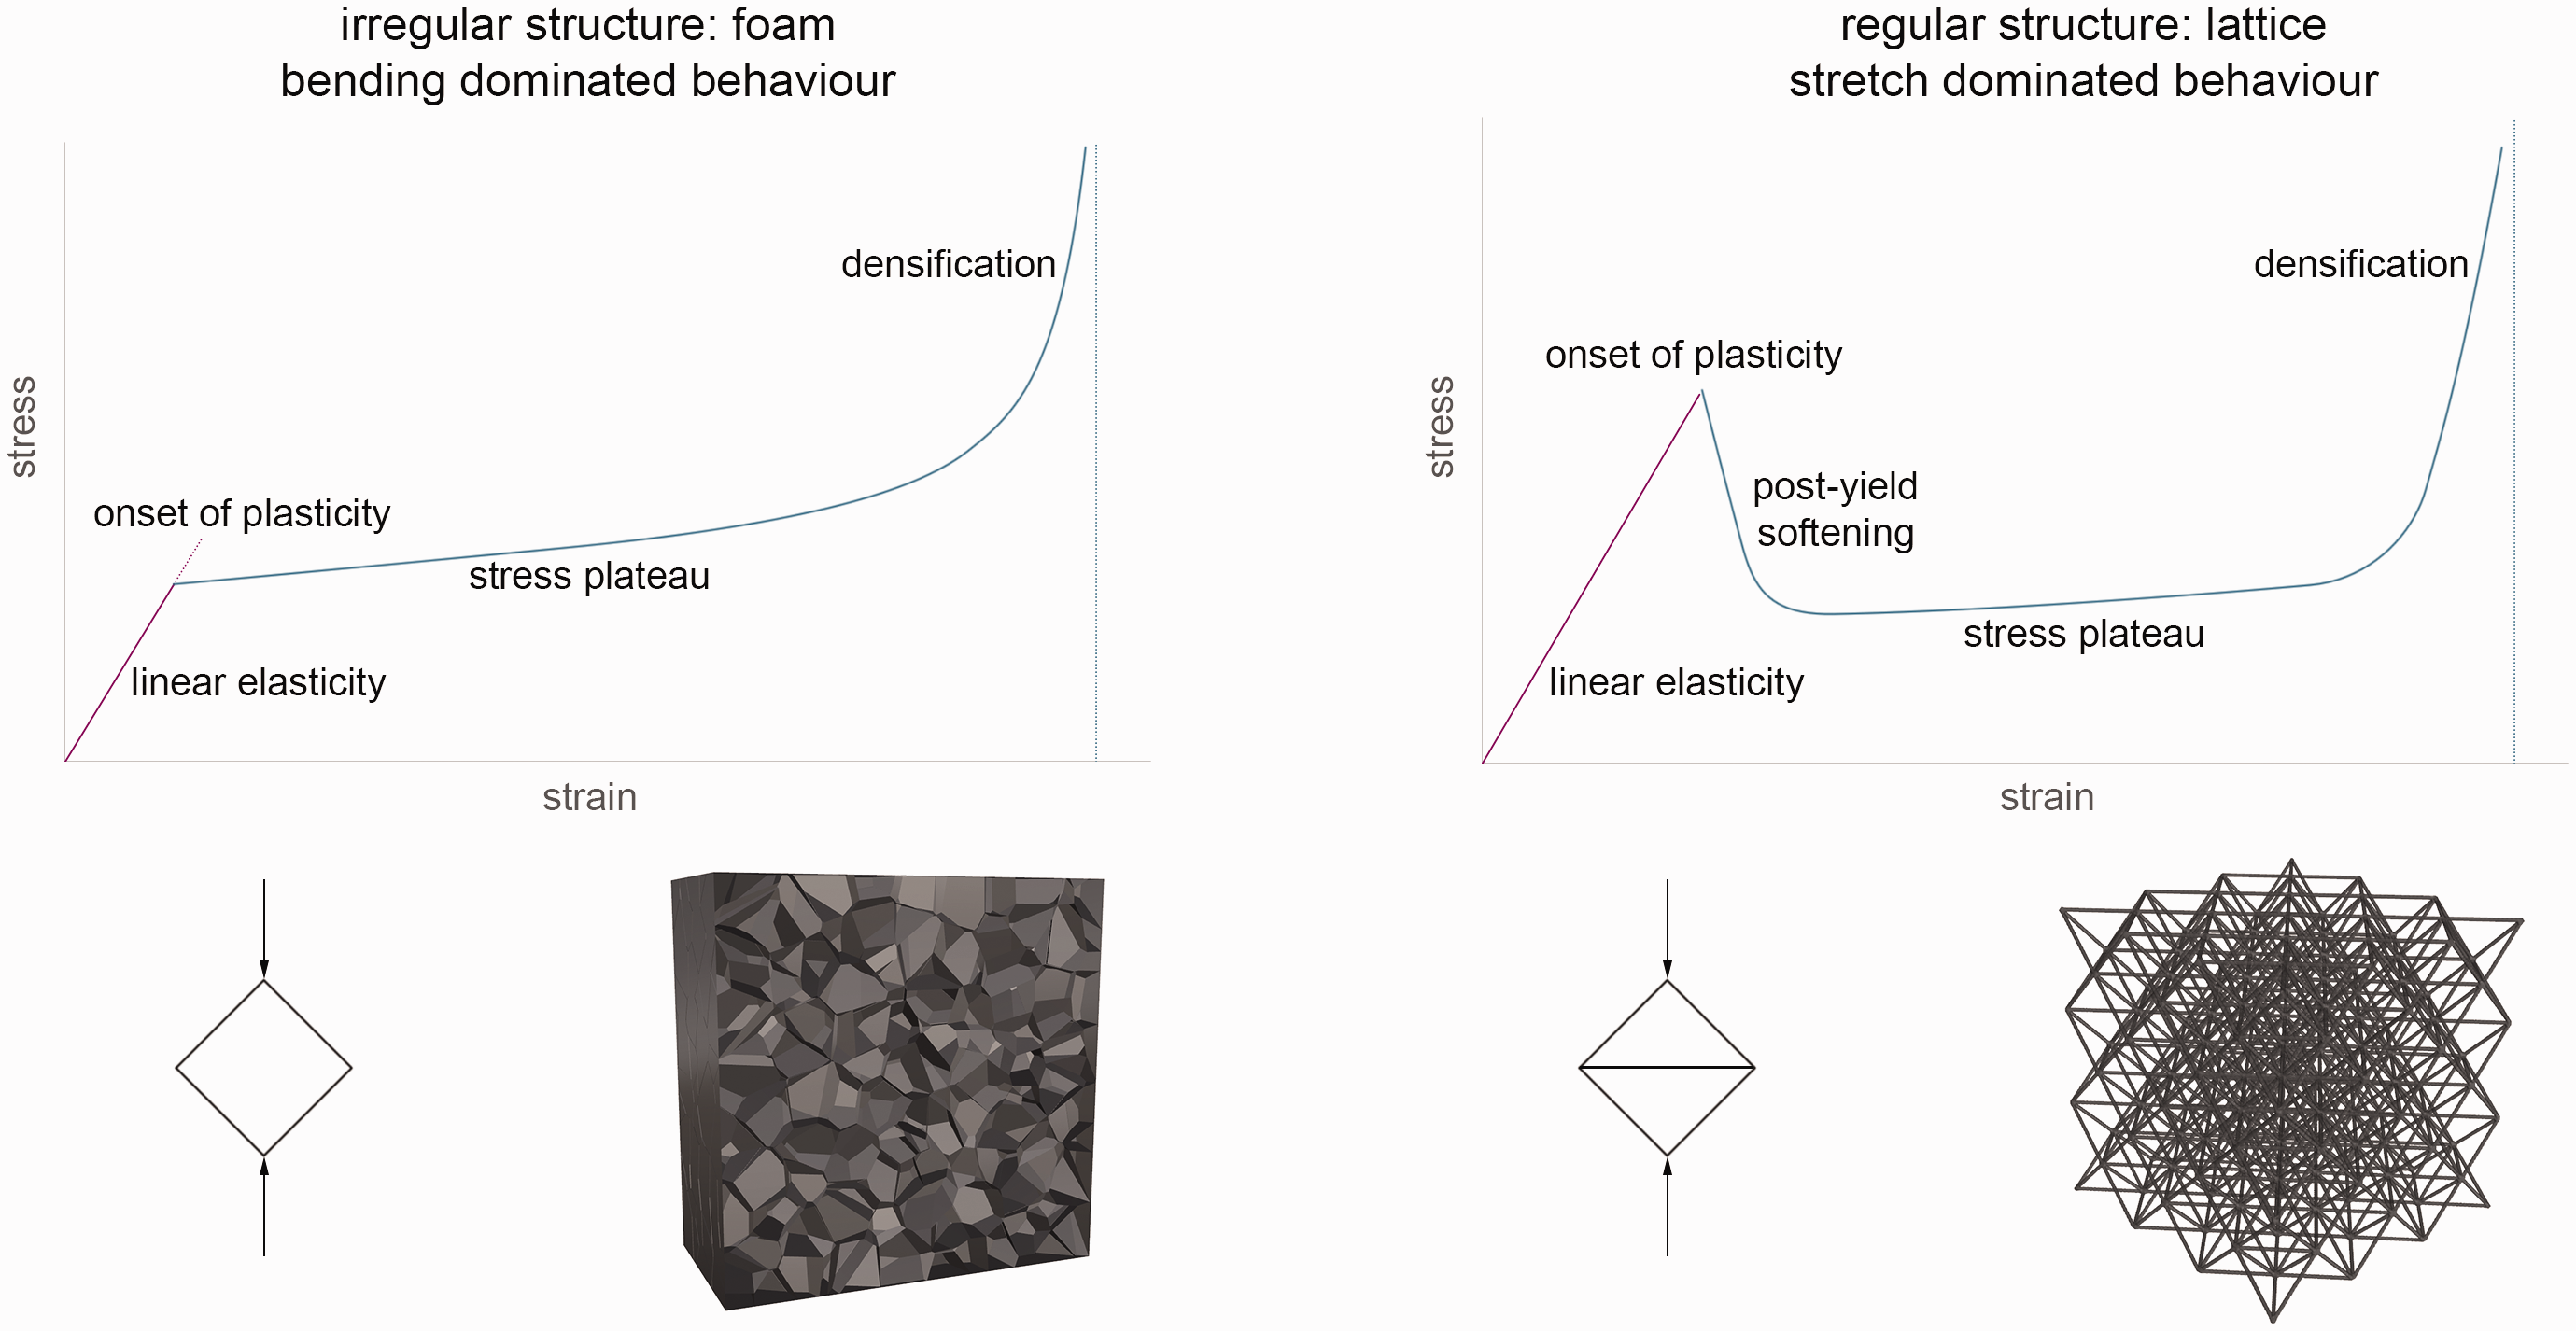
Illustration of structures with bending (left) and stretch dominated behaviour (right).1
As already mentioned a foam can consist of open or closed cells. A closed cell contains line like cell edges, cell vertices and cell faces whereas an open cell contains beam like cell edges with a constant cross section and cell vertices.28,29 In Figure 4(a) and (b) a representative closed and open cell is shown and an illustration which shows a cell vertex, cell edge and cell face of a closed cell foam is depicted. The faces are drawn perfectly flat but in reality they are not.30,31 Due to the gas pressure in closed cells and the production process, the shape of the cell faces can deviate from an ideal planar form.31 The faces may be curved or corrugated. The non planar shape leads to a significant reduction of the stiffness and peak stress of the foam.31–33 The stiffness is more affected by the non perfect faces than the peak stress.33 Thickness variations can also occur in the cell faces, which also lead to a decrease in stiffness but they are not that severe as wavy imperfections.34,35 In open cell foams, imperfections can occur in the edges. The edges are often represented as straight beams but they can also have wavy imperfections like the faces in a closed cell foam. The imperfection reduces the stiffness of the open cell foam significantly.32 The edges of an idealized closed cell foam are assumed as straight lines but this assumption is only valid for so called dry foams.30 Closed cell foams contain a matrix material where gas cells are enclosed. Dependent on the amount of matrix material, a closed cell foam can be divided into dry and wet foams.30,36 In dry foams the amount of matrix material is low and the relative density approaches zero.28 In these structures, most of the material is in the cell face36 and the cell shape is a polyhedron.31 In wet foams the matrix material content is higher and it is mostly placed in the edges. Here, edges are represented by so called Plateau borders.28 The cross section of a Plateau border has the shape of three arcs with constant radius.37 Due to the formation of Plateau borders, wet foams have a rather spherical shape31 (Figure 4(c)). Independent of the shape of the edge, the edges of a foam cell meet in points, the cell vertices.
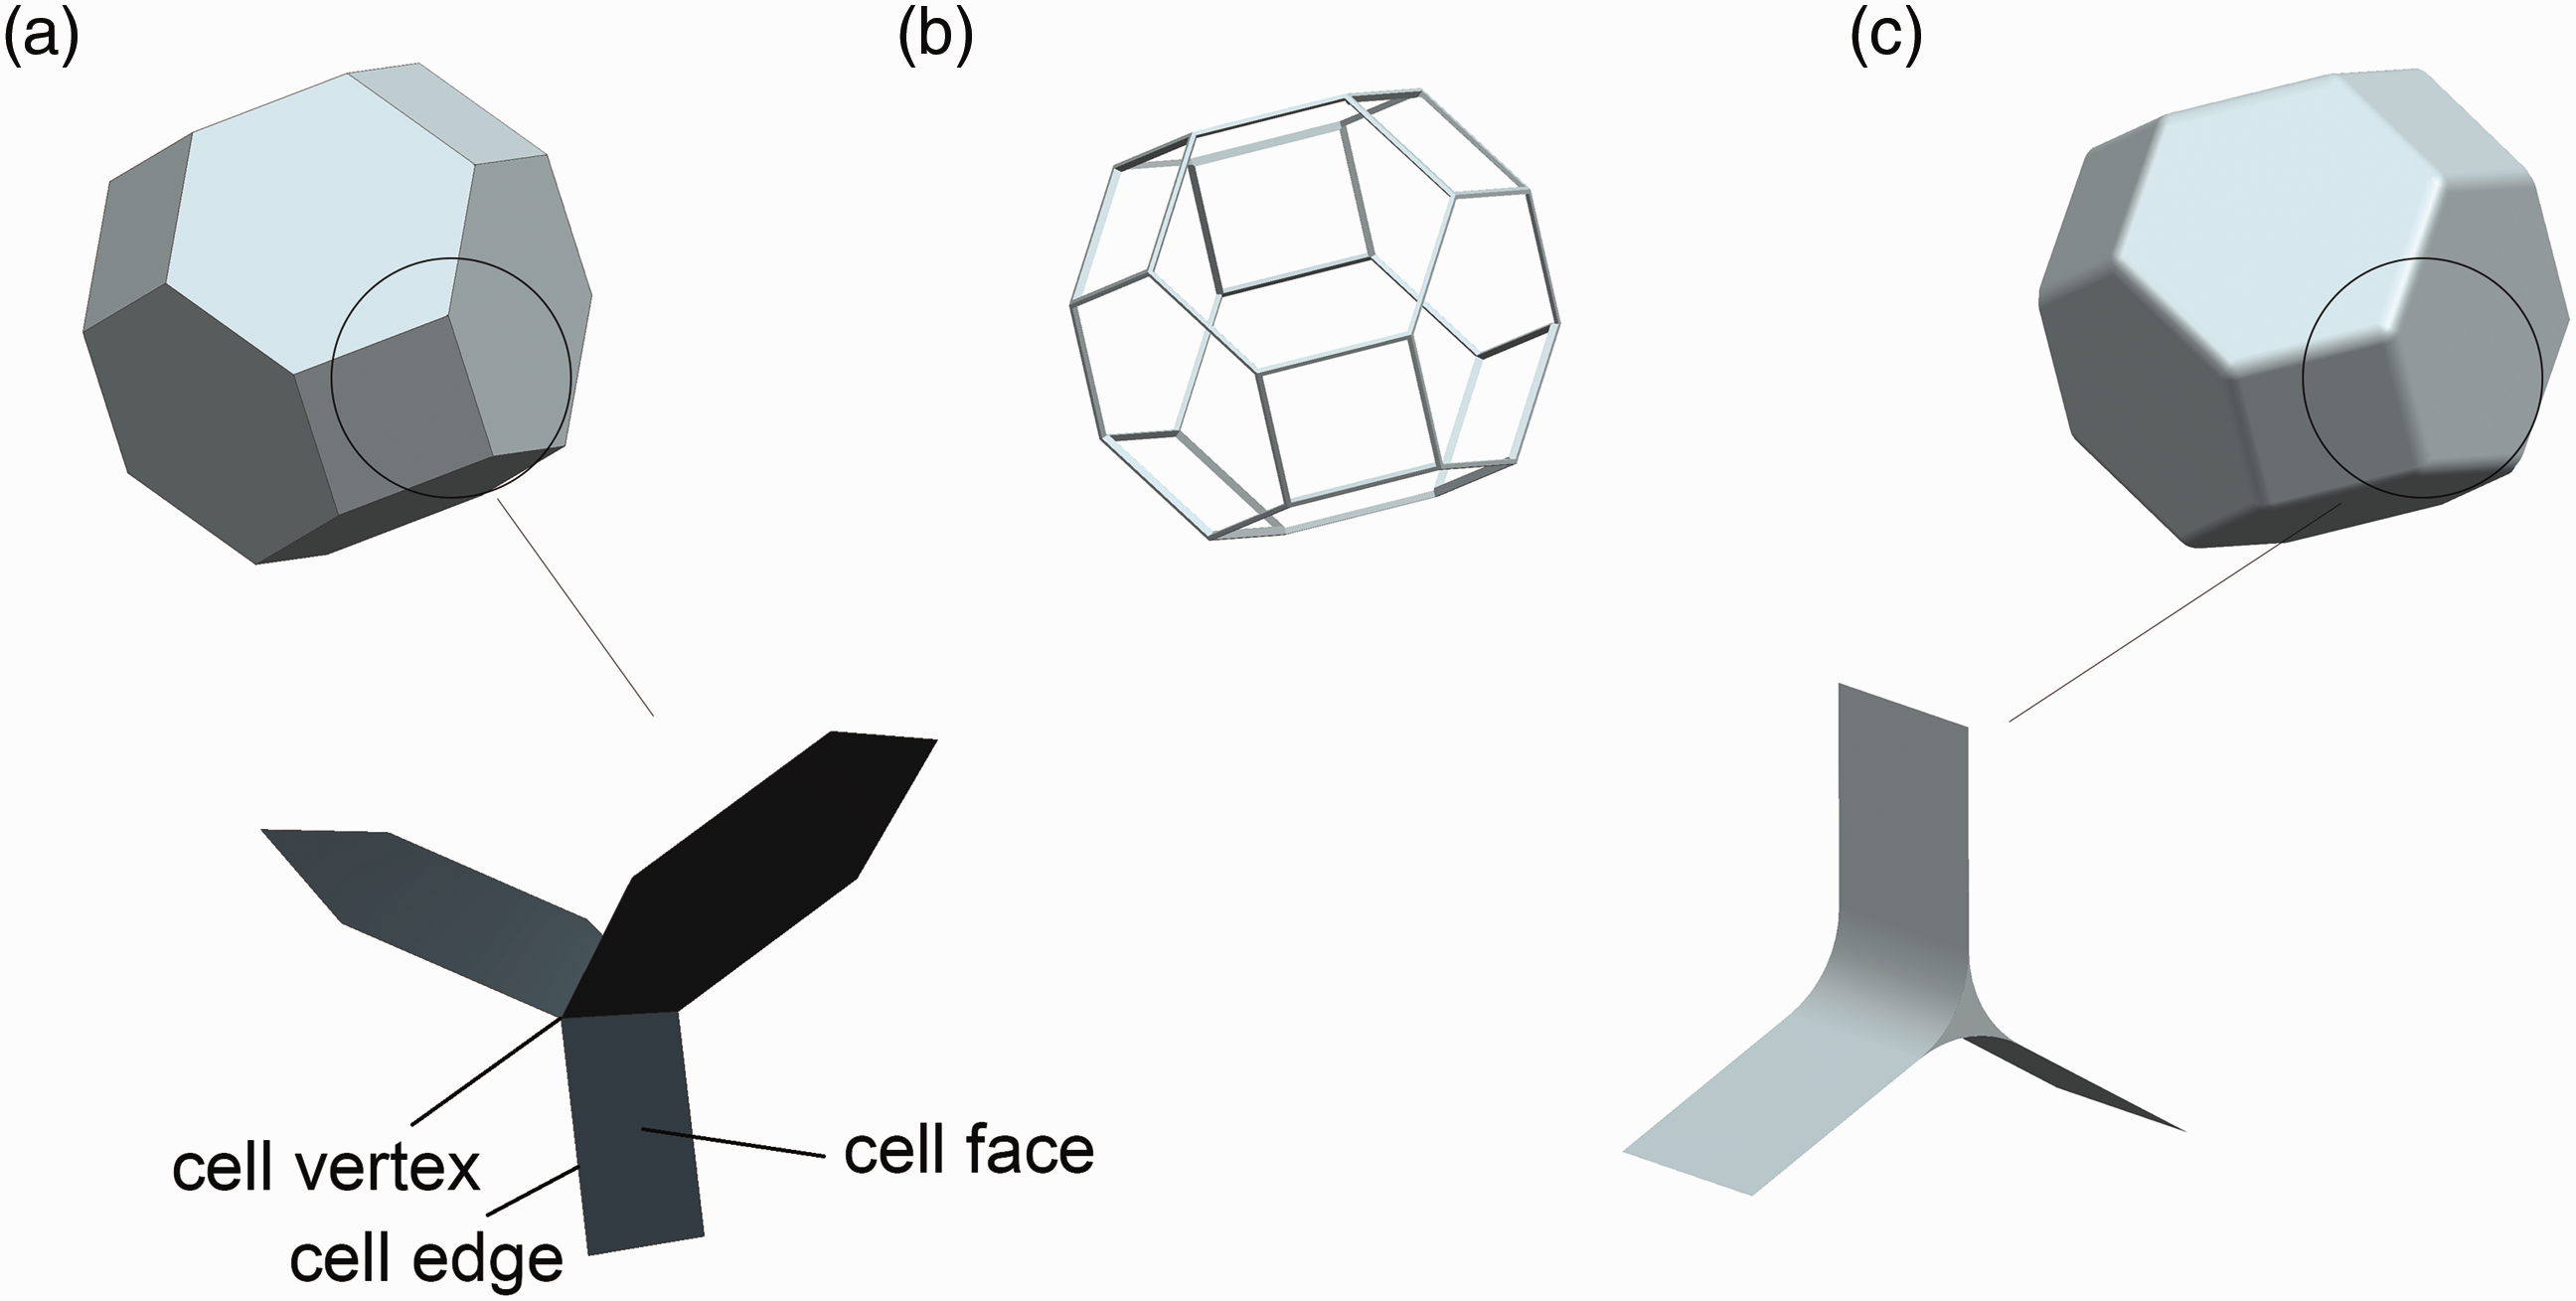
Illustration of (a) dry closed cell with cell edge, cell vertex and cell face, (b) open cell and (c) wet closed cell with Plateau border.28
As already mentioned in Section “Bulk material properties”, the cell shape depends on the bulk material and on processing and post-processing operations because these variables determine the nucleation, growth and expansion of the gas bubbles in the melt. A foam with high density is formed if the gas bubbles only disperse in the melt and then stabilize without any further growing (Figure 5(a)). If the gas bubbles expand and not only disperse in the melt the density is reduced. The minimum density with spherical bubbles of equal size is defined by the maximum packing of spheres (Figure 5(b)). If the expansion continues, the bubbles touch each other and either a dry (Figure 5(c)) or a wet foam with the characteristic Plateau borders (Figure 5(d)) is formed. The faces of the wet closed cell foam can rupture, which produces an open cell foam25,28 (Figure 5(e)). The edges of this open cell foam do not have a constant cross section any more as they have the Plateau border cross section near the vertices. In general, foams made of thermoplastic polymers form closed cells.28
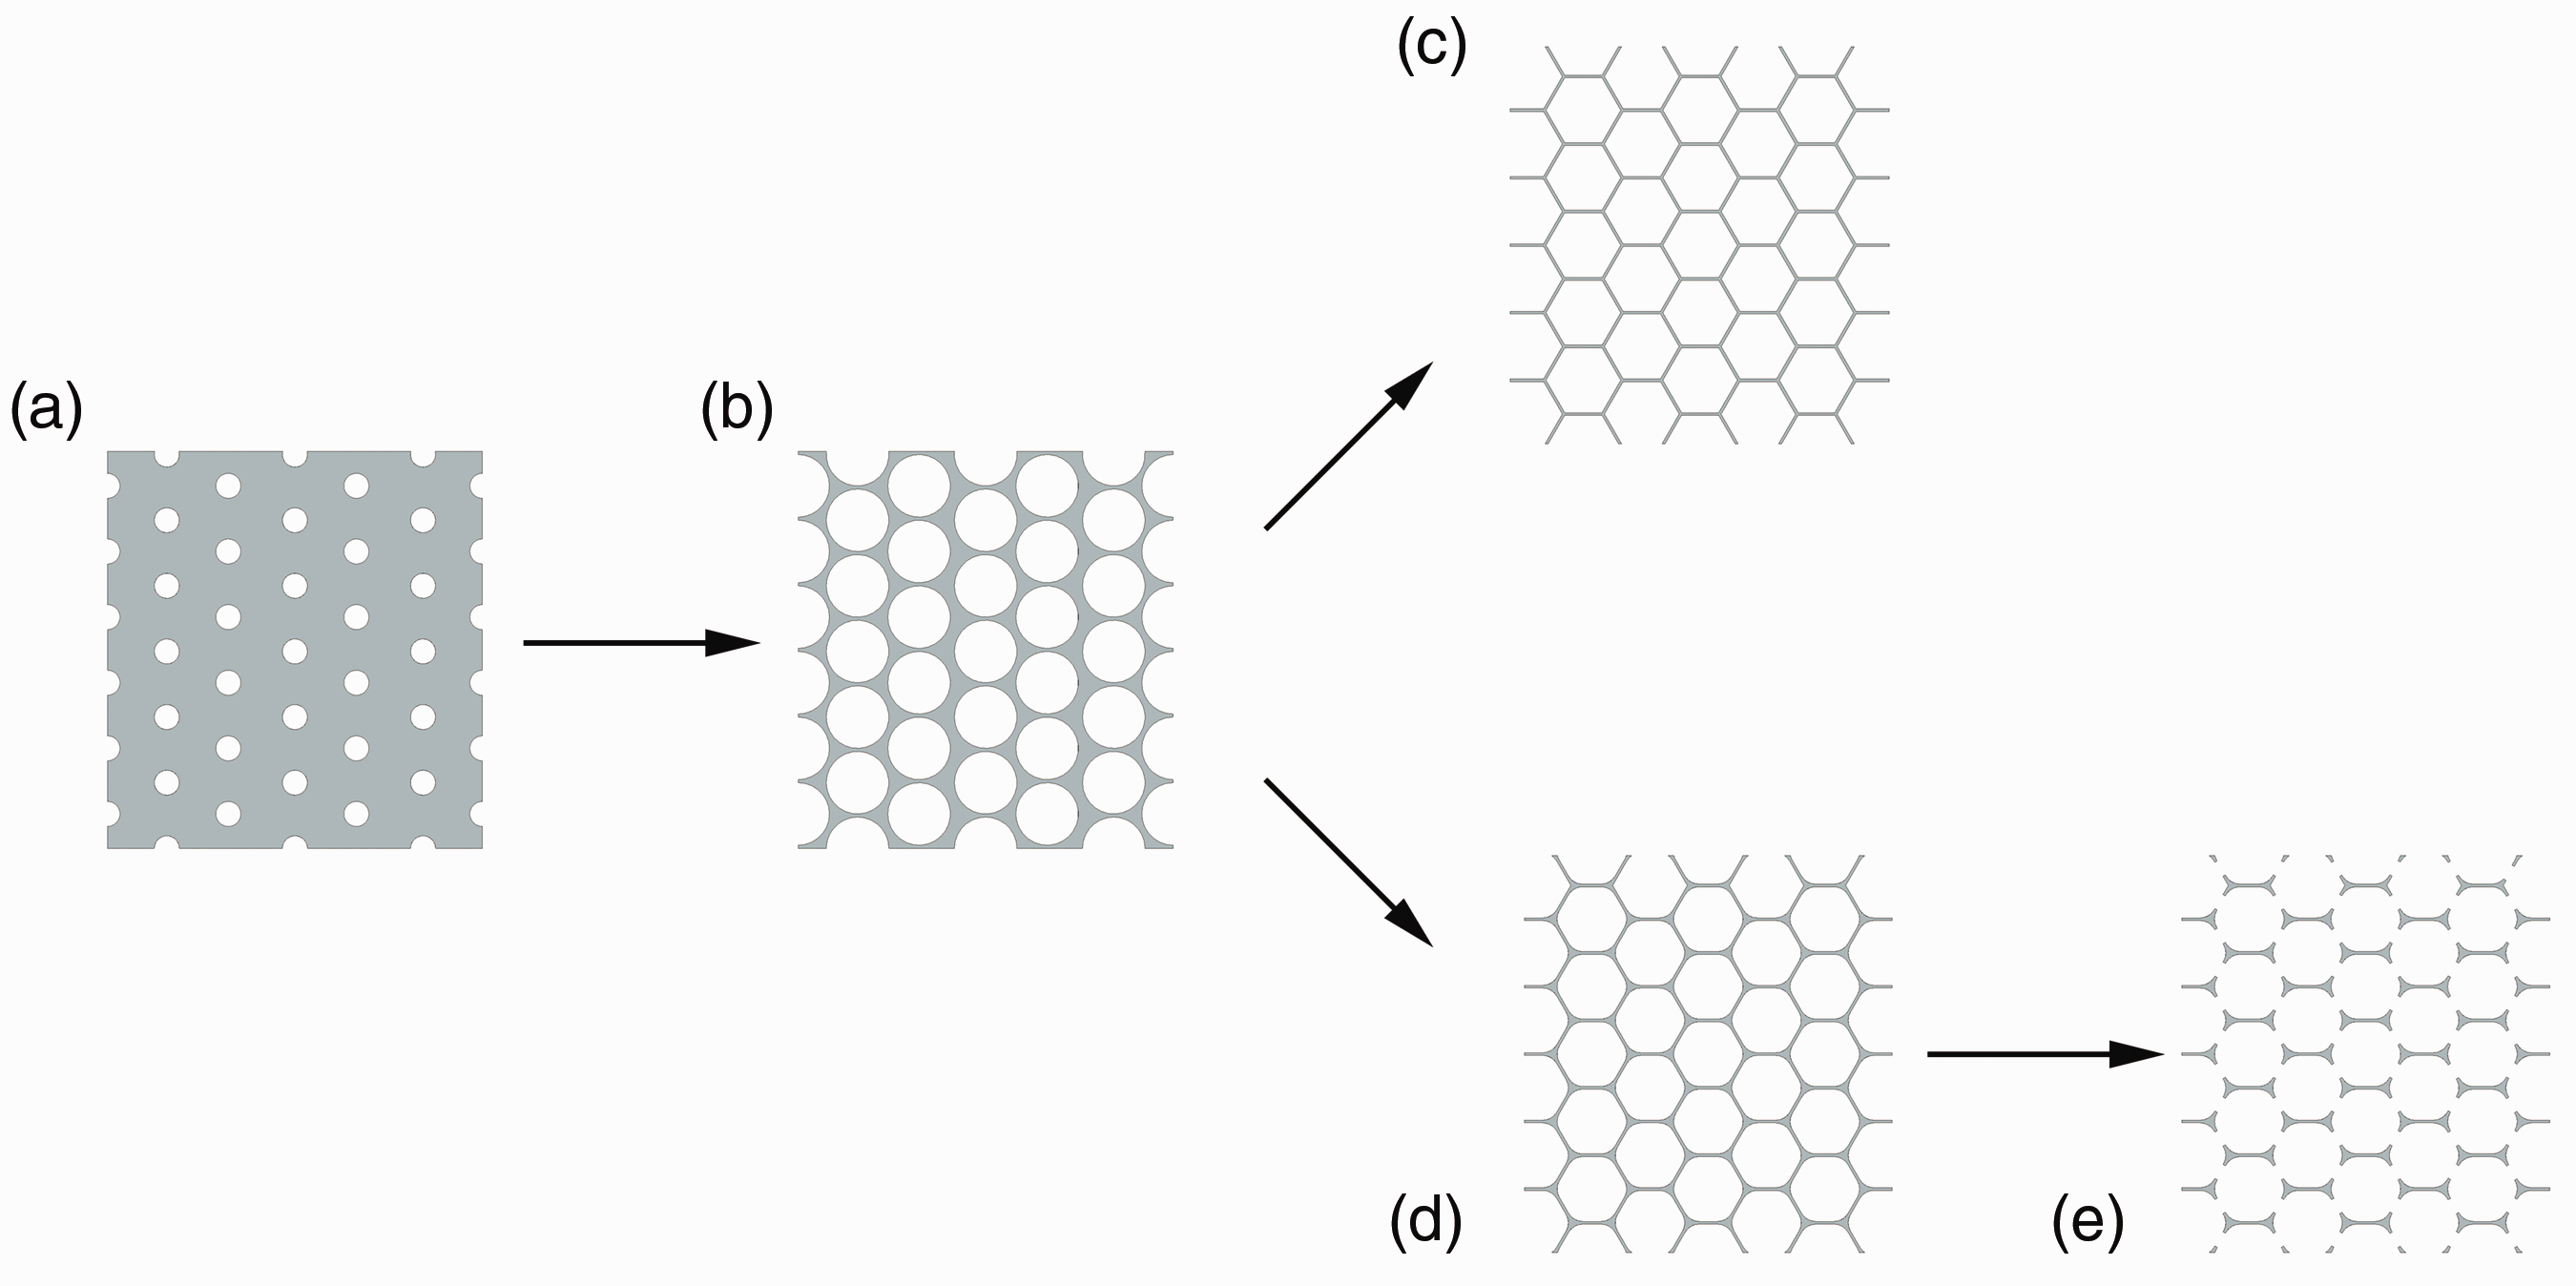
Illustration of different foam types forming during foaming process.38
A further classification of foams can be made based on their cell size:39 macrocellular foams: cell diameter > 100 µm microcellular foams: 1 µm < cell diameter < 100 µm ultra-microcellular foams: 0.1 µm < cell diameter < 1 µm nanocellular foams: 1 nm < cell diameter < 100 nm
Which cell size is present in the foam depends on the bulk material composition and on several process conditions like the foaming temperature (most crucial parameter) and content of the foaming agent.40,41
In the previous considerations the cell size was assumed to be constant but the microstructure of a real foam consists of a cell size distribution. If cells with different sizes are present, lower foam densities are achieved before the spheres touch each other and a wet or dry foam is formed.28 Based on the cell size distribution one can distinguish foams with a uni-modal or multi-modal distribution. A special case of a multi-modal distribution is a bi-modal distribution. In a bi-modal distribution a foam has two clearly different cell sizes.39 The cell size distribution is mainly influenced by parameters with regard to the nucleation process (e.g. nucleation rate)42 but can also be controlled by process conditions (e.g. foaming temperature)41 and by the formulation of the bulk material.40 In the following, the effect of the cell size and cell size distribution on the mechanical and thermal properties are summarized based on the research of Mohammadian et al.40
The effect of smaller cell size and narrower cell size distribution on the foam properties are: foam modulus increases peak stress increases toughness increases cell density increases therefore the energy absorption and the compressive stress increase thermal conductivity coefficient decreases
In addition to different cell sizes, a foam can exhibit anisotropic cell shapes (Figure 6(a)) and non-uniform cell shapes (Figure 6(b)).
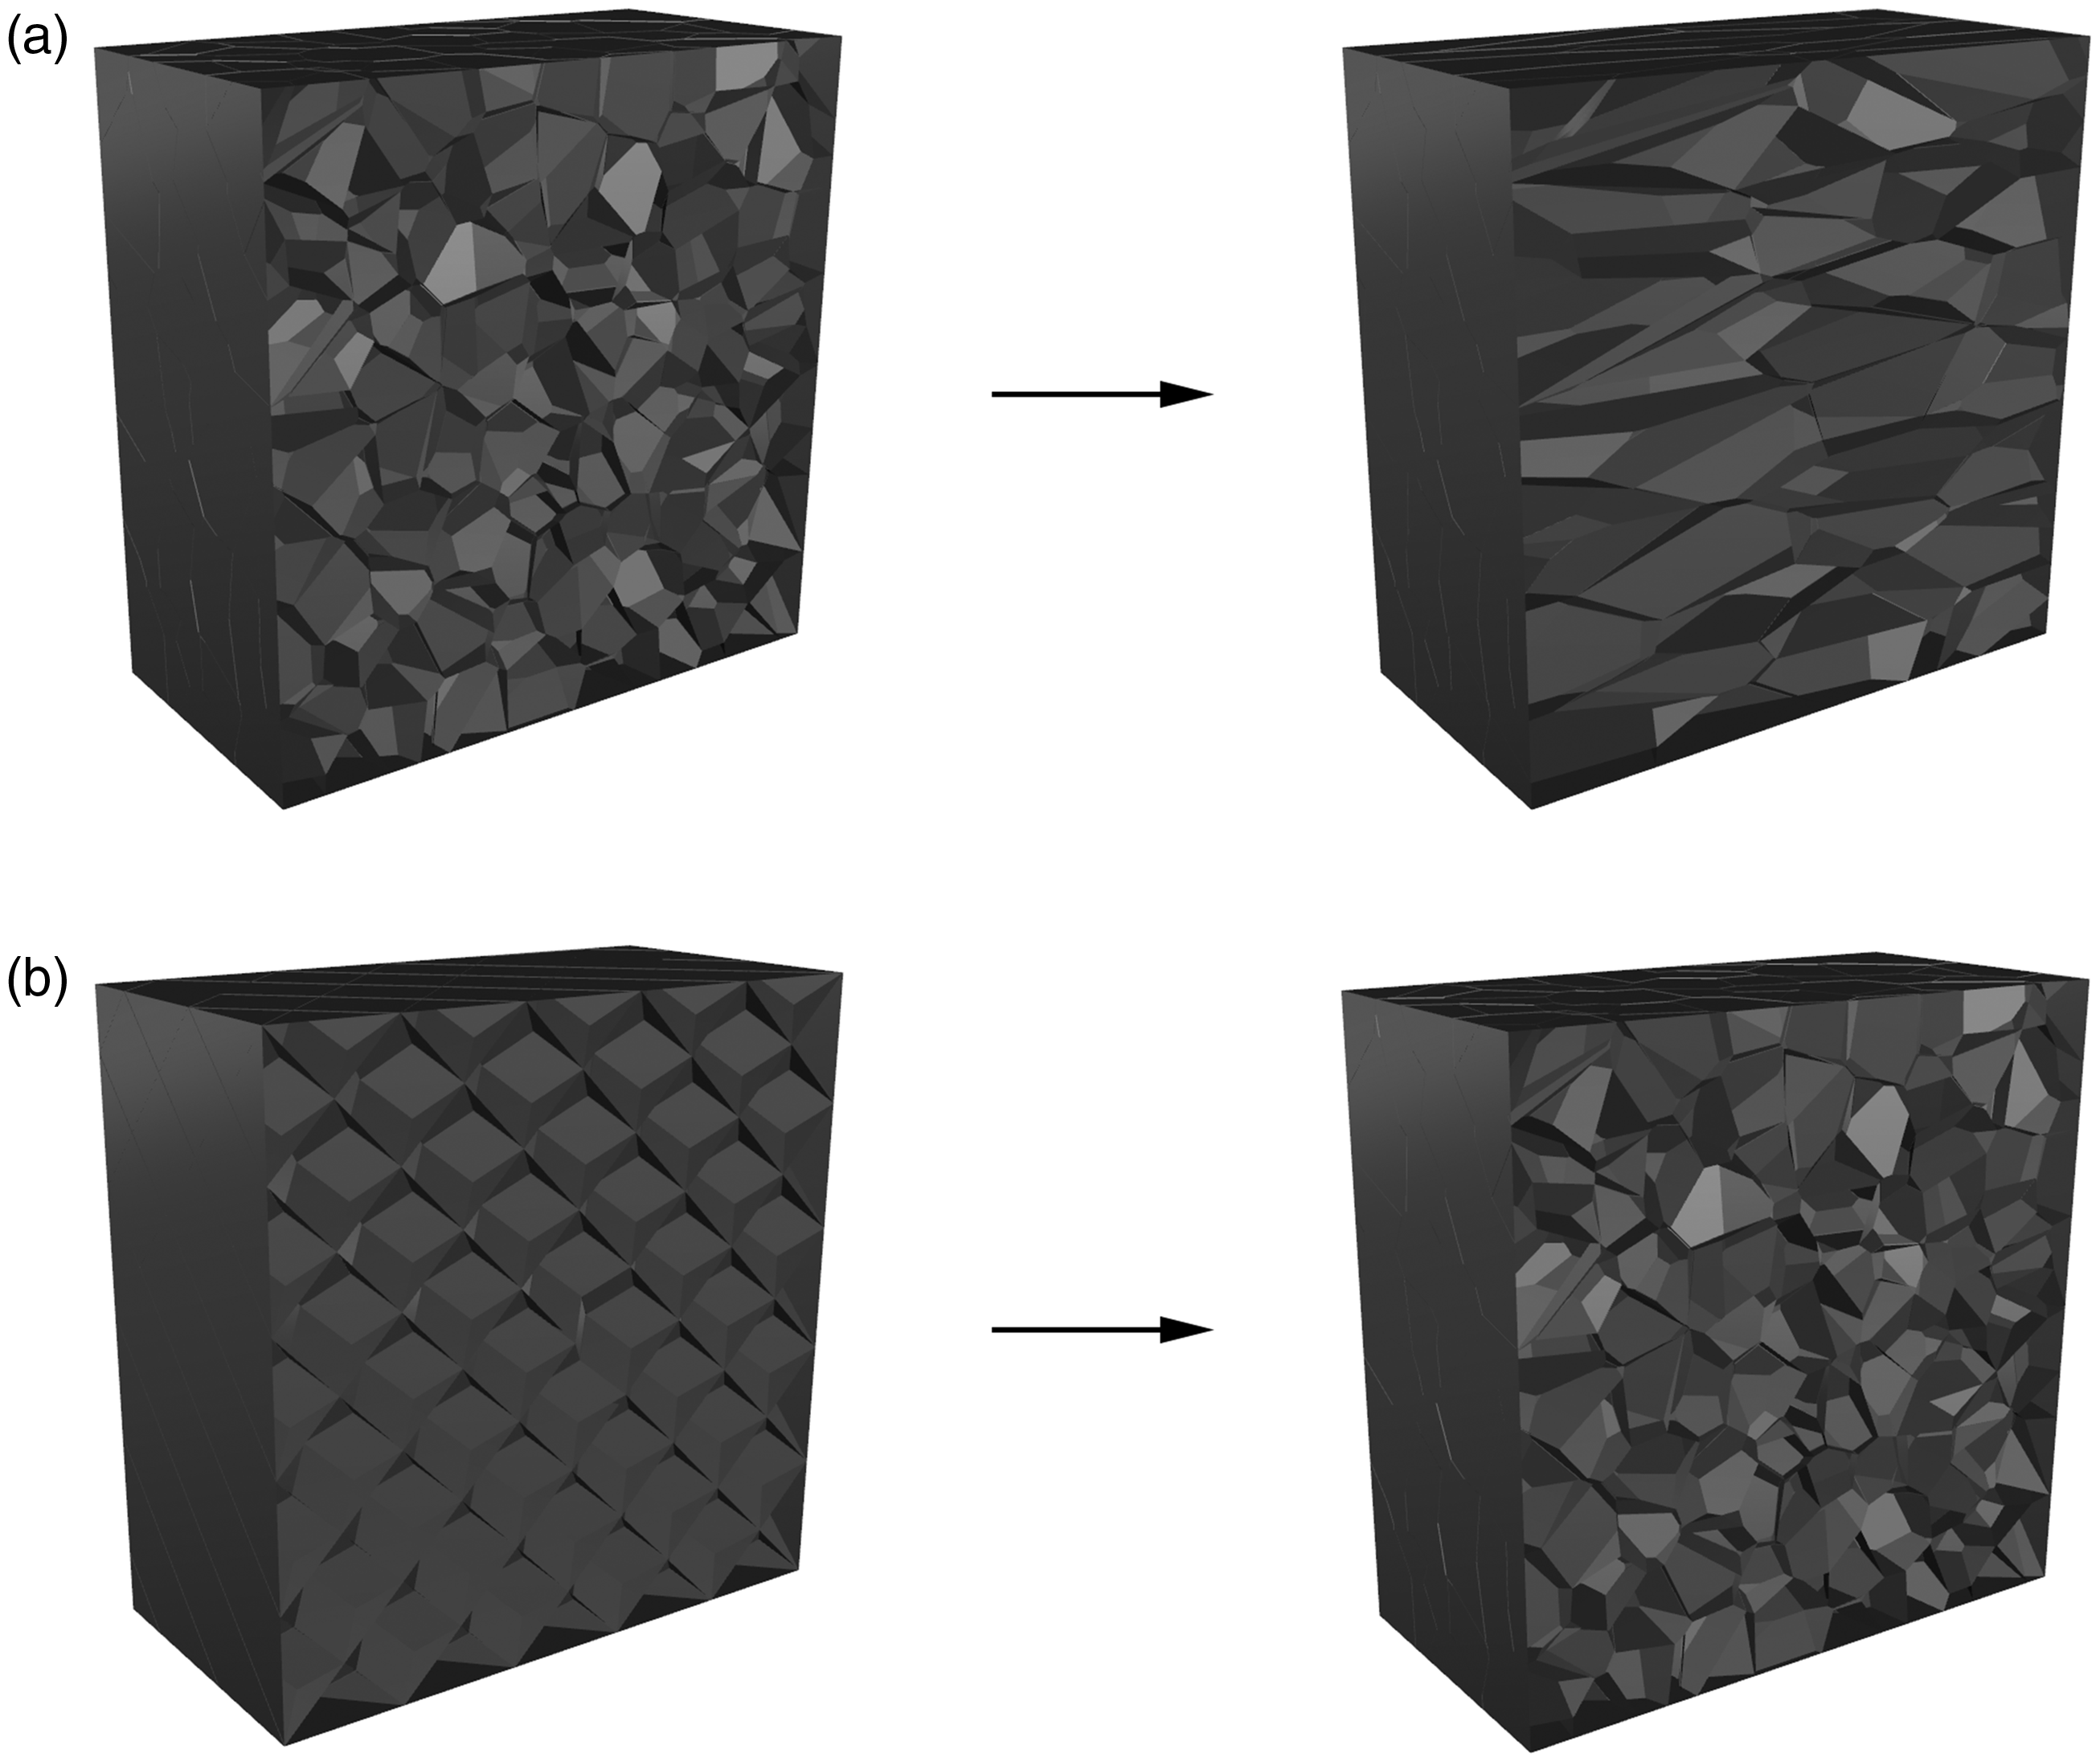
(a) left: foam with isotropic cell shape, right: foam with anisotropic cell shape; (b) left: foam with uniform cell shape, right: foam with non-uniform cell shape.31
The anisotropic cell shape may be caused by the foam production process, which leads to anisotropic properties of the foam.2,25,28,31,43 The non-uniformity of cell shapes can be described by the topological disorder,44 which corresponds to the degree the cell shape differs from the geometrically symmetric polyhedron.31,45 The higher the topological disorder, the more isotropic the properties of a foam are.31
Relative density
The relative density of a cellular material is the ratio of the density of the cellular structure
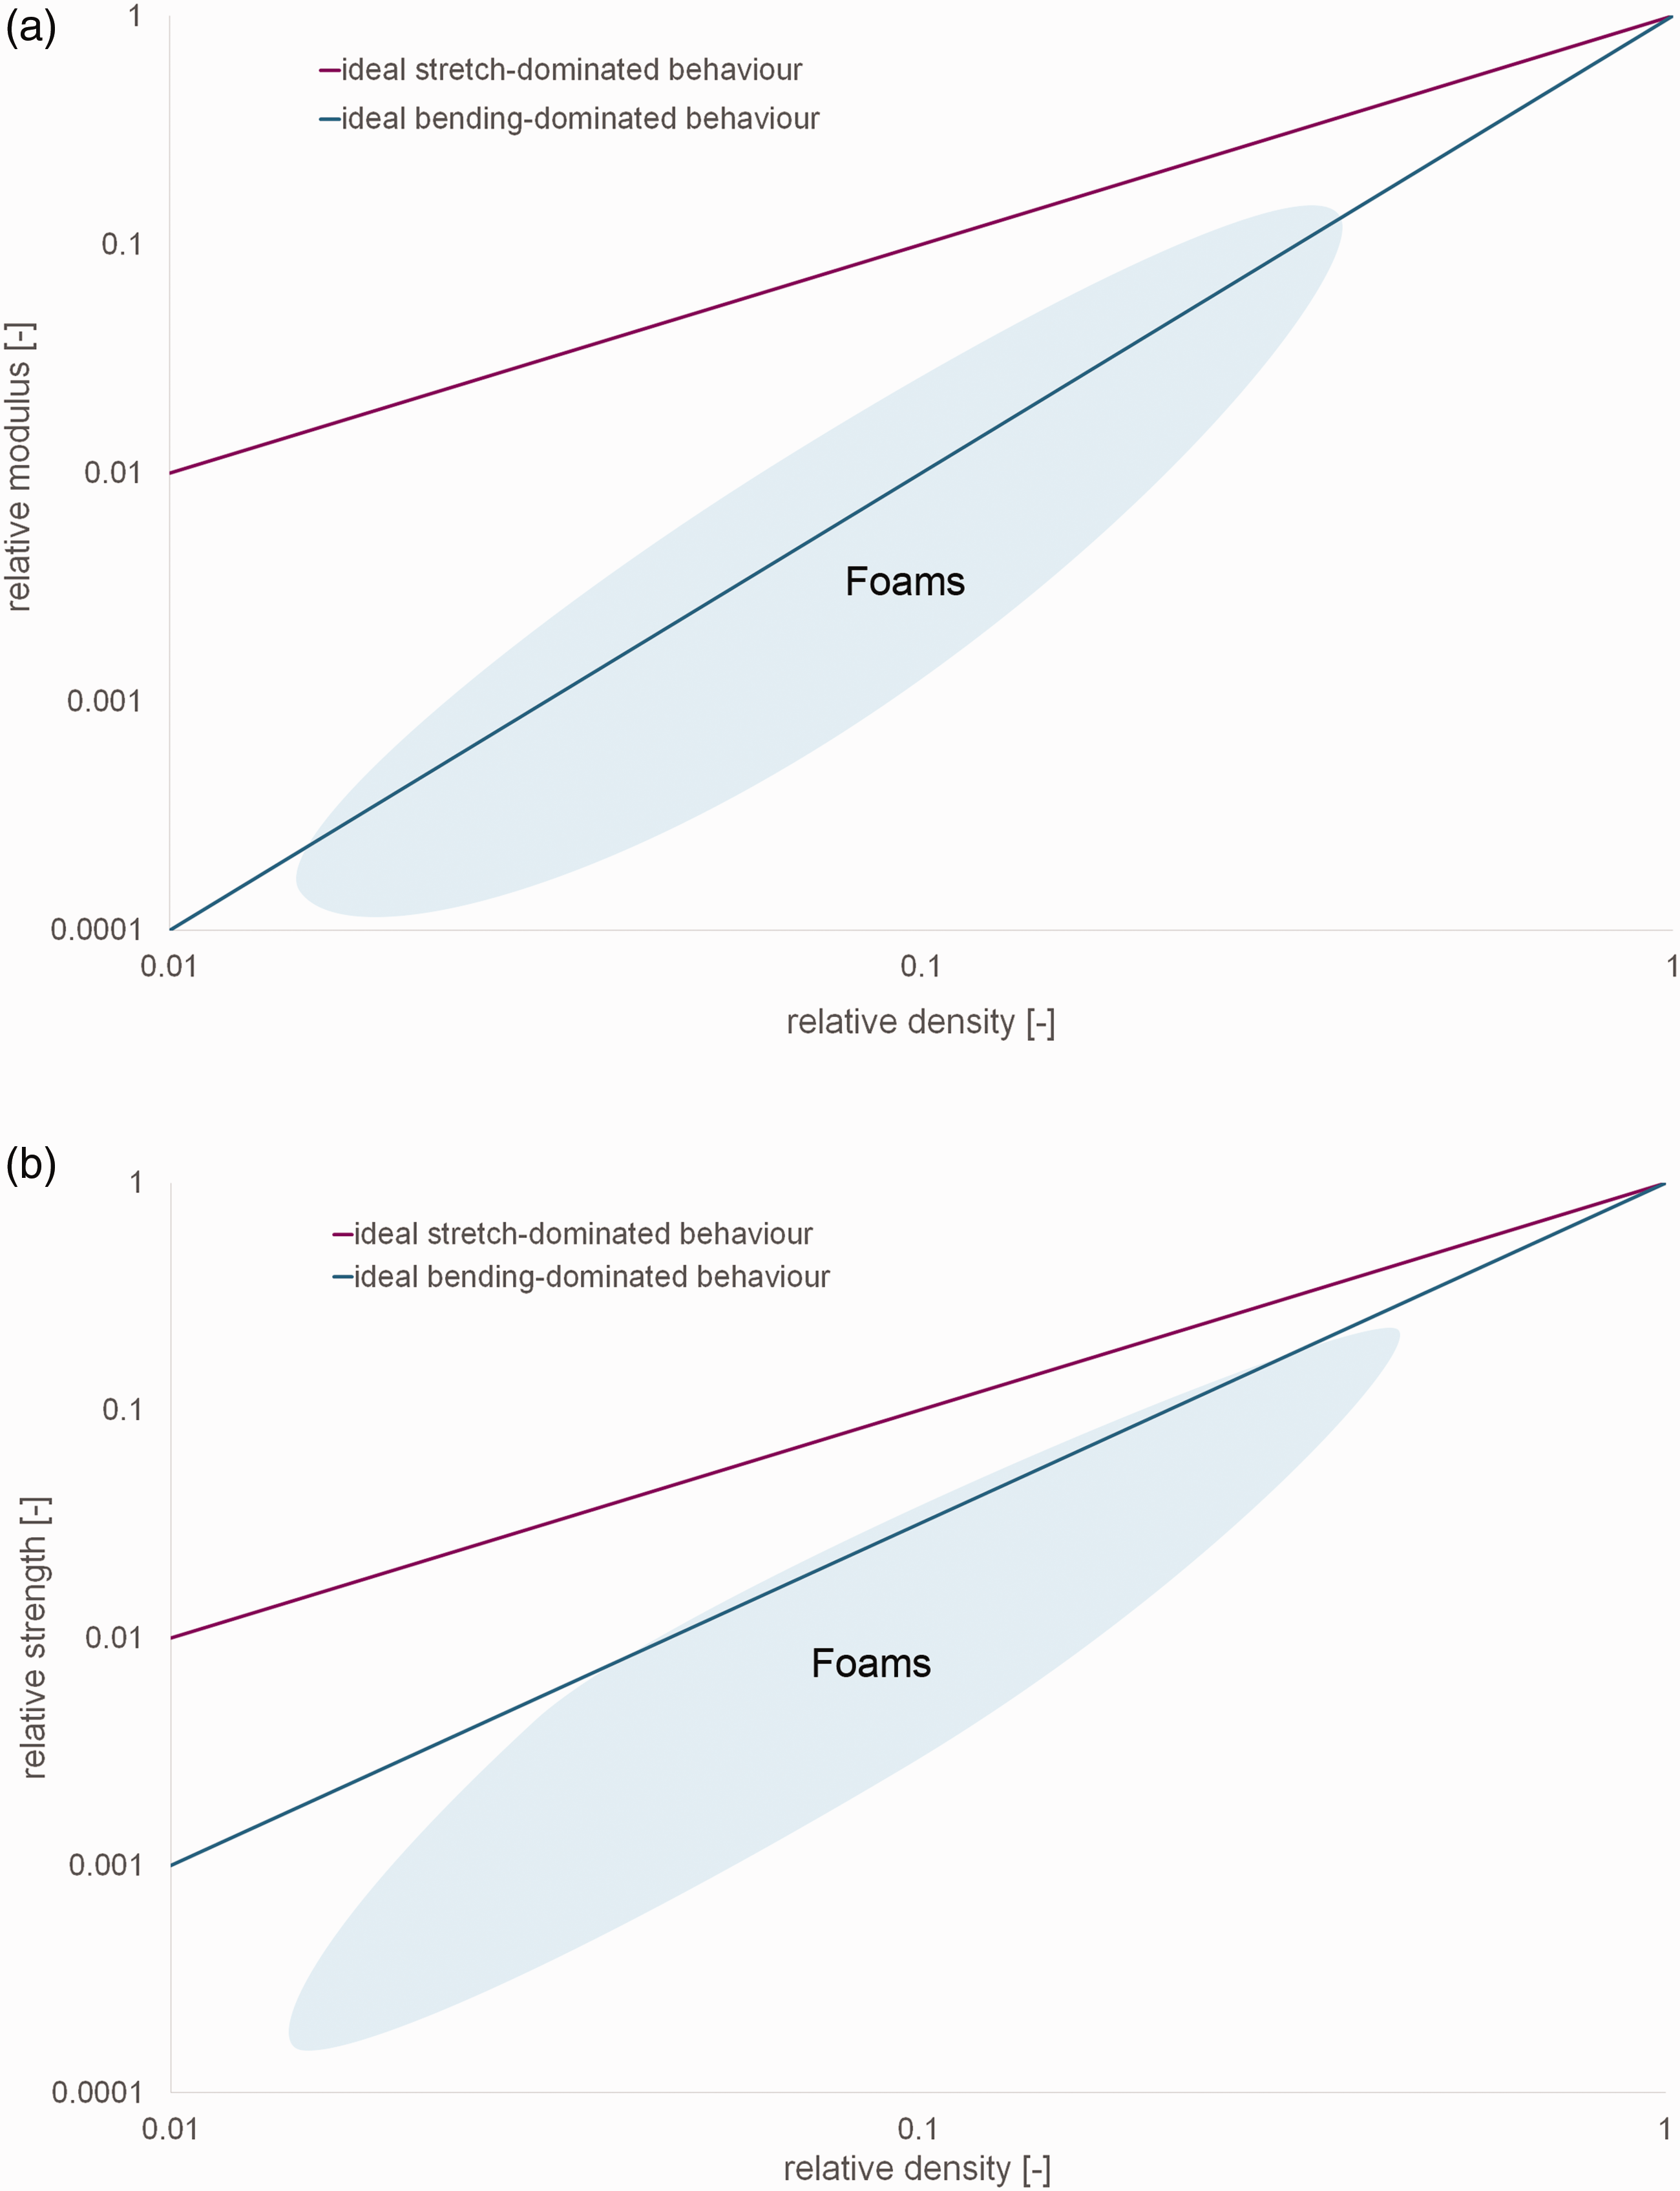
Dependence of the (a) relative modulus and (b) strength on the relative density.1
It can be seen that structures with a stretch dominated behaviour show a higher modulus and strength compared to bending dominated structures. The thermal conductivity of a foam depends linearly on the relative density.40 The relative density itself depends on the average cell size and on the associated factors influencing the cell size (Section “Cell topology and shape”). The smaller the cell size, the lower the density can be.40,46 In general, the density is not constant in a foam. The broadness of the density distribution mainly depends on the foam production process.47,48 For example a micro-cellular polymeric foam, which is produced with a supercritical fluid, exhibits a broad distribution of density through the sample thickness. In such structures, a core with micro-pores and a non-porous skin are formed.
The thickness of the skin depends on process parameters (e.g. saturation pressure).49 The density distribution can be specifically optimized for the application in the field of crash energy absorption.36 Therefore, foam density control is an essential design factor.
Foams can be classified according to their density. While porous materials have a high relative density, cellular materials exhibit low relative densities. There is no exact limit of relative densities for this distinction. In literature a porous material is stated as a composite made of a solid matrix material containing voids. Cellular materials can be seen as a porous material with a high volume fraction of voids where the matrix is connected and reduced to edges and walls.50 In this paper, no distinction between porous or cellular material is made, for all relative densities the term cellular material/solid is used.
Overview of modelling methods for cellular solids
In the following, an overview of the different modelling methods for cellular solids is given. The main focus are models which are mainly applicable for investigating the mechanical properties of foams. However, examples of models which investigate the electrical and thermal properties of foams are also provided. In Figure 8 an overview of modelling methods is shown. The models can be roughly divided into direct and constitutive models.51
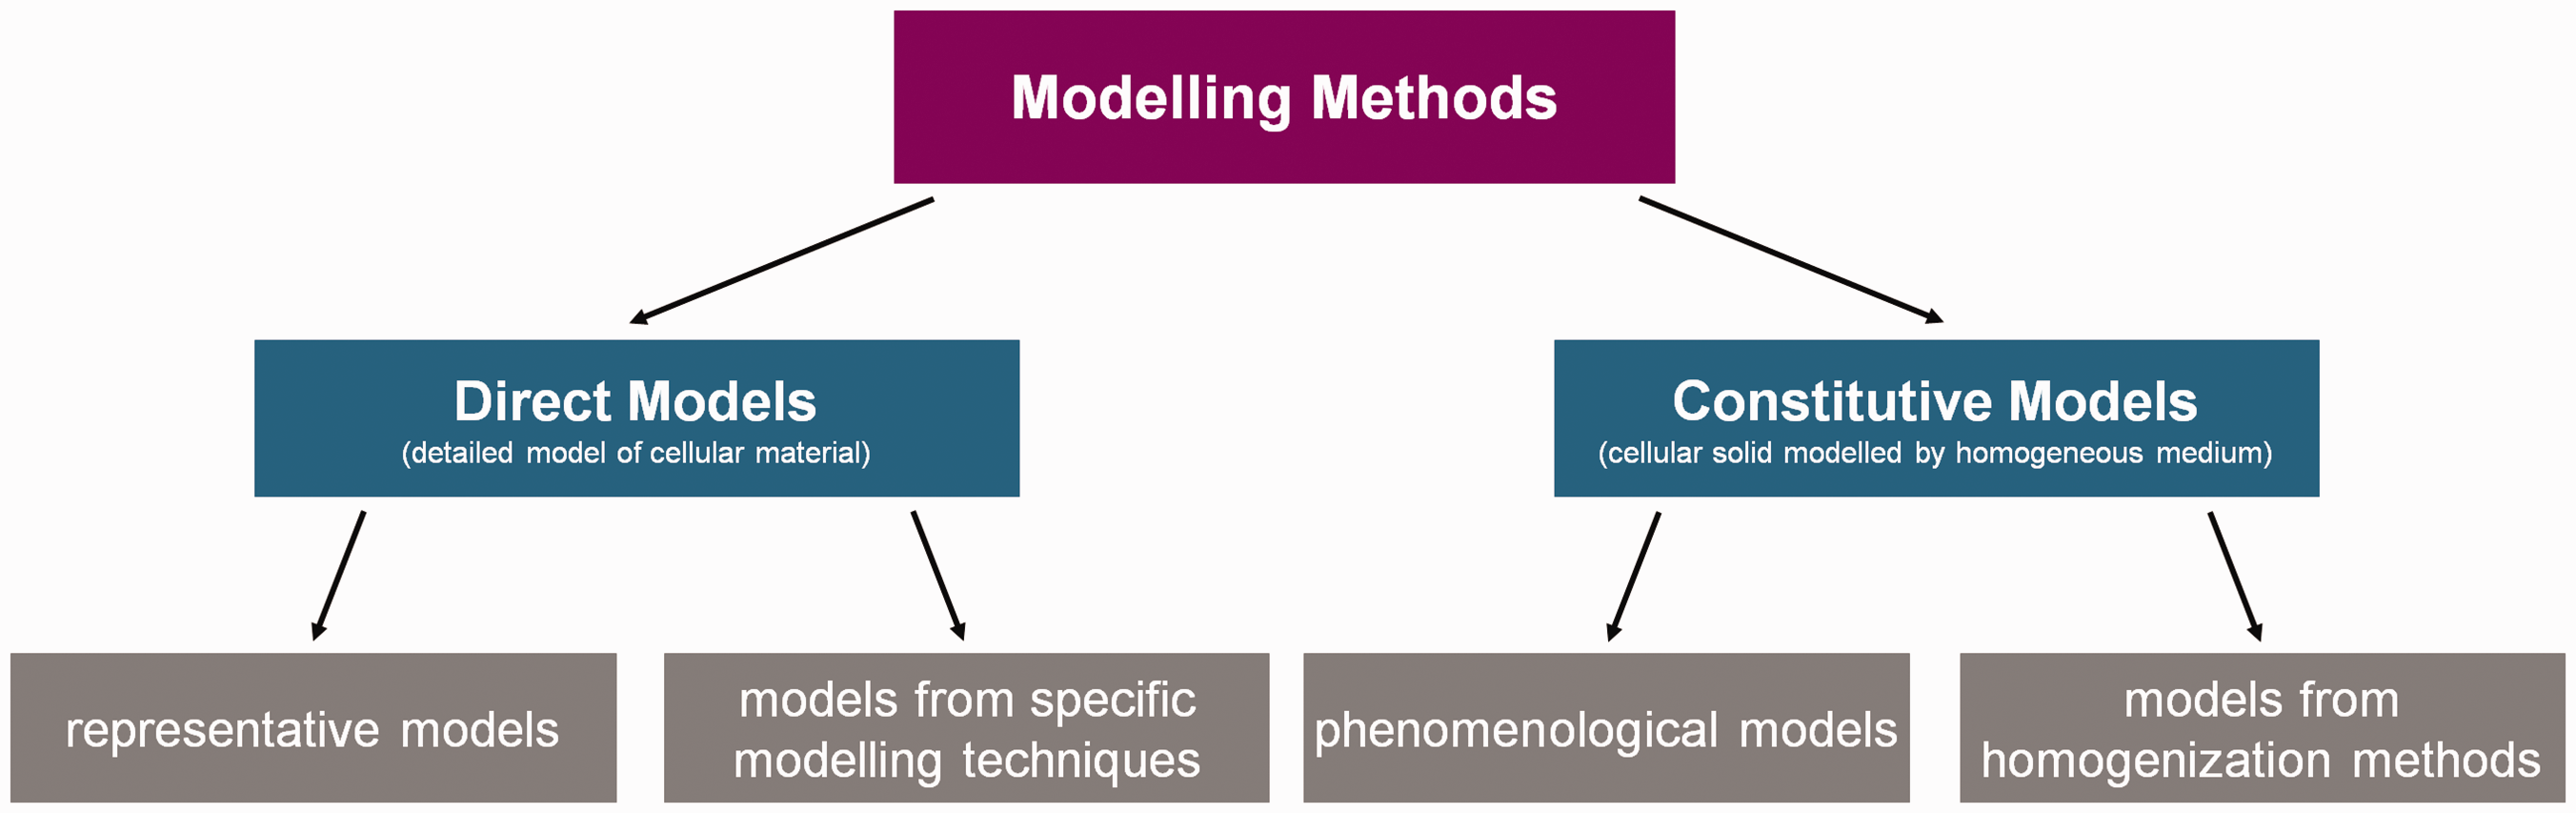
Overview of modelling methods for cellular materials.51
They differ with regard to the description of the cellular microstructure. A detailed model of the foam structure is used in the direct modelling method whereas in the constitutive models the properties of the foam structure are approximated by a homogeneous medium. Descriptions of the methods are given in the next sections.
Direct models
The direct modelling approach utilizes the full description of the foam geometry in every detail. This means, that the components of all cells (cell edge, cell face etc.) in the foam are modelled. There are several models with one defined cell geometry, which is representative for all the cells in the foam. In this paper, they are referred to as representative direct models. In addition, there are models where the microstructure of the foam is the result of a specific modelling technique. As a consequence, the foam model does not consist of one specific cell structure. The microstructure depends on the input parameters for the specific modelling technique. For several direct models an analytical description exists. All direct models can be implemented and analysed in finite element (FE) solvers (e.g. Abaqus, Ansys, LS-Dyna, Marc).
Representative direct models
In Table 1 an overview of several models with a representative cell geometry is given.
Overview of several models with a representative cell geometry.
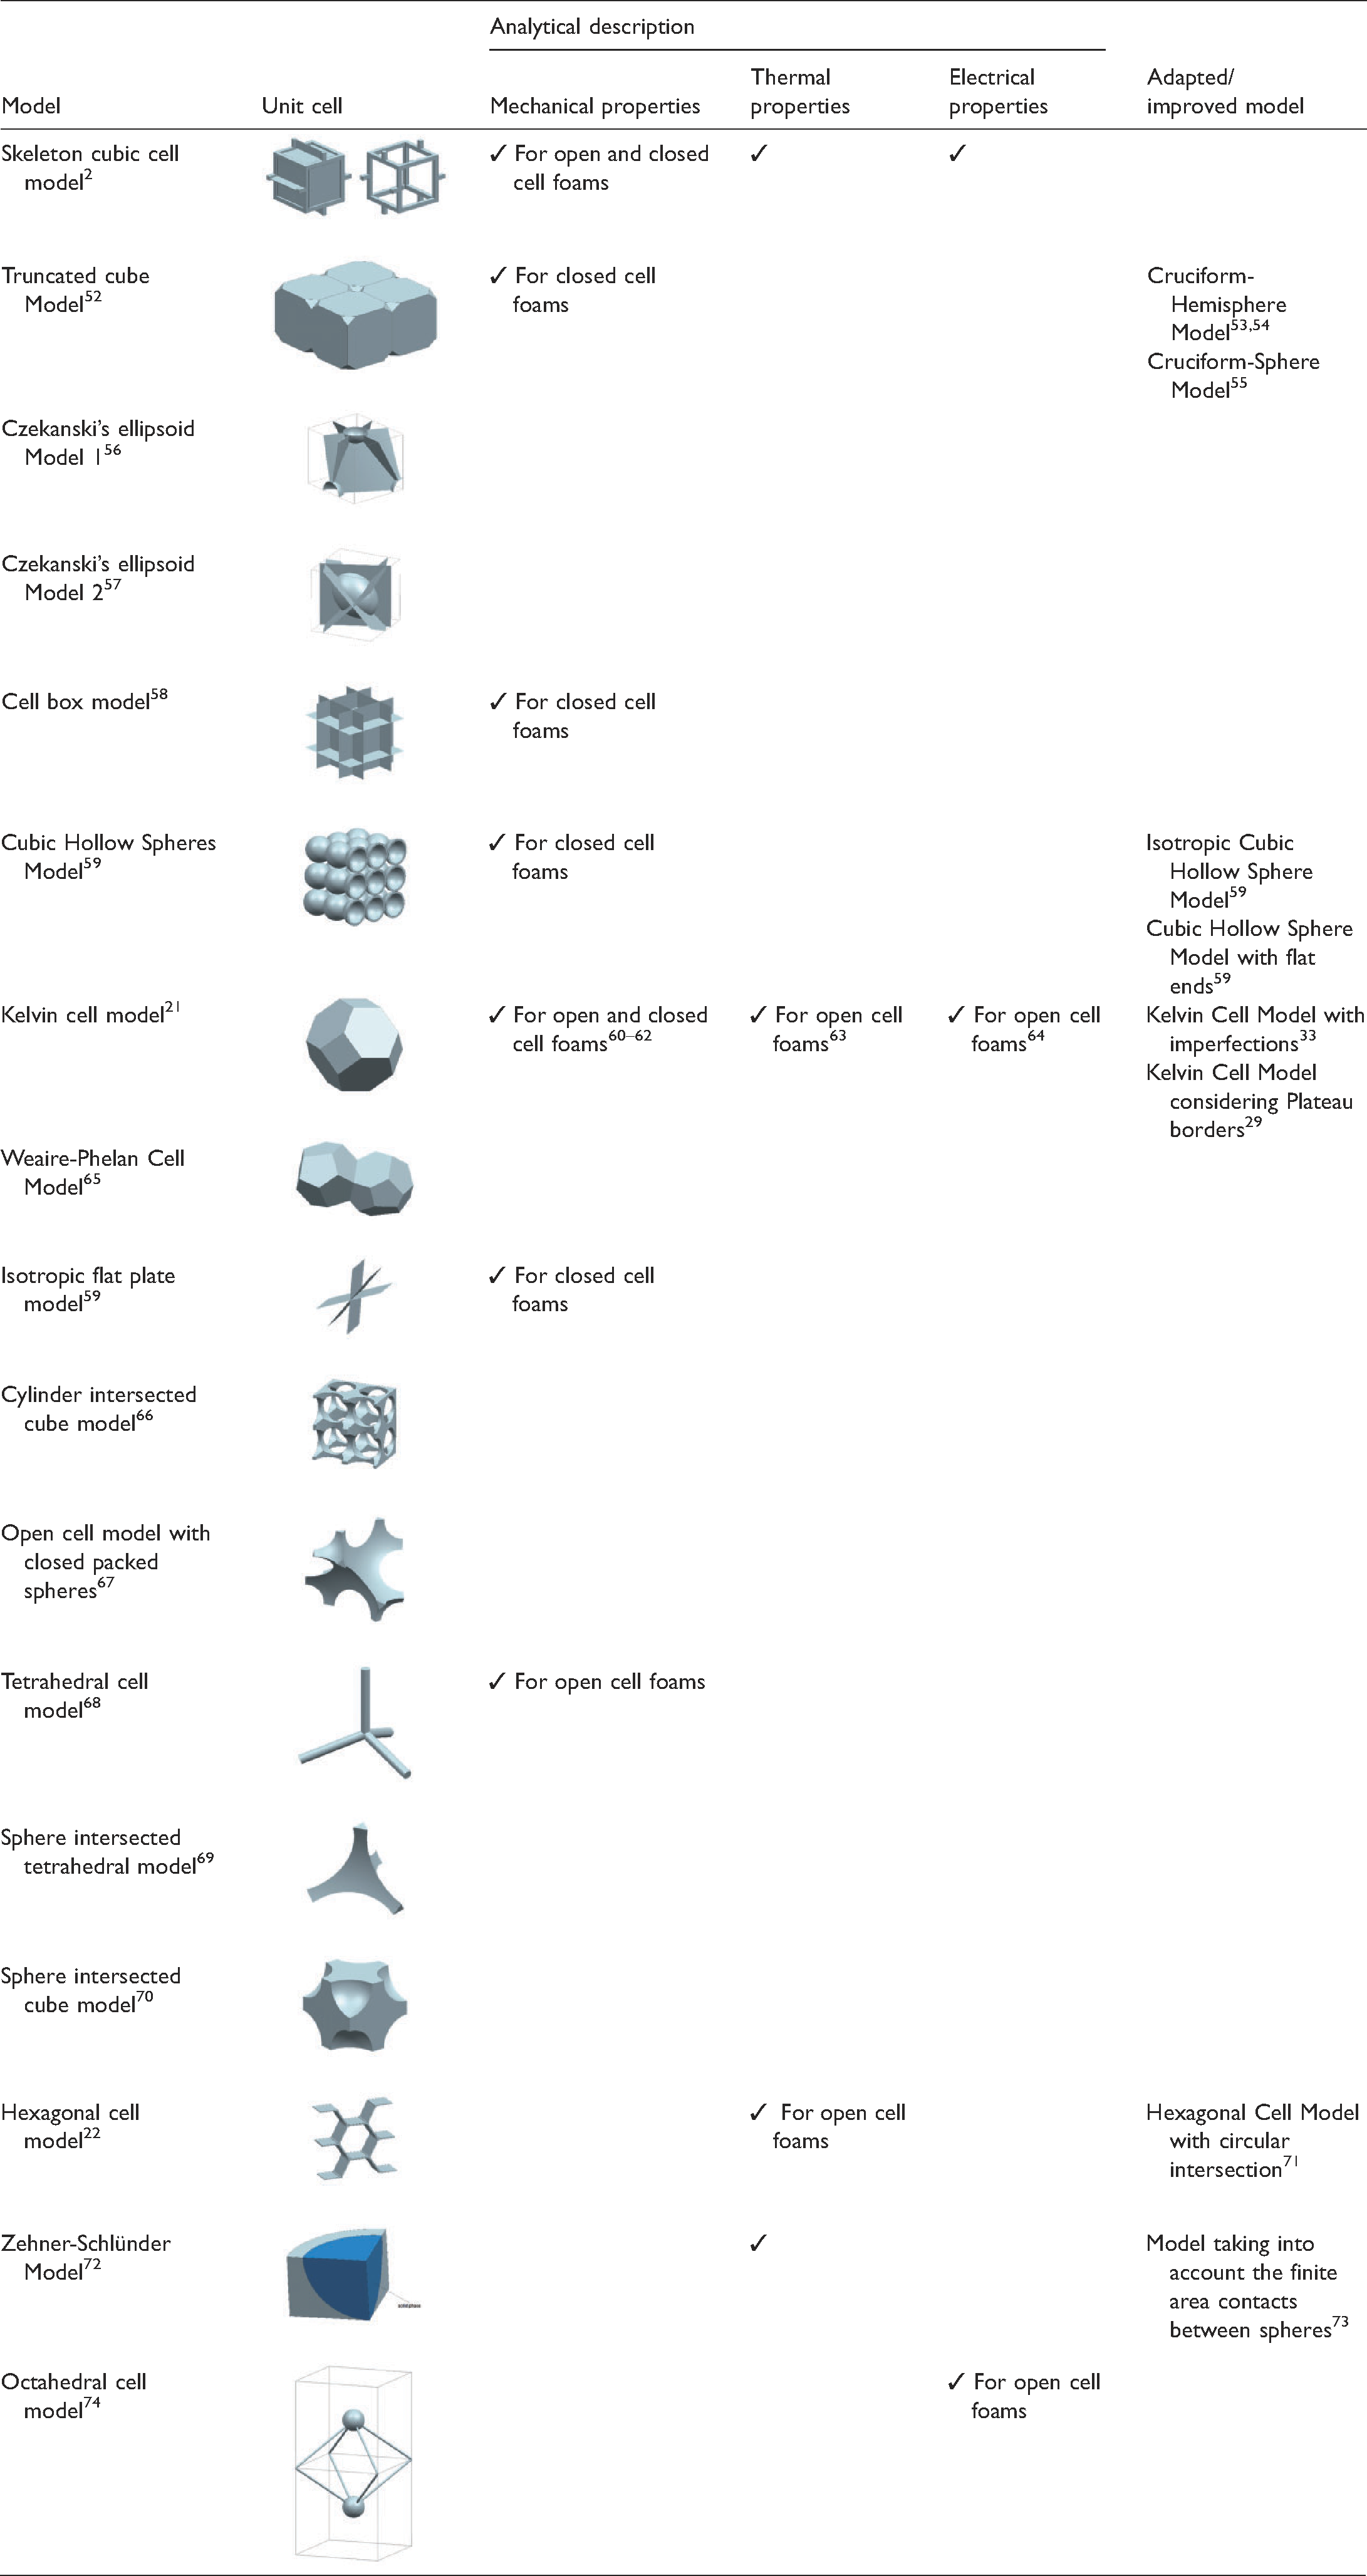
Models with their specific unit cell for the description of the mechanical, thermal and electrical behaviour of closed and open cell foams are depicted.2,21,22,29,33,52–74 Furthermore, information if an analytical description of the mechanical, thermal or electrical property is available and if an adapted or improved model exists is provided. The approach of these models is to use a specific unit cell to represent the entire foam structure. The unit cells are derived to a large extent from investigations of the geometry of cells of real foams. Typically, this geometry is simplified and used as representative entity. Some of these models are used for the “Comparison of modelling methods for closed cell foams with regard to the elastic properties” in the same-named section. The models were selected because they represent a closed cell foam and in addition, analytical descriptions of the elastic properties are existing. In the following, a short description of the models and the analytical equations for estimating the elastic properties are given.
In Gibson et al. (1997)2 the mechanical behaviour of closed and open cell foams is described based on the Cubic Cell Model. It is assumed that with this simplified structure the properties of a real foam can be estimated whilst the deformation and failure behaviour is similar in the model and in the real foam structure. In Figure 9(a) the model for open cell foams is illustrated. This model consists of cell edges with length l and thickness t. Figure 9(b) shows the model for closed cell foams. The model consists of cell edges with length l, thickness te and cell faces with thickness tf.
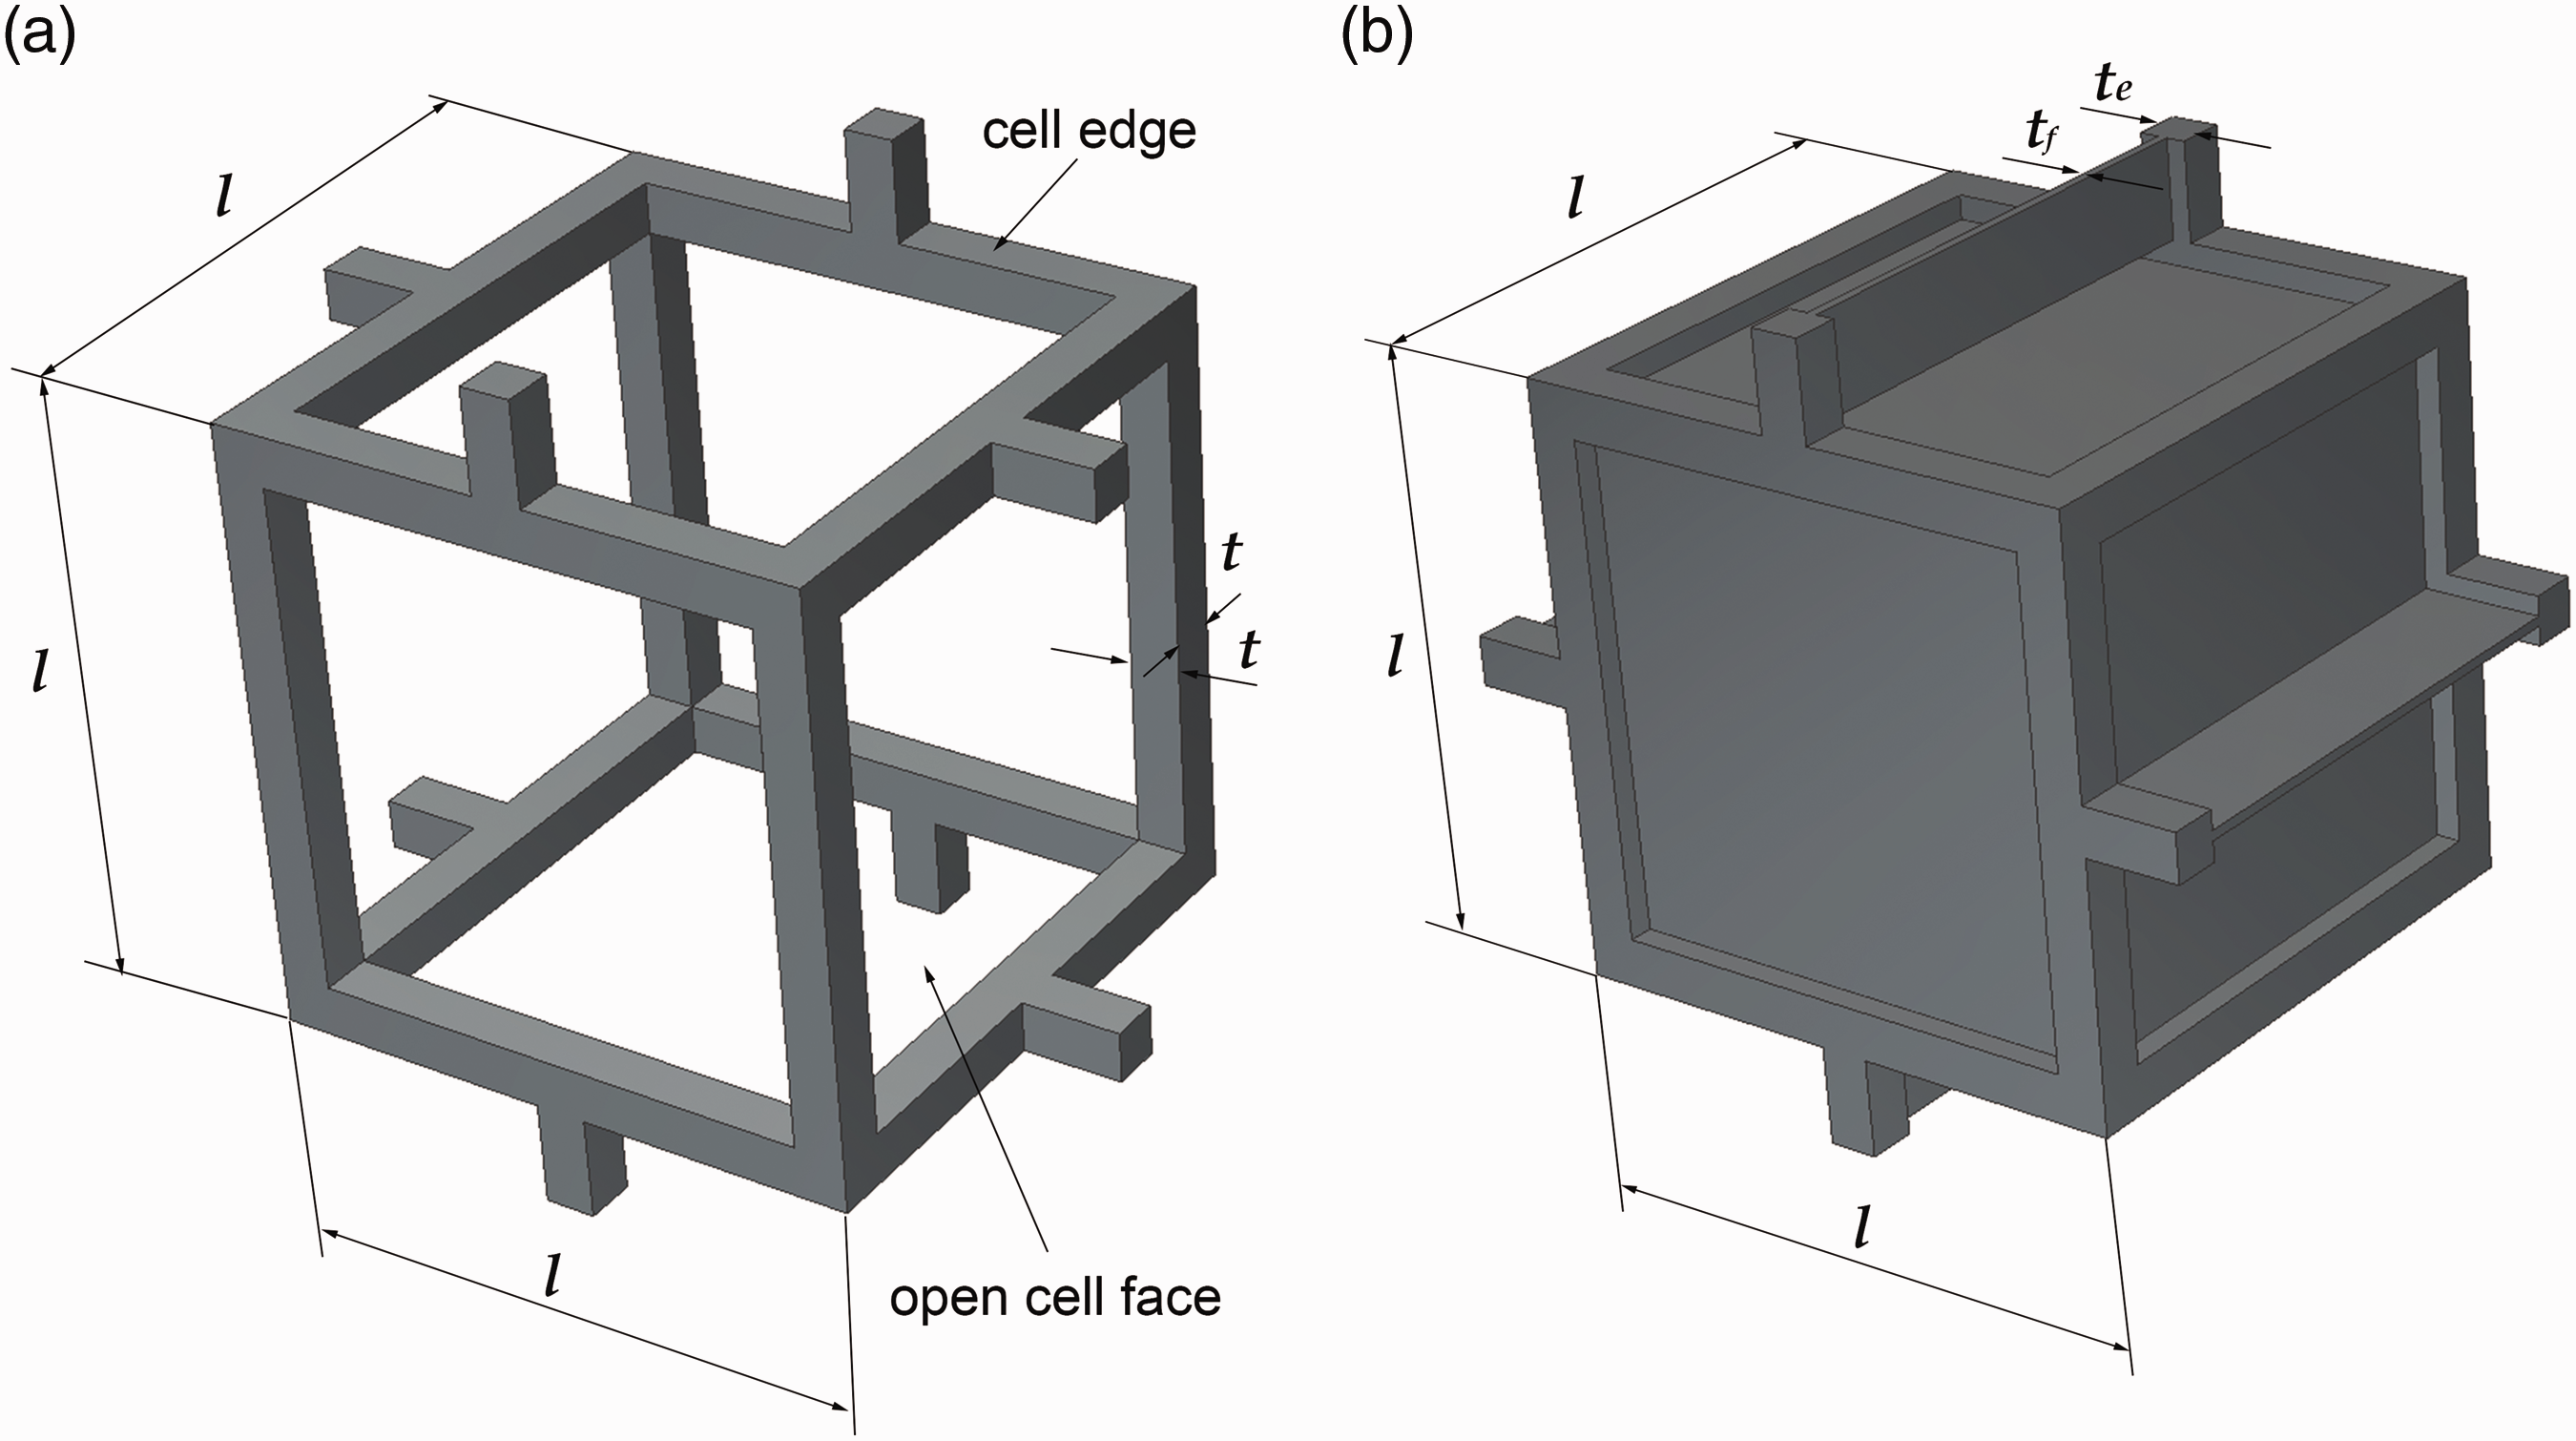
(a) Cubic Cell Model for open cell foams, (b) Cubic Cell Model for closed cell foams.2
Analytical formulas for the description of the behaviour under tension and compression are given. Equation (1) gives the formula for estimating the Young’s modulus of an open cell foam. The formula is derived from the standard beam theory.75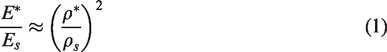
With Equation (2) the Young’s modulus value of a closed cell foam can be estimated. Three parts contribute to the Young’s modulus: bending of the cell-edges compression of the cell fluid which is trapped in the closed cell membrane stress in the cell faces due to cell edge bending

Some additional parameters are in the equation for the closed cell foam compared to that for the open cell foam. The initial pressure of the gas in the closed cells, p0 is usually the atmospheric pressure.
In Grenestedt (1998 and 1999) the elastic properties are derived for a cellular system which consists of flat plates.32,59 The plates are oriented in a way that the modelled foam is isotropic, therefore this model is stated here as Isotropic Flat Plate Model. The derivation of the elastic properties is based on the stiffness invariants and on the beam theory where the strain energy is obtained. The upper bound moduli of the foam are obtained similar to the Voigt bounds.76
Equations (3) to (6) give the obtained foam stiffnesses (bulk modulus 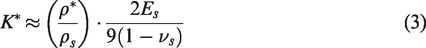
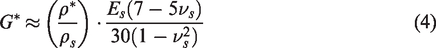
νs is the Poisson’s ratio of the unfoamed material. The bulk and shear moduli equal the low density asymptotes of the Hashin-Shtrikman upper bounds.77 This model is applicable to low density isotropic cellular materials.
The Kelvin Cell Model is a space-filling arrangement of cells of equal volume. The final arrangement has minimal surface area. The polyhedron which is used as the base cell of the Kelvin foam is the tetrakaidecahedron consisting of 14 slightly curved faces and 24 vertices.21,78–80
In Simone et al. (1998)60 the analytical descriptions for the closed cell tetrakaidecahedral foam for calculating the Young’s modulus and peak stress are given. It is important to note that the thickness is assumed to be constant in the whole foam cell wall. In Simone et al. (1998),33 this model was further extended by taking into account the distribution of the solid material in the cell wall, so the thickness depends on the location in the foam cell, and thus a Plateau border (Section “Cell topology and shape”, Figure 4) is modelled.81 For both models finite element analyses were performed where an elastic-perfectly plastic material model for the cell wall solid was used. The Young’s modulus (
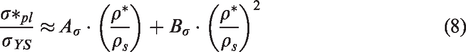
Es and σYS are the Young’s modulus and the yield strength of the solid cell wall material, respectively. AE, BE,
For the model where the Plateau border is considered the simulations are performed not only with continuum but also with shell elements.
Direct models by different modelling techniques
In this section modelling techniques are presented that allow to develop foam microstructures, namely models from micro-computed tomography measurements, Voronoi diagrams and the software Digimat FE (MSC Software Corporation, Part of Hexagon). The techniques differ with regard to the modelling and computational effort and the parameters needed as input for the model generation.
Models from micro-computed tomography measurements
In contrast to solid materials the representative microstructure including the deformation behaviour (buckling, bending etc.) of foamed materials can be directly determined with low and high resolution CT measurements due to the low absorption of X-rays of foams. This modelling technique has the advantage that all the microstructural features of the foam are captured, like local density, cell size and shape distribution and cell wall thicknesses.82–84 Although large specimens can be analysed in the CT, the model which is obtained may not be representative for the whole microstructure of the foam. The microstructure in a foamed specimen or part can vary dependent on the location and this may not be captured in the examined area and in the foam model. Moreover, the model generation is time consuming and also the computational effort is high because of the complexity of the microstructure. An appropriate surface extraction and meshing procedure have to be chosen for generating the micromechanical model of the foam.36 In Maire et al. (2003)82 an overview of the procedure and the different techniques of the generation of direct models from CT measurements is given. The mechanical but also the thermal behaviour of the generated microstructural models can be analysed with finite element simulations. Examples are the effect of the material properties of the cell wall on the global behaviour of the foam85 or the flow and heat transfer properties of aluminium foams.86,87
Models from Voronoi diagrams
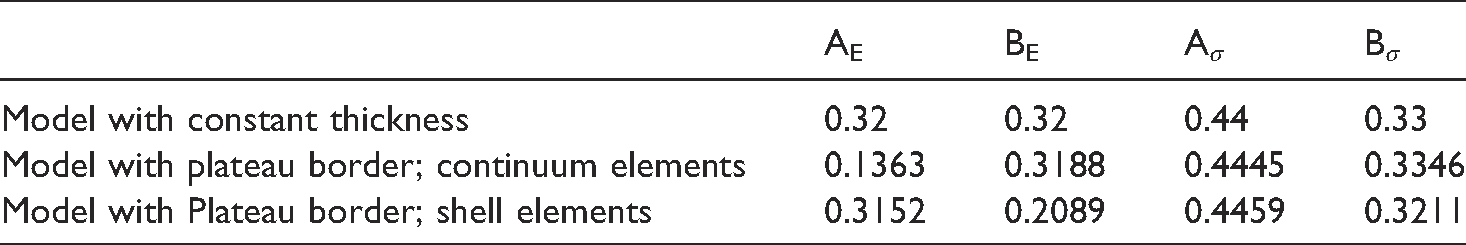
Voronoi diagrams are a special space division technique and tessellation method, respectively.88,89 The procedure of generating Voronoi diagrams and thus structural models of foams is the following36,90,91: seed points which are representative for the nucleation points of the foam cells are randomly arranged spheres (3D) or circles (2D) (with equal sizes) are placed on the seed points and start to grow simultaneously with a uniform growth speed and stop when the cells are in contact or when the space is completely filled symmetry planes are formed between individual spheres/circles and their adjacent ones the intersection of these planes forms convex, non-overlapping polyhedra with planar faces which represent the foam microstructure
The distances from the cell faces to their seed points are equidistant.90,92 In Figure 10 a 3D foam model based on Voronoi diagrams is illustrated. The model is obtained using the software Rhinoceros (Robert McNeel & Associates) and its visual scripting language Grasshopper. Also the Surface Evolver, developed by Brakke,93 can be used for the construction of Voronoi diagrams.
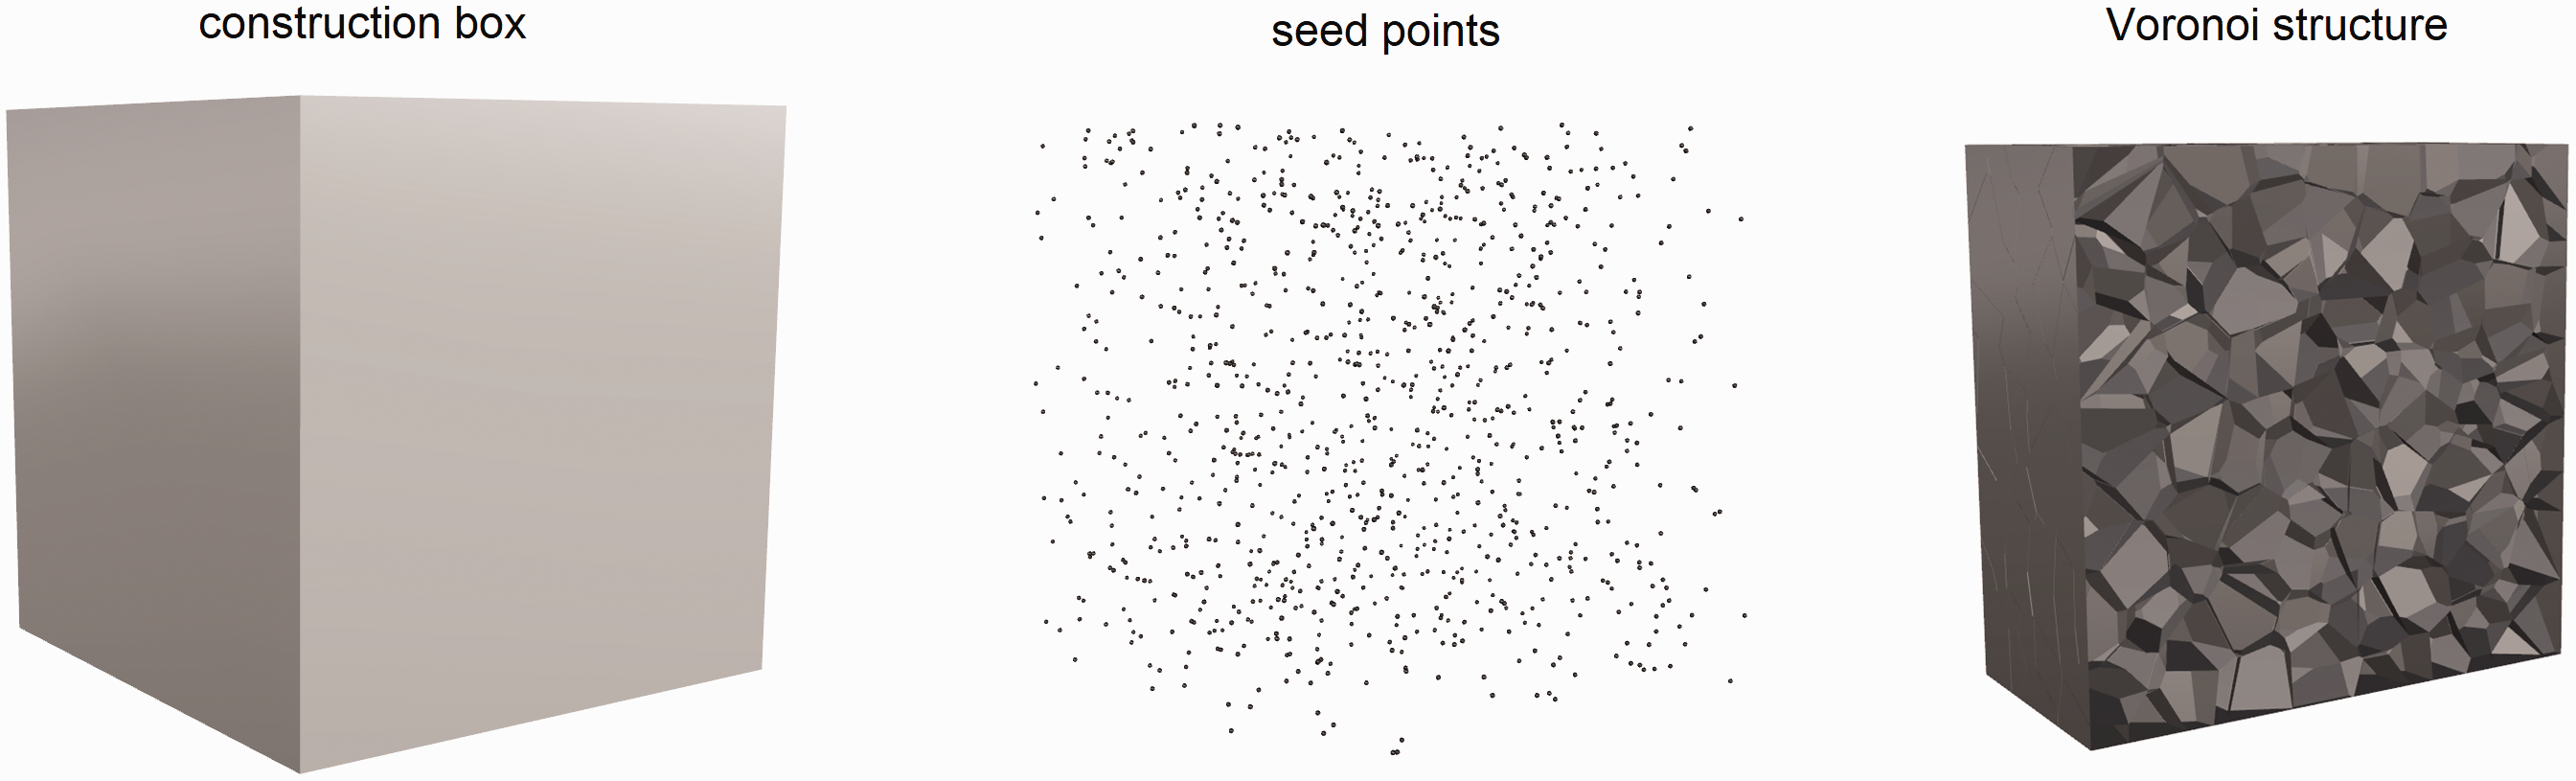
Illustration of the generation of a 3D foam model based on Voronoi diagrams.
The placement of the seed points can be performed with different processes, for example with the Poisson point process (Poisson-Voronoi point tessellation).91,94 The Voronoi tessellation algorithm leads to geometric deviations compared to the real foam geometry. For example, in the foam structure which is obtained by the Poisson-Voronoi point tessellation algorithm the average number of faces per cell is higher than in real foams and the variations of cell sizes is statistically constant due to the placement of the seed points with this algorithm.95 Therefore, variations of the classical Voronoi tessellation were developed to better approximate the geometry of real foams, for example: Voronoi diagram with Laguerre geometry
This is a weighted Voronoi tessellation, also called radical or power tessellation.89,95–97 The term weighted Voronoi tessellation comes from the fact that every nucleus has a different growing speed (stated as weight) whereas in the classical Voronoi tessellations all the nuclei have the same growing speed/weight.98 The higher the weight of the corresponding nuclei, the higher the growing speed and thus the bigger the cell size.95 This results in a pre-determined size distribution which leads to circles (2 D) or spheres (3D) with different radii and thus to a cell size distribution in the model.99 With the weighted Voronoi tessellation non-overlapping, space-filling convex polyhedra are formed.91 Random closed packing of spheres – Voronoi diagram with Laguerre geometry
As the name says this type of tessellation is based on a Voronoi diagram with Laguerre geometry which is constructed based on random closed packing of spheres.100 The spheres which are computed with an algorithm of random closed packing of spheres101–103 are the input for the power tessellation.91 Thus, the resulting cell size distribution is similar to the sphere size distribution obtained by the algorithm.95
With these approaches important microstructural features like the cell size and the relative density can be captured91,92 but the cell shape cannot be controlled. Anisotropic behaviour of stretched foam faces, which may arise from the manufacturing process is not considered in the model.104 In Schaller et al. (2015)105 the cell shapes of a Voronoi diagram of aspherical particles, so called Set Voronoi diagram106 are investigated. Oblate ellipsoids with several aspect ratios and packing factors are used. It was shown that the conventional Voronoi cells are less elongated upon compaction of spheres whereas the average anisotropy of the Set Voronoi cells becomes higher for smaller aspect ratio values of the ellipsoids (
The Voronoi diagram approach can be utilized to generate models for both, open and closed cell foams. Furthermore, this approach can be combined with CT measurements. The centre points of the single cells of the foam are extracted from CT experiments and can be used as seed points in the Voronoi diagram. This results in a cell size distribution which is very close to the one in the real microstructure.
Models from Digimat FE
In the software Digimat FE (MSC Software Corporation, Part of Hexagon),107 which is a finite-element-based homogenization module, a Representative Volume Element (RVE) of the foam structure can be generated. Stresses and strains in every phase of the RVE are computed and the mechanical behaviour of the foam is estimated. In addition to mechanical calculations, also thermal and electrical analyses can be performed. Dependent on the modelling approach and parameters, open and closed cell foams can be modelled. The influence of the modelling parameters on the open cell content is discussed in Section “Investigation of the influence of the design variables on the elastic properties of closed cell foams based on FE models”.
Basically, in Digimat FE there are three main approaches to model the microstructure of foams.107 In all these approaches the foam is made of a bulk material and air. The material models of the bulk material and the cells, the cell shapes, the cell size (distribution), the cell orientations and the relative density have to be defined. For the bulk material between several material models (e.g. linear elastic, elastoplastic) can be chosen. For the foam cells a linear elastic material with a very low Young’s modulus can be utilized and in addition there is the option to define the cells as “void”. This is a special phase type where no material model has to be assigned and where the behaviour of the air in the foam is represented (stiffness of the inclusions is assumed to be 0). Suitable cell shapes for foams are ellipsoid, prism and icosahedron (illustrated later in Figure 14). The foam is defined as composite containing matrix and inclusions (with or without interphase/coating). The approaches differ in the definition of the matrix and inclusions. In Table 3, a summary of the main modelling parameters are given for the three approaches.
Overview of the three modelling approaches for foams in Digimat FE.
Approach 1 and 2 are similar, only the definition of the air model is different. In approach 1 the air is modelled with the phase type “void” whereas in approach 2 the air is modelled with a linear elastic material model with a very low Young’s modulus. The third approach is different in terms of the matrix/inclusion definition. The matrix and inclusions are modelled as air with a suitable material model and the bulk material acts as an interphase and covers the inclusion with a specific thickness. The last two models are used for the “Investigation of the influence of the design variables on the elastic properties of closed cell foams based on FE models” in the same-named section.
Constitutive models
The direct modelling approach where the cellular structure is modelled in detail could become very complex or comprehensive expensive if applied to big structures. As an alternative, the constitutive modelling approach can be used. The detailed foam structure is replaced by a homogeneous medium with a material model representing the specific behaviour of the foam.51 The material model for the homogeneous medium can be obtained by phenomenological and homogenization methods.
Phenomenological models
One way to receive a constitutive model for describing the mechanical behaviour of a foam is the phenomenological method. The constitutive law and its parameters are gained from experiments. The simulation and experimental results are approximated by calibration of the parameters of the constitutive law. Different experiments are performed to capture the mechanical behaviour of the foam in the final constitutive law. The constitutive law can be implemented in a FEM solver and used to predict the behaviour of large structures. There are several publications where phenomenological models for foams are applied.108–110 The advantage of this approach is that it is very efficient in such a way that the whole foam structure of large specimens can be investigated. It is not necessary to investigate the microstructure of the foam (e.g. CT measurements). The drawback is that with this approach the behaviour of the foam structure during the experiment and also during simulation cannot be investigated on the micro level and micromechanical mechanisms like cell edge bending cannot be detected. Moreover, the determination of the material model parameters can become very complex and the material model may be only applicable for one specific foam.
Homogenization methods
A further way to develop a constitutive law for foams are homogenization methods. Several homogenization methods exists:
Some models from the mean field homogenization approach are used for the “Comparison of modelling methods for closed cell foams with regard to the elastic properties”, in the same-named section. The Composite Sphere Model, Generalized Self Consistent Model, Ramakrishnan-Arunachalam Model and Mori Tanaka Model are shortly explained and the analytical descriptions are given. The models are adapted for a two-phase material consisting of a matrix and voids and utilized for estimating the mechanical properties of foams. Most of the models are based on Eshelby’s solution.111
Composite Sphere Model
The Composite Sphere Model was introduced by Hashin (1962).112 It is assumed that the composite consists of spheres of different sizes. Smaller spheres are used to fill the space between bigger spheres. Each sphere is modelled with a core consisting of the inclusion material and surrounded by matrix material. The matrix and inclusion materials are elastic, homogeneous and isotropic and the ratio of the inner radius a and the outer radius b are assumed constant for every sphere. The volume fraction and porosity f, respectively can be calculated with this ratio (equation (9)).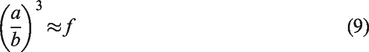
The analytical expression for the bulk modulus is adapted for foams. The bulk modulus of the inclusion (air) is set to 0.24 With this model the bulk modulus is estimated by: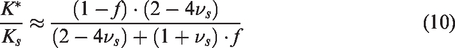
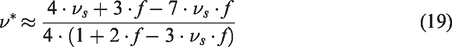
If a distinction is made for low (f → 0) and high (f → 1) volume fractions, the upper and lower bounds for the shear modulus can be defined, again with the shear modulus of the air set to 0:

Generalized Self Consistent Model
In this model the composite is represented with a single composite sphere. This sphere consists of a spherical inclusion in the core and a matrix shell. It is embedded in an infinite homogeneous medium having the unknown effective properties which are to be calculated.113 In Christensen (1998)24 the equations for the calculation of the bulk and the shear moduli of foams are derived. It is shown that the results of the bulk modulus are the same for the Composite Sphere Model and the Generalized Self Consistent Model. For the shear modulus a quadratic equation is obtained: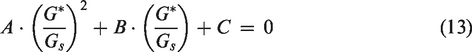
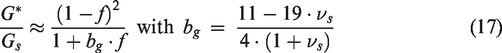
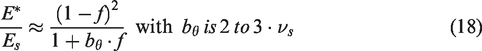
A, B and C are variables which depend on the Poisson’s ratio of the matrix and the volume fraction of the voids. For the case of high volume fractions (f → 1) the variables A, B and C reduce to: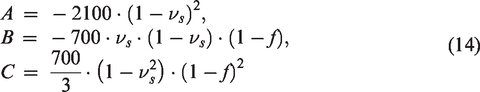
Using equation (14) in equation (13) gives the shear modulus for high volume fractions (f → 1):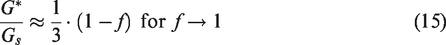
Ramakrishnan-Arunachalam Model
This model was introduced by Ramakrishnan et al. (1990)114 and it is based on the Composite Sphere Model. In contrast to the Composite Sphere Model the effective shear modulus can be estimated instead of only the shear modulus bounds. First, only a single hollow sphere is investigated. Then, the model is extended to the whole foam structure by introducing a correction factor which considers that the pressure acting on the assemblage of hollow spheres is not the same as the pressure acting on the single hollow sphere. This is necessary for the estimation of the effective elastic constants of composites where the Young’s moduli of the two phases differ a lot. Moreover, a model of the variation of the effective Poisson’s ratio is established and utilized as a parameter for calculating the effective shear modulus because the average deviatoric strain in the void cannot be set directly: The effective Poisson’s ratio is a constant (c) and independent of the material for a completely porous solid The effective Poisson’s ratio does not vary with porosity for porous solids made of a solid material with Poisson‘s ratio c


The constant c can be determined from experimental results. In the following, the equations derived from the model are given.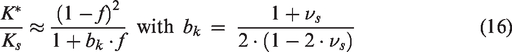
Mori Tanaka
This model is based on Eshelby’s solution111 and was introduced by Mori and Tanaka (1973).115 In Benveniste (1987)116 a simple interpretation of the Mori Tanaka Model is given to derive a direct approach of the estimation of the effective properties of composites. It is stated that in this model “each inclusion in the real RVE behaves as if it were isolated in the real matrix. The body is infinite and subjected to the average matrix strains in the real RVE as the far field (remote) strain.”.107 In the following, the equations for the effective bulk and shear modulus are given.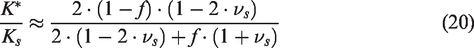

A general case of the Self Consistent Model and Mori Tanaka Model was proposed by Nemat-Nasser et al. (1993),128 the Double Inclusion Model. The inclusion is embedded in the matrix material which is surrounded by a reference medium with the stiffness Cr. In the Self Consistent Model Cr is equal to the composite stiffness and in the Mori Tanaka Model Cr is equal to the matrix stiffness.107
An iterative homogenization scheme, called Differential Method was introduced by Norris (1985).129 In this approach any homogenization method (e.g. Mori Tanaka Model) is iteratively used. A high volume fraction of inclusions can be obtained with this method. Inclusions are iteratively added to the matrix until the desired volume fraction of the inclusions is reached while keeping the volume of the composite constant. The system is homogenized at each iteration (Figure 11).
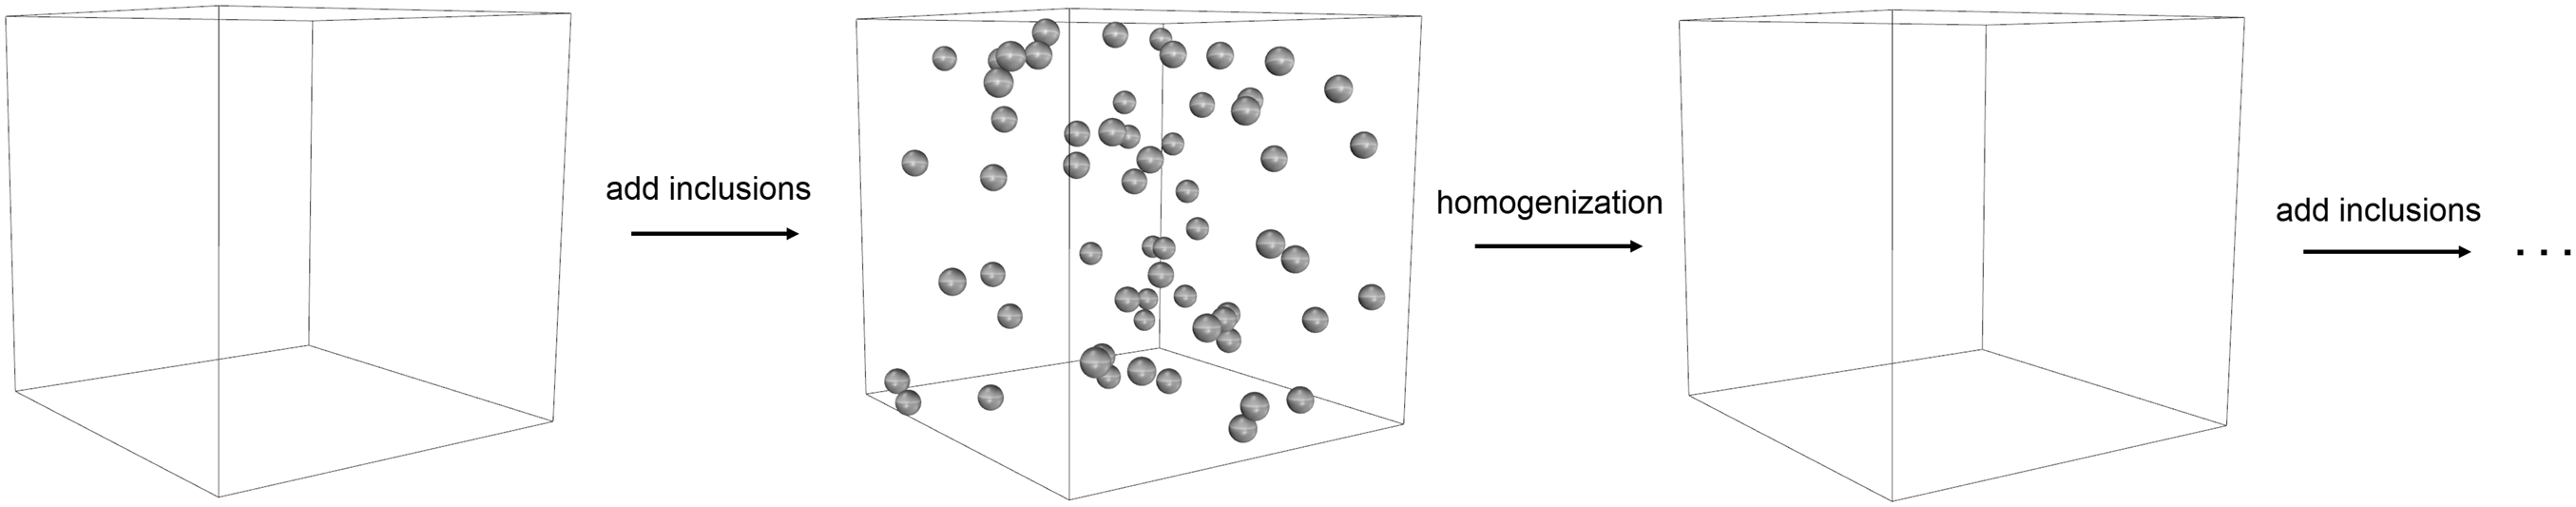
Illustration of the iterative process of the differential method.129
Investigation of the influence of the design variables on the elastic properties of closed cell foams based on FE models
In this section, sensitivity studies are performed with direct models which are derived from Digimat FE to investigate the influence of the design variables on the elastic properties of closed cell foams. For this a reference model is made as in the second approach which was introduced in Section “Models from Digimat FE” with the following characteristics: The elastic behaviour of the bulk material is assumed to be linear elastic with a Young’s modulus of 1700 MPa and a Poisson’s ratio of 0.42 (assumed parameters for polypropylene). The air is also modelled with a linear elastic material (Young’s modulus = 0.0001 MPa and Poisson’s ratio = 0.3107). The model consists of 100 spherical inclusions with a constant diameter which are randomly arranged. The diameter is determined by the volume fraction of air and by the number of inclusions in the RVE which has a fixed size.
The input parameters and the modelling approach of this reference model are modified so that closed cell foam models with different characteristics are generated. The models are compared with regard to their Young’s modulus values. The influence of the following design variables are investigated: bulk material properties cell shape anisotropic cell shape cell size cell size distribution cell topology (open cell content) relative density
Bulk material properties/relative density
The influence of the bulk material properties on the Young’s modulus of the foam is investigated. Therefore, the reference model is compared with a model, which has the same characteristics as the reference model, only the Young’s modulus of the bulk material (Ebulk) is 25% higher than the Young’s modulus of the reference bulk material. In Figure 12 the simulation results of two models are depicted.
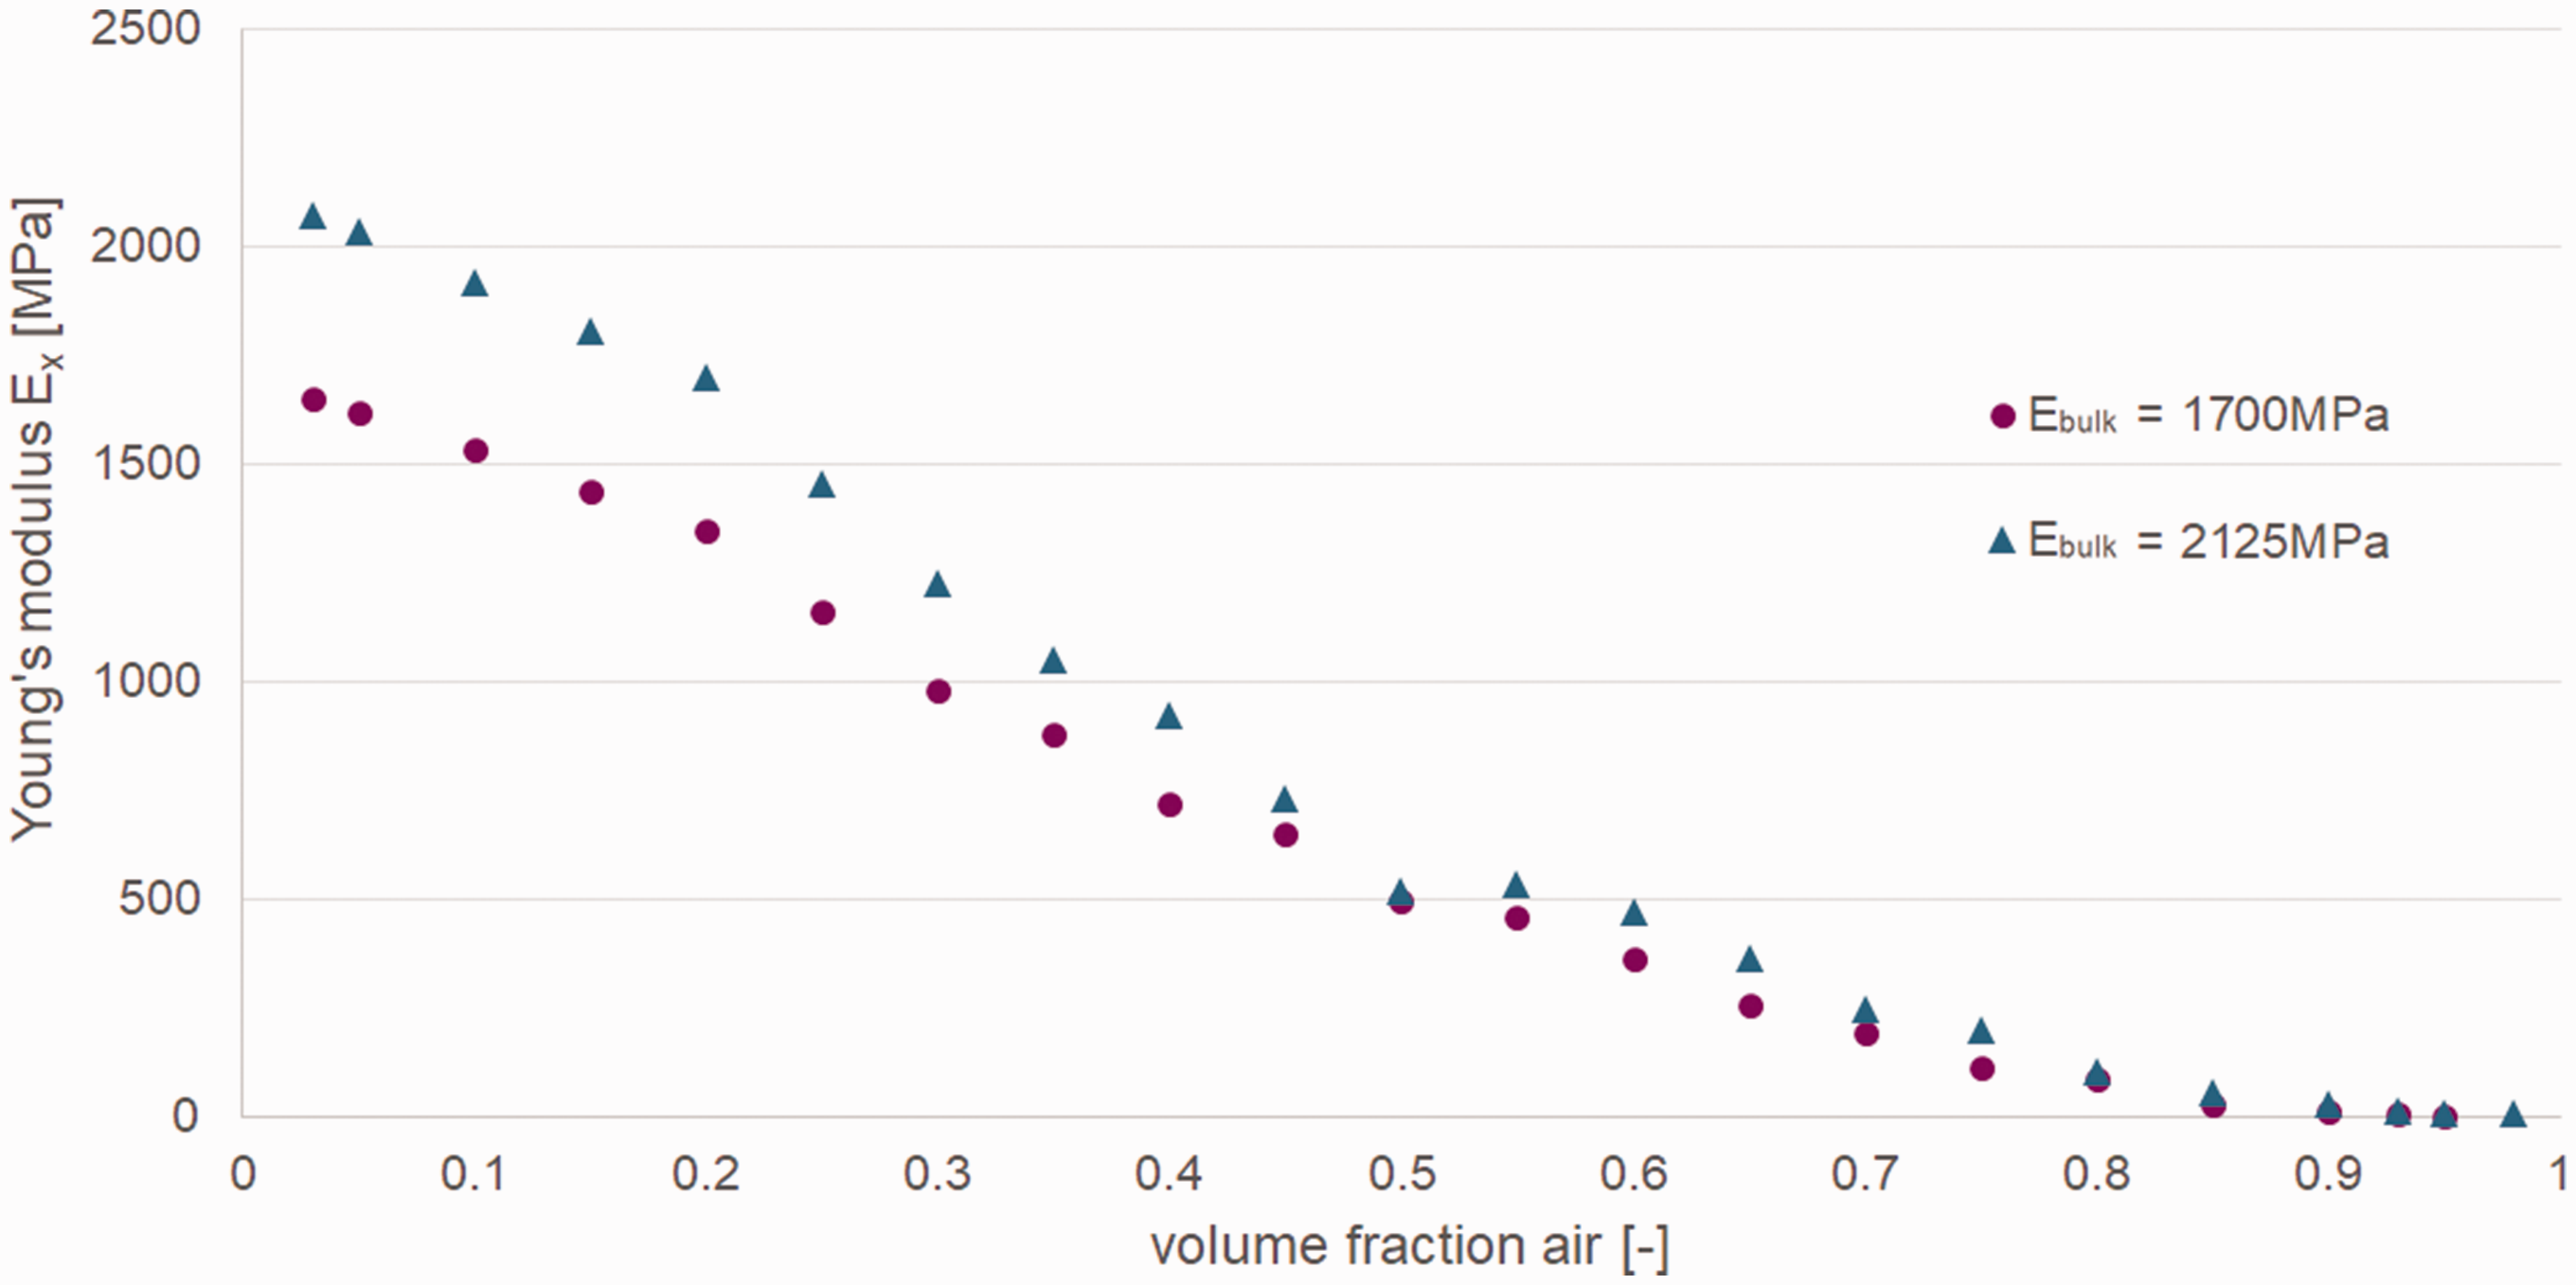
Illustration of the influence of the Young’s modulus of the bulk material on the Young’s modulus of the foam.
The Young’s modulus in x-direction (Ex) is calculated for several volume fractions of air and relative densities, respectively (
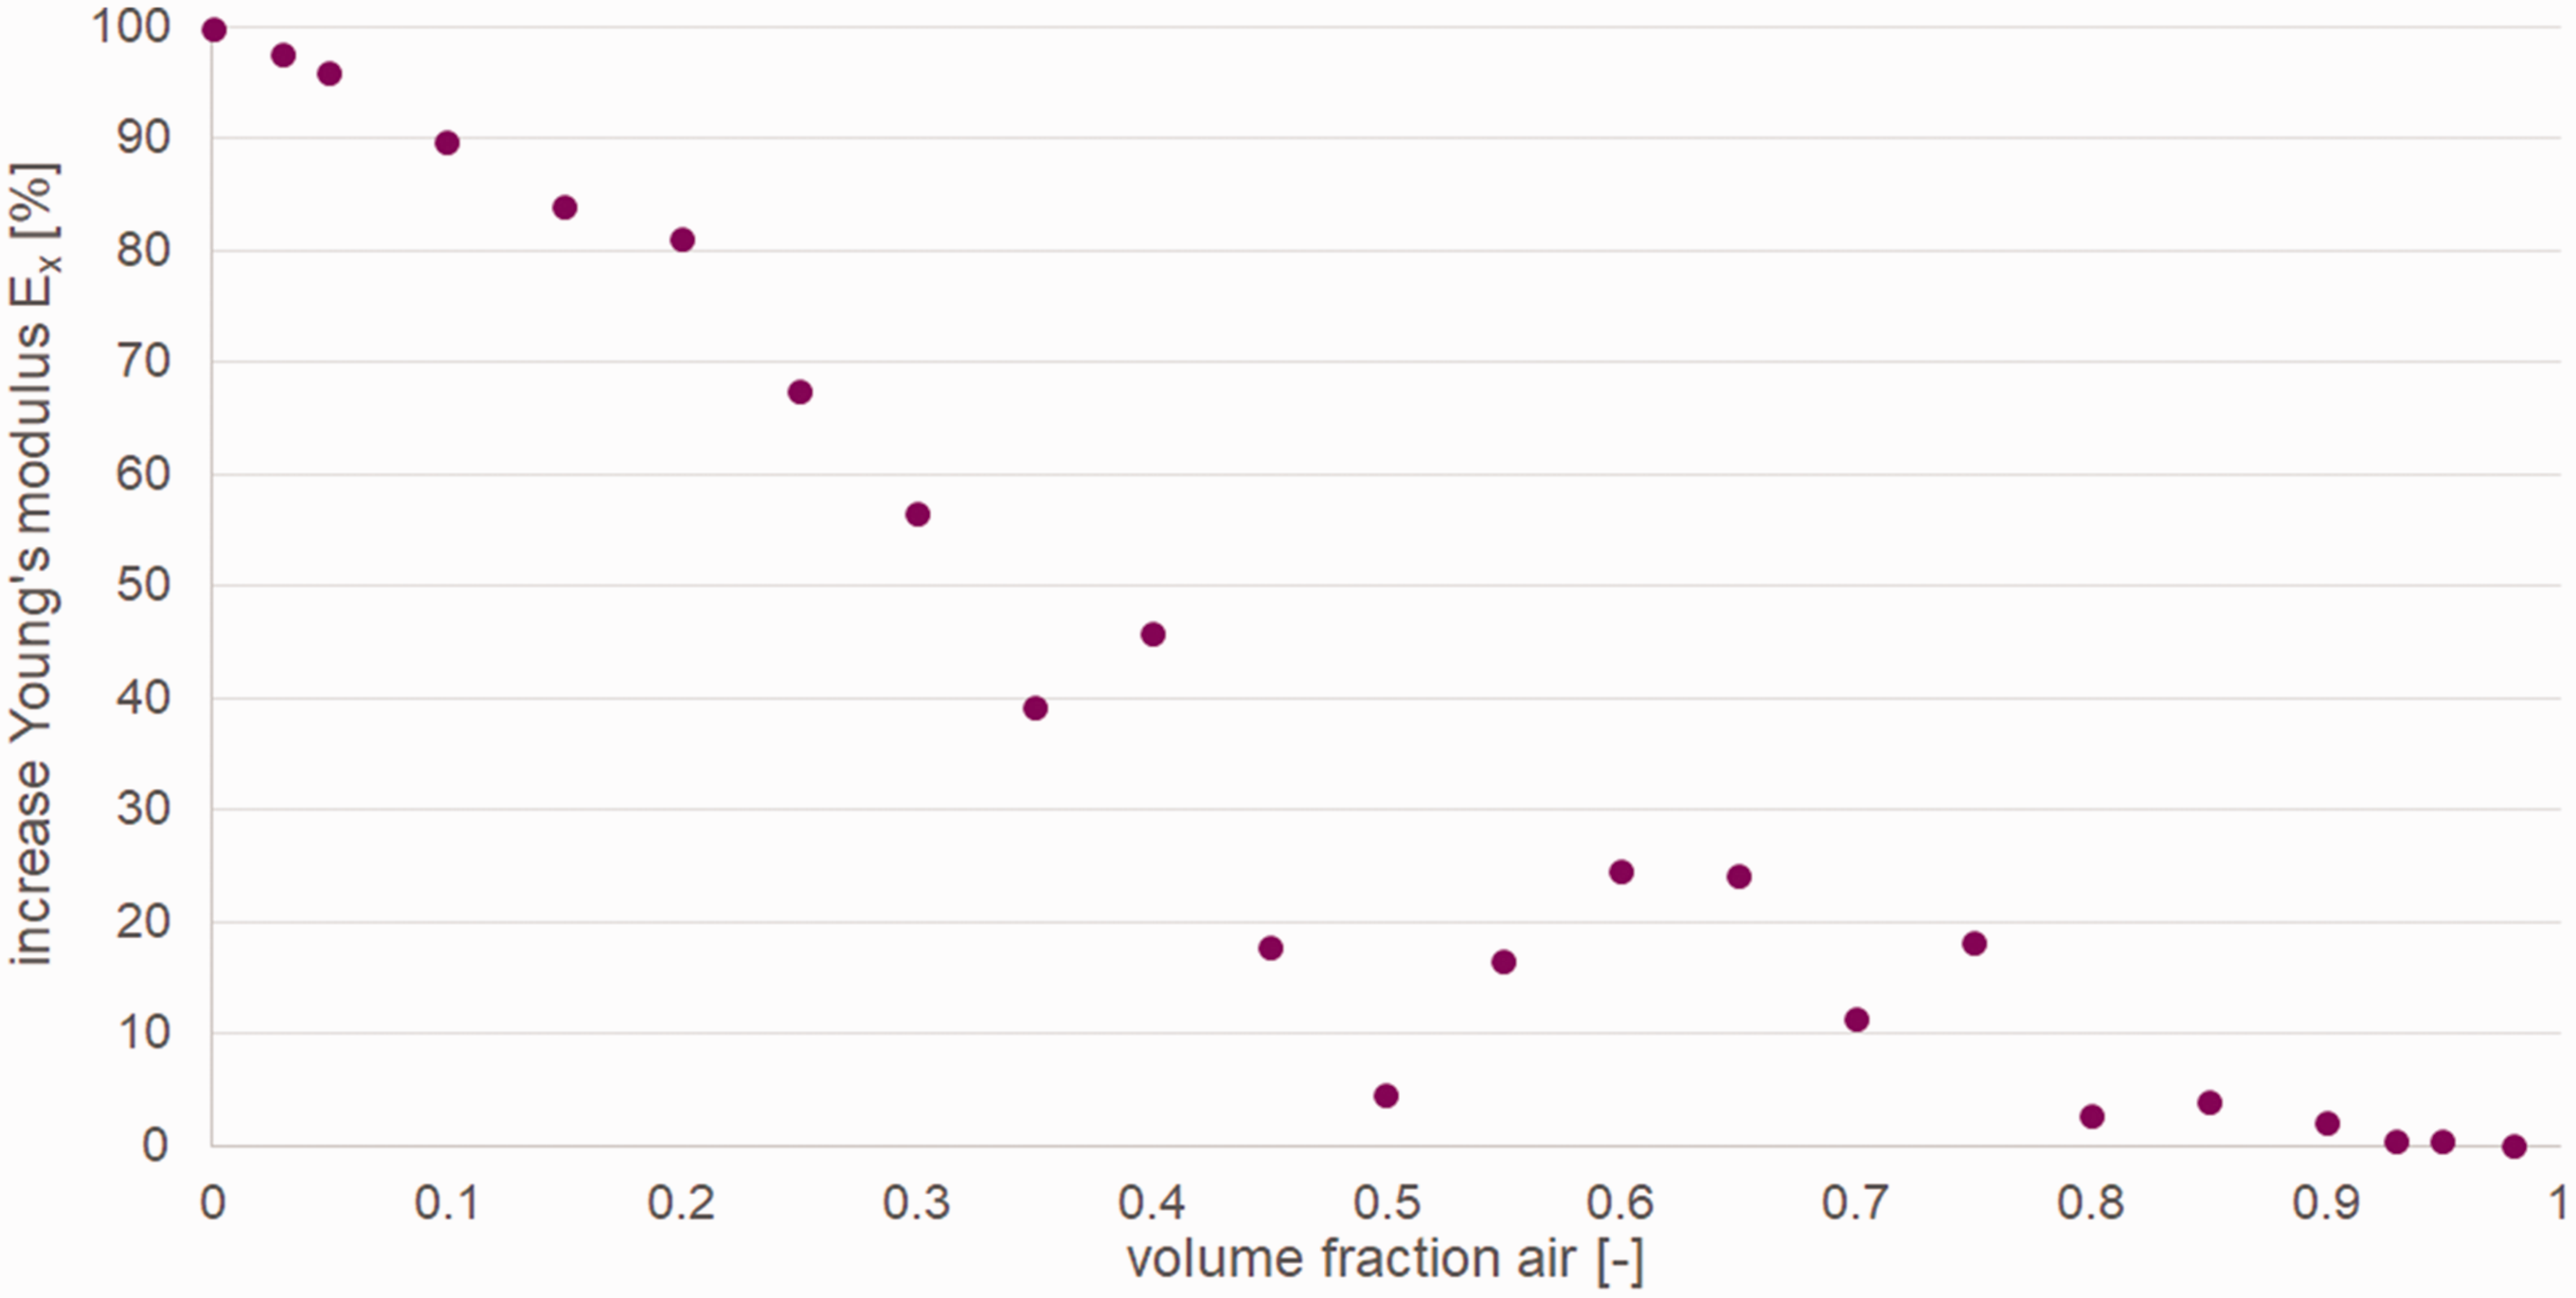
Increase of the Young’s modulus of the foamed material in relation to the increase of the Young’s modulus of the unfoamed material.
It is suggested that for high relative densities the matrix material dominates the properties of the foam. For lower relative densities the matrix content gets less and thus, the matrix material properties do not have a big influence on the global foam properties any more.
The influence of the volume fraction of air/relative density can also be investigated based on these results. The higher/lower the volume fraction of air/relative density, the lower the Young’s modulus of the foam. Furthermore, it can be observed that the Young’s modulus shows a non linear dependency on the volume fraction and relative density, respectively, thus a bending dominated behaviour is present.
Cell shape
Foam models with three different cell shapes are prepared to investigate the influence of the cell shape on the Young’s modulus. One model is the reference model (with spherical inclusions). The reference model is modified with regard to the inclusion shape. The icosahedral and prismatic inclusions are used for the other two models (Figure 14). The number of inclusions is set constant for the three models so that the size of the inclusions is similar for the three inclusion shapes. The Young’s modulus in x-direction (Ex) is calculated for several volume fractions of air for the three models. In Figure 14 the simulation results are shown.
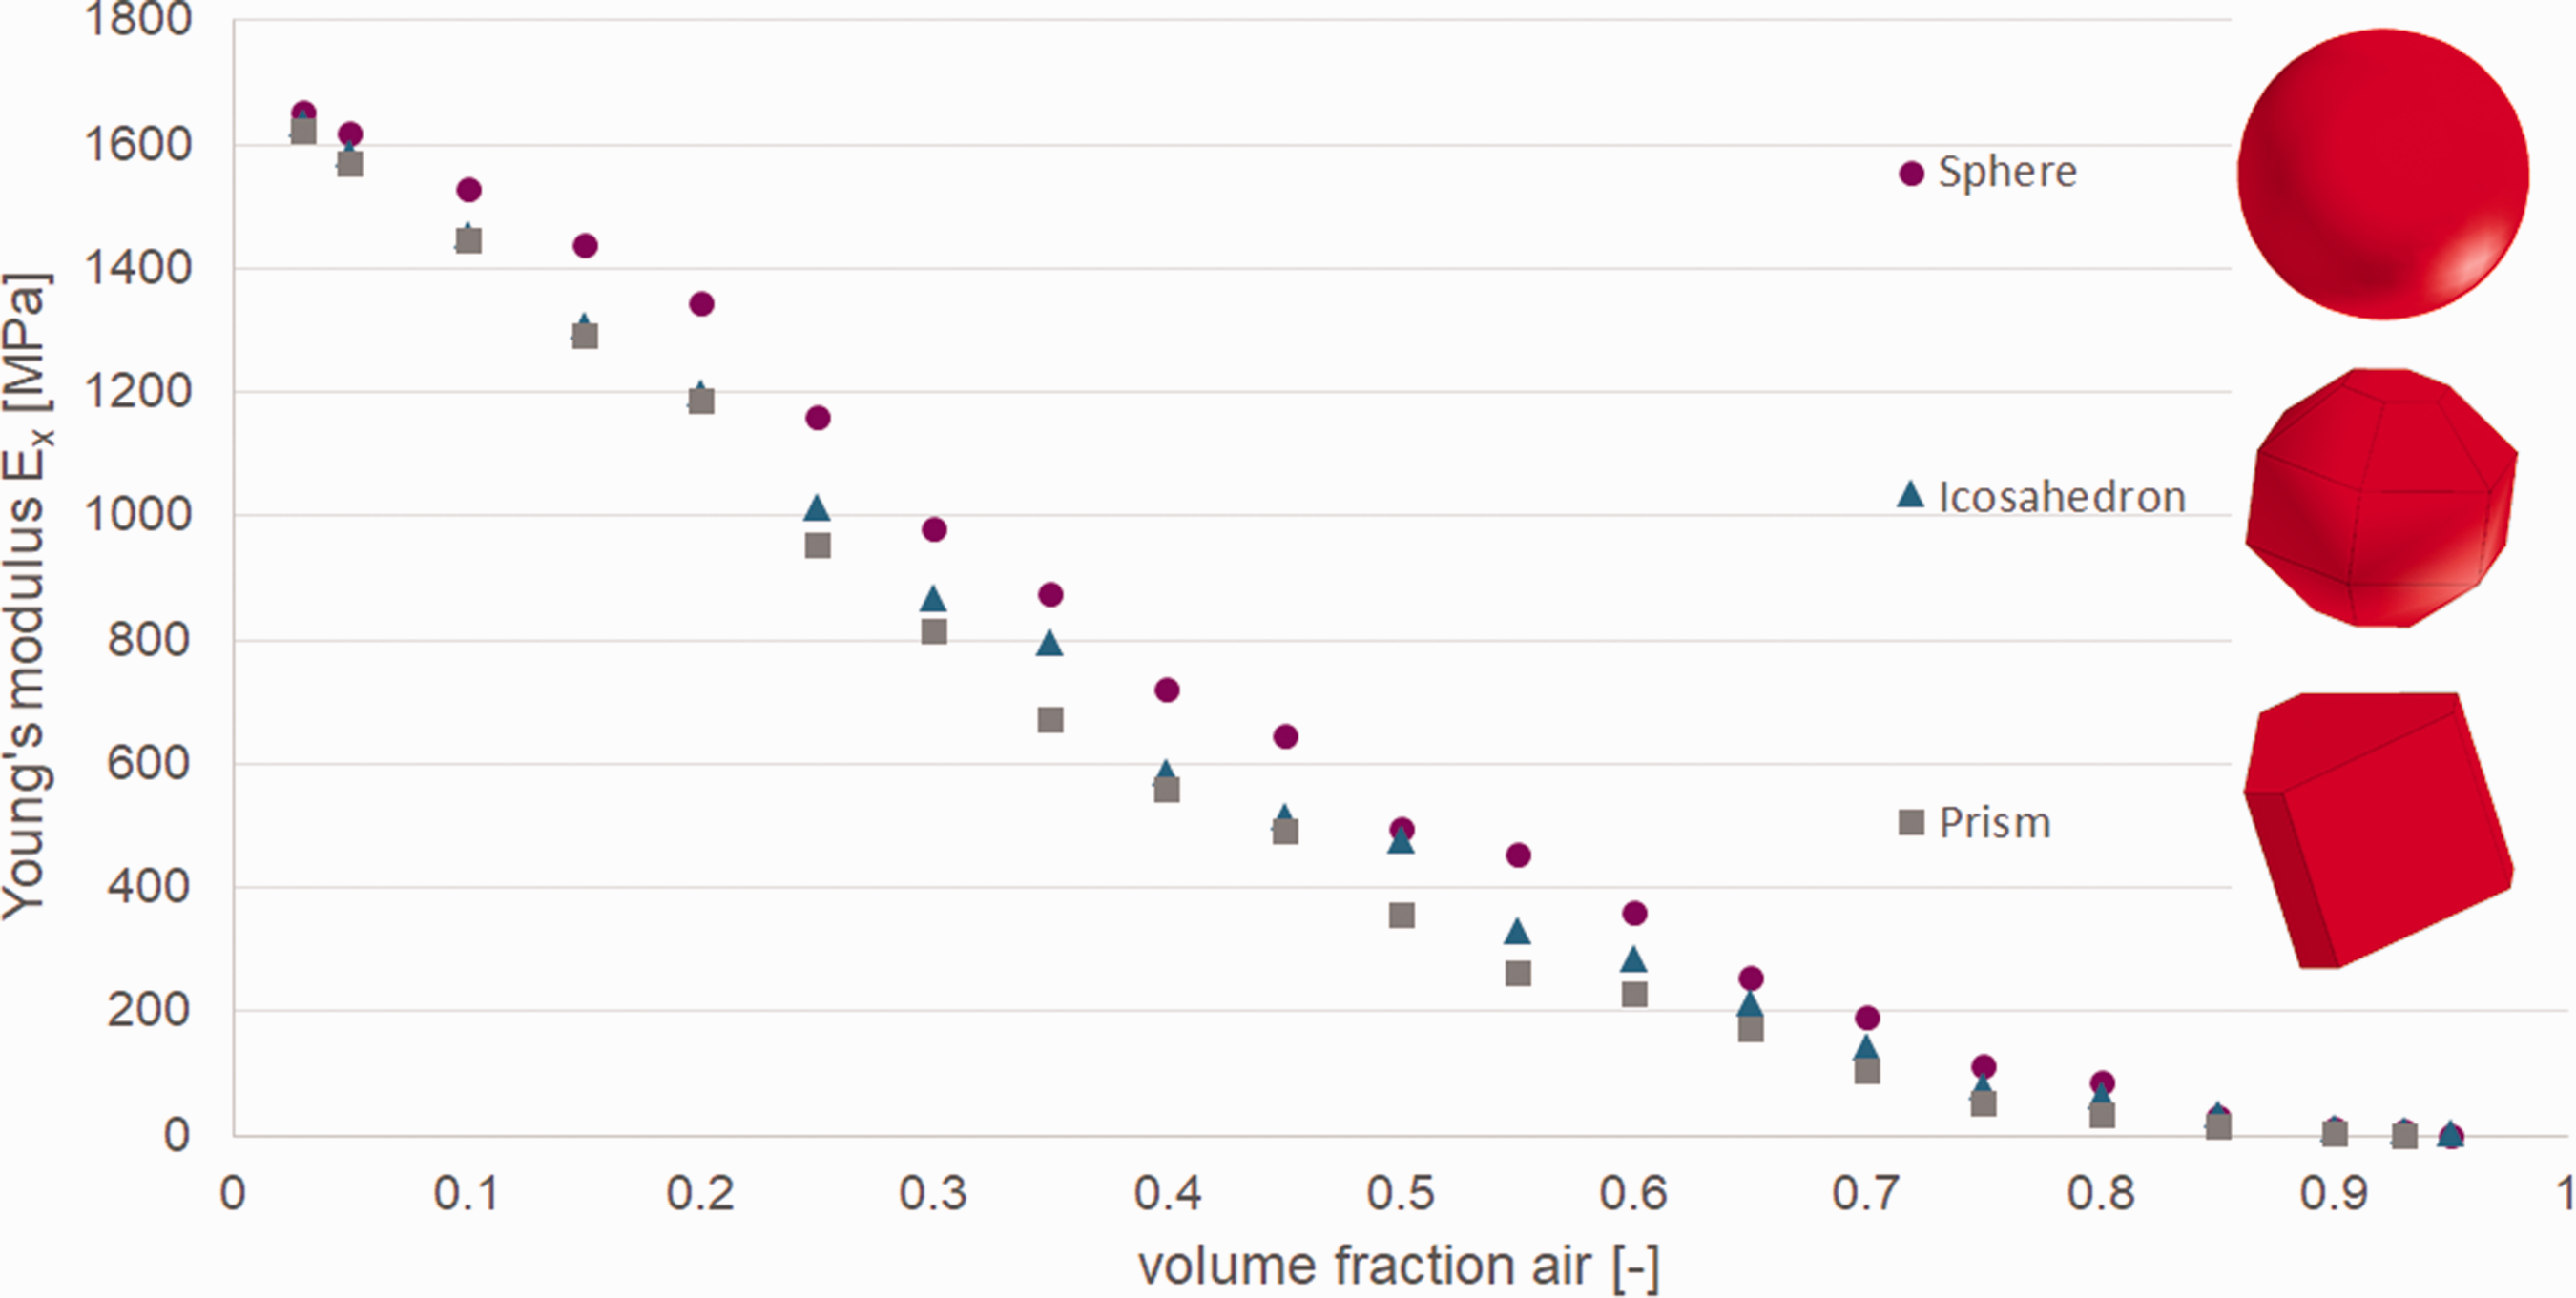
Comparison of the Young’s modulus values in x-direction for the models with spherical, icosahedral and prismatic inclusions.
It can be seen that the Young’s modulus of the model with the spherical inclusions is slightly higher than the Young’s modulus of the models with the icosahedral and prismatic inclusions which show similar results.
Anisotropic cell shape
In the following, the anisotropic behaviour of the reference model is investigated. Therefore, simulations with tensile loading in x-, y- and z-direction are performed to evaluate the corresponding Young’s modulus value in the specific loading direction (Ex, Ey and Ez). In Figure 15 the results of the Young’s modulus values Ex, Ey and Ez over the volume fraction of air are depicted.
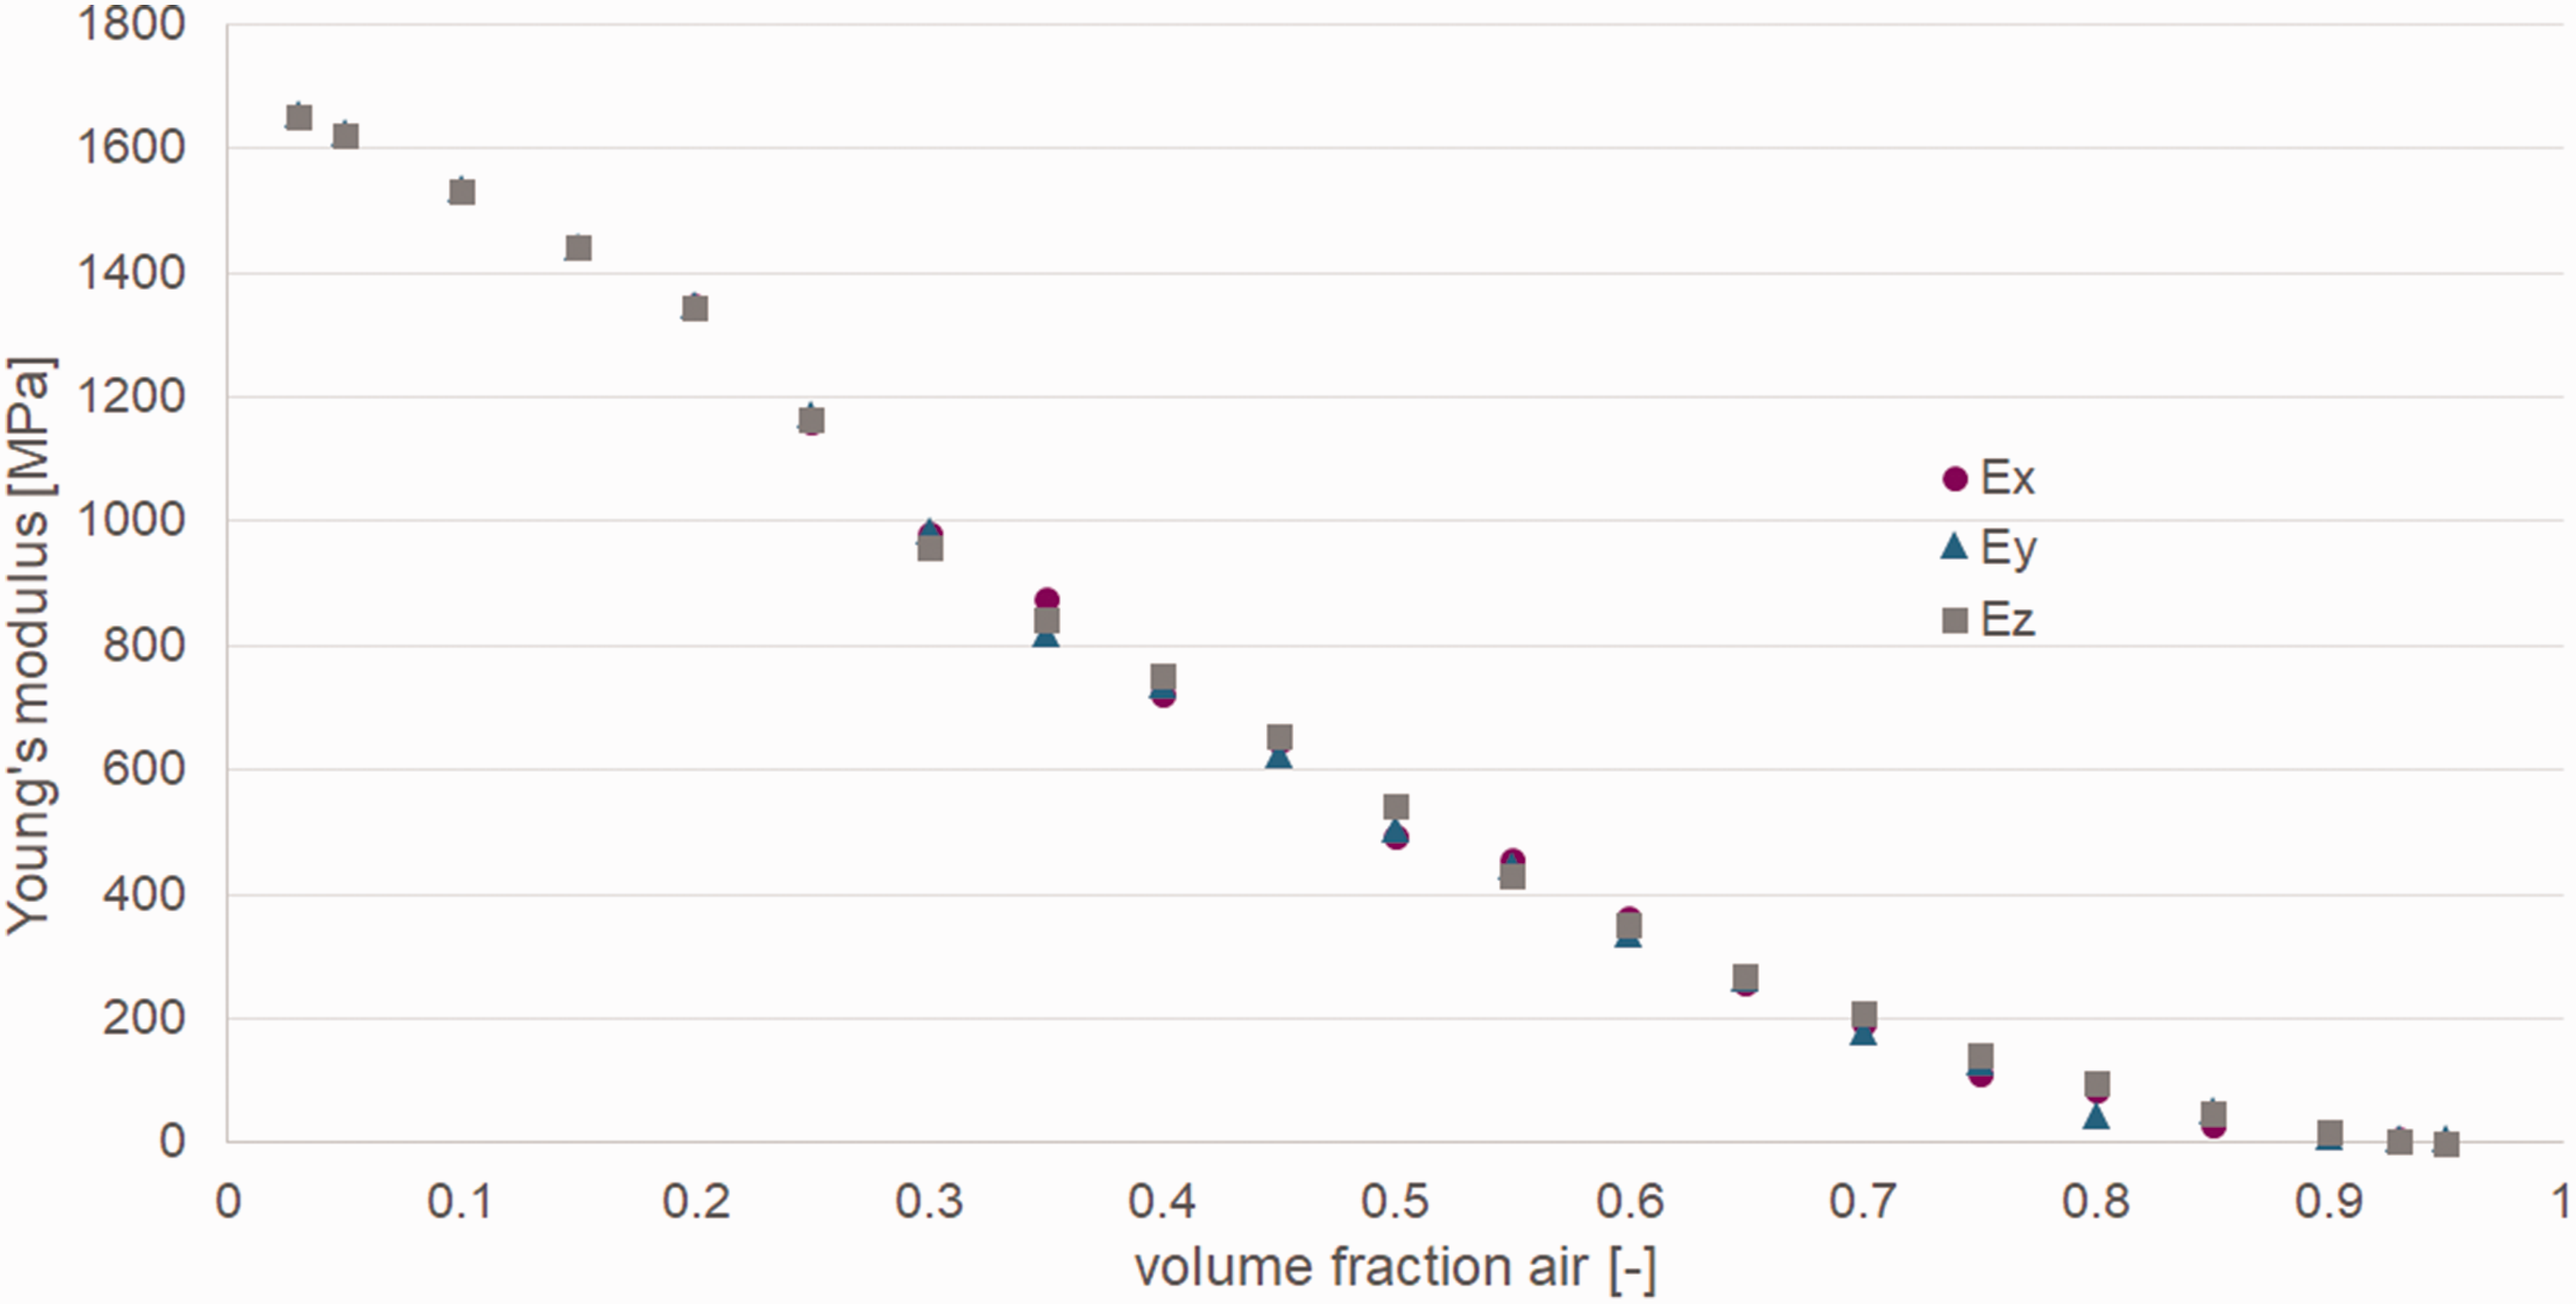
Illustration of the Young’s modulus values of the reference model in x-, y- and z-direction (Ex, Ey, Ez) over the volume fraction of air.
The reference foam model shows an isotropic behaviour which is already expected due to the spherical inclusions and their random orientation. Thus, further two simulation models are prepared which are similar to the reference model, only the inclusion shape is prismatic (like in Section “Cell shape”) and the orientation of the inclusions is modified in one model. The Young’s modulus values Ex, Ey and Ez are calculated for several volume fractions of air. The first model, where the inclusions are randomly orientated in the simulation box shows an isotropic behaviour like the reference model (Figure 16(a)). The second model, where the anisotropic cell shape is introduced by the orientation of the inclusions in x-direction reveals an anisotropic behaviour (Figure 16(b)).
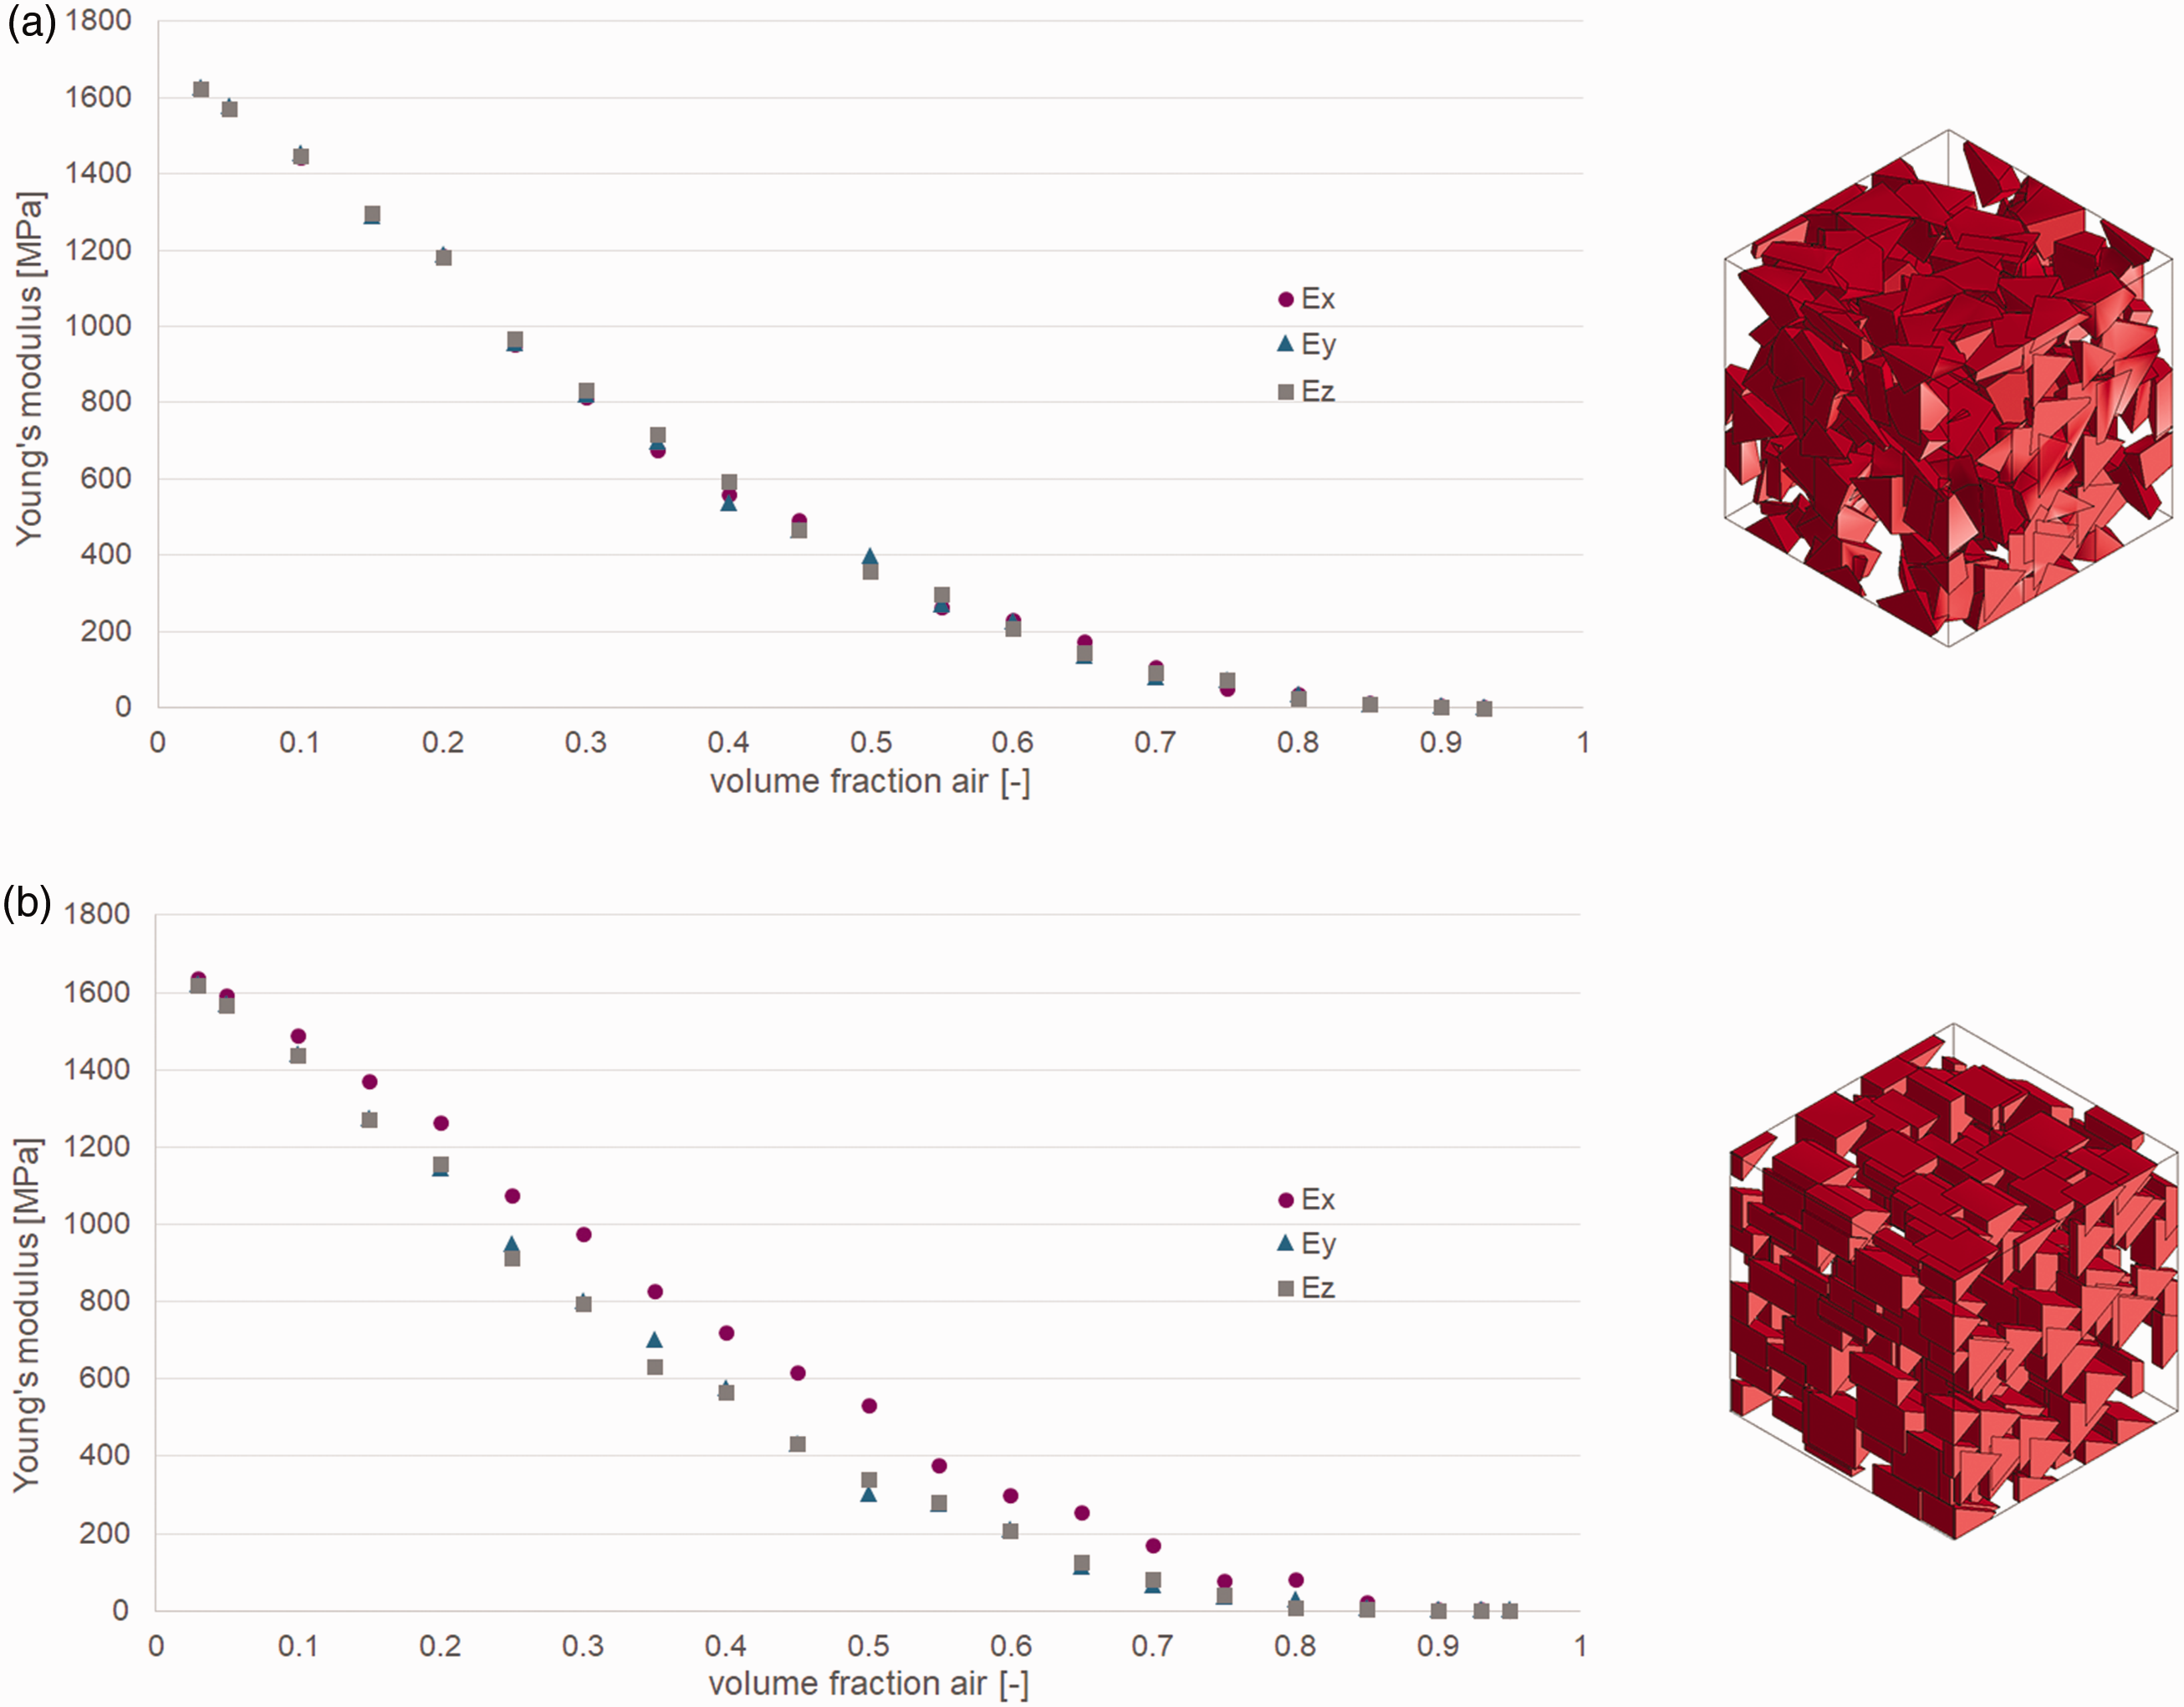
Illustration of the Young’s modulus values in x-, y- and z-direction (Ex, Ey, Ez) over the volume fraction of air for the model with prismatic inclusions with (a) random orientation and (b) fixed orientation in x-direction.
In y- and z-direction the Young’s modulus values are similar and lower than the Young’s modulus values in x-direction. The higher values in x-direction and therefore the anisotropic behaviour are caused by the alignment of the inclusions and bulk material in x-direction. This anisotropic behaviour can be increased by the inclusion shape. Thus, simulation models with prismatic inclusions with aspect ratios 0.5, 1 and 3 are prepared. The aspect ratio of the prismatic inclusions of the former model is 1. The definition of the aspect ratio for a prismatic inclusion and the Young’s modulus values in x- and y-direction for models with prismatic inclusions with different aspect ratios and with the alignment in x-direction are depicted in Figure 17.
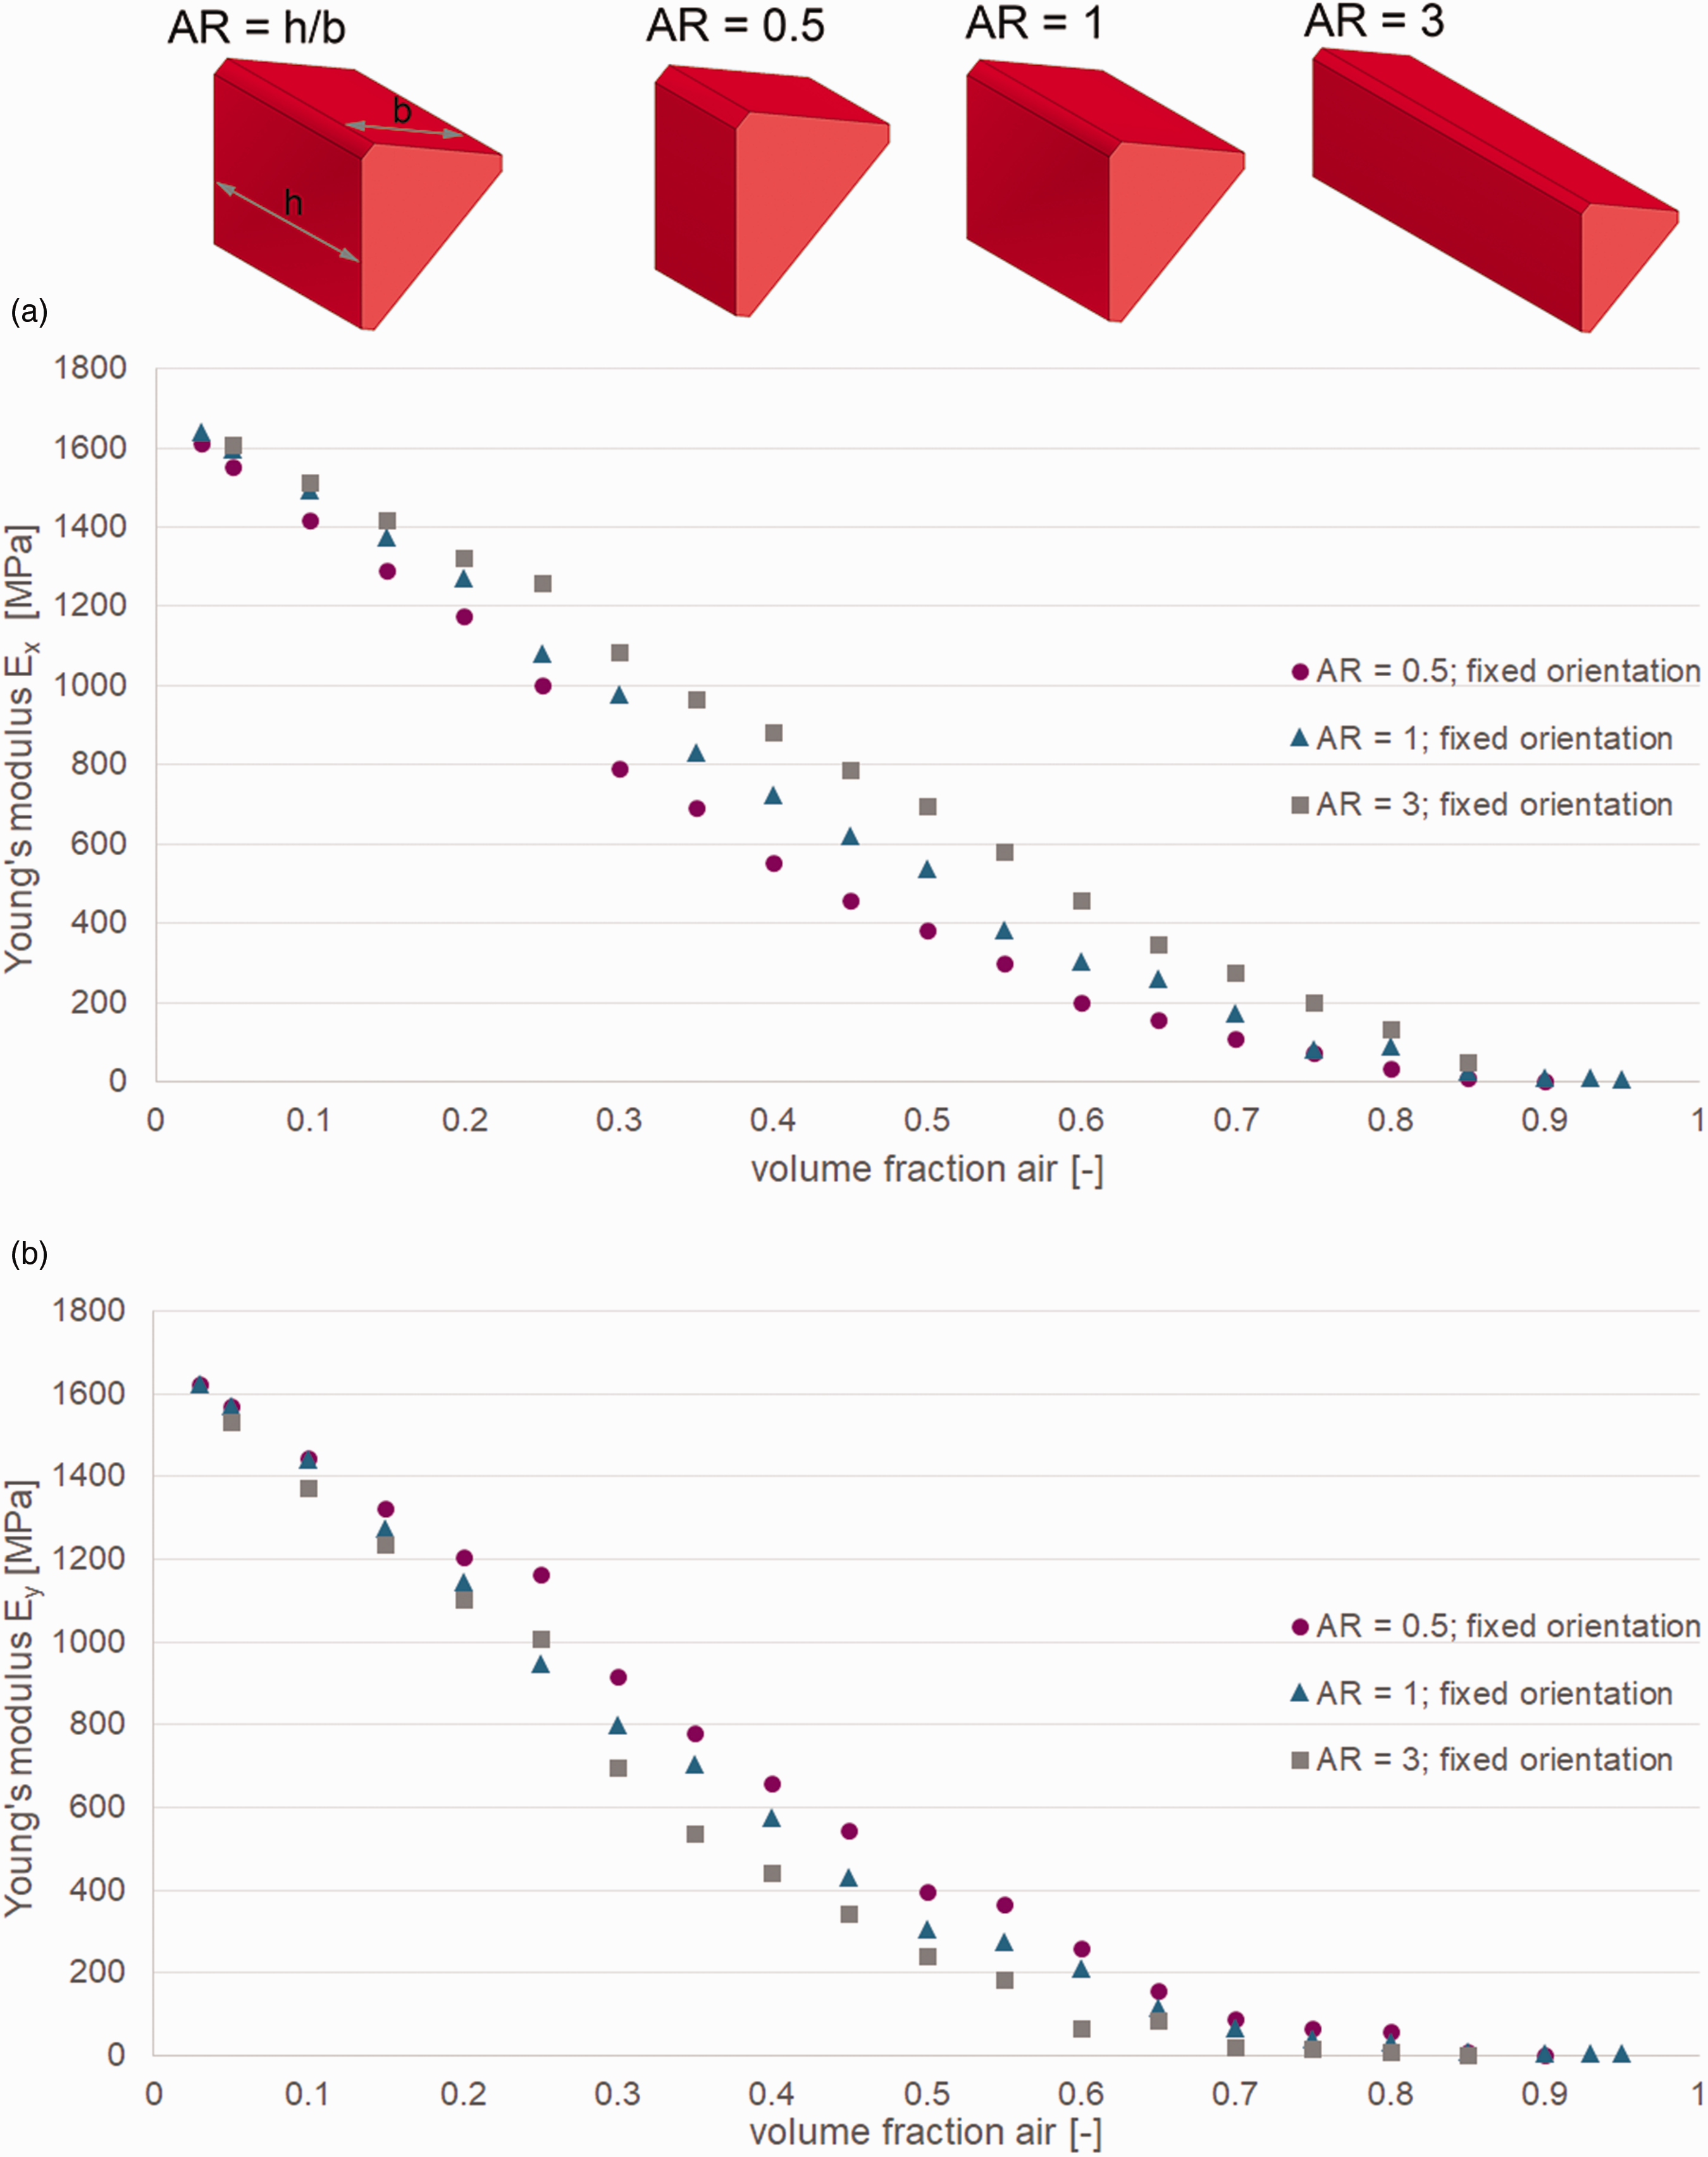
Illustration of the definition of the aspect ratio for a prismatic inclusion and Young’s modulus values of the models with prismatic inclusions with different aspect ratios (AR) in (a) x-direction and (b) y-direction.
It can be seen that the higher the aspect ratio, the higher the modulus values in x-direction (Figure 17(a)) and the lower the values in y-direction (Figure 17(b)). This means a more distinct anisotropic behaviour of the model with the prismatic inclusions with the highest aspect ratio (AR = 3).
Cell size
For the investigation of the cell size two models are used which have the same properties as the reference model, only in these models the diameter of the inclusions is fixed and not determined by the number of inclusions and volume fraction of air. One model has spherical inclusions with a diameter twice as big as the diameter of the spherical inclusions of the other model (
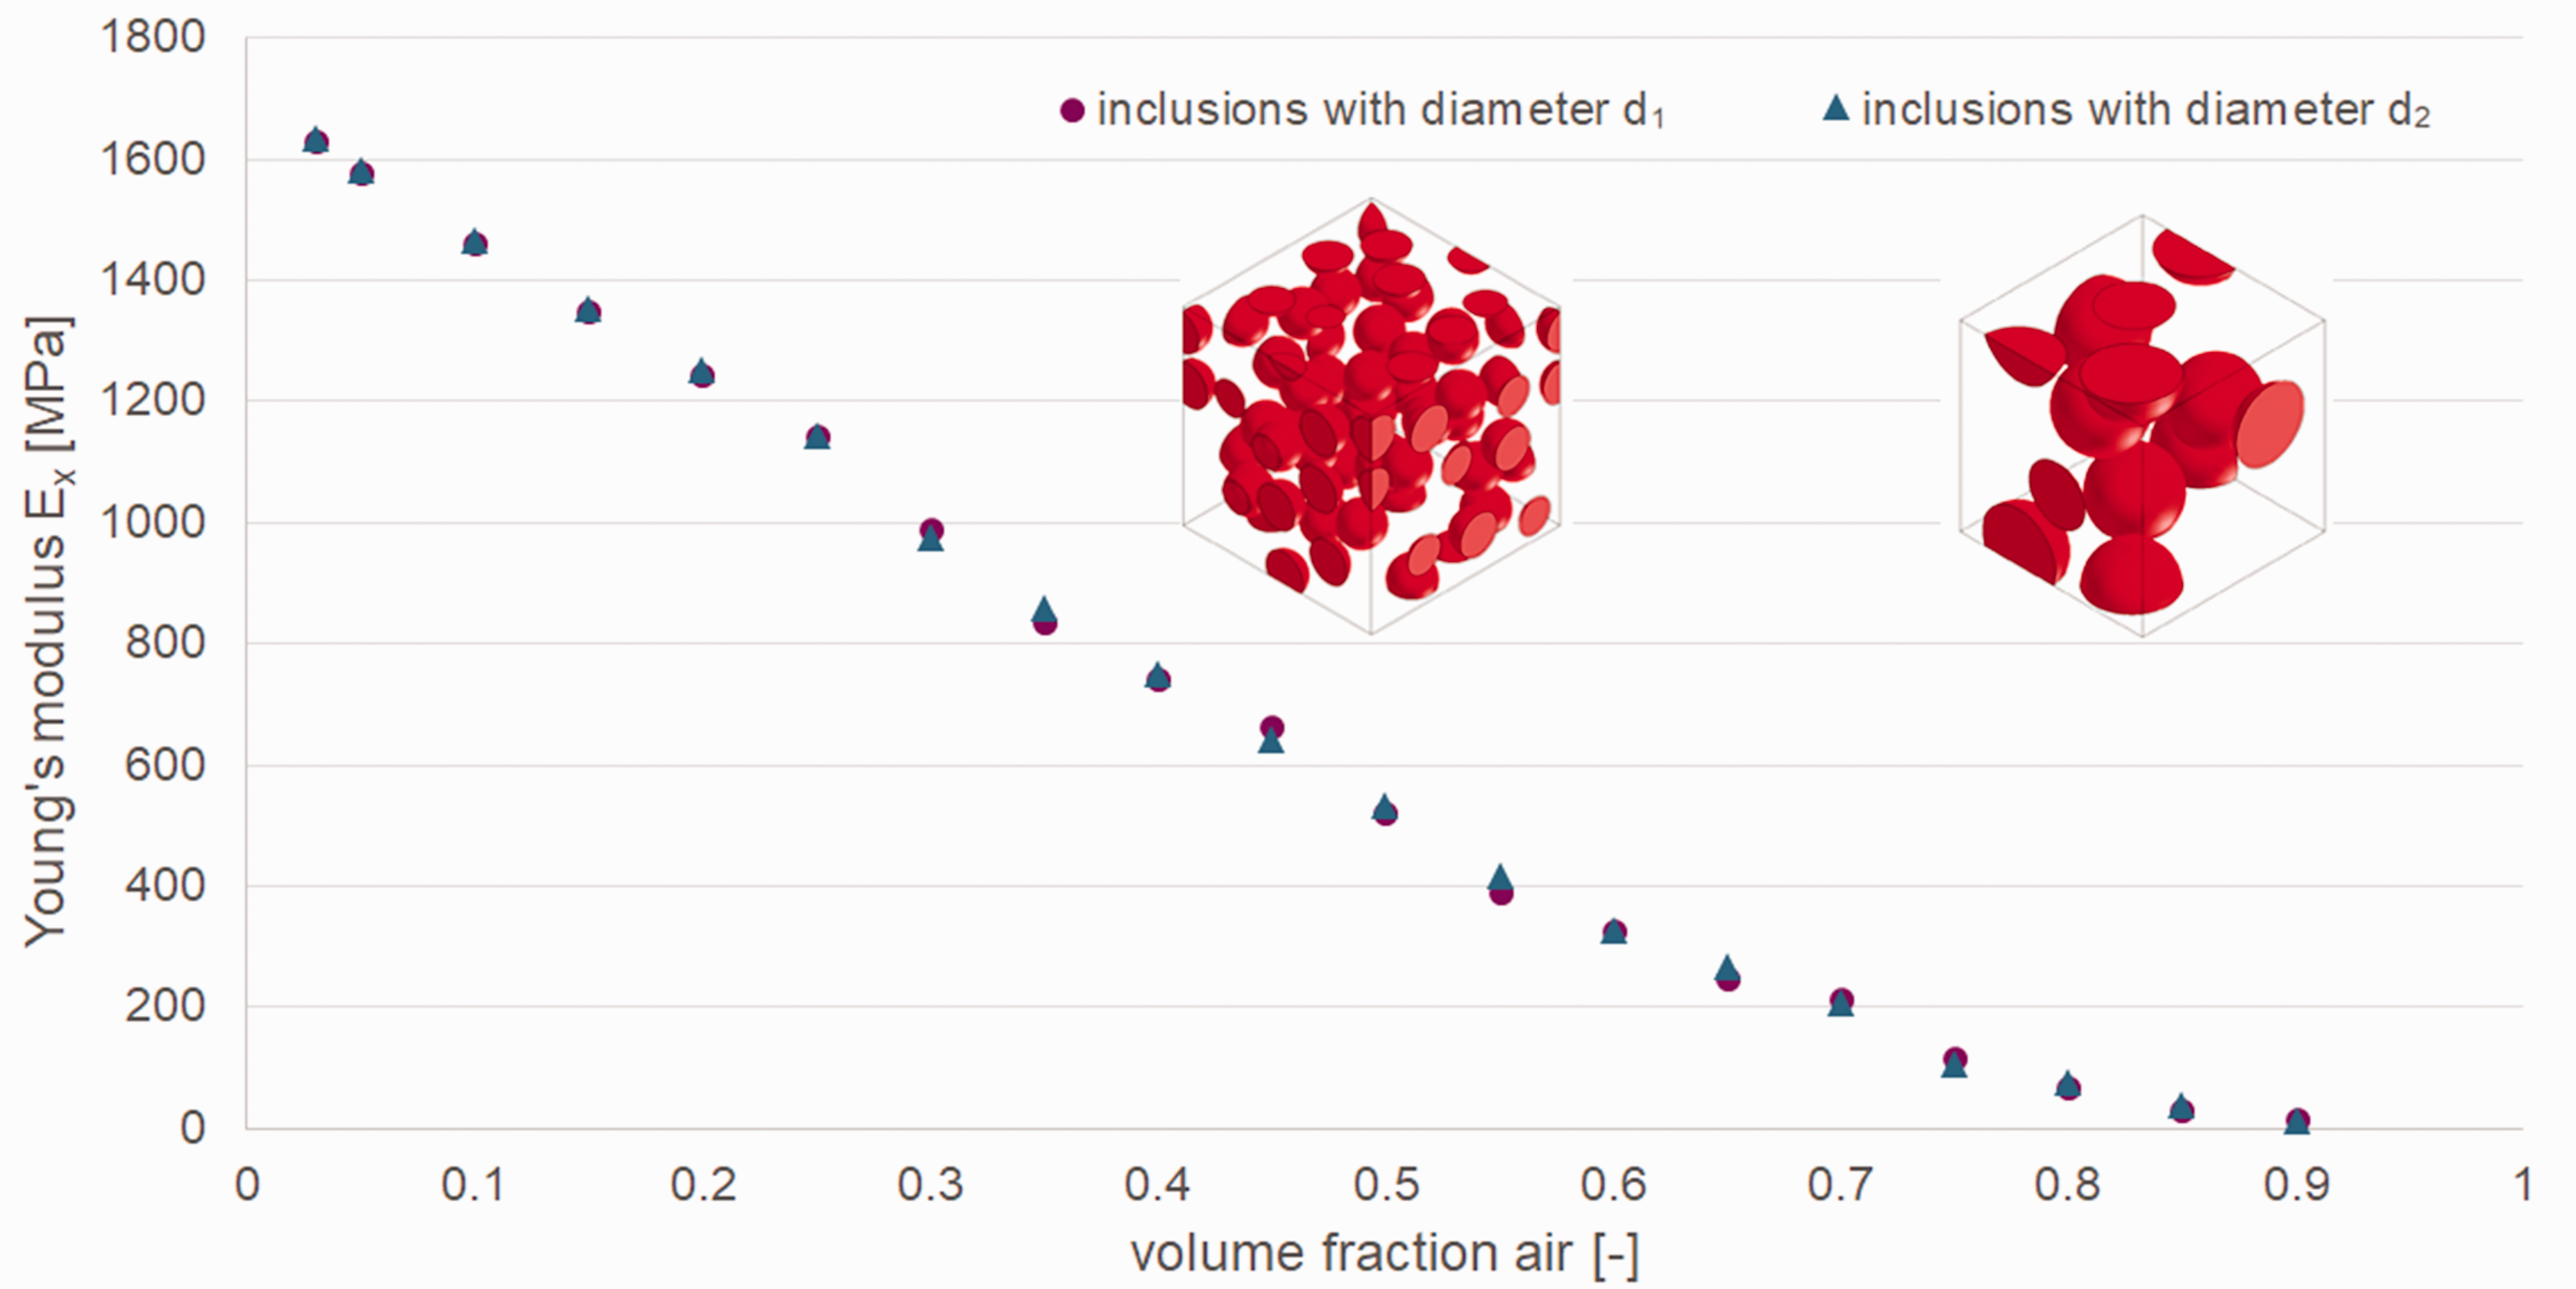
Comparison of the Young’s modulus values in x-direction (Ex) over the volume fraction of air for the model with spherical inclusions with diameter d1 and d2 (
The results show that the cell size does not have an influence on the Young’s modulus. To investigate the influence of the cell sizes in more detail an interphase has to be implemented due to the unit system used in the computing process in Digimat FE. In this system, no absolute units are defined but solely need to be in accordance to another, so scaling up or down will not alter the problem, and therefore will not affect the outcome of the analysis.
Cell size distribution
The reference model consists of spherical inclusions with constant size (diameter). For the investigation of the influence of the cell size distribution on the elastic properties of a foam, models are generated with specific cell size distributions, which are depicted in Figure 19.
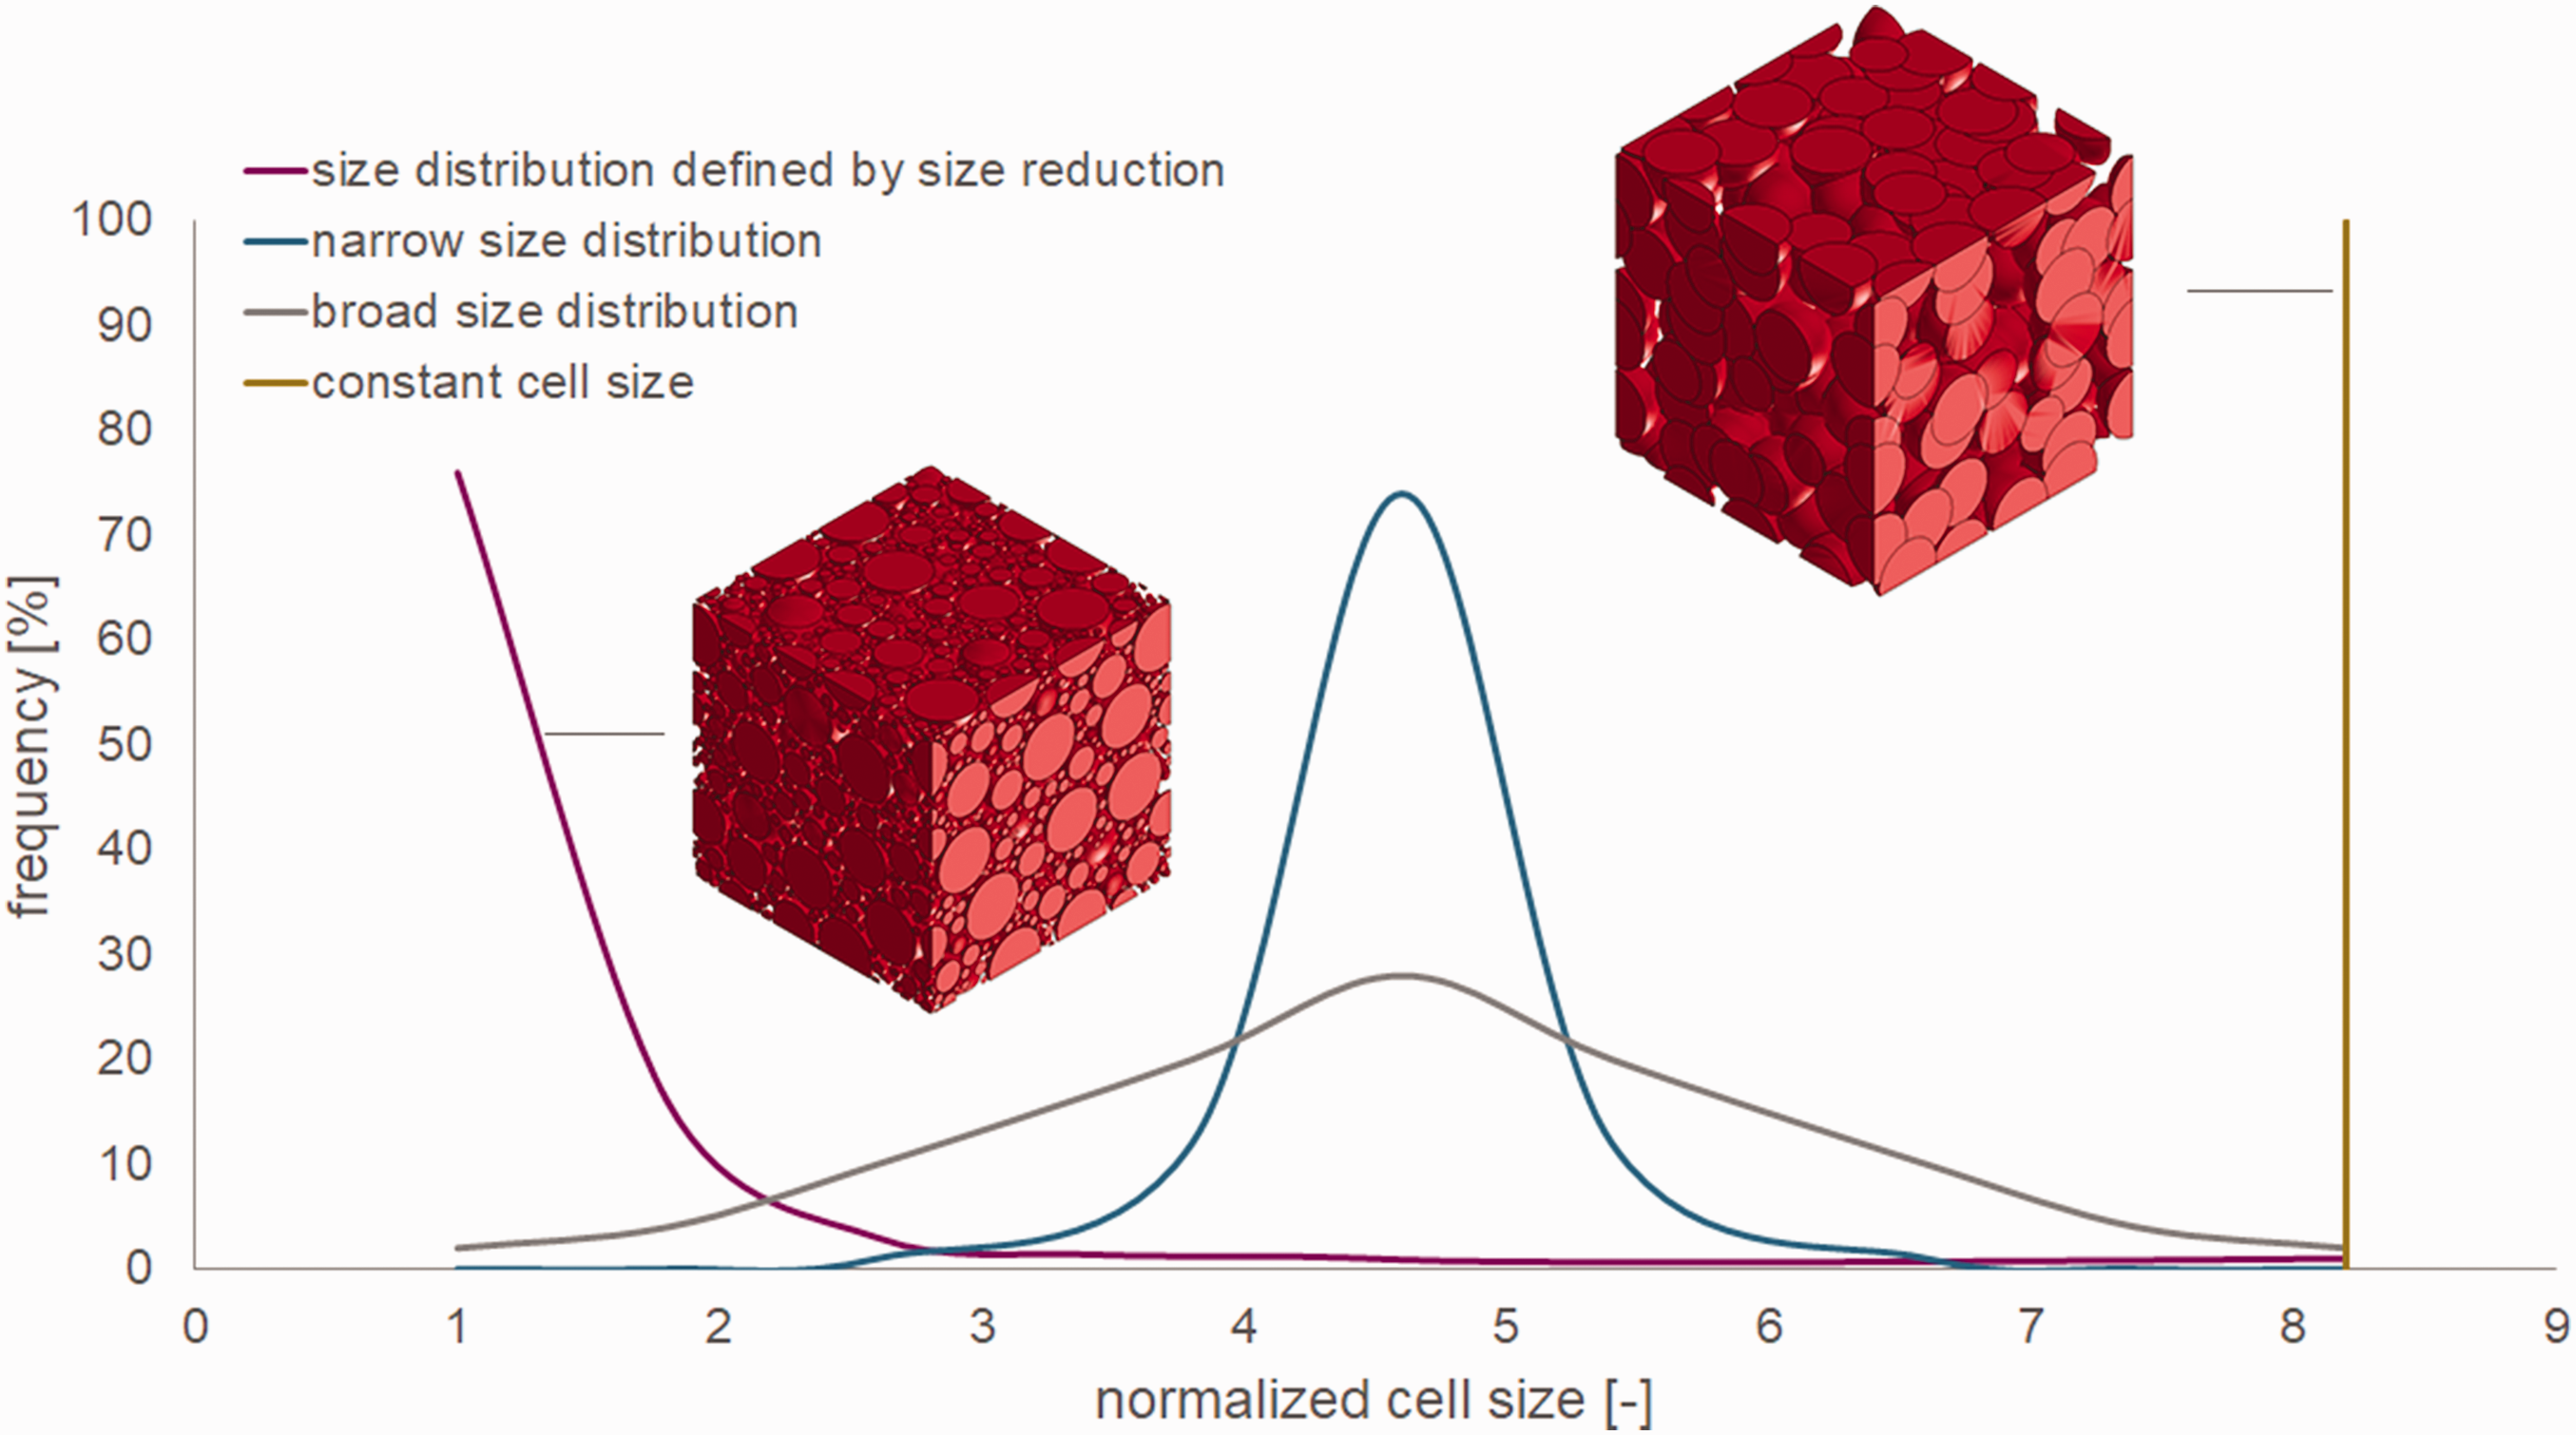
Illustration of the different cell size distributions and microcells with spherical inclusions with a constant cell size and with a cell size distribution which is defined by cell size reduction.
The percentage of cells which contain a specific cell size is shown. The cell size is normalized with regard to the smallest diameter in the distribution. The biggest cell size (normalized diameter = 8.2) is the cell size which is present in the reference model. The “size distribution defined by size reduction” is the size distribution, which is obtained if the size of several cells is reduced step by step so that the cells do not have to interpenetrate to reach a specific volume fraction of air because spherical inclusions can be denser packed if the sizes are different and if the cell sizes are small enough. Therefore, with this distribution no open cells are formed up to 60% volume fraction of air whereas with the other distributions and with a constant cell size from a certain volume fraction of air (≪60%) also open cells are formed to achieve the desired volume fraction of air because the cells interpenetrate. In Figure 20 the Young’s modulus values of the models for 60% volume fraction of air are illustrated.
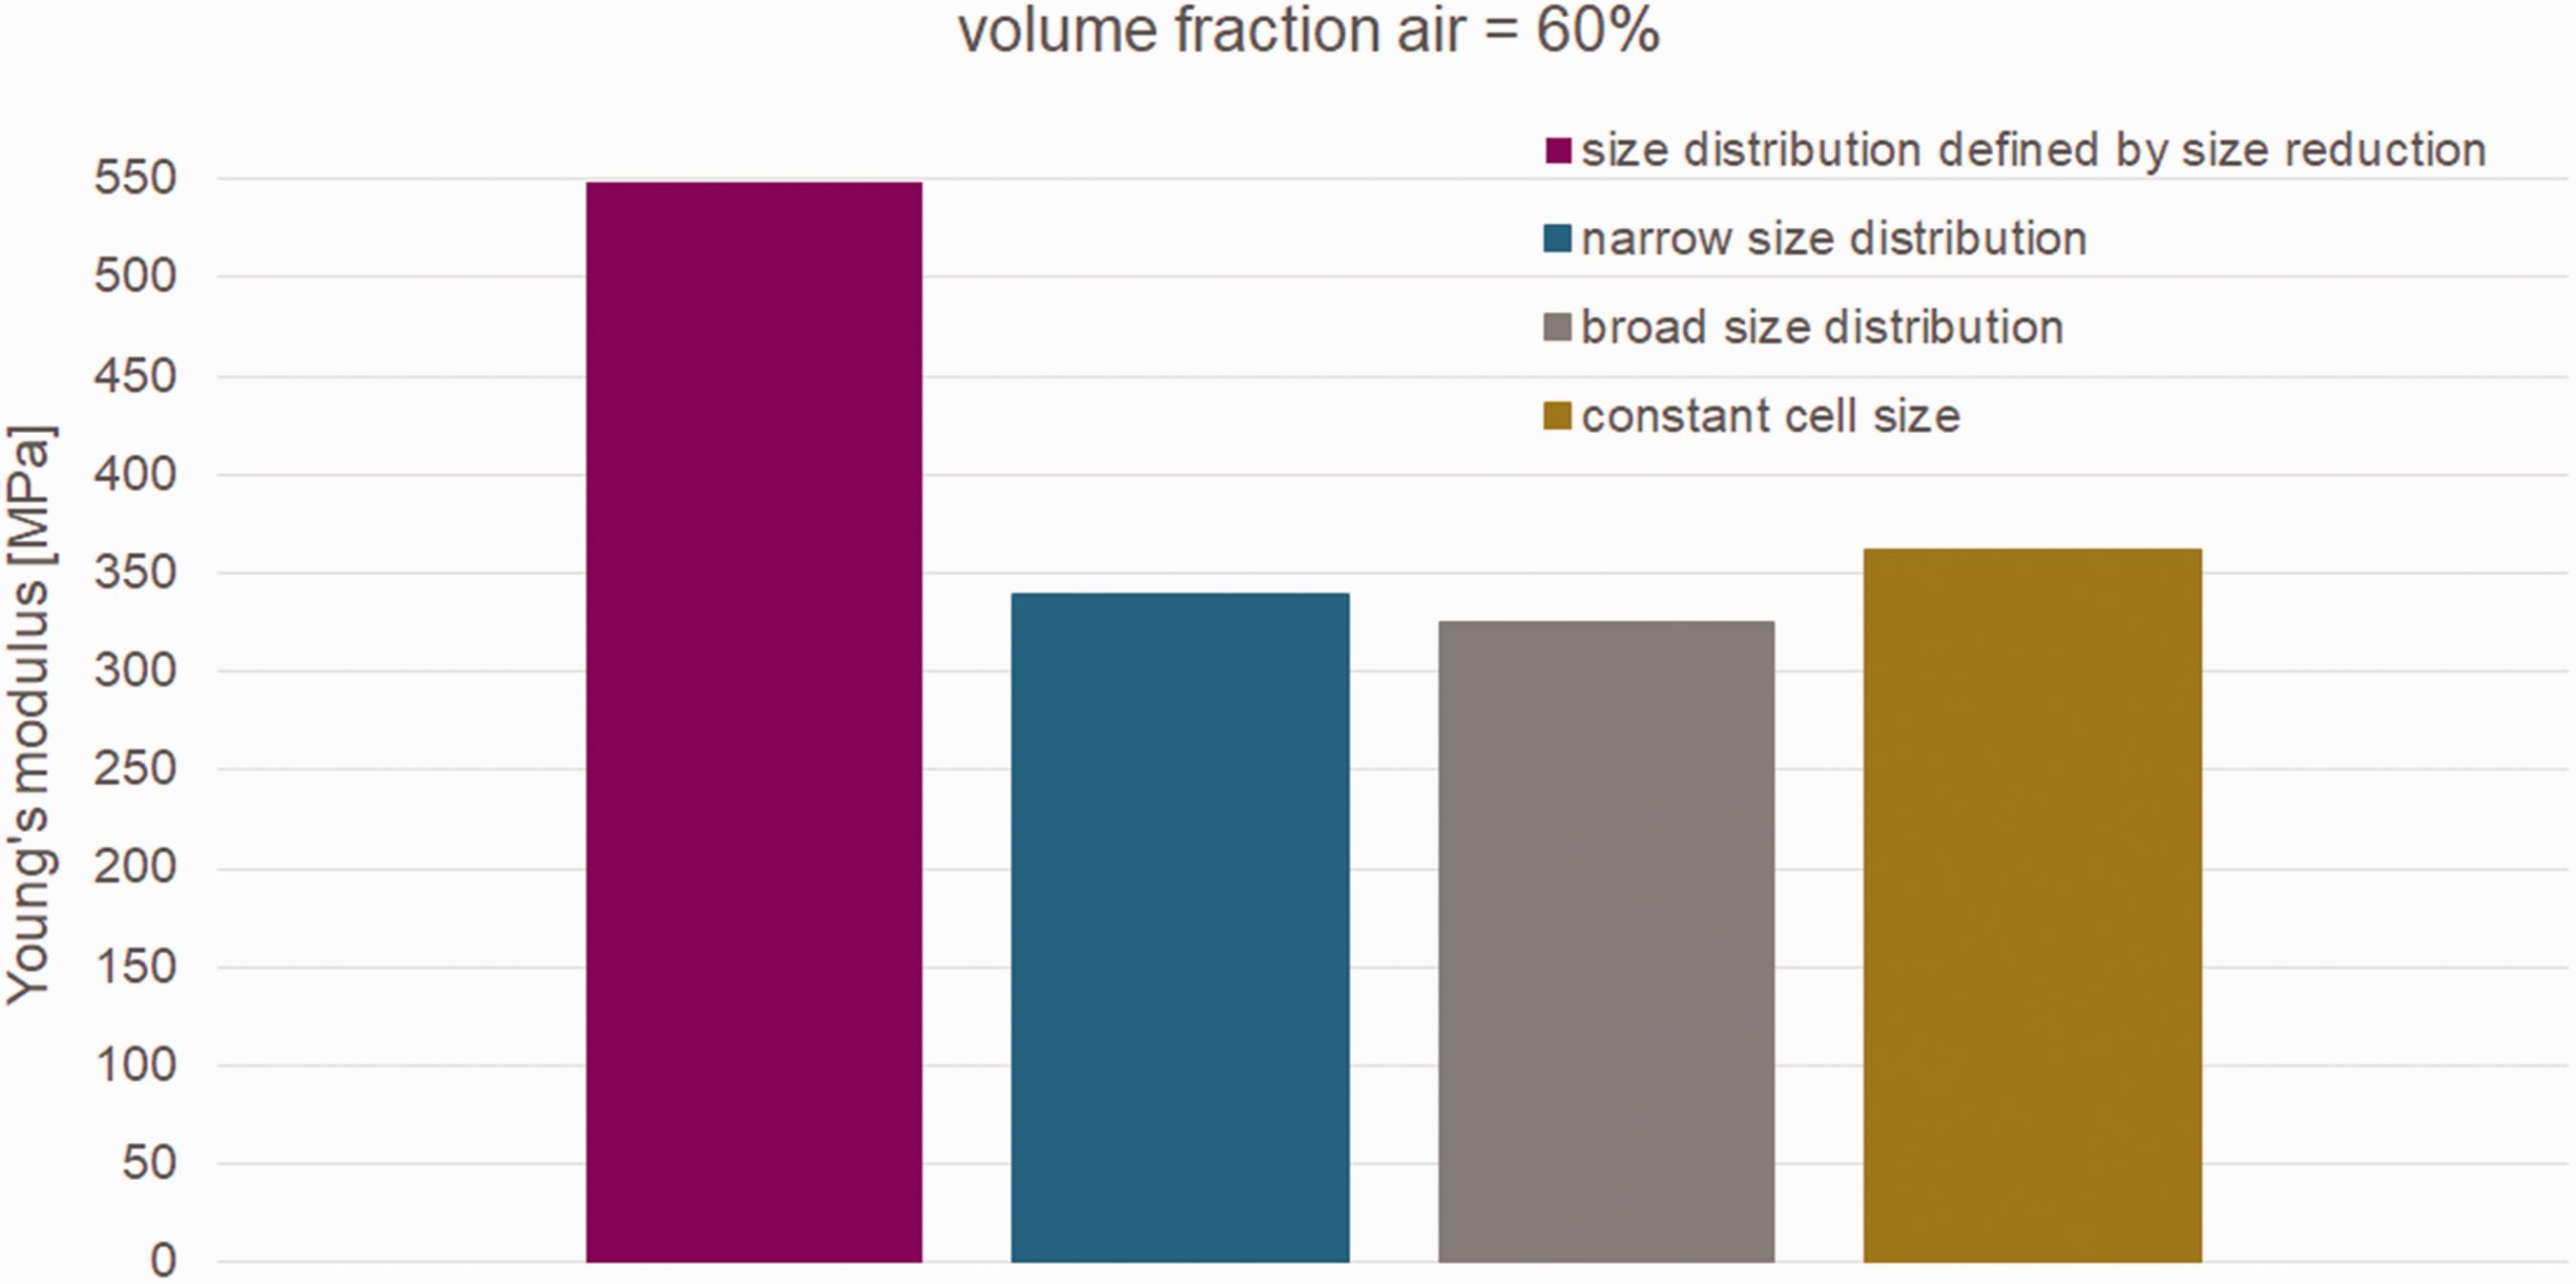
Comparison of the Young’s modulus values for 60% volume fraction of air for the models with constant cell size and different cell size distributions.
The model with the cell size distribution which is defined by size reduction obtains the highest Young’s modulus value compared to the other models. The reason for this higher value is that the model with constant cell size and with the narrow and wide cell size distribution exhibit open cells whereas the model with the cell size distribution which is defined by size reduction exhibits solely closed cells. In the models with the narrow and broad size distributions the cell sizes are not small enough to obtain a foam with solely closed cells. Because of the formation of open cells in the model with constant cell size and with the narrow and broad cell size distribution the obtained Young’s modulus values are similar. The influence of open cells on the Young’s modulus is discussed in more detail in the next section.
Cell topology (open cell content)
As already shown in the previous section, the open cells have a significant influence on the elastic properties. This influence is investigated in this section in more detail. The reference model is compared with a model which is generated with the third approach introduced in Section “Models from Digimat FE”. The model consists of spheres which are modelled as air and which are coated with the bulk material. The matrix is also modelled as air. The volume fraction of the coating is limited because for very high volume fractions the microcell cannot be generated. Thus, with this approach only foams with 25% volume fraction of air or higher can be generated. Since the matrix is modelled as air, not the entire air is in the inclusions. The volume fraction of matrix is set constant with 10% for all the simulations. The total volume fraction of air in the model with the coated inclusions is the sum of the volume fraction of the matrix and the inclusions. To investigate the influence of the open cells in the foam, definitions for the “open cell content” for the model with coated spheres and the reference model are introduced.
In the coated foam model closed cells are formed although the spheres interpenetrate due to the coating. Thus, the “open cell content” is defined as the volume fraction of the air in the matrix because the air in the inclusions is enclosed in the cells. The volume fraction of the air in the matrix increases if the volume fraction of the coating is not achieved which is the case for high volume fractions of coating and low volume fractions of air, respectively. For higher volume fractions of air its volume fraction in the matrix reaches a nearly constant value of approximately 10% (Figure 21) because the volume fraction of coating is low. Thus, the formation of open cells is low for high volume fractions of air in the model with the coated spheres.
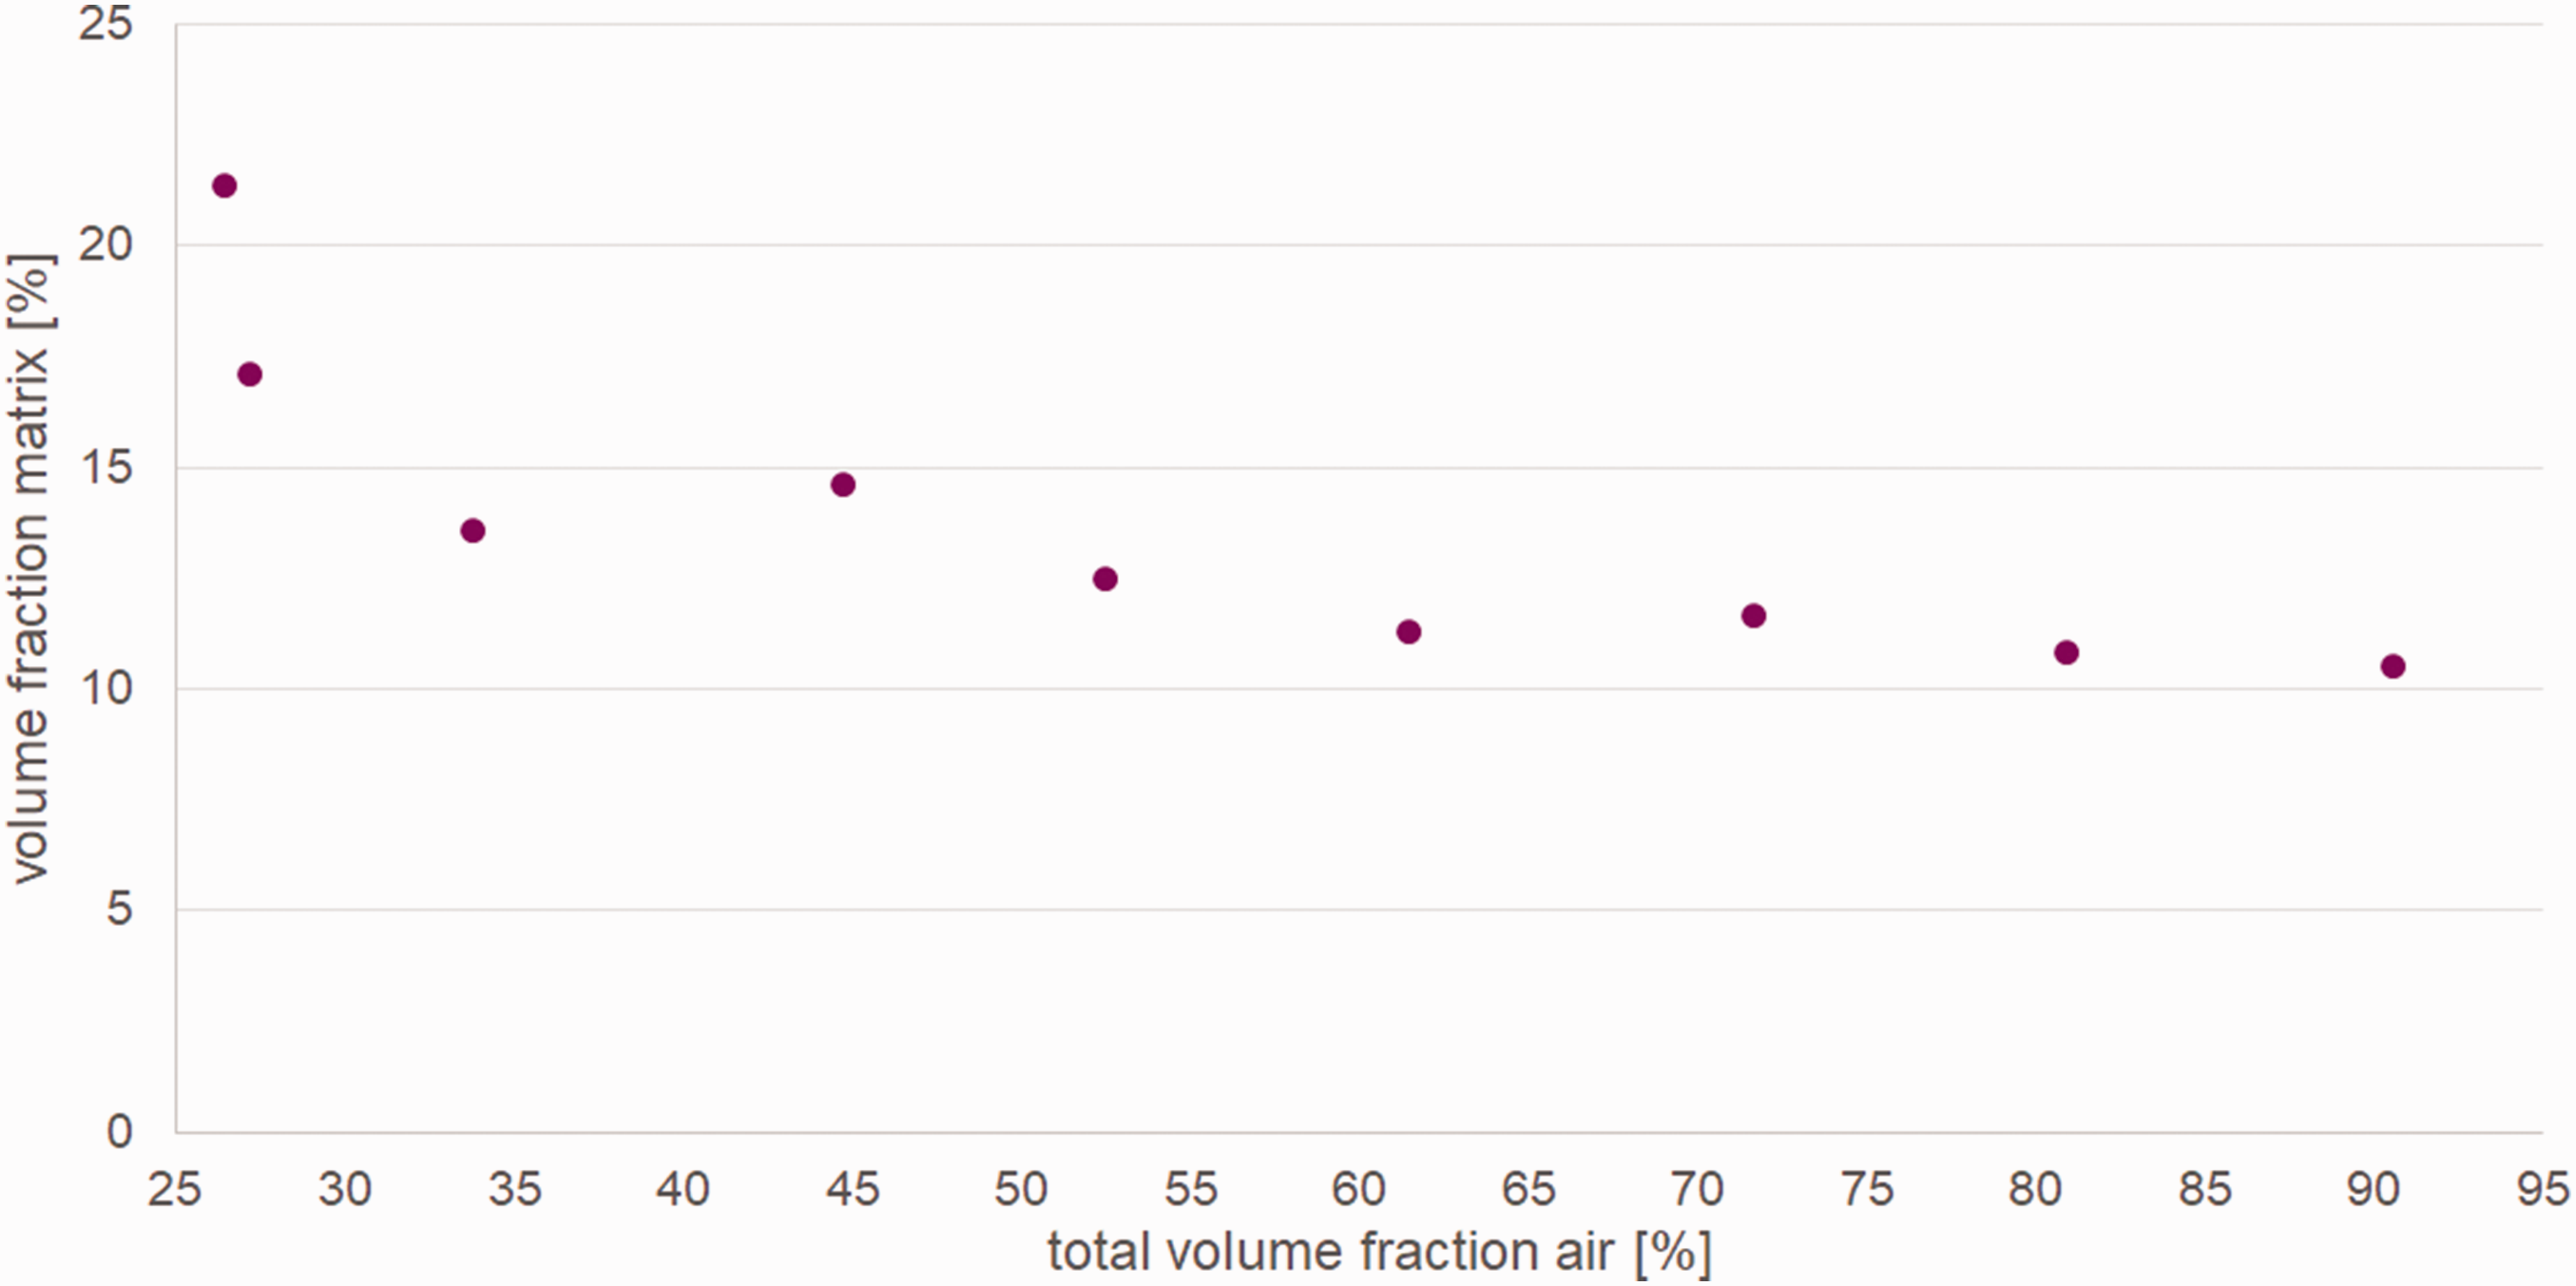
Illustration of the volume fraction of the matrix (equated with the open cell content) over the total volume fraction of air.
For the reference model the “open cell content” is defined by the distance between the particles to each other, which is stated as “relative mean nearest neighbour distance” and by the number of additional spheres, which are necessary to achieve the desired volume fraction of air due to the interpenetration of the inclusions. The nearest neighbour distance is the distance of a sphere to its closest adjacent sphere. The relative mean distance is the average distance of all spheres relative to the diameter of the spheres. If the spheres do not interpenetrate then the relative mean distance is 1 else it is smaller than 1. The smaller this value, the more the spheres are interpenetrated. More interpenetration means that more open cells are formed. This is the case for high volume fractions of air (Figure 22).
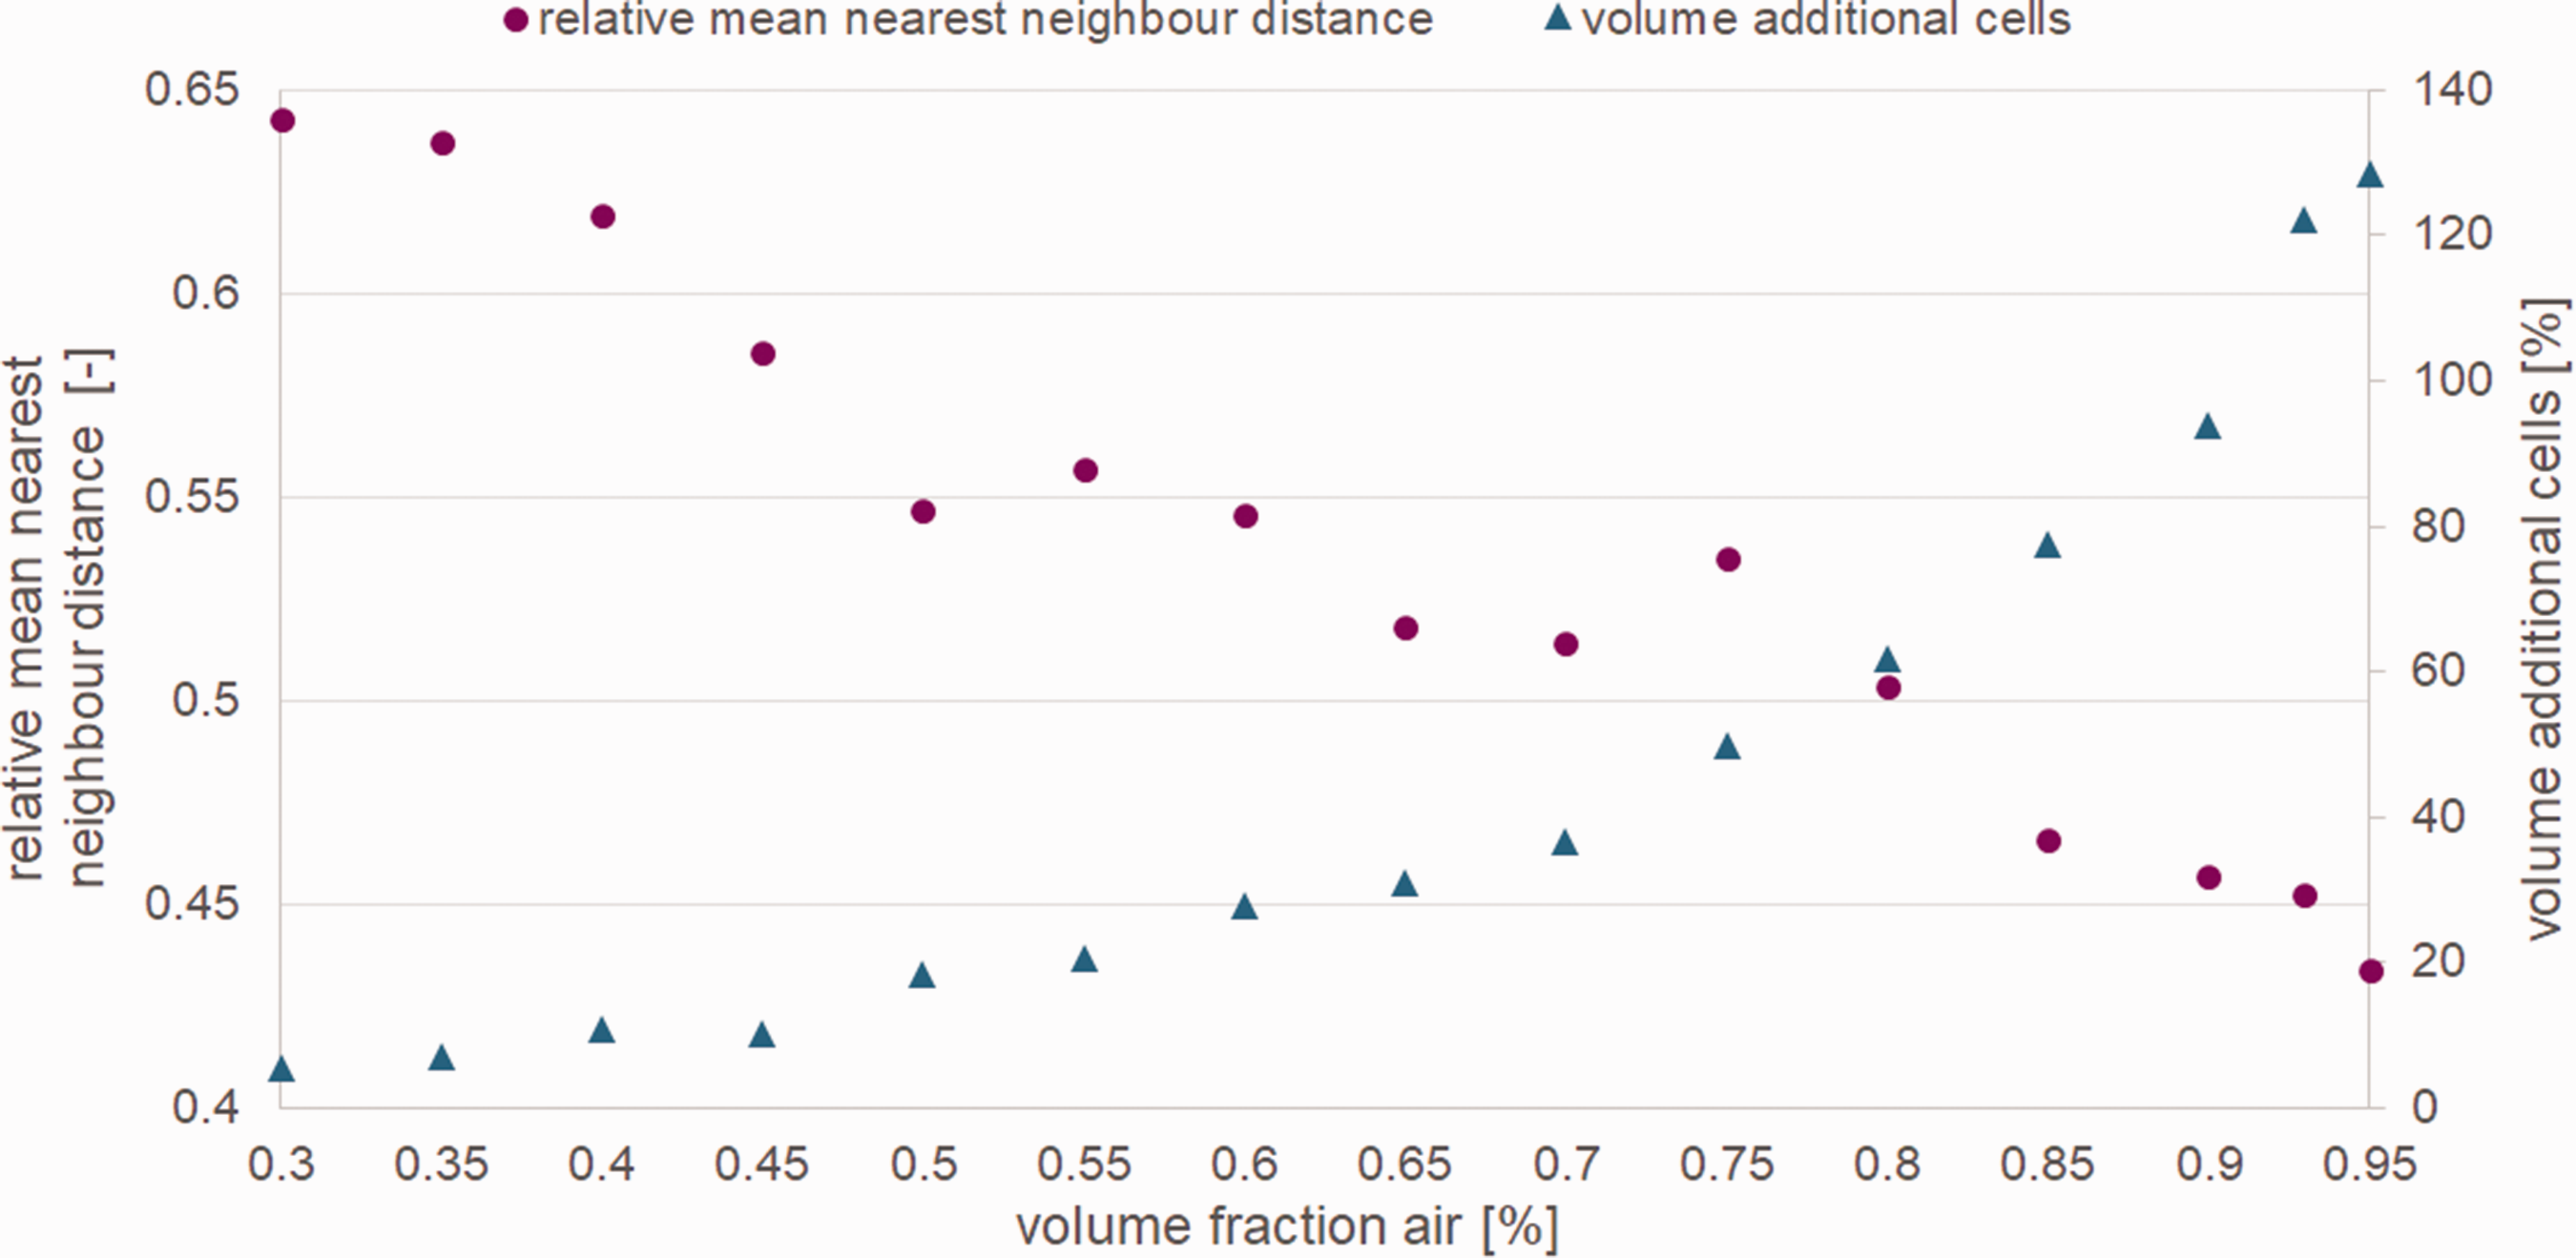
Illustration of the relative mean nearest neighbour distance and the volume of additional cells needed to achieve the desired volume fraction (decisive for the degree of interpenetration) over the volume fraction of air.
The number of inclusions is 100 in the reference model. Thus, in the foam model generation with these 100 spheres it is tried to achieve the desired volume fraction of air. Due to the interpenetration of spheres more spheres are needed to achieve the volume fraction. The number of additional spheres and their volume, respectively is an indicator of the degree of interpenetration of spheres. Therefore, also with this value the degree of open cells formed can be estimated. For higher volume fractions of air the volume of additional cells increases due to the higher amount of spheres interpenetrating (Figure 22). For the reference model interpenetrated cells are formed from 30% volume fraction of air. That means that for lower volume fractions of air the relative mean nearest neighbour distance is 1 and the number of cells is 100 and that therefore all cells are closed. With increasing volume fraction of air the formation of open cells increases.
The two models are compared with regard to their elastic properties. In Figure 23 the Young’s modulus values and the Poisson’s ratios of the two models are illustrated.
Comparison of the Young’s modulus and Poisson’s ratio values of the reference model (no coating) and the model with coated spheres for several volume fractions of air.
The influence of open cells on the stiffness can be clearly seen. For lower volume fractions of air the reference model shows higher Young’s modulus values than the model with the coated spheres because in the reference model only a few open cells are formed. For higher volume fractions of air the relation is reversed. The model with the coated spheres forms only a few open cells, whereas in the reference model the interpenetration of the spheres is high, and thus many open cells are formed.
The Poisson’s ratio values and the curve progression obtained by the two models are quite similar from 30 – 80% volume fraction of air. For higher volume fractions of air the Poisson’s ratio values of the reference model significantly drop whereas the values obtained by the model with the coated spheres stay nearly constant between 0.25 and 0.3, and thus it is similar to the defined Poisson’s ratio of the air (ν = 0.3).
Comparison of modelling methods for closed cell foams with regard to the elastic properties
In this section a comparison of some selected direct and constitutive models with regard to the Young’s modulus, shear modulus, bulk modulus and Poisson’s ratio is presented. The following models are compared: Mean field homogenization method Mori Tanaka Model Composite Sphere Model for foam Generalized Self Consistent Model for foam Ramakrishnan-Arunachalam Model Direct models Digimat FE (reference model) Skeleton Cubic Cell Model (the analytical model for closed cell foam with Kelvin Cell Model (the analytical model which is presented in Simone et al. (1998)60) Isotropic Flat Plate Model
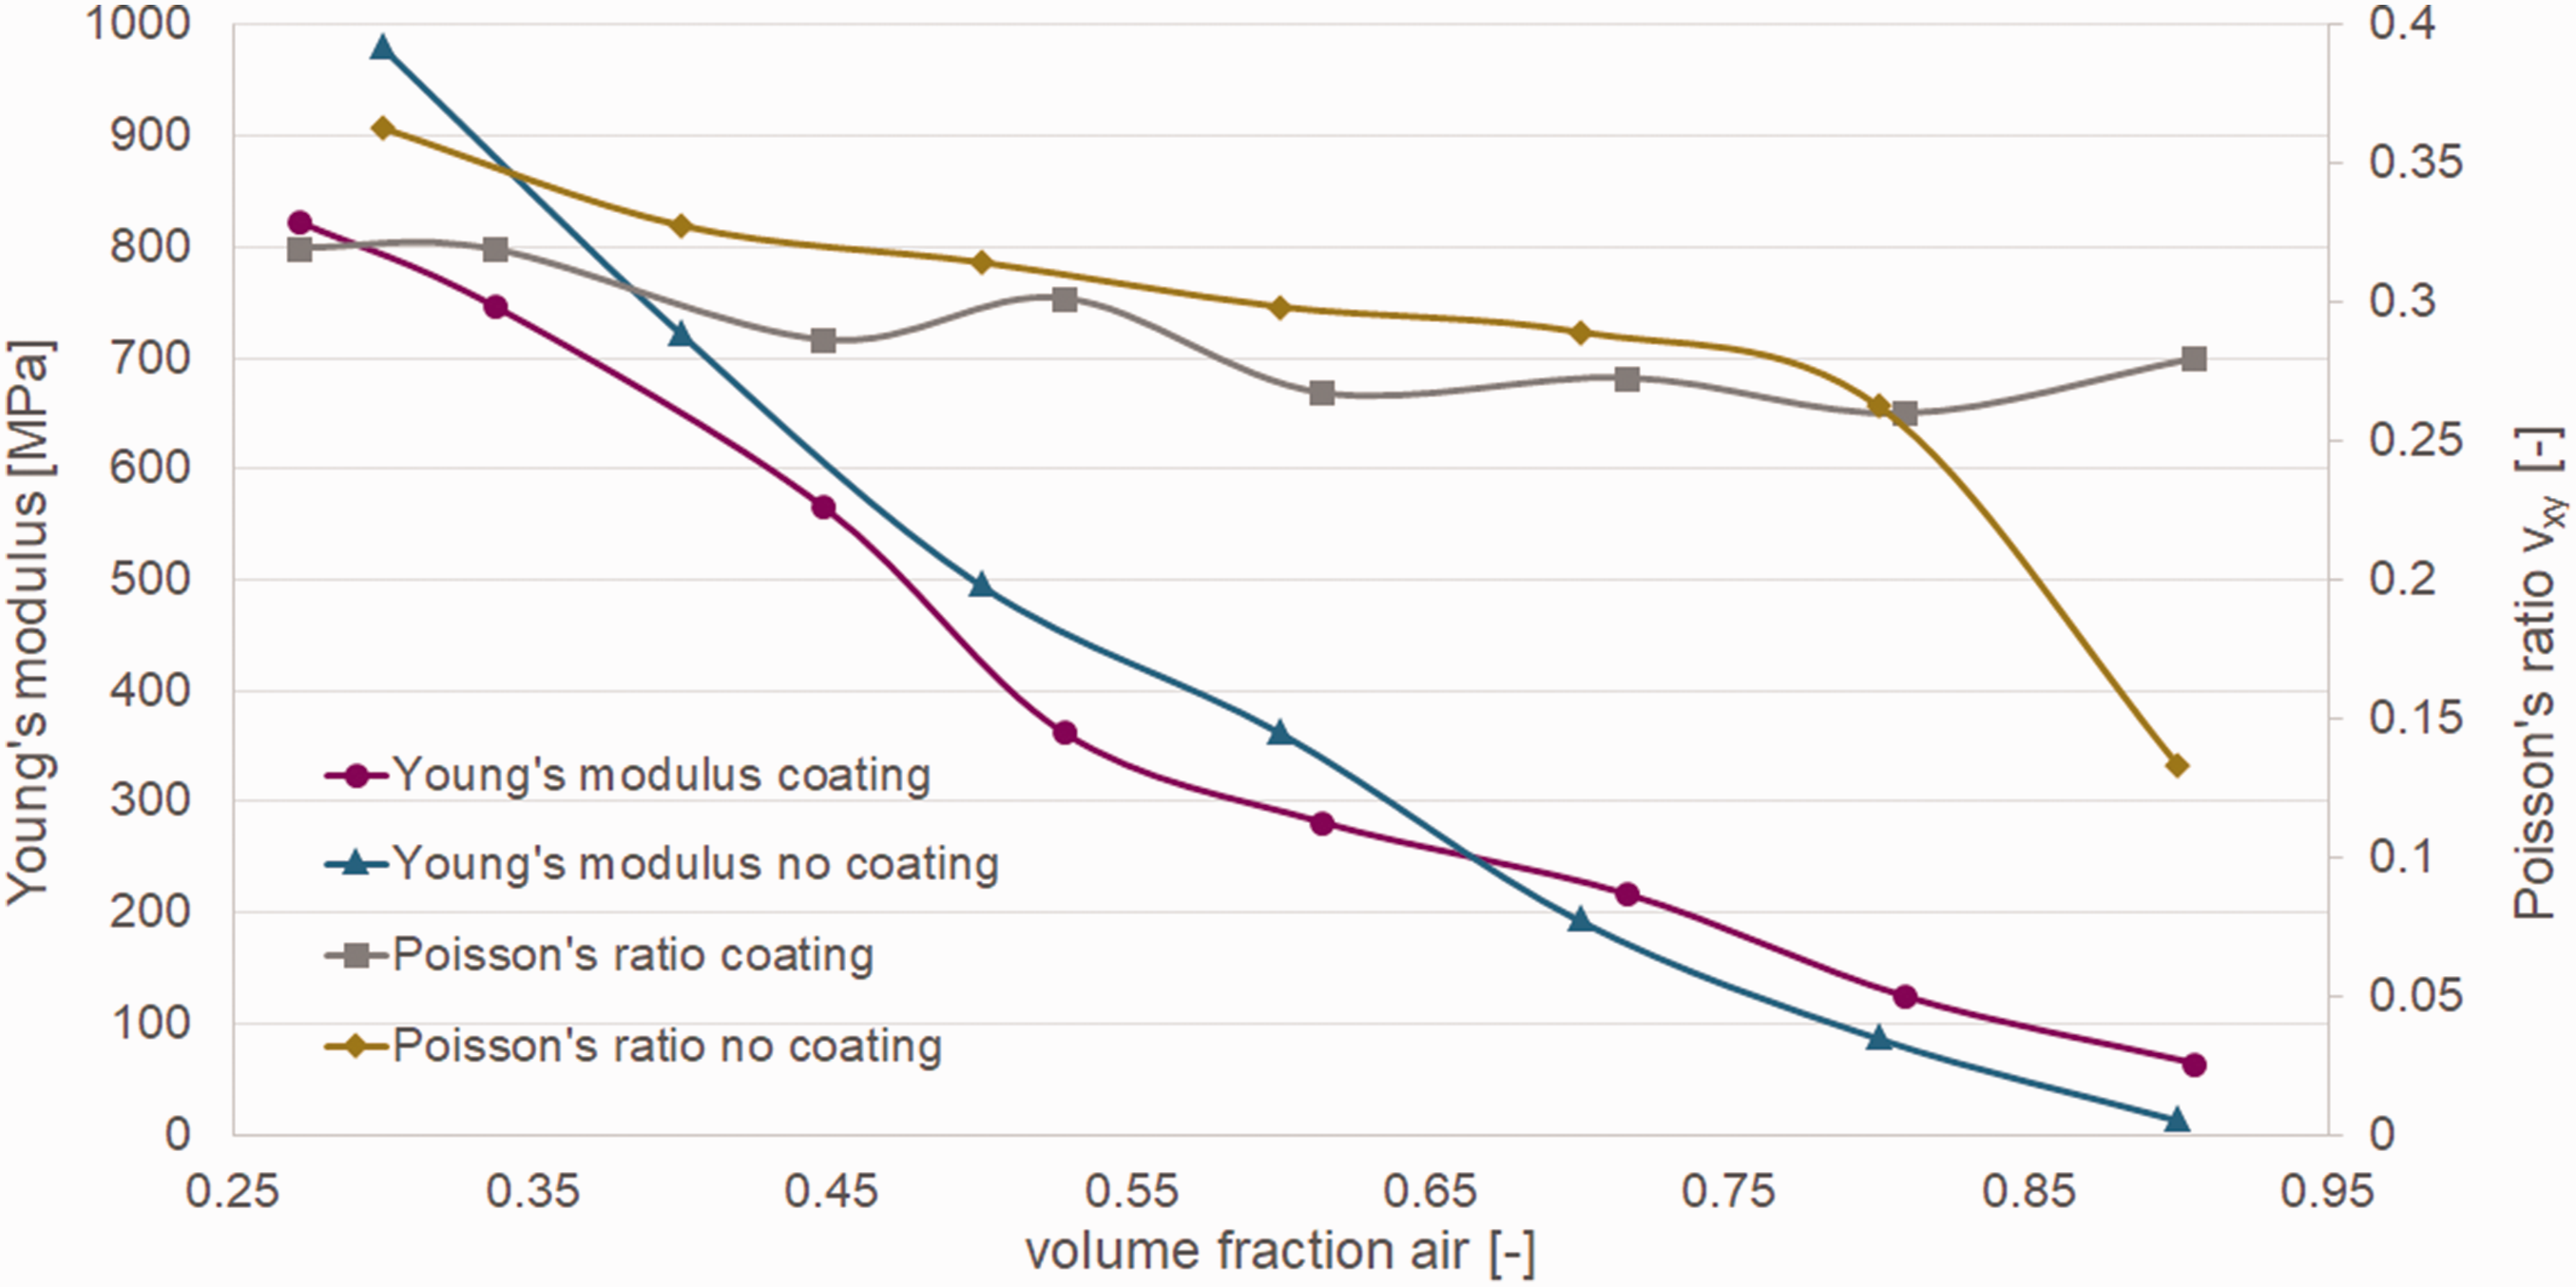
For the sake of clarity, the comparison of the Young’s, shear and bulk moduli of the different models is based on a relative modulus. The modulus values are normalized with regard to the modulus of the bulk material and one representative curve is illustrated in Figure 24 for the specific model. This can be done because the curve progression of the different moduli of one specific model is similar.
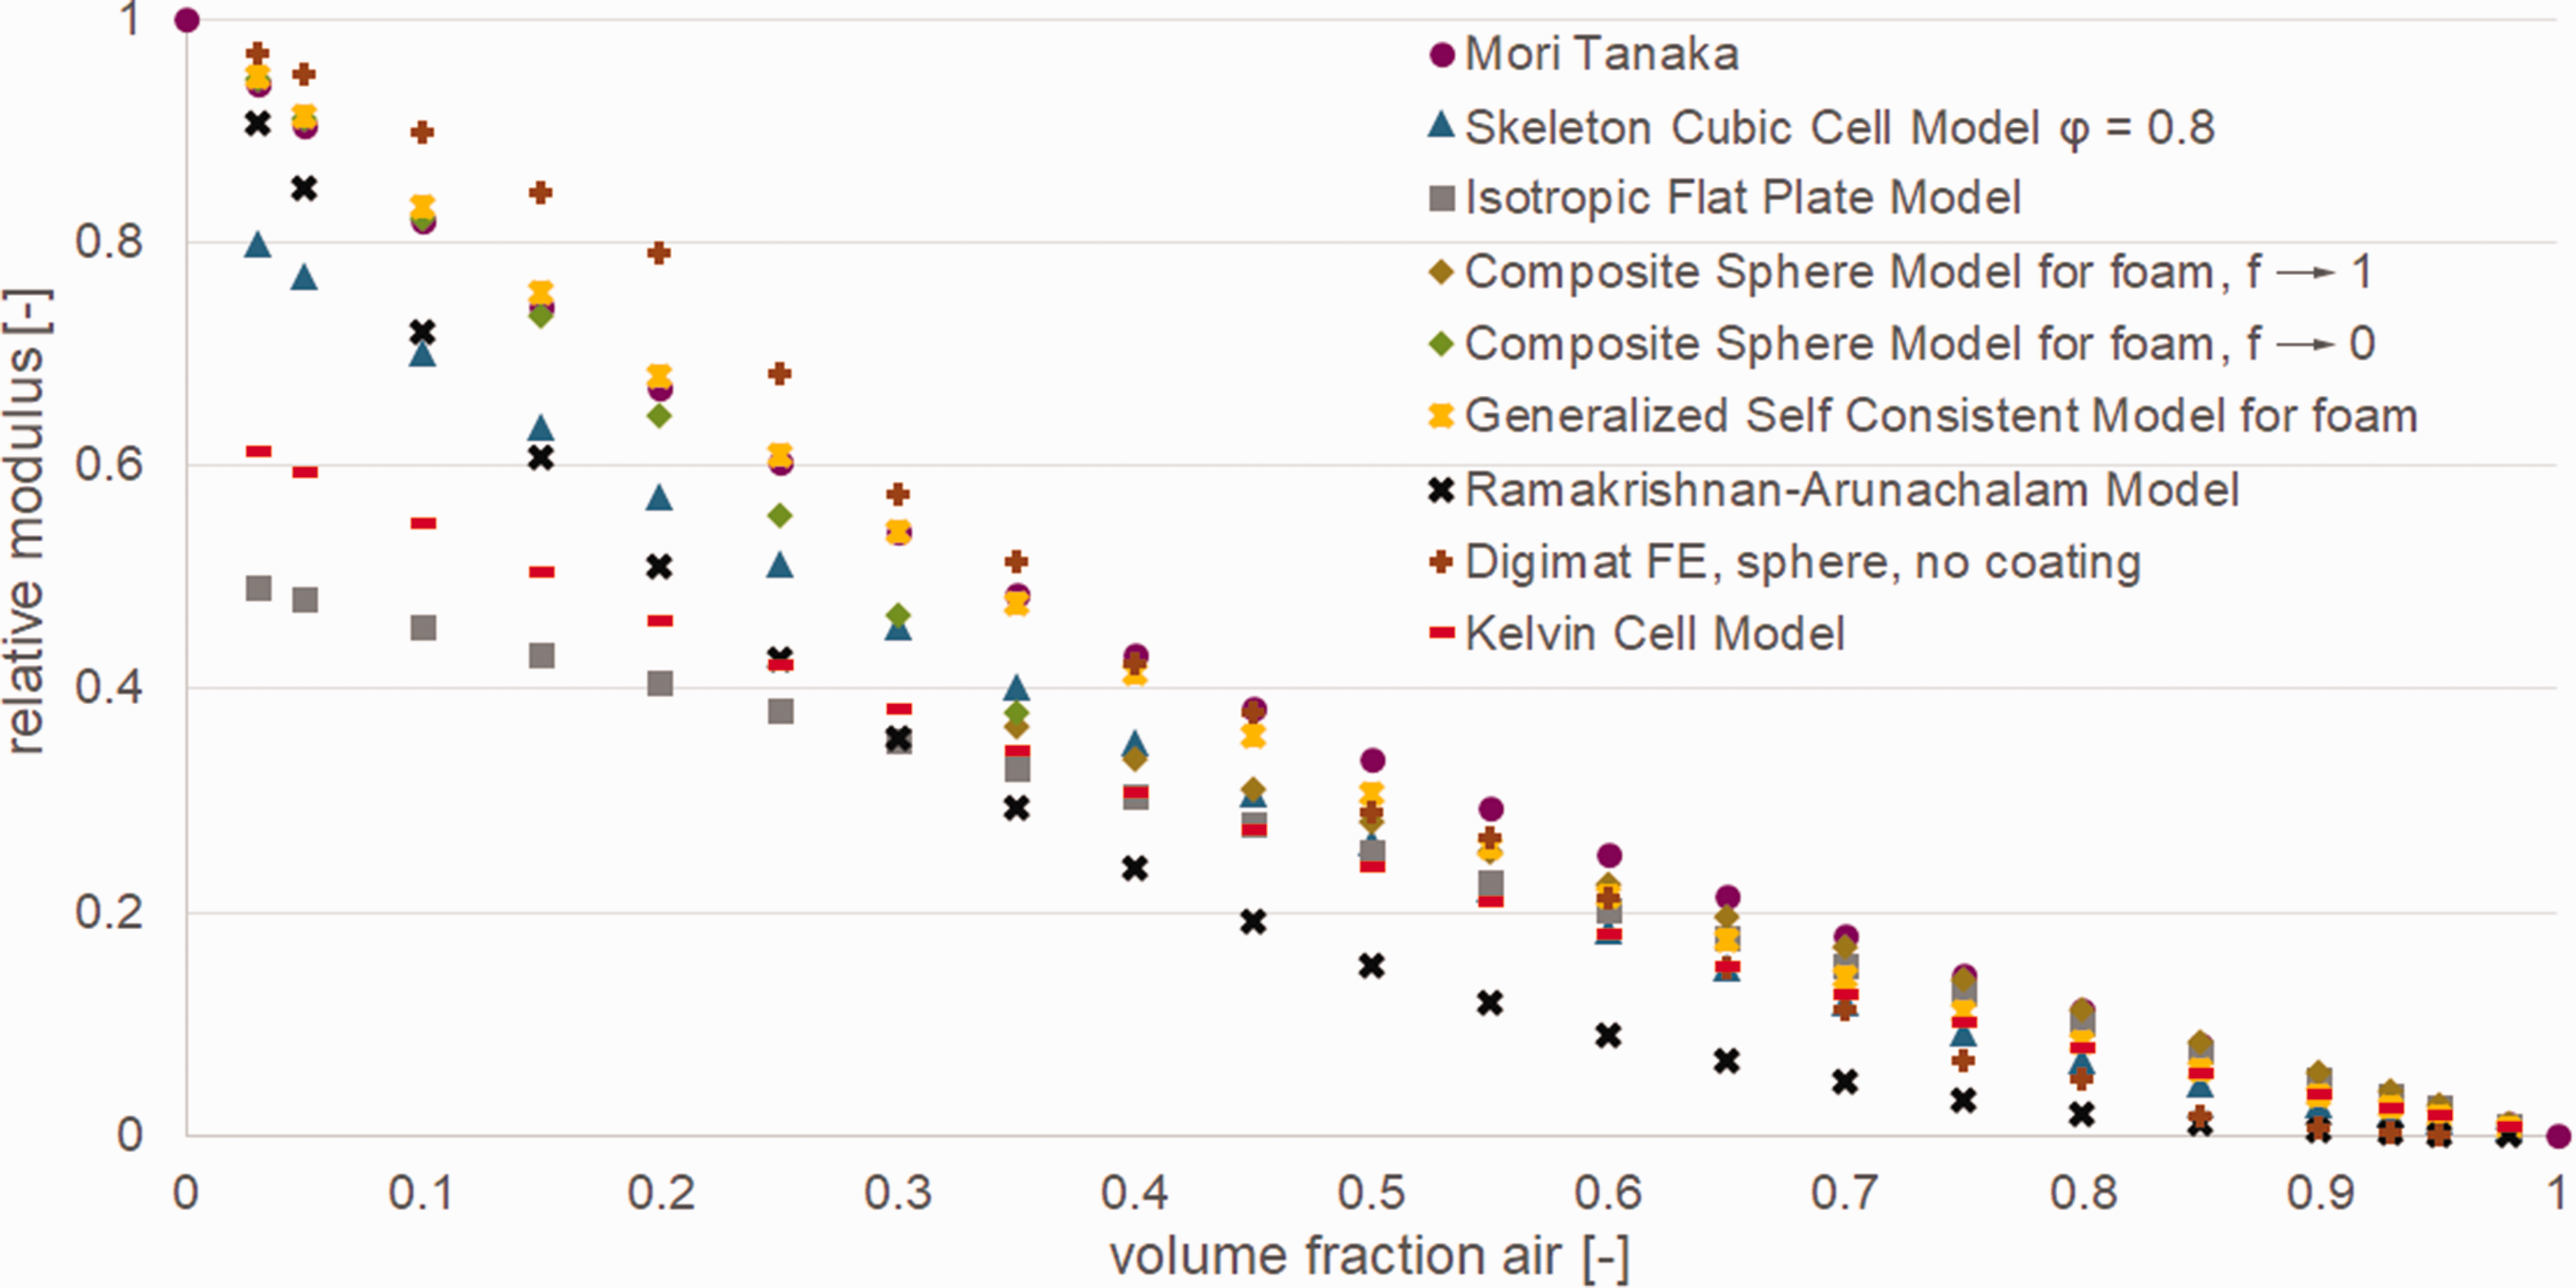
Comparison of different modelling methods based on a relative modulus.
The comparison shows that for volume fractions from 0% to 35% the Digimat FE model determines the highest values. For volume fractions from 35% to 100% the Mori Tanaka Model shows the highest values and the values obtained by Digimat FE decreases more steeply than the other models, with the exception of the Ramakrishnan-Arunachalam Model which estimates the lowest values for volume fractions from 35% to 100%. With the Kelvin Cell Model and Isotropic Flat Plate Model the lowest Young’s modulus values are calculated for volume fractions of air lower than 25%. The results of the Skeleton Cubic Cell Model show a similar trend as the results of the Mori Tanaka Model, only the values are lower. For volume fractions higher than 50% the Skeleton Cubic Cell Model, Kelvin Cell Model and Isotropic Flat Plate Model exhibit similar results. The Generalized Self Consistent Model for foam and the Composite Sphere Model for foam show similar results as the Mori Tanaka Model. For higher volume fractions the Composite Sphere Model and the Isotropic Flat Plate Model are equal. In Figure 25 the results of the models providing a description of the Poisson’s ratio are illustrated.
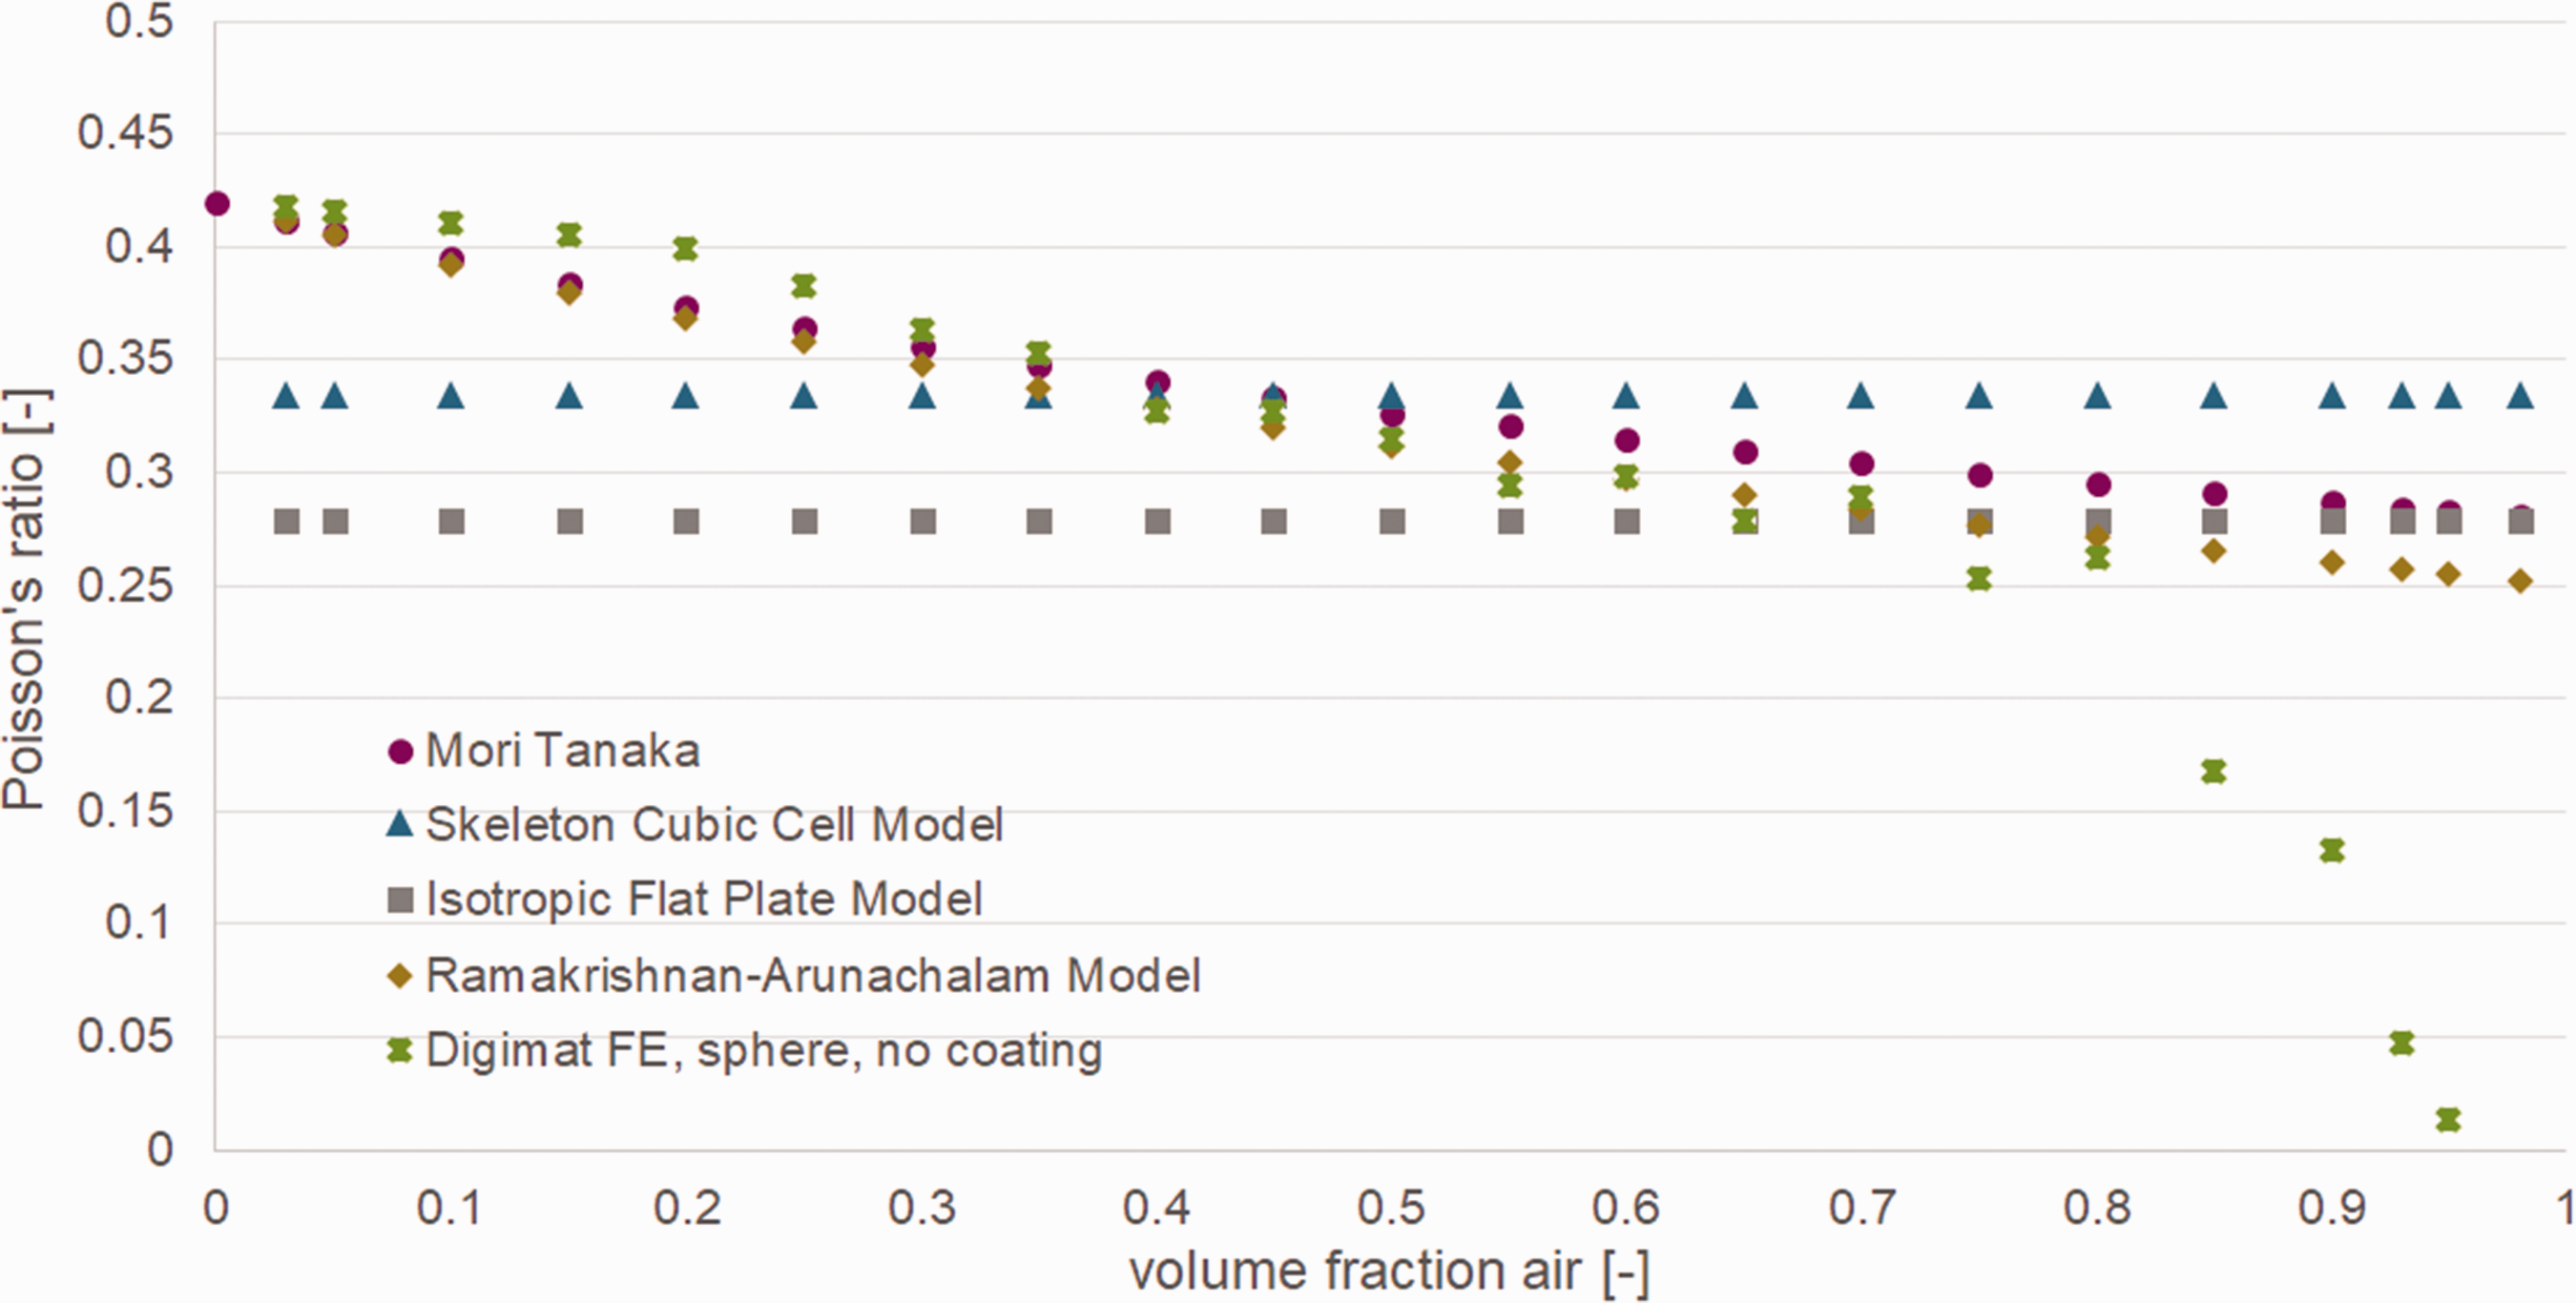
Comparison of different modelling methods with regard to the Poisson’s ratio.
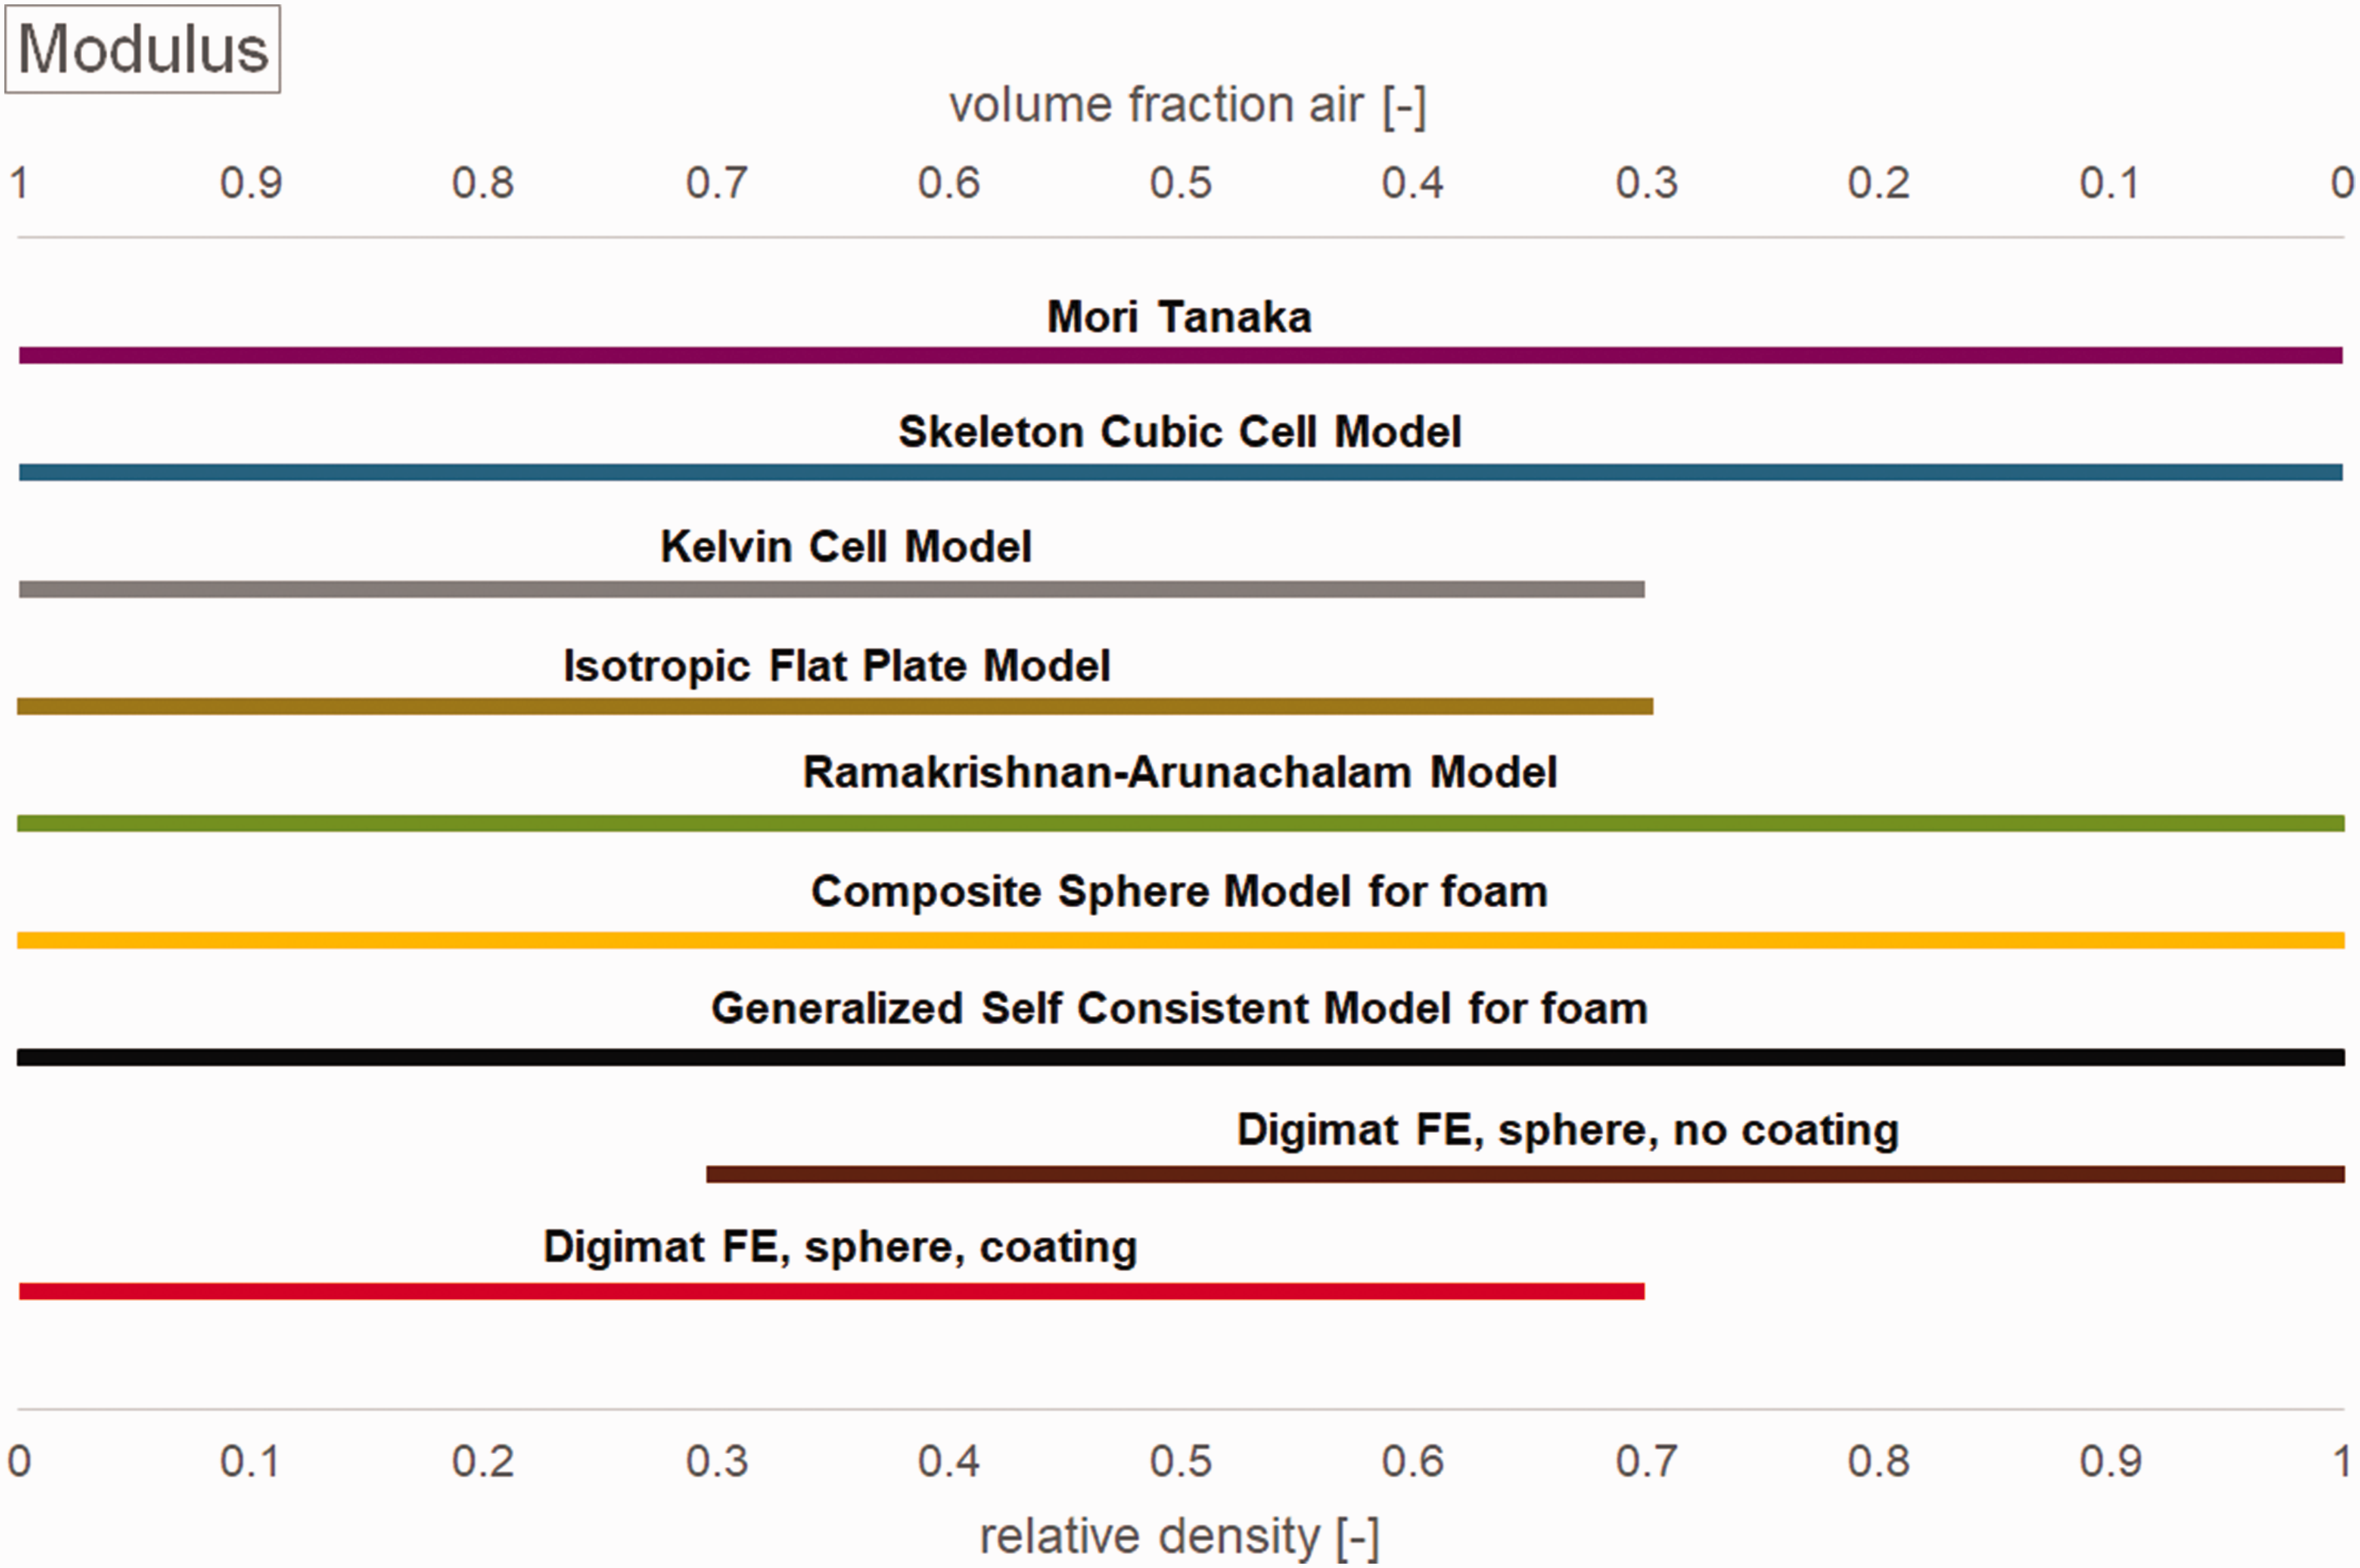
Applicability range of models for the estimation of the Young’s, bulk and shear modulus.
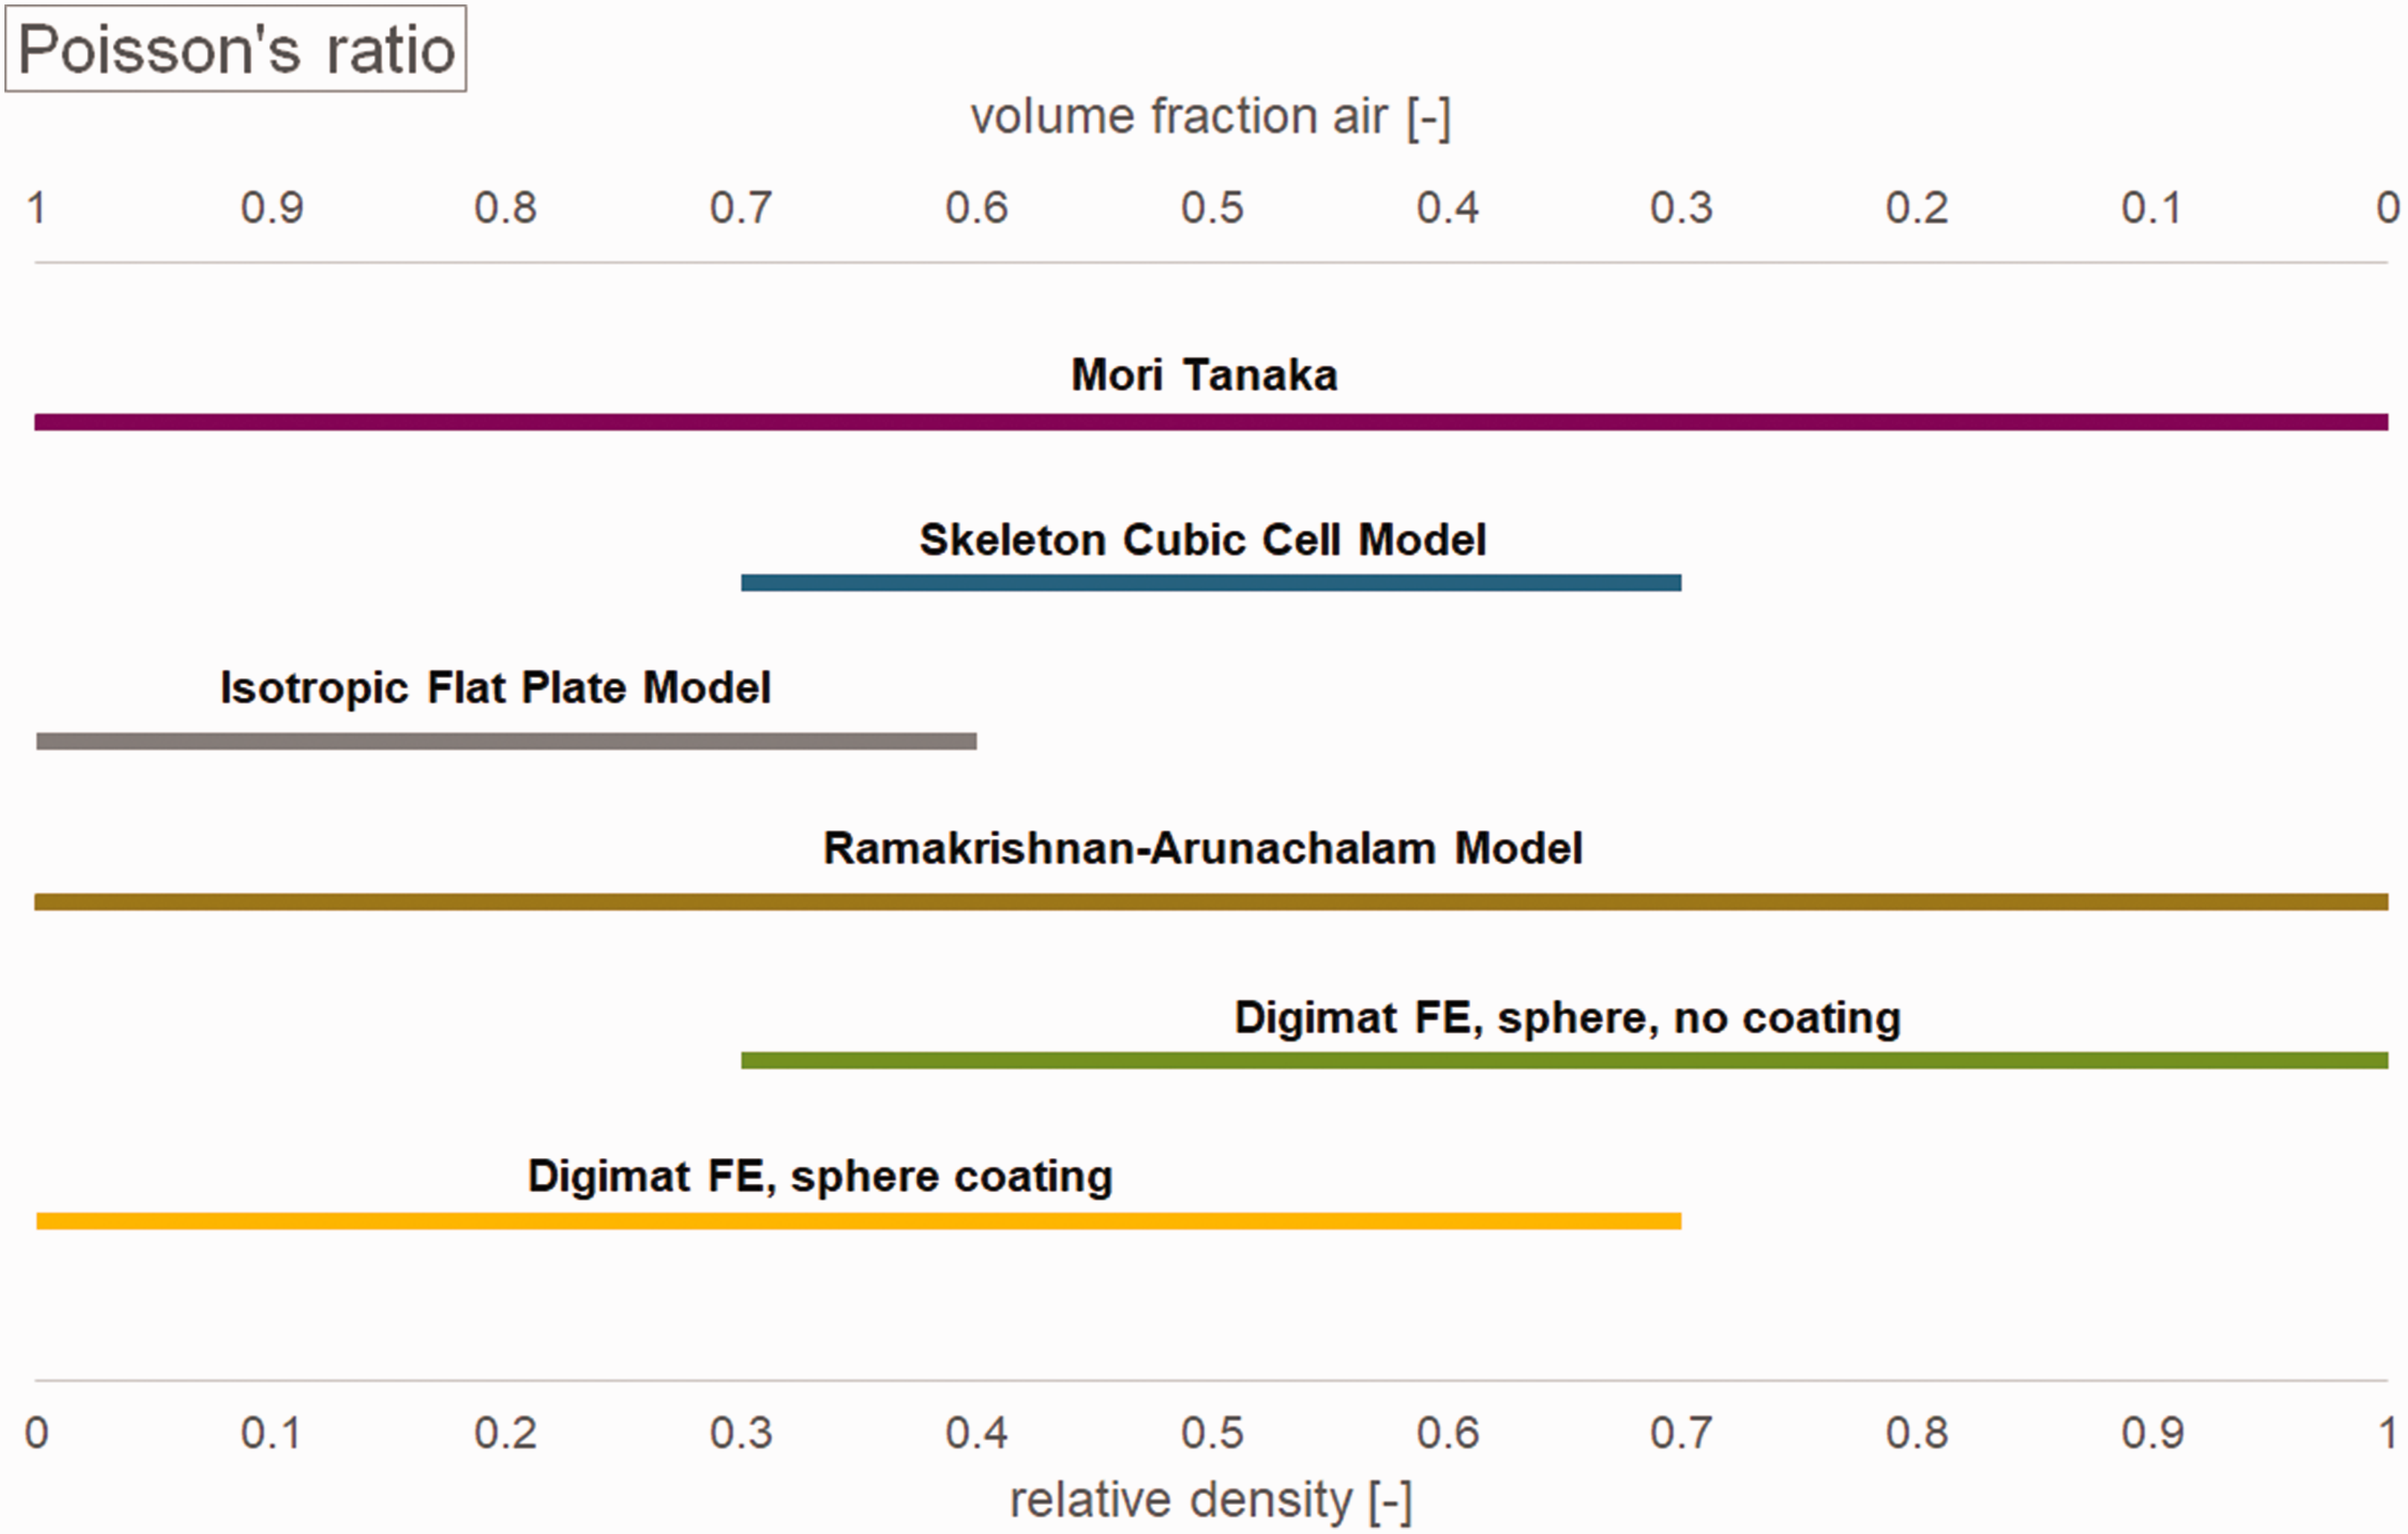
Applicability range of models for the estimation of the Poisson’s ratio.
With the Skeleton Cubic Cell Model and the Isotropic Flat Plate Model a constant Poisson’s ratio is obtained whereas the Mori Tanaka Model, the Ramakrishnan-Arunachalam Model and the Digimat FE model determine Poisson’s ratio values which are decreasing with increasing volume fraction of air. The values for the Mori Tanaka Model, the Ramakrishnan-Arunachalam Model and the Digimat FE model are similar for 0 –80 V% volume fraction of air. For higher volume fractions of air the values obtained with the Digimat FE model significantly drop. The Mori Tanaka Model approaches the Poisson’s ratio of the air (ν = 0.3) for high volume fraction of air.
In Figure 26 and Figure 27 the applicability range of the models with regard to the estimation of the moduli (Young’s, shear and bulk modulus) and Poisson’s ratio of a foam with a specific relative density/volume fraction of air is illustrated.
The Kelvin Cell Model, the Isotropic Flat Plate Model and the Digimat FE models with the coated spheres estimate only valuable results for low relative densities and high volume fractions of air, respectively. Other models, like the Mori Tanaka Model shows reasonable results over the whole relative density range.
Moreover, in Table 4 an overview is given with regard to the deformation mechanism of the investigated models, i.e. if the model exhibits a bending or stretch dominated behaviour.
Overview of the deformation mechanism of different foam models.
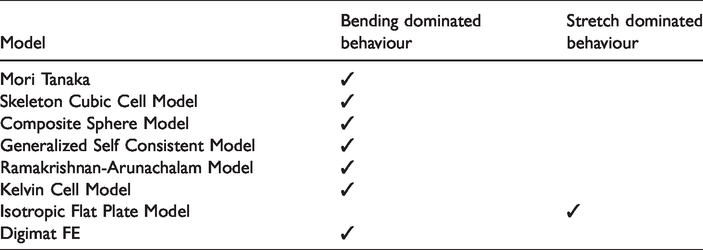
All the investigated models in Section “Comparison of modelling methods for closed cell foams with regard to the elastic properties” show a bending dominated behaviour, except the Isotropic Flat Plate Model which shows a stretch dominated behaviour.
Validation of modelling methods for closed cell foams with regard to the young’s modulus
Experimental tensile tests of a polypropylene extrusion foam with a density of 300 kg/m3 are conducted (specimen type: 1B-(ISO-527–2), test method: ISO 527-1/-2) and the experiments are evaluated regarding the Young’s modulus. The following models are validated with this experimental result: Mean field homogenization method Mori Tanaka Model Ramakrishnan-Arunachalam Model Direct models Digimat FE (reference model) Digimat FE (coated model) Skeleton Cubic Cell Model (the analytical model for closed cell foam with Kelvin Cell Model (the analytical model which is presented in Simone et al. (1998)60) Isotropic Flat Plate Model
The experimentally determined Young’s modulus of the bulk material is 1898 MPa (ISO 527–1: 2012) and the Young’s modulus of the foam with a density of 300 kg/m3 obtained from the experiment is 227 MPa. The Young’s modulus values estimated by the different models and their deviations to the experimentally determined Young’s modulus are listed in Table 5.
Young’s modulus values estimated by the different models and their deviations to the experimentally determined Young’s modulus.
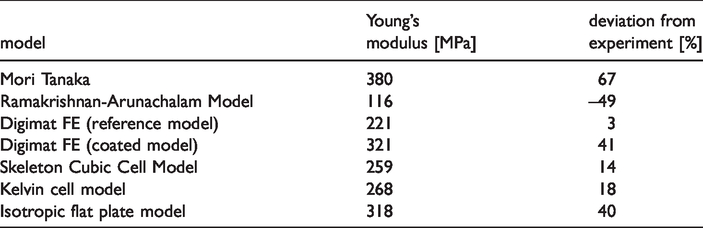
The comparison shows that the Young’s modulus determined with the Digimat FE reference model, the Skeleton Cubic Cell Model and the Kelvin Cell Model are in good agreement with the Young’s modulus value observed in the experiment. The Ramakrishnan-Arunachalam Model underestimates the modulus whereas the Digimat FE coated model, the Mori Tanaka Model and the Isotropic Flat Plate Model overestimate the modulus. It must be emphasized that the observed prediction quality refers only to an extrusion foam with a density of 300 kg/m3 and cannot be generalized.
Conclusion
Finally, conclusions are drawn with regard to the influence of the design variables on the Young’s modulus and the specific characteristics of the models and modelling methods.
In Section “Investigation of the influence of the design variables on the elastic properties of closed cell foams based on FE models” the influence of the design variables on the elastic properties of closed cell foams are investigated based on finite element models. The following findings can be summarized from the simulation results: the Young’s modulus of the bulk material has influence on the Young’s modulus values of foams with high relative densities; increase of the Young’s modulus (equation (22)) is 100–80% for 0–20% volume fraction of air influence cell shape: the model with spherical inclusions shows higher Young’s modulus values than the model with prismatic/icosahedral inclusions (comparison of the model with spherical inclusions and the model with prismatic inclusions: difference of modulus is < 10% for 0–15% volume fraction of air, < 30% for 15–45% volume fraction of air, > 30% for > 45% volume fraction of air) influence anisotropic cell shape: the orientation and shape (aspect ratio) of non-spherical inclusions determine the isotropic/anisotropic behaviour; higher Young’s modulus values are observed in the direction of the inclusion alignment (comparison of the Young’s modulus in x- and y- direction for the model with prismatic inclusions with AR = 1: difference of modulus < 10% for 0–20% volume fraction of air, < 30% for 20–40% volume fraction of air, > 30% for > 40% volume fraction of air) and the higher the aspect ratio of the inclusion the more distinct the anisotropic behaviour (comparison of the models with prismatic inclusions with AR = 0.5 and with AR = 3: difference of modulus in x-direction is < 10% for 0–15% volume fraction of air, < 30% for 15–25% volume fraction of air, > 30% for > 25% volume fraction of air) the cell size has no influence on the Young’s modulus values influence cell size distribution: with a cell size distribution a higher packing of inclusions is possible if the size of the inclusions is small enough which enables the generation of foams with no/low open cell content for low relative densities, thus higher Young’s modulus values are obtained (comparison of the reference model and the model without open cells: difference of modulus is approximately 50% for 60% volume fraction of air) influence open cell content: the higher the open cell content the lower the Young’s modulus values; the Poisson’s ratio stays nearly constant over the whole relative density range for the coated model which exhibits low open cell content for low relative densities, for the reference model which exhibits a high open cell content for low relative densities the Poisson’s ratio significantly drops for low relative densities
The validation of selected models with an experimental result of an extrusion foam with a density of 300 kg/m3 showed that the Young’s moduli estimated by the Digimat FE reference model, the Skeleton Cubic Cell Model and the Kelvin Cell Model are in good agreement with the experimentally observed Young’s modulus (Table 5).
In Table 6 the specific characteristics of the models and modelling methods are summarized.
Overview of the specific characteristics of the models and modelling methods.
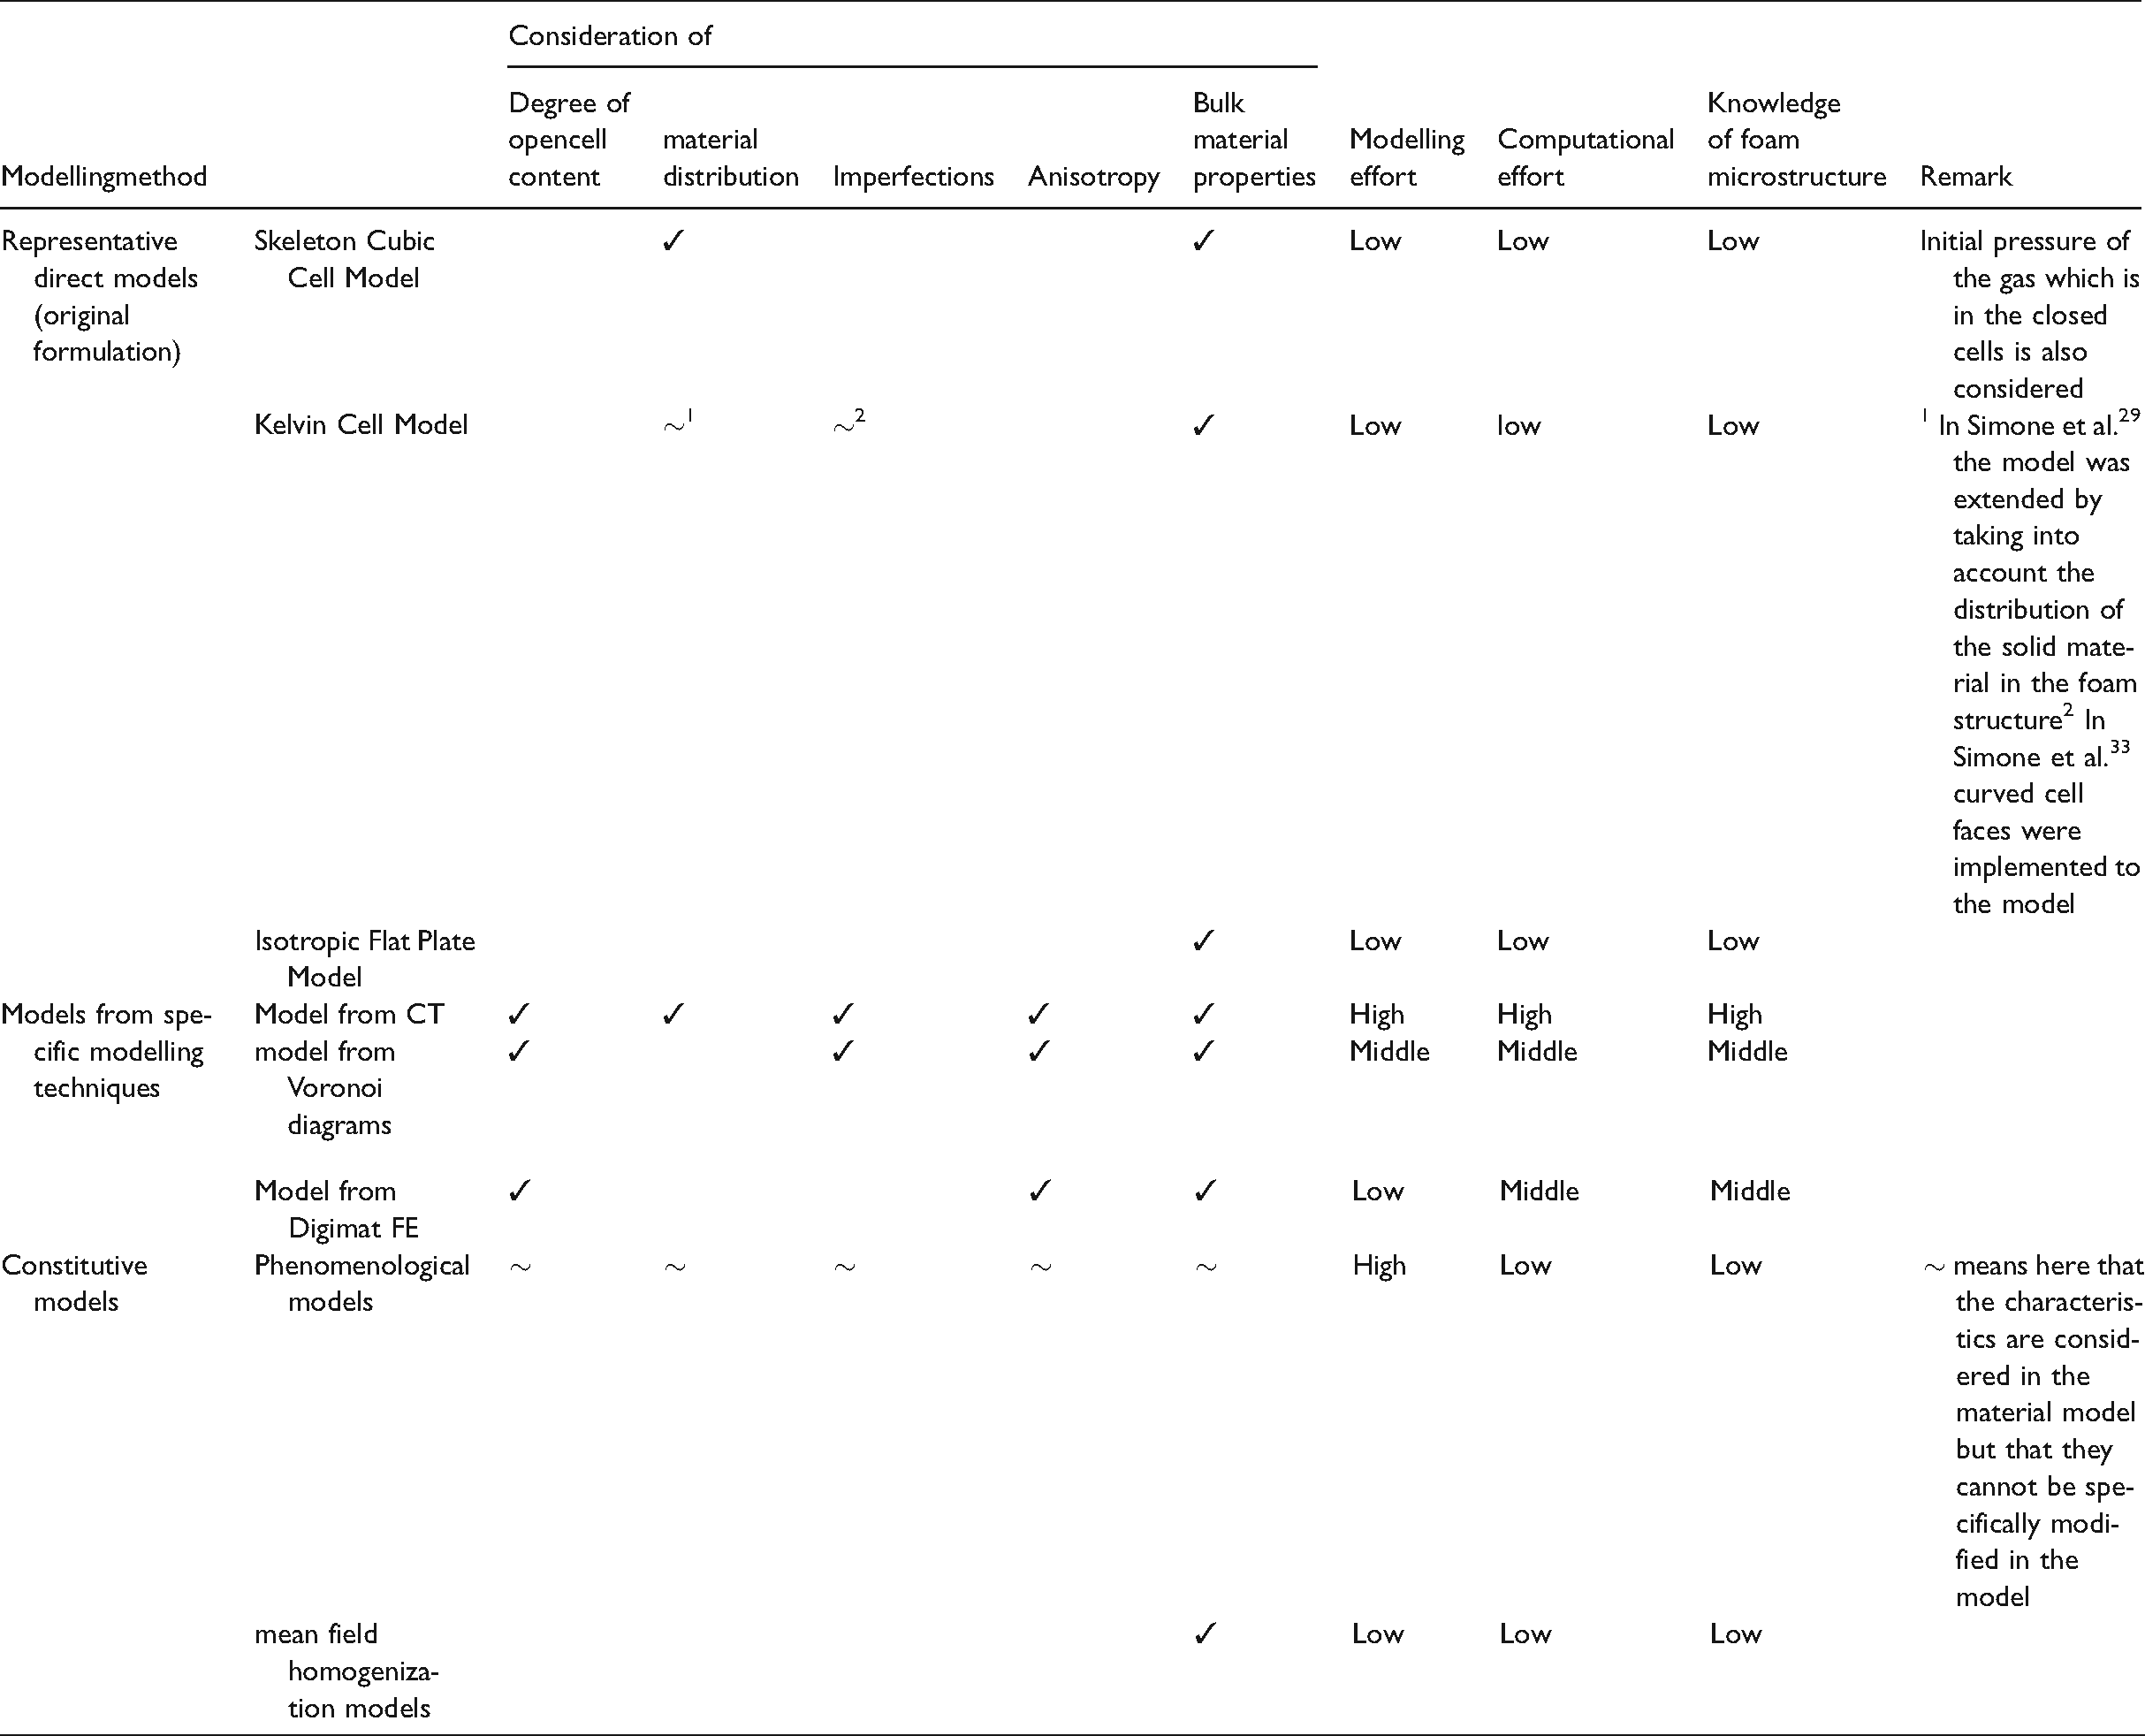
It can be seen that the modelling approaches differ in the way which parameters can be considered in the models and which effort is needed for the modelling and simulation/computation of properties of the foam model. For example the modelling and computational effort for the mean field homogenization models is low but only the bulk material properties are considered in the models. Nevertheless, these models are useful for calculating the elastic properties, although they may not be applicable for the estimation of the non linear regime. Contrary to these simple models are the models which are obtained from CT measurements. There, all the characteristics of the foam geometry can be included in the model. Furthermore, the non linear response can be investigated but the modelling and computational effort is high. The combination of the Voronoi diagram approach and CT measurements as described in Section “Direct models by different modelling techniques” is a promising modelling approach because there, some important information (e.g. cell size distribution) can be incorporated in the simulation model by keeping the modelling and computational effort low. Of course, for this modelling approach the necessary equipment (e.g. CT scanner, software for the evaluation of the CT measurements) has to be available.
In conclusion, the design variables have only a small influence on the Young’s modulus of the foam except the open cell content which significantly determines the Young’s modulus. Several models and modelling methods exist for the estimation of the behaviour of cellular structures. There, one has to weigh between modelling effort and modelling accuracy.
The limitations of this paper are that the comparison of the investigated models is only based on the linear elastic properties. Furthermore, models based on Voronoi diagrams or CT data are not investigated. Thus, the future scope is to characterize the non linear behaviour of foams with models based on Voronoi diagrams and CT measurement results.
Footnotes
Declaration of conflicting interests
The author(s) declared no potential conflicts of interest with respect to the research, authorship, and/or publication of this article.
Funding
The author(s) received no financial support for the research, authorship, and/or publication of this article.