
Abstract
Introduction:
Numerous theories have been proposed to substantiate the etiopathogenesis of depression. Recently, the hypothesis involving the oxidative stress (OS) pathway has been explored. Hence, potential markers are also being investigated for their role in depression. We aimed to assess the serum malondialdehyde (MDA) and serum lipid levels in individuals with depression and controls and explore associated factors.
Methodology:
A semi-structured questionnaire, complete with a mandatory consent form and a reliable, validated scale, namely the Hamilton Depression scale (HAM-D), was used. The method of sampling was purposive, with 100 depression cases in the psychiatry outpatient being included and 50 age-matched, gender-matched controls. Blood was collected from both groups to evaluate serum MDA and serum Lipid levels. Appropriate statistics using SPSS 20 were administered.
Results:
Our study had a female preponderance in cases, with 38% having major depressive disorder (MDD), 50% of whom showed suicidal ideas, and 10% had a prior history of deliberate self-harm. Mean HAM-D scores were higher in cases than controls, 18.57 ± 6.02, and mean MDA levels were higher in cases, 2.5 ± 1.02 mmol/L. HDL levels were lower in depression cases compared to controls, 38.34 ± 7.442. An inverse correlation was seen between mean serum MDA levels and HDL levels in depression cases. A significant relationship was observed between the parameters of depression and serum MDA levels.
Conclusion:
Significantly elevated mean serum MDA levels were observed in depression cases, along with significantly lowered mean HDL values compared to controls. We found a positive correlation between serum MDA levels and the severity, recurrence, and suicidality of depression. An inverse relation was observed between serum MDA values and mean HDL levels in depression. This emphasizes the need for clinical vigilance in employing these biomarkers not merely for assessment but also for HDL as a preventive measure in depression.
Oxidative stress as a precipitating and perpetuating factor in Depression. Sub-specifiers in Depressive disorders have varied association with Serum MDMA levels. Positive correlation between Serum MDMA and suicidality.Key Messages
Depression ranks second in leading diseases in the world, 1 edging into the first place by 2030 as per the World Health Organization (WHO). 2 Major depressive disorder (MDD) was ranked in the first 10 causes by The Global Burden of Diseases, Injuries, and Risk Factors Study 2019, resulting in marked disability-adjusted life-years, affecting both sexes from adolescents to older adults, with women harboring twice the probability of being afflicted with MDD than men.3-5 The etiopathogenesis of depression has been purported to have several theories. The etiopathogenesis of depression has several theories, with scientific evidence supporting the involvement of five main biological systems: inflammatory, neurotransmitter, neuroendocrine, neurotrophic, and metabolic. The “omics” approach, ranging from epigenomics and genomics to proteomics, transcriptomics, and metabolomics, can be used to evaluate these systems at various biological levels. 6
A theory of prominence in the context of depression in recent years is the oxidative stress (OS) theory. This, in turn, resulted in the search for a trustworthy biomarker, wherein malondialdehyde (MDA) was considered to be the key molecule, being the end product of lipid peroxidation. A bi-directional interaction elaborately discussed by Moylan et al. wherein OS precipitates inflammatory pathways, 7 in turn exacerbation of OS occurs due to inflammation (e.g., elevated levels of cytokines interleukin-6 and interleukin-1 leads to reduced levels of zinc, albumin, and high-density lipoprotein—HDL). Among OS markers, lipid peroxidation markers take the lead in the potential for depression.
A disparity in free radicals and antioxidant balance creates OS, causing malfunctioning redox signaling and molecular damage. 8 Growing evidence points toward oxidative stress accounting for unequivocal injury to neurons and glial cells in those with depression, 2 impacting several brain areas and negatively influencing different cell pathways and neuroinflammation. 9 Lipid peroxidation serves as a marker of OS, which consists of the reaction between free radicals and lipids with carbon-carbon double bonds such as polyunsaturated fatty acids (PUFAs), mainly located in the cell membranes. 10 Lipid hydroperoxide levels, when increased, mark early-stage lipid peroxidation, while late-stage lipid peroxidation shows an increased 4-hydroxy-2-nonenal (4-HNE), F2-isoprostanes levels and MDA. Lipid peroxidation occurs characteristically in depression patients as opposed to controls. 11 Mazereeuw et al. 12 note the correlation between lipid peroxidation and severity of depression.
Scientific exploration has focused on key biomarkers crucial for understanding monoamine neurotransmission, immune inflammation, neuroplasticity, and neuroendocrine function. 13 While protein dysfunction is central to these hypotheses, lipids play a vital role in regulating protein function by providing structural support, anchoring, and transport. In neuronal functioning, lipids are dynamic, regulating membrane fluidity and permeability, vesicular formation and transport, neurotransmitter release, cell integrity, and plasticity.14,15 Lipids embody a plausible family of peripheral biomarkers that can be capitalized on for quantitative diagnosis, monitoring treatment response, and patient stratification. Their association could also indicate a disease mechanism that is amenable to pharmacological intervention or preventative strategies through dietary supplementation. 16
Our study aims to assess serum MDA levels and lipid levels in patients with depression and to study the association between clinical types of depressive disorders and these biochemical parameters.
Methodology
This is a cross-sectional, case-control hospital-based study designed at a tertiary care teaching center in South India. The study included 100 patients, aged 18–65 years, of both genders, who presented to the outpatient department of psychiatry and were diagnosed with depressive disorder as per DSM 5 criteria 17 by the consultant psychiatrist and who consented to participate in the study. MDD, dysthymia, and double depression were included, and those with psychotic symptoms were excluded. Patients with seizure disorders, mental retardation, other psychiatric disorders, hypertension, hypercholesterolemia, other acute or chronic physical illnesses, pregnancy, or a history of any psychotropic/drug use during the last month or nicotine and alcohol dependence were excluded from the study. An age-matched, demographic-matched control group of 50 participants consisting of patients’ relatives/hospital employees without any history of psychiatric/medical/surgical illnesses was formed.
The data was collected through a semi-structured questionnaire documenting socio-demographic details. The consultant psychiatrist in the OPD recorded the psychiatric diagnosis using DSM 5 criteria, and the severity of depression was measured using the Hamilton Depression Rating Scale (HAM-D). 18 The cases and controls both underwent the psychiatric evaluation, HAM-D, and were assessed for serum MDA levels and serum lipid levels.
Tools Used
To measure the severity of Depression- HAM-D-17 was used.
To assess serum MDA levels, the Reagents used were Stock standard MDA (2.5 mmol/L), thiobarbituric (TBA) acid, and trichloroacetic (TCA) acid.
Procedure:
Serum samples were precipitated with TCA. 100 µl supernatant serum/standard was added to 1.0 ml of TBA. This was mixed for 5.0 seconds and then autoclaved for 15 minutes. After the sample tubes were cooled, 2.5 ml of butanol and 2.5 ml of water were added. The above mixture was vortexed and centrifuged at 1500×g for 10 minutes to extract the TBA-MDA adduct. The supernatant was added to tubes containing a pinch of sodium chloride. Again, this was vortex-mixed and centrifuged at 1500×g for 5 minutes. The supernatant was collected, and fluorescence intensity was measured at Ex 536 and Em 539nm wavelength. Serum concentrations of MDA were calculated from the standard calibration graph. The calibration graph was obtained by plotting different concentrations of MDA against the fluorescence intensity values. Serum concentrations of MDA were expressed as µmol/L of plasma.
To assess serum lipid levels:
Five milliliters of fasting venous blood was collected under aseptic precaution in a serum separator tube (SST/yellow top gel tube) from selected subjects (case and controls). After centrifugation, serum samples were separated and stored at −70°C until analysis. Estimation of serum cholesterol, LDL and HDL cholesterol, and serum TG levels was carried out in all the samples. Reference range taken were as follows: Total cholesterol 150–200 mg/dl, HDL 35.0–79.0 mg/dl, LDL 60–130 mg/dl, VLDL 10–40 mg/dl, and TG 40–160 mg/dl.
This study was voluntary, and no remuneration was paid to the participants. The investigators self-funded the study, and no grants were obtained. The method of sample collection was purposive, and every subsequent case diagnosed with depression was taken up for the study. The study received clearance from the Institutional Ethical Research Board.
Statistical Analysis
Data were analyzed using SPSS version 20. Descriptive statistics included analyzing categorical data using percentages and continuous data using mean and standard deviation. Inferential statistics were conducted as follows: categorical data were assessed with a Chi-square test, and continuous data were analyzed using Student’s unpaired t-tests and one-way Analysis of Variance (ANOVA). Pearson’s correlation was applied to explore the correlation between serum MDA levels and another clinical variable. To account for multiple comparisons, a Bonferroni correction was applied to the alpha level. A probability value of <.05 was considered statistically significant.
Results
Our study had a total of 100 depressive disorder cases and 50 matched controls, as shown in Table 1. The majority were female 56 (56%), most being married 66 (66%),79 (79%) were literate and employed 47 (47%). Mean age fell in the younger age of 35.215.2 ± 8, and mean BMI was higher in cases 25.1 ± 3.04 as compared to controls 22.4 ± 3.04, with statistical significance, P < .001.
Frequency Table of Socio-demographic Data.
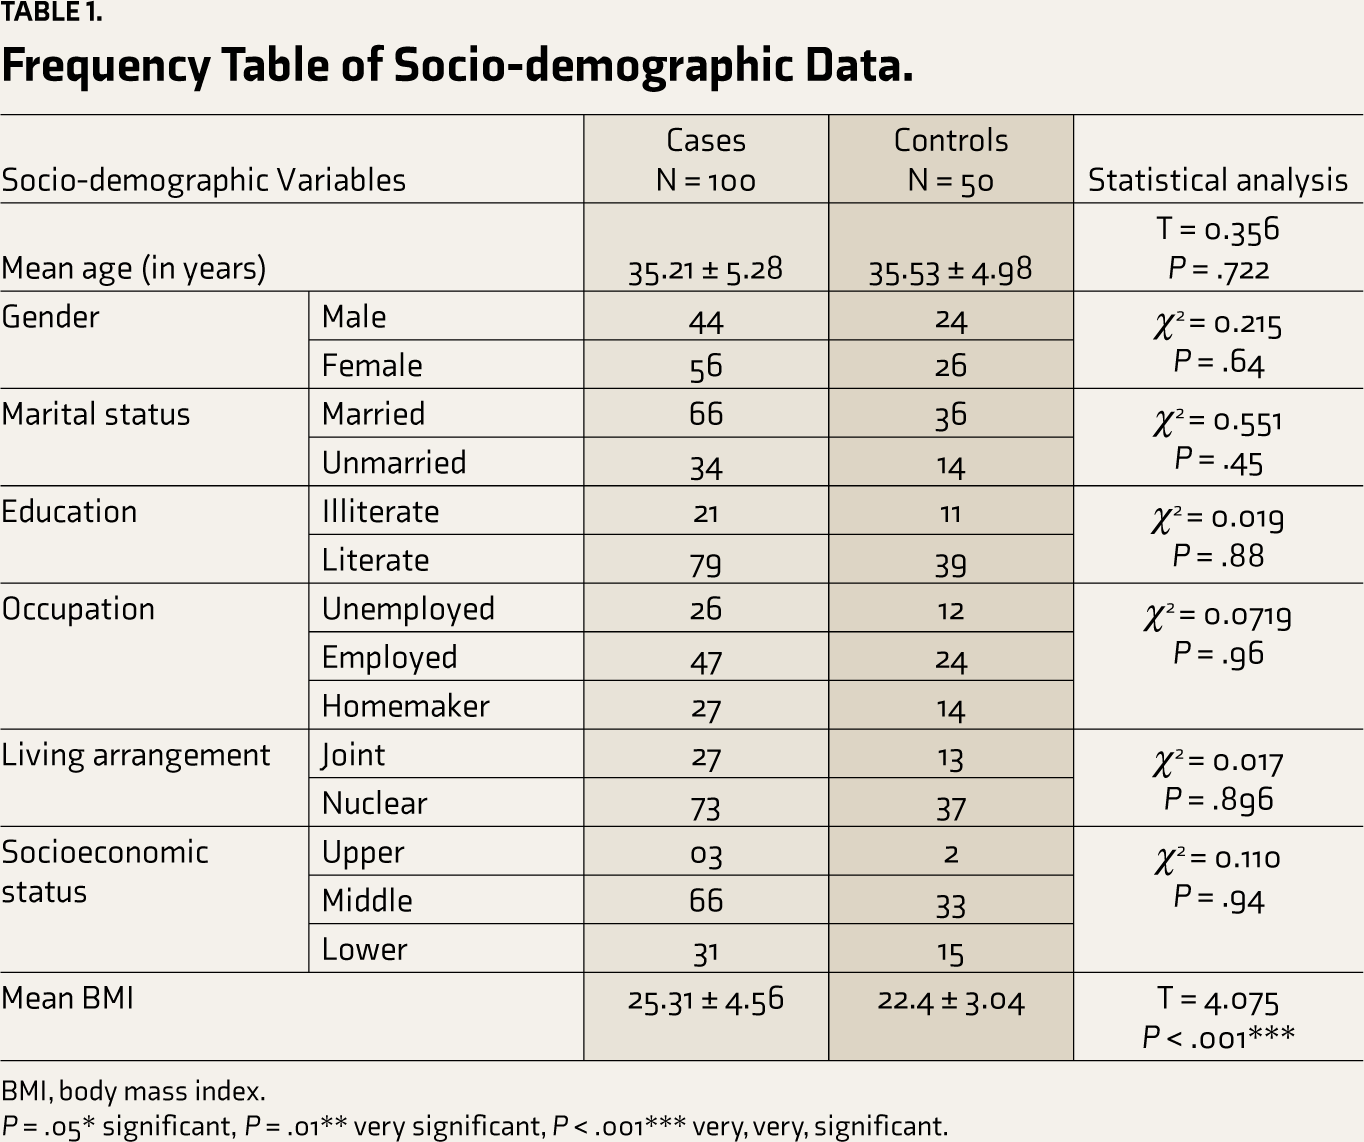
BMI, body mass index.
P = .05* significant, P = .01** very significant, P < .001*** very, very, significant.
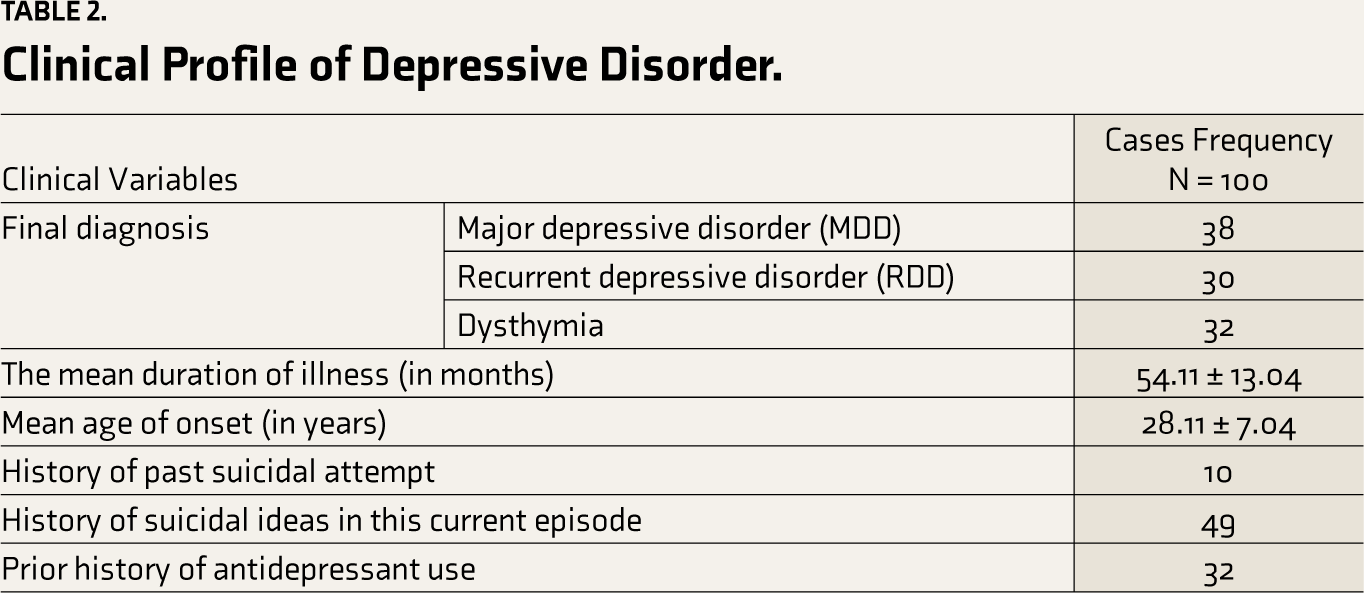
Table 2 demonstrates that among 100 depressive disorder patients, the majority, 38%, received a Diagnosis of MDD, followed by 32% dysthymia, and the last was recurrent depressive disorder with 30%. The mean duration of illness was 4.5 years, that is, 54.11 ± 13.04 months, with onset falling in the younger age of 28.11 ± 7.04 years. 10% reported deliberate attempts of self-harm in the past, close to 50%, that is, 49 (49%) reported suicidal ideas in the current ongoing episode. 32 (32%) had received psychiatric treatment in the form of antidepressants, whereas the majority, 78 (78%), were drug naïve. None of the controls had qualified for depression or scored beyond 7 in HAM-D. Table 3 shows that mean HAMD-D scores were markedly higher in cases (18.57 ± 6.02), as compared with HAM-D scores of 6.54 ± 2.81 in normal controls; this being statistically significant.
Clinical Profile of Depressive Disorder.
Mean, Standard Deviation Hamilton Depression Rating (HAM-D) Scores in Cases and Controls.
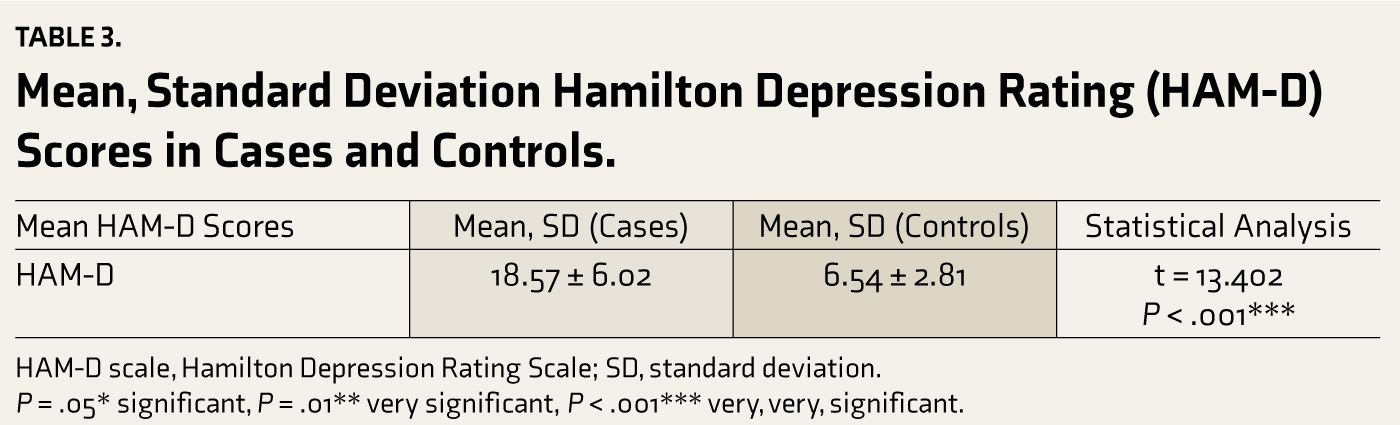
HAM-D scale, Hamilton Depression Rating Scale; SD, standard deviation.
P = .05* significant, P = .01** very significant, P < .001*** very, very, significant.
Table 4 discusses the Mean, SD, and P values of serum lipid levels and serum MDA levels in cases and controls. The lipid levels showed a marked difference in total cholesterol levels and HDL levels, with cases recording higher mean TC 188.157 ± 29.18 versus 183.416 ± 30.29 and higher HDL levels in controls 45.88 ± 5.16 versus 38.34 ± 7.442 in depressive disorder cases, P value is very, very significant. Only triglyceride levels were found to be beyond the normal range in both cases and controls. HDL levels were close to the lower end of the normal range in cases compared to controls.
Serum MDA levels were markedly higher in depressive disorder cases, 2.5 ± 1.02 mmol/L, with a very, very significant statistical difference, P < .001.
Mean, Standard Deviation in Biochemical Variables in Cases and Controls.
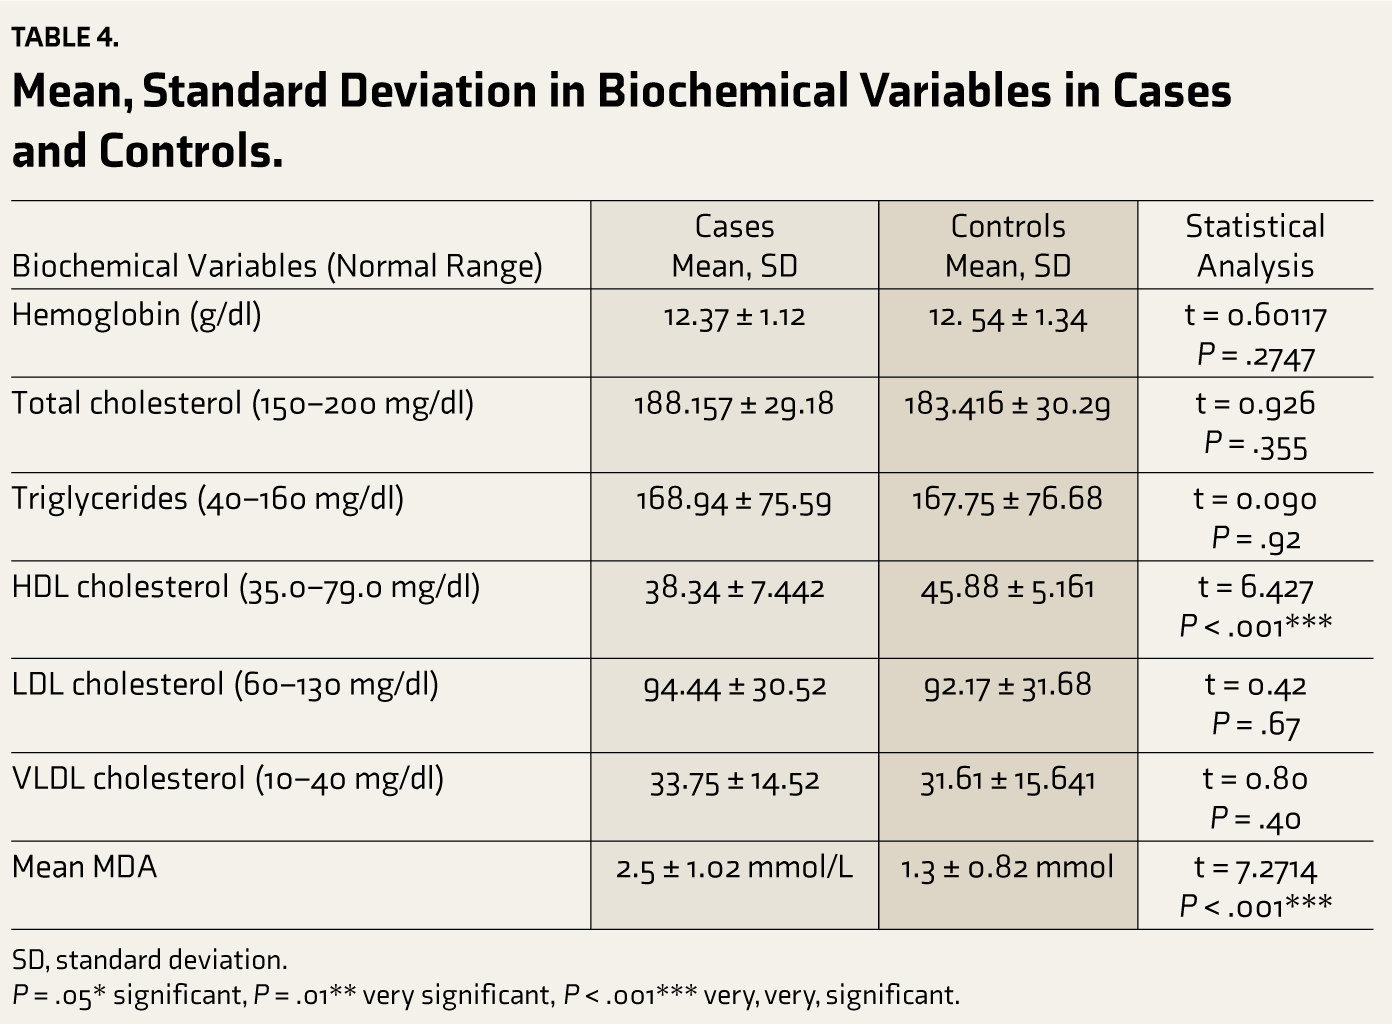
SD, standard deviation.
P = .05* significant, P = .01** very significant, P < .001*** very, very, significant.
Association Table 5 demonstrates that MDD had a higher mean TC at 190.1 ± 30.11, followed by Dysthymia at 188.11 ± 29.12 and the RDD at 185.29 ± 27.97. Similarly, mean triglyceride values and LDL levels were highest in MDD, VLDL levels were highest in RDD, and HDL cholesterol was lowest in RDD. These associations were not found to be statistically significant. Mean MDA levels were highest in MDD, followed by RDD, and then Dysthymia, which did not meet statistical significance.
Association Between Clinical Types of Depression and Biochemical Parameters.
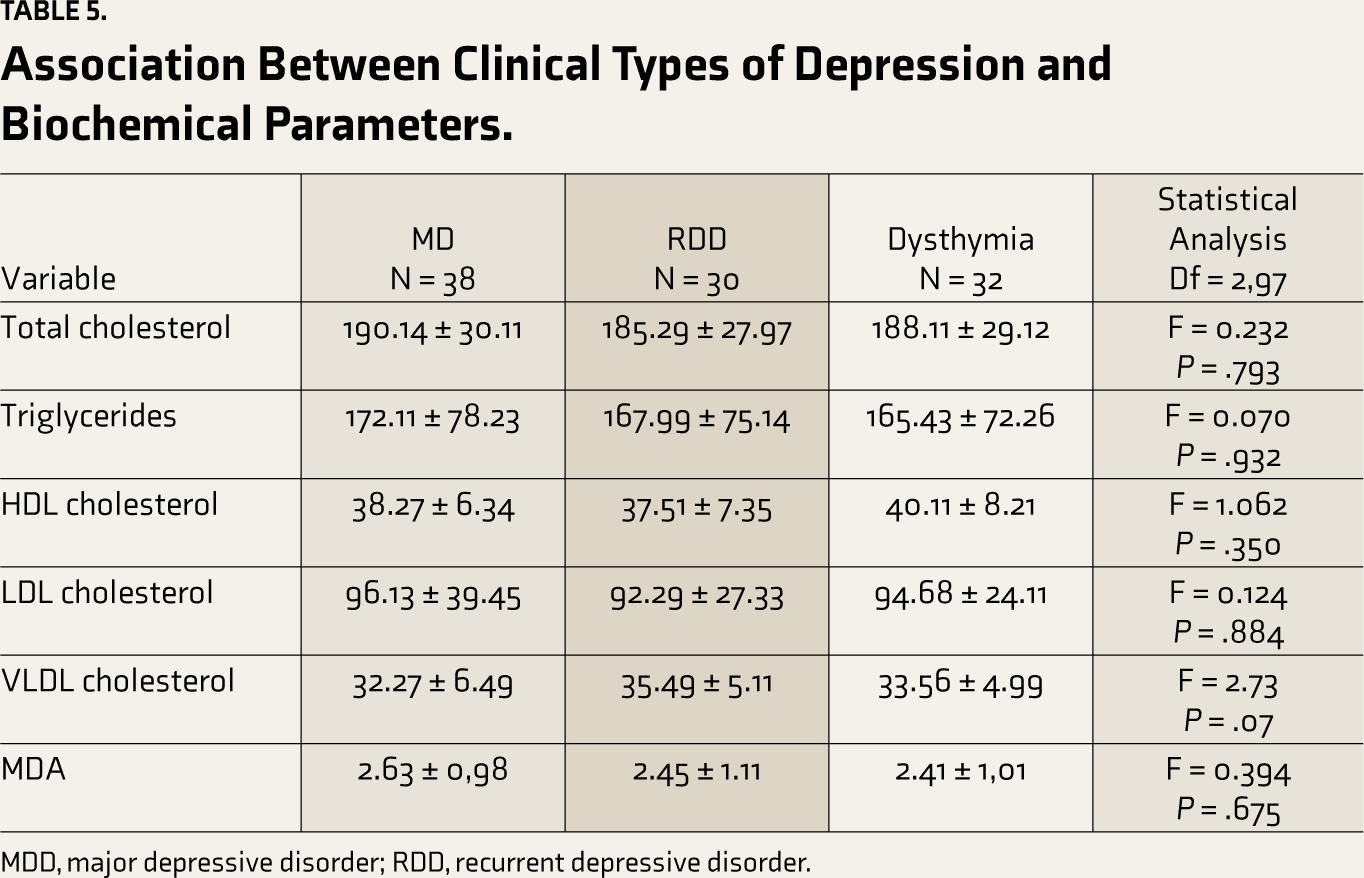
MDD, major depressive disorder; RDD, recurrent depressive disorder.
Pearson correlation showed that serum MDA was positively correlated with the age of the patient (R = 0.45, P < .05), number of depressive episodes (R = 0.122, P < .05), and HAM-D (R = 0.664, P < .05) and BMI (R = 0.09, P > .05). There was a negative correlation between serum MDA and HDL levels (R = –0.17, P < .05). There was a negative correlation between HDL levels and number of depressive episodes (R = –0.17, P < .05), and HAM-D (R = –0.34, P < .05) and BMI (R = –0.08, P > .05) plugging in the values: Bonferroni-corrected alpha = 0.05 (initial alpha level)/8 (number of comparisons), Bonferroni-corrected alpha = 0.0063 means that only correlations with a P value lower than .0063 will be considered statistically significant after applying the correction. Pearson’s correlation is in the supplementary file (Supplementary Table 1).
The odds of suicidal ideas were higher with the increase in serum MDA values (OR = 2.1, P < .05, 95% CI = 1.24–2.28, χ2 = 3.215), the odds of female gender were higher with the increase in serum MDA values (OR = 1.956, P < .05, 95% CI = 1.067–2.097, χ2 = 3.215).
Discussion
Elevated lipid peroxidation has an association with depression.
Peroxidation in lipids occurs as a sequela of excessive pro-inflammatory cytokines
resulting in increased free radicals and excessive breakdown of monoamines. Lipid peroxidation reduces neuronal longevity, hampers ion channel function and membrane stability, and negatively impacts neurotransmitter release. Thereby, MDA is considered an important marker of cell damage caused by OS.11,19-21 Serotonin metabolism is negatively affected by MDA inhibiting the ligand-binding site of the serotonin receptor.11,19,22 Depression cases have been found to have an increased concentration of MDA when compared to healthy controls. In turn, a decrease in MDA levels is observed upon treatment with antidepressants.23-25
Studies reflecting increased BMI in depression cases, ranging from high normal to overweight category, were evidenced in similar geographical settings like Islam et al. in Bangladesh, 1 Jia et al. in China, 16 Hamed et al. in Egypt, 26 and even a study from Spain, Alvarez Mon et al. 5 reporting similar associations. All reported a younger mean age of subjects with female preponderance in depression.
Out of 100 cases of depression, the majority of our cases were diagnosed to be MDD, 38%, followed by 32% being Dysthymia and 30% RDD. Recent literature on depression and inflammatory markers has studied cases of MDDs but not categorized the Clinical Types of Depressive disorders. Alvarez Mon et al. 5 studied 30 cases of MDD wherein 10% of their sample had psychotic symptoms, which was different from our study as cases with psychotic features were excluded from our study. The mean duration of illness in our study was approximately 4.5 years, which was similar to the study done by Hamed et al., 26 wherein the mean duration of depression was 6.3 years in cases, and as opposed to the study done by Alvarez Mon et al., 5 wherein the mean duration of illness was 16.12 ± 2.85 weeks. Our study found the mean HAM-D scores to be 18.57 ± 6.02 with normal HAM-D scores in controls, indicative of cases belonging to the Moderate depression Category. This finding is against the study done by Hamed et al., 26 where they had more cases in the mild depression category 46.7% and around 30% in moderate depression.
We observed that our cases of depression showed significantly elevated mean MDA values as compared to controls, 2.5 ± 1.02 and 1.3 ± 0.82, P = .0001. Concurrence is evidenced in the study done by Islam et al., 1 with mean MDA levels in depression being 4.49 ± 1.37 and controls 2.87, P = .001. Similar findings of elevated plasma MDA in depression cases compared to controls were seen by Alvarez Mon et al. 5 Association of clinical types of depression with serum MDA levels found increased serum MDA levels in MDD followed by RDD and Dysthymia. This association was not statistically significant. Prior literature documents increasingly higher levels of serum MDA in subsequent depressive episodes, which could have been demonstrated in a prospective study design; however, ours’ being a cross-sectional study, this could not be observed.
Our study found elevated lipid levels in cases as compared to controls, wherein elevated total cholesterol, LDL, and VLDL were observed in depression cases. It significantly lowered HDL levels in depression cases when compared to controls, and this was statistically significant. This finding concurs with the notion that depression may be associated with poorer HDL levels. Association between clinical types of depression and lipid profile revealed MDD having elevated TC, TG, LDL, and RDD having elevated VLDL. Increased HDL values were found in association with dysthymia, followed by MDD, and lastly, RDD, none of the associations being statistically significant. However, we found dyslipidemia in our cases of depression only with regards to Triglyceride levels being beyond 160 mg/dl as per definite laboratory range values, and all other lipid levels fell in the normative range. Interestingly, the HDL levels in the cases remained at the lower range but did not fall below the cut of 35 mg/dl. Both these findings point toward the association between depression and probable lipid dysfunction.
Our study demonstrated that serum MDA levels were likely to be significantly higher with increasing age, with an increase in the number of depressive episodes and severity of depression.
It also demonstrated the significantly increased odds of increased suicidal ideation and increased chances of female patients with depression having higher MDA levels. This latter finding was in contrast to the findings obtained by Oshnokhah et al., on the ethnic Kurdish population, wherein suicidality was associated with reduced MDA values in depression cases as compared to controls. 27 These discrepancies may be attributed to differences in sample size, study design, and different ethnic groups used in each study.
An interesting finding was that in cases of depression, an increase in serum MDA levels was significantly related to a decrease in mean HDL levels, thereby implying that apart from HDL being a potential biomarker, it may have a protective role in not just cardiovascular illness but also depression, that is, antioxidant property.
Additionally, the finding that an increased number of depressive episodes and increased severity of the depression are also related significantly to lowered mean HDL levels adds to the conceptualization that HDL may play the role of antioxidants in depression. These findings are concurrent with the results of Maes et al., who found reduced serum HDL levels in depressed individuals and those men with a history of suicide. 28 Literature also shows reduced HDL levels were found in individuals with post-stroke depression, the first episode of depression, 29 MDD with anhedonia.30,31
Our study was a case-control cross-sectional hospital-based study type with a purposive sampling method. Hence, the results need to be more generalizable to the community. Antidepressant medications are known to have an anti-inflammatory effect and may alter inflammatory marker values. We excluded those having psychotropic drugs in the last month, but the long-term effects of prior antidepressant/psychotropic usage could not be accounted for. To mitigate the risks of false positives due to multiple comparisons, the Bonferroni correction was used, which adds to the strength of the study. A longitudinal study comparing all the psychotropic exposure versus drug naïve patients with depression may provide more conclusive evidence for this concept.
The research arena of MDD biomarkers is deprived by a meager understanding of MDD etiopathogenesis, the disorder’s vast heterogeneity, uncommon co-morbidities, and biomarkers’ low specificity. The assembly of biomarker panels and their assessment with the aid of newer technologies may help overcome the obstacles mentioned above. The present proof of certain biomarkers still needs to be improved in regard to their definition. Nevertheless, variations in their concentrations may further pertinent information regarding the underpinnings of depression and would serve as the prelude to larger biomarker studies.
Conclusion
Significantly elevated mean serum MDA levels were observed in depression cases and significantly lowered mean HDL values were observed in cases as against controls.
Serum MDA levels, suicidality, severity of depression, recurrence, and female gender were noted to have a significant correlation. Mean HDL values were lowered in the recurrence of depressive episodes and increased severity of depression. Also, serum MDA values were inversely related to mean HDL values in depression cases. Serum MDA levels and HDL levels can serve as biomarkers for depression, and HDL may have a preventive role in depression.
Supplemental Material
Supplemental material for this article is available online.
Footnotes
Acknowledgements
We thank Dr. Vijaylakshmi. P, Department of Biochemistry for her support in technical clarifications.
Declaration of Conflicting Interests
The authors declared no potential conflicts of interest with respect to the research, authorship and/or publication of this article.
Declaration Regarding the Use of Generative AI
We did not use AI tools to collect or analyze data, produce images or graphs, or write this article. We assume full responsibility for the entire content of the manuscript.
Ethical Approval
Received Instituite Ethics committee approval (No.IEC/TOMCHRC/058/17-18) on 23/01/2018 held at The Oxford Medical College Hospital and research Centre, Bengaluru.
Funding
The authors received no financial support for the research, authorship and/or publication of this article.
Informed Consent
Written, informed consent was taken using a consent form, from the participants before their inclusion into the study.
References
Supplementary Material
Please find the following supplemental material available below.
For Open Access articles published under a Creative Commons License, all supplemental material carries the same license as the article it is associated with.
For non-Open Access articles published, all supplemental material carries a non-exclusive license, and permission requests for re-use of supplemental material or any part of supplemental material shall be sent directly to the copyright owner as specified in the copyright notice associated with the article.