
Abstract
Newcomers to Ireland confront a context of reception shaped by large-scale historical emigration and more recent immigration defined by an increasingly diverse set of origin contexts, both within and outside the European Union (EU). How has the Irish population responded to these groups, and how openly do Irish residents express their views toward different immigrant groups? We test this response using a survey experiment, which offered respondents an anonymous way to express any negative attitudes to immigrant groups they may have had. Results from the survey experiment show that Irish residents’ support for Black and Polish immigrations is overstated when expressed directly. In contrast, their sentiment toward Muslim immigrants is notably insensitive to the level of anonymity provided, indicating little difference between overt and covert expression of support (or antipathy). In other words, when race/ethnicity or EU origin is made salient, Irish respondents are more likely to mask negative sentiment. When Islam is emphasized, however, Irish antipathy is not masked. We find that in-group preferences, instead of determining support in an absolute sense, shape the reluctance with which opposition to immigrant groups is overtly expressed.
Introduction
In recent decades, immigration has emerged as a pivotal issue in Europe (Fumarola 2021). Recent events, such as the 2015 peak in refugee arrivals (Eurostat 2019), coupled with the increasing popularity of anti-immigrant political platforms across Europe, have defined contexts of reception in which the expression of anti-immigrant sentiment, whether by public figures or the general public, has become more open and prominent (Akkerman, De Lange, and Rooduijn 2016). The result is an emergent European landscape in which the norms about what is (and is not) acceptable to express regarding immigrants and immigration reflect broader tensions around immigration's political and social implications in Europe and globally (Muis and Immerzeel 2017).
Immigration, as a process and a collective experience, is far from new to Ireland, where it is embedded in a shared history and diasporic identity (Bielenberd 2014 [2000]). Although estimates are contested, some scholars place the global Irish diaspora at nearly 70 million (Trew and Pierse 2018). Less contested is the fact that the population of Ireland, reduced by a sustained exodus for much of the nineteenth and twentieth centuries, has yet to return to population levels observed in the 1850s (Kelly and Fotheringham 2011). Recently, however, Ireland, like many historical sending contexts in the European Union (EU), has emerged as a new destination for an increasingly diverse immigrant community in terms of race/ethnicity, origin country, language, and religion (Fahey, McGinnity, and Grotti 2019). In addition, EU migrants make up a large share of immigrants in Ireland, as EU membership permits citizens of EU member-states to live and work in Ireland without restriction (McGinnity, Creighton, and Fahey 2020). The experience of historical and sustained emigration, where many living in Ireland have been immigrants themselves or members of immigrant-sending households, offers a plausible overlap, in terms of identification, between Irish people and newcomers to Ireland. This experience, at least in principle, might lead us to expect residents of Ireland to hold positive attitudes toward immigrants.
Survey data can provide important insights into the host population's attitudes toward immigrants and ethnic and religious minorities. However, there is often a concern among analysts that people hide or mask their negative views toward these groups in surveys and give “socially desirable” responses (Davis and Silver 2003; Phillips and Clancy 1972). Thus, efforts to measure controversial attitudes confront mounting evidence that overtly expressed sentiment can be significantly and substantively biased (Arnold and Feldman 1981; Brenner and DeLamater 2016; Kuklinski et al. 1997a; Kuran and McCaffery 2008; Presser and Stinson 1998). Work on anti-immigrant attitudes also increasingly acknowledges that intolerance is often expressed reluctantly and strategically, as is evidenced when measuring support for a closed border (Creighton, Jamal, and Malancu 2015; Janus 2010), immigration policy preferences (Knoll 2013b), nativism (Knoll 2013a), racism (Kuklinski, Cobb, and Gilens 1997a; Kuklinski et al. 1997b), and Islamophobia (Creighton and Jamal 2015, 2020; Creighton and Strabac 2020; Strabac and Listhaug 2008; Strabac, Aalberg, and Valenta 2014).
The list experiment used in this article offers respondents an anonymous way to express their opinions (Glynn 2013). List experiments present the “treatment” group of respondents with a list of items, including one sensitive item, and ask how many items they agree with. Crucially, respondents are not asked which of the items they agree with, just how many. A “control” group is given the same list of items, minus the sensitive item that asks about support for the controversial topic—in this case, a particular immigrant group coming to Ireland. As the groups are randomly assigned and as both samples are presented with the same control list items, any difference between the average response to the control and to the treatment is due to the additional (sensitive/focal) item. Respondents in the control group are also asked a direct question about support for a particular immigrant group. The difference between revealed support from the direct survey question and support from the list is interpreted as a measure of the extent to which support for immigration is over-stated or to which negative attitudes are hidden or “masked” (Creighton, Schmidt and Zavala-Rojas 2019; Creighton et al. 2019).
By way of a list experiment rooted in Social Identity Theory (SIT), we explore the expression of support for newcomers to Ireland by the population in Ireland, emphasizing three frames. 1 These frames highlight specific group-level characteristics of immigrant groups, placing a spotlight on race/ethnicity (Black), religion (Muslim), or an EU link (Polish). Responses reveal how presenting certain identities as salient shapes the extent to which particular forms of support are selectively and strategically expressed by the Irish population. 2 Results suggest that some immigrant out-groups, Black and Polish, experience the non-trivial masking of antipathy, which translates in a significant over-statement of support by respondents living in Ireland. Muslim immigrants to Ireland, by contrast, confront a distinct receiving context in which there is little evidence that support for them by the Irish population is overstated.
This article contributes to the literature on attitudes toward immigration in two key ways. First, it documents, for the first time, the masking of anti-immigrant sentiment in survey data in Ireland—a new immigrant-destination country in Europe characterized by the absence, for now, of an openly anti-immigrant political party and a long history of emigration (O’Malley 2008). Second, our article compares overtly expressed sentiment to covertly expressed sentiment directed at immigrants framed by race/ethnicity, religion, and EU origin. In so doing, it enhances understandings of how the social identities of both immigrants (e.g., race/ethnicity, religion, origin country) and the Irish population (e.g., education, sex, age) shape the expression of anti-immigrant sentiment.
To develop these ideas, our article proceeds as follows. The next section considers approaches to understanding anti-immigrant sentiment, in particular SIT, salience, and social desirability. What follows from there is a presentation of the Irish case and the role of religion, race/ethnicity, and EU origin in recent immigration to Ireland. After developing two key research questions, we discuss how we investigated these questions by describing the design of the list experiment. Results are then presented, followed by a discussion of the article's findings and broader implications for research on attitudes toward immigrants and immigration.
Social Identity, Immigration, and Attitudes
Two complementary literatures have emerged in recent years to theoretically define the determinants of anti-immigrant sentiment. One emphasizes material concerns, linking the emergence of antipathy toward immigrants/immigration to competition with newcomers—real or perceived—for employment or wages (Hainmueller and Hiscox 2010; Mayda 2006). Within this body of work, material considerations could also encompass anxiety about non-monetary social benefits like housing, education, or healthcare (Facchini and Mayda 2009). Although these material considerations remain relevant (Polevieja 2016), other authors suggest that attitudes toward immigrant and immigration are also often shaped by other, less material considerations (Ceobanu and Escandell 2010; Hainmueller and Hopkins 2014).
A second perspective on the formation of anti-immigrant sentiment, thus, emphasizes socio-cultural concerns. Ethnic/racial difference and cultural practices (e.g., religion) constitute the primary determinants of antipathy within this scholarship (Burns and Gimpel 2000; Chandler and Tsai 2001; Citrin et al. 1997; Dustmann and Preston 2007; Espenshade and Hempstead 1996; Esses, Jackson, and Armstrong 1998; Esses et al. 2001; Fetzer 2000; McLaren 2003; Meuleman, Davidov, and Billiet 2002). Rather than adjudicate between independent determinants of antipathy toward immigrants, we suggest that a more general theoretical perspective—SIT—better encompasses the overlap of material and socio-cultural considerations (Brown 2000; Tajfel 1970; Tajfel et al. 1971; Tajfel and Turner 1986).
At its core, SIT argues that individuals categorize others in relationship to their own identity (in-group) and to identities of groups to which membership cannot be claimed (out-group) (Kalkan, Layman, and Uslaner 2009; Kinder and Kam 2009; LeVine and Campbell 1972; Sumner 1906). From this base, it suggests that preferences for different groups emerge. If competition for resources, power, or any privilege is plausible, a realistic conflict is anticipated and antipathy results (Sherif and Sherif 1979). Distinct from perspectives that isolate labor-market competition (Burns and Gimpel 2000; Malchow-Møller et al. 2009; Mayda 2006; Polevieja 2016), SIT argues that group identity plays a key role in defining why certain identities/attributes, when perceived as associated with an out-group, can be problematized by in-group members (Brown 2000; Tajfel 1970; Tajfel et al. 1971; Tajfel and Turner 1986).
From the perspective of SIT, it is not competition that negatively shapes attitudes but who constitutes an acceptable competitor. Immigrants, when perceived as an out-group, can emerge as a defined other, which theoretically do not benefit from the preferences in-group membership affords. For example, more ethnically, racially, or religiously distinct immigrant groups would be differentiated from those who share the dominant group's ethnic, racial, or religious identity in a given country context (Creighton and Jamal 2015; Kinder and Kam 2009). Broadly, then, in-groups are favored relative to out-groups, and the process of group categorization accounts for more than just a single material or socio-cultural dimension (Adorno et al. 1950; Levinson 1949; Sumner 1906). This perspective is distinct from notions of ethnic and cultural threat, as in-group favoritism is not dependent on loss (real or perceived) of socio-cultural dominance/influence in a given context of reception (Brown 2000; Tajfel 1970; Tajfel et al. 1971; Tajfel and Turner 1986).
Prejudicial attitudes toward out-groups can emerge even when group differences are minimal (Tajfel 1970; Tajfel et al. 1971; Tajfel and Turner 1986), and SIT's strength as a theoretical frame is its ability to underline the importance of in-group preference and, concurrently, out-group antipathy. That said, beneath this in-group/out-group dichotomy lies a more nuanced reality in which overlapping out-group identities such as religion, immigrant status, and ethnicity define greater or lesser socio-cultural distance (Creighton and Jamal 2015; Creighton, Schmidt, and Zavala-Rojas 2019; Creighton et al. 2019b). Some work finds such socio-cultural distance to be cumulative, with multiple out-group characteristics being interpreted in concert (Ceobanu and Escandell 2010; Collier 2013; Hainmueller and Hopkins 2014).
We suggest that the operationalization of socio-cultural distance is far from straightforward. Notions of difference are not uniform and depend on the characteristic of both in-group and out-group members (Bazo-Vienrich and Creighton 2017). Although evidence of socio-cultural distance as a cumulative concept is limited, efforts to summarize the literature on anti-immigrant sentiment indicate that some out-group identifiers significantly predict attitudes toward immigration, particularly those that capture cultural, racial, and national dimensions of majority populations in contexts of reception (e.g., Ceobanu and Escandell 2010; Hainmueller and Hopkins 2014). To be clear, singular in-group and out-group characteristics should never be interpreted as sufficient to wholly define an immigrant or immigrant group. However, specific characteristics can be relatively more (or less) salient in a given interaction, as has been noted in the evolution of SIT (Brenner 2011; Brenner, Serpe, and Stryker 2014), for shaping what characteristics come to the fore when evaluating opinion options and, thus, for understanding how specific frames are interpreted by respondents and, in some cases, acted upon.
On a practical level, the use of salience to shape how respondents interpret a frame has been considered in the literature on framing (see Chong and Druckman 2007a for an overview). Framing, at its most basic level, suggests that attitudes are formed by combining an individual's knowledge of a specific attribute and the salience attached to that same attribute (Ajzen and Fishbein 1980). In the case of immigration, a frame might emphasize a specific religion and, by isolating that attribute, increase its salience in the presentation of the broader construct (i.e., immigration). Some scholars refer to variation in the salience attached to an attribute as a frame's “strength” in the evaluation of a concept (Chong and Druckman 2007b). Of course, salience may vary depending on the country context, in particular its experience of immigration and the composition of its immigrant population, as we now discuss.
Ireland and Immigration
In contrast to its long historical pattern of emigration, which came to define its national identity, Ireland experienced net immigration during the economic boom in the late 1990s and early 2000s, known as the Celtic Tiger (McGinnity et al. 2018). Initially, immigrants were returning Irish emigrants, but this group was soon joined by others from European countries and around the world, bringing greater national, ethnic, and religious diversity to a largely White, Irish, and Catholic Ireland (McGinnity et al. 2018). The 2004 accession of 10 new EU member-states brought a rapid increase in immigration to Ireland from Eastern Europe, especially Poland (McGinnity et al. 2018). Ireland's deep economic recession, which began in 2008 and was precipitated by the global financial crisis, saw a return to net emigration, as immigrants left and Irish nationals emigrated in search of work (McGinnity et al. 2018). With economic recovery, however, Ireland's net migration became positive again by 2015 (ibid.). In 2017, around three quarters of all immigrants in Ireland were from other EU countries, which is high relative to other EU receiving countries (McGinnity, Creighton, and Fahey 2020). EU nationals can live and work in Ireland without restriction, but non-EU nationals require work permits, which target highly skilled occupations (ibid.). 3 As a result, non-EU migrants to Ireland, particularly citizens of Asian countries and North America, often have high educational qualifications and work in managerial/professional jobs (McGinnity et al. 2020). 4
Public opinion on immigration in Ireland has been generally positive when evaluating immigrants’ contribution to the Irish economy, society, and cultural life (McGinnity et al. 2018, 2020). That said, there is some evidence that these attitudes are sensitive to labor-market conditions and social interaction (Turner and Cross 2015). For example, Irish sentiment toward immigrants was relatively positive during the boom period of the Celtic Tiger but became more negative during the 2008–2012 recession, only to recover again in the more recent period (McGinnity et al. 2018). Less, however, is known about how the Irish public perceives the salience of specific immigrant characteristics. For reasons outlined in greater detail below, three frames are considered particularly meaningful for understanding attitudes to immigrants and immigration in an Irish context: (1) religion, (2) race/ethnicity, and (3) EU origin.
(1) Religion, a historically important source of in-group national identity in Ireland, remains particularly salient for a quarter of the Irish population or less (Pew Research Center 2018). That said, Christianity in general and Catholicism in particular remain important sources of Irish group identity, reflected in 90 percent of primary schools retaining a Catholic patronage in 2018. 5 Catholic dominance of the Irish education system creates a context in which non-Christian immigrants, especially Muslims, constitute a plausible out-group. Although little work has considered religion's role in shaping anti-immigrant sentiment in Ireland, Islam has emerged as a clear source of antipathy across Europe (Helbling 2014; Savelkoul et al. 2011; Strabac and Listhaug 2008) and the United States (Creighton and Jamal 2015; Jamal and Naber 2008; Kalkan, Layman, and Uslaner 2009).
Muslim immigrants experience significant antipathy relative to other immigrant groups in historically non-Muslim contexts (Creighton and Jamal 2015, forthcoming). In addition, religious in-group identity matters in that non-Muslims who are more religious are also more likely to be anti-Muslim (Davidov et al. 2008; Sides and Citrin 2007). Some scholars suggest that religion itself, rather than identity markers such as dress, is at the root of opposition to Muslim immigrants in Western Europe (Helbling 2014). Context also matters, with some research finding that in places like Norway, some aspects of religious expression (i.e., covering) do, in fact, garner greater antipathy among potential employers when seeking employment relative to an identified Muslim background without any visual cue (Strabac et al. 2016). Work in the United States finds that the open expression of opposition to granting citizenship is greater when directed toward Muslim immigrants than toward other groups such as Christians but that when respondents are provided absolute anonymity, Muslim immigrants face similar opposition as other immigrant groups, including Christians (Creighton and Jamal 2015).
In Ireland, the Muslim population has recently grown from a very small base and, in 2016, constituted 1.3 percent of the overall population (CSO 2017). Compared to the general, non-immigrant population in Ireland, Muslims are disproportionately young, urban, professional, and highly educated, although they also have higher unemployment rates (Fahey, McGinnity, and Grotti 2019). Among Ireland's Muslim population, there is a high degree of diversity defined by origin country, language, and religious practice (Fanning 2018). Over 40 percent of Muslims in Ireland reported “Asian” ethnic background in the 2016 Census, 6 while 20 percent reported Black ethnicity (McGinnity et al. 2018).
In terms of attitudes toward immigrants in Ireland, Islam constitutes a clear out-group identity. For example, Fahey, McGinnity, and Grotti (2019) find that Irish attitudes toward Muslim immigrants are much more negative than Irish attitudes toward White immigrants; they also find frequent religious practice among Irish respondents to be associated with more negative attitudes toward Muslim immigrants, but not toward White immigrants. Attitudes toward Muslims in Ireland became somewhat more negative in the immediate aftermath of a 2015 terrorist attack in Paris attributed to Muslim extremists, suggesting that in Ireland, where there is no prominent national debate on Islam and where the Muslim population is small, Irish people's understanding of Islam is informed mainly by negative media coverage (Fahey, McGinnity, and Grotti 2019).
(2) Race/Ethnicity, via the racialization of immigration, features prominently in some contexts, as is exemplified by findings in Ireland (McGinnity et al. 2018), the United States (Bazo-Vienrich and Creighton 2017), and the UK (Ford 2011; Park et al. 2013). Research consistently shows that co-ethnic immigrants are seen by host populations relatively more favorably than immigrants who do not share the host population's ethnicity (Bazo-Vienrich and Creighton 2017; Brader et al. 2008; Card 2005; Hainmueller and Hopkins 2014). In the United States, evidence suggests that minority ethnic groups also show in-group preferences for co-ethnic newcomers (Bazo-Vienrich and Creighton 2017). Research that explores variation in attitudes to immigrants by origin country in the UK finds that White respondents favor immigrants from Western Europe, Eastern Europe, and Australia relative to those from India, Africa, and Caribbean/West Indian countries, a pattern partly attributable to in-group preferences rooted in ethnicity (Ford 2011).
In Ireland, working-age African nationals typically have higher educational attainment than Irish nationals (McGinnity et al. 2020); yet, evidence shows that their greater exposure to the asylum system disproportionately and negatively impacts their labor-market outcomes relative to immigrants from other contexts. Ethnicity also plays a role in Ireland, and labor market outcomes are worse for the Black ethnic group, whether they are Black Irish or Black African (McGinnity et al. 2018). The experience of discrimination among the Black ethnic group in Ireland is also higher than that of their White counterparts, both when seeking work and in the workplace itself (ibid.).
(3) EU origin immigration, which expanded along with expansion of the EU itself, resulted in new immigration dynamics among member-states (Favell 2008). Barriers to labor markets for newer member-states were reduced, and concurrently, intra-European migration flows increased (Favell 2008). Poland emerged as the origin for a growing share of newcomers to Ireland, increasing from 63,276 in 2006 to 122,515 in 2016 and constituting up 2.6 percent of the Irish population (CSO 2012). Eastern Europeans in Ireland are almost exclusively labor migrants with high employment rates marked by overrepresentation in low-skilled occupations (e.g., retail, accommodation, and food production) (Voitchovsky 2014). When employed in Ireland, Eastern Europeans are less likely to occupy professional and managerial jobs than the Black ethnic group (McGinnity et al. 2018). That said, their experience of discrimination seeking work does not differ from White Irish nationals, although Eastern Europeans are somewhat (1.5 times) more likely to report discrimination in the workplace than White Irish residents (McGinnity et al. 2018).
The recent increase in Eastern European immigration and its impact on Irish perceptions of immigration and the EU have received attention in the literature on Ireland (e.g., Krings et al. 2013). What is less understood, however, is how EU immigration, exemplified by Polish migrants in Ireland, results in distinctly expressed forms of support/antipathy toward EU migrant groups by the Irish population. Of note, work in the UK finds that some European migrants emphasize their whiteness and Europeanness to reposition themselves more favorably in Britain's racialized status hierarchies (Fox, Morosanu, and Szilassy 2015). Research on attitudes to immigration also consistently finds that a strong in-group attachment rooted in national identity 7 translates into increased antipathy toward immigrants/immigration (Ceobanu and Escandell 2010; Coenders and Scheepers 2003; Creighton 2016; De Figueiredo and Elkins 2003; Gijsberts, Scheepers, and Coenders 2004; Kunovich 2002; O’Rourke and Sinnott 2006; Raijman et al. 2008). Given the strong, cohesive national identity in Ireland (Fanning 2018), in-group attachment might lead us to expect resistance to immigration, even of Poles—White, EU migrants.
Although the three out-group identifiers highlighted above—religion, race/ethnicity, and EU origin—offer meaningful insight into contemporary immigration in an Irish context, this article does not present them as wholly independent frames. Immigrant identity and how it is perceived by members of receiving societies are better understood as a concert of overlapping and intersected identities—from the perspective of both immigrants and the receiving society (Browne and Misra 2003; Choo and Ferree 2010; Hancock 2007). Although this survey experiment attempts to distinguish three out-groups by presenting a single frame in three different waves of the survey, this approach does not prevent some overlap between religion, race/ethnicity, and EU origin. As has been pointed out elsewhere (Carr and Haynes 2015; Jamal and Naber 2008), religion, particularly Islam, and race/ethnicity are related. This analysis, thus, acknowledges the intersection of multiple out-group and in-group identities but still sees value in understanding how certain characteristics—defined by religion, race/ethnicity, and EU origin—shape how open support for immigrant groups is expressed by the population in Ireland and, in some cases, over-stated.
Research Questions
[Q1] If immigrants to Ireland are framed 8 by race/ethnicity, religion, or EU origin in a survey experiment, does it change the level of support expressed by the Irish population?
To this initial question, we anticipate three plausible responses. First, if distinct immigrant frames—race/ethnicity, religion, or the largest EU-sending country (i.e., Poland)—elicit different levels of support for immigrant groups from the Irish public and no significant masking is present, we will see clear differences in the levels of both overtly and covertly expressed support for immigrants by respondents. Second, if little difference is observed in the Irish pubic between the attitudes toward each immigrant frame and no significant masking is present, we will see little/no variation in the level of overt or covert support expressed. Third, if masking is a concern, we will expect overtly and covertly expressed support to differ significantly.
[Q2] If immigrants to Ireland are framed by race/ethnicity, religion, or EU origin in a survey experiment, does it change the extent to which support for immigrant groups by the Irish population is masked?
This second question more specifically targets the role of masking. In this case, in-group preferences—whether race/ethnicity, religion, or EU origin—could result in significant differences between groups in terms of masked sentiment. Two patterns are plausible. First, if certain immigrant frames elicit greater masking, significant differences will emerge in the extent to which social desirability results in masking. For example, if religion is a stronger in-group identity, support for immigrant groups that do not constitute an in-group on that dimension will not benefit from masking to the same extent as immigrant groups framed using other attributes (e.g., race/ethnicity). Second, if in-group/out-group distinctions are not salient to the Irish public, little difference will emerge in terms of masking. In this case, social desirability will be similar regardless of the immigrant frame presented.
Data Collection
We use data from three list experiments embedded in the Economic Sentiment Monitor (ESM), a nationally representative telephone survey of the Irish population (Duffy, Morley, and Watson 2015). Collected monthly between April 2008 and April 2019, the ESM was carried out by the Economic and Social Research Institute (ESRI). In addition to recording a variety of respondents’ individual characteristics (e.g., age, gender, nationality, occupation, and educational attainment), its core objective was to gauge public sentiment about the Irish economy, housing market, and personal savings. The ESM was a repeated cross-sectional survey, which sampled approximately 800 respondents in each wave. 9 Post-stratification within-household sample weights with respect to the Irish Labour Force Survey were used to ensure that the sample was representative of the adult Irish population. The primary mode of interaction was via landlines, but the ESM also included a mobile-only subsample to capture at least 125 respondents per data collection that lived in households with no landlines. The ESM's initial effective response rate was 37 percent in 2013 (Duffy, Morley, and Watson 2015).
Analytic Sample
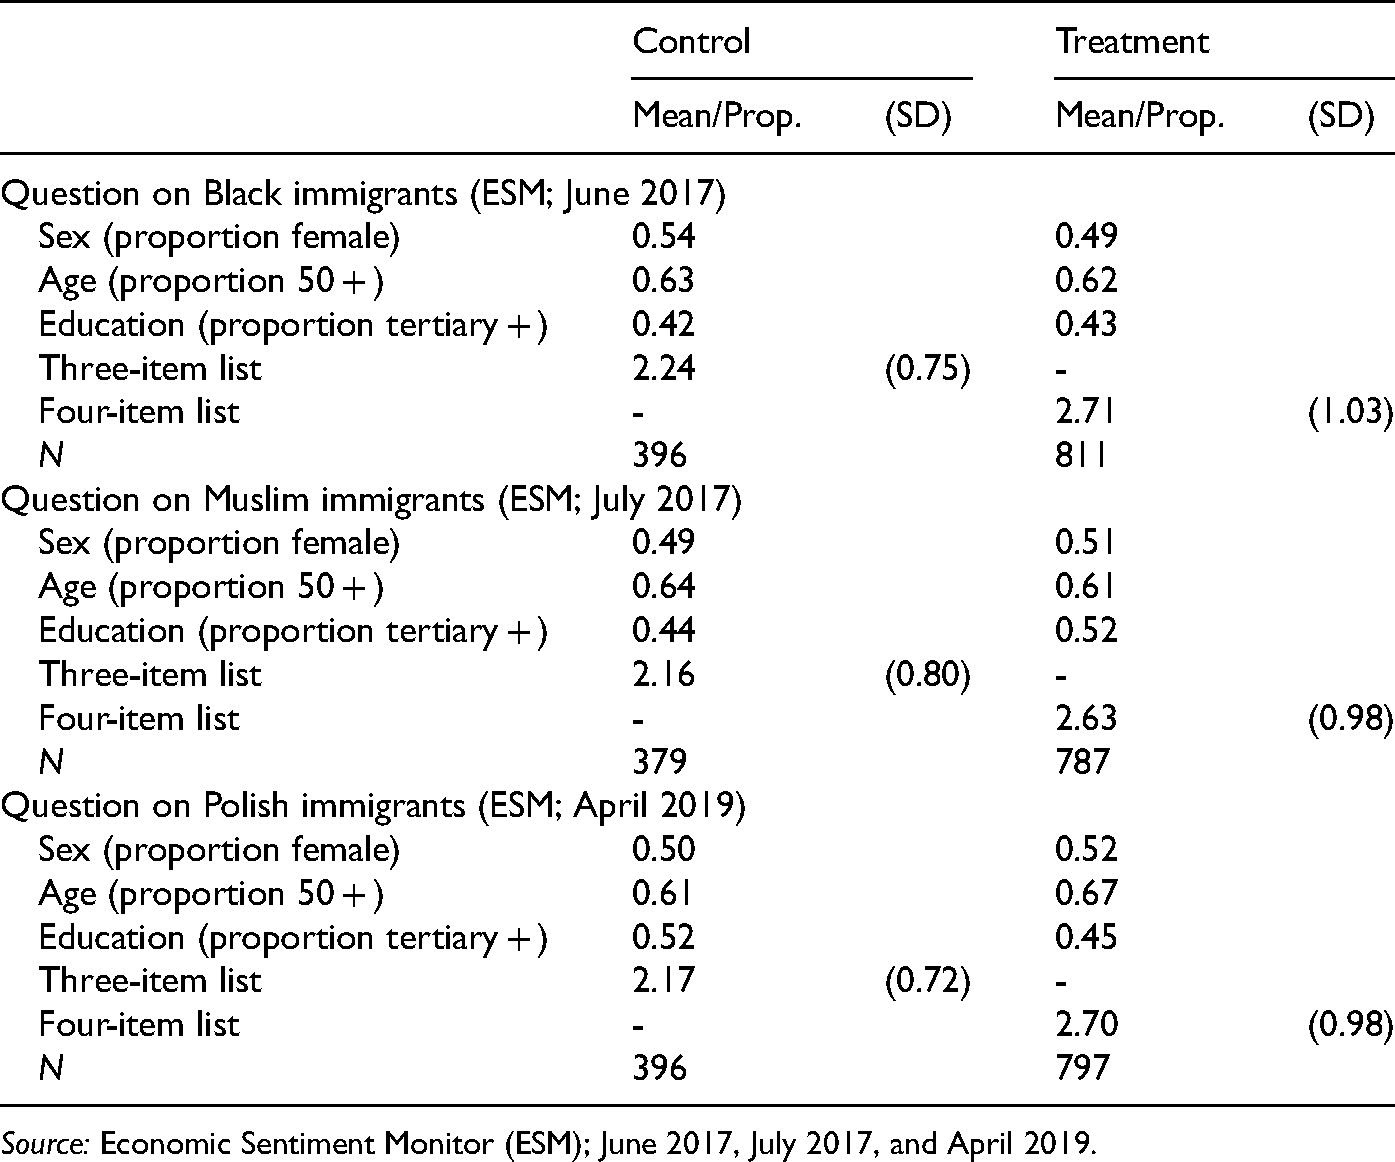
Table 1 reports descriptive statistics from three rounds of the survey used in the analysis. We show the mean and standard deviation of the control (three-item) and treatment (four-item) lists and for three key socio-demographic characteristics: sex, age, and educational attainment. We apply an age cut-off point of 50 so that the two age groups have a similar number of cases. The ESM contains seven categories for respondents’ highest level of educational attainment. We code as “less educated” those who had a technical/vocational qualification or less. Thus, the highly educated group is composed of respondents with higher educational certificates/diplomas, degrees, or postgraduate qualifications.
Descriptive Statistics.
Source: Economic Sentiment Monitor (ESM); June 2017, July 2017, and April 2019.
The breakdown by age, gender, and educational attainment is similar both across control and treatment groups and across the three different surveys. The gender split is relatively even in all cases, and the proportion aged over 50 ranges between 61 percent and 67 percent. Between 42 percent and 52 percent of the sample are deemed to be highly educated. Thus, we can divide the sample from each survey by any of these characteristics and never be left with a sub-sample comprising less than 40 percent of the total. The ESM does not allow for the identification of second-generation immigrants, but first-generation respondents constitute a small percentage of the sample across all rounds (n = 74). The estimates from the list experiment did not differ significantly or substantively when these respondents were excluded (results not shown). To retain a representative sample of the Irish population, we elected to use the full sample. It is also reassuring to see that the mean on the three-item control list remains relatively stable over time, although it is slightly higher in the June 2017 survey, which asks about attitudes toward Black immigrants. The treatment list mean varies from 2.63 to 2.71.
Design of the List Experiment
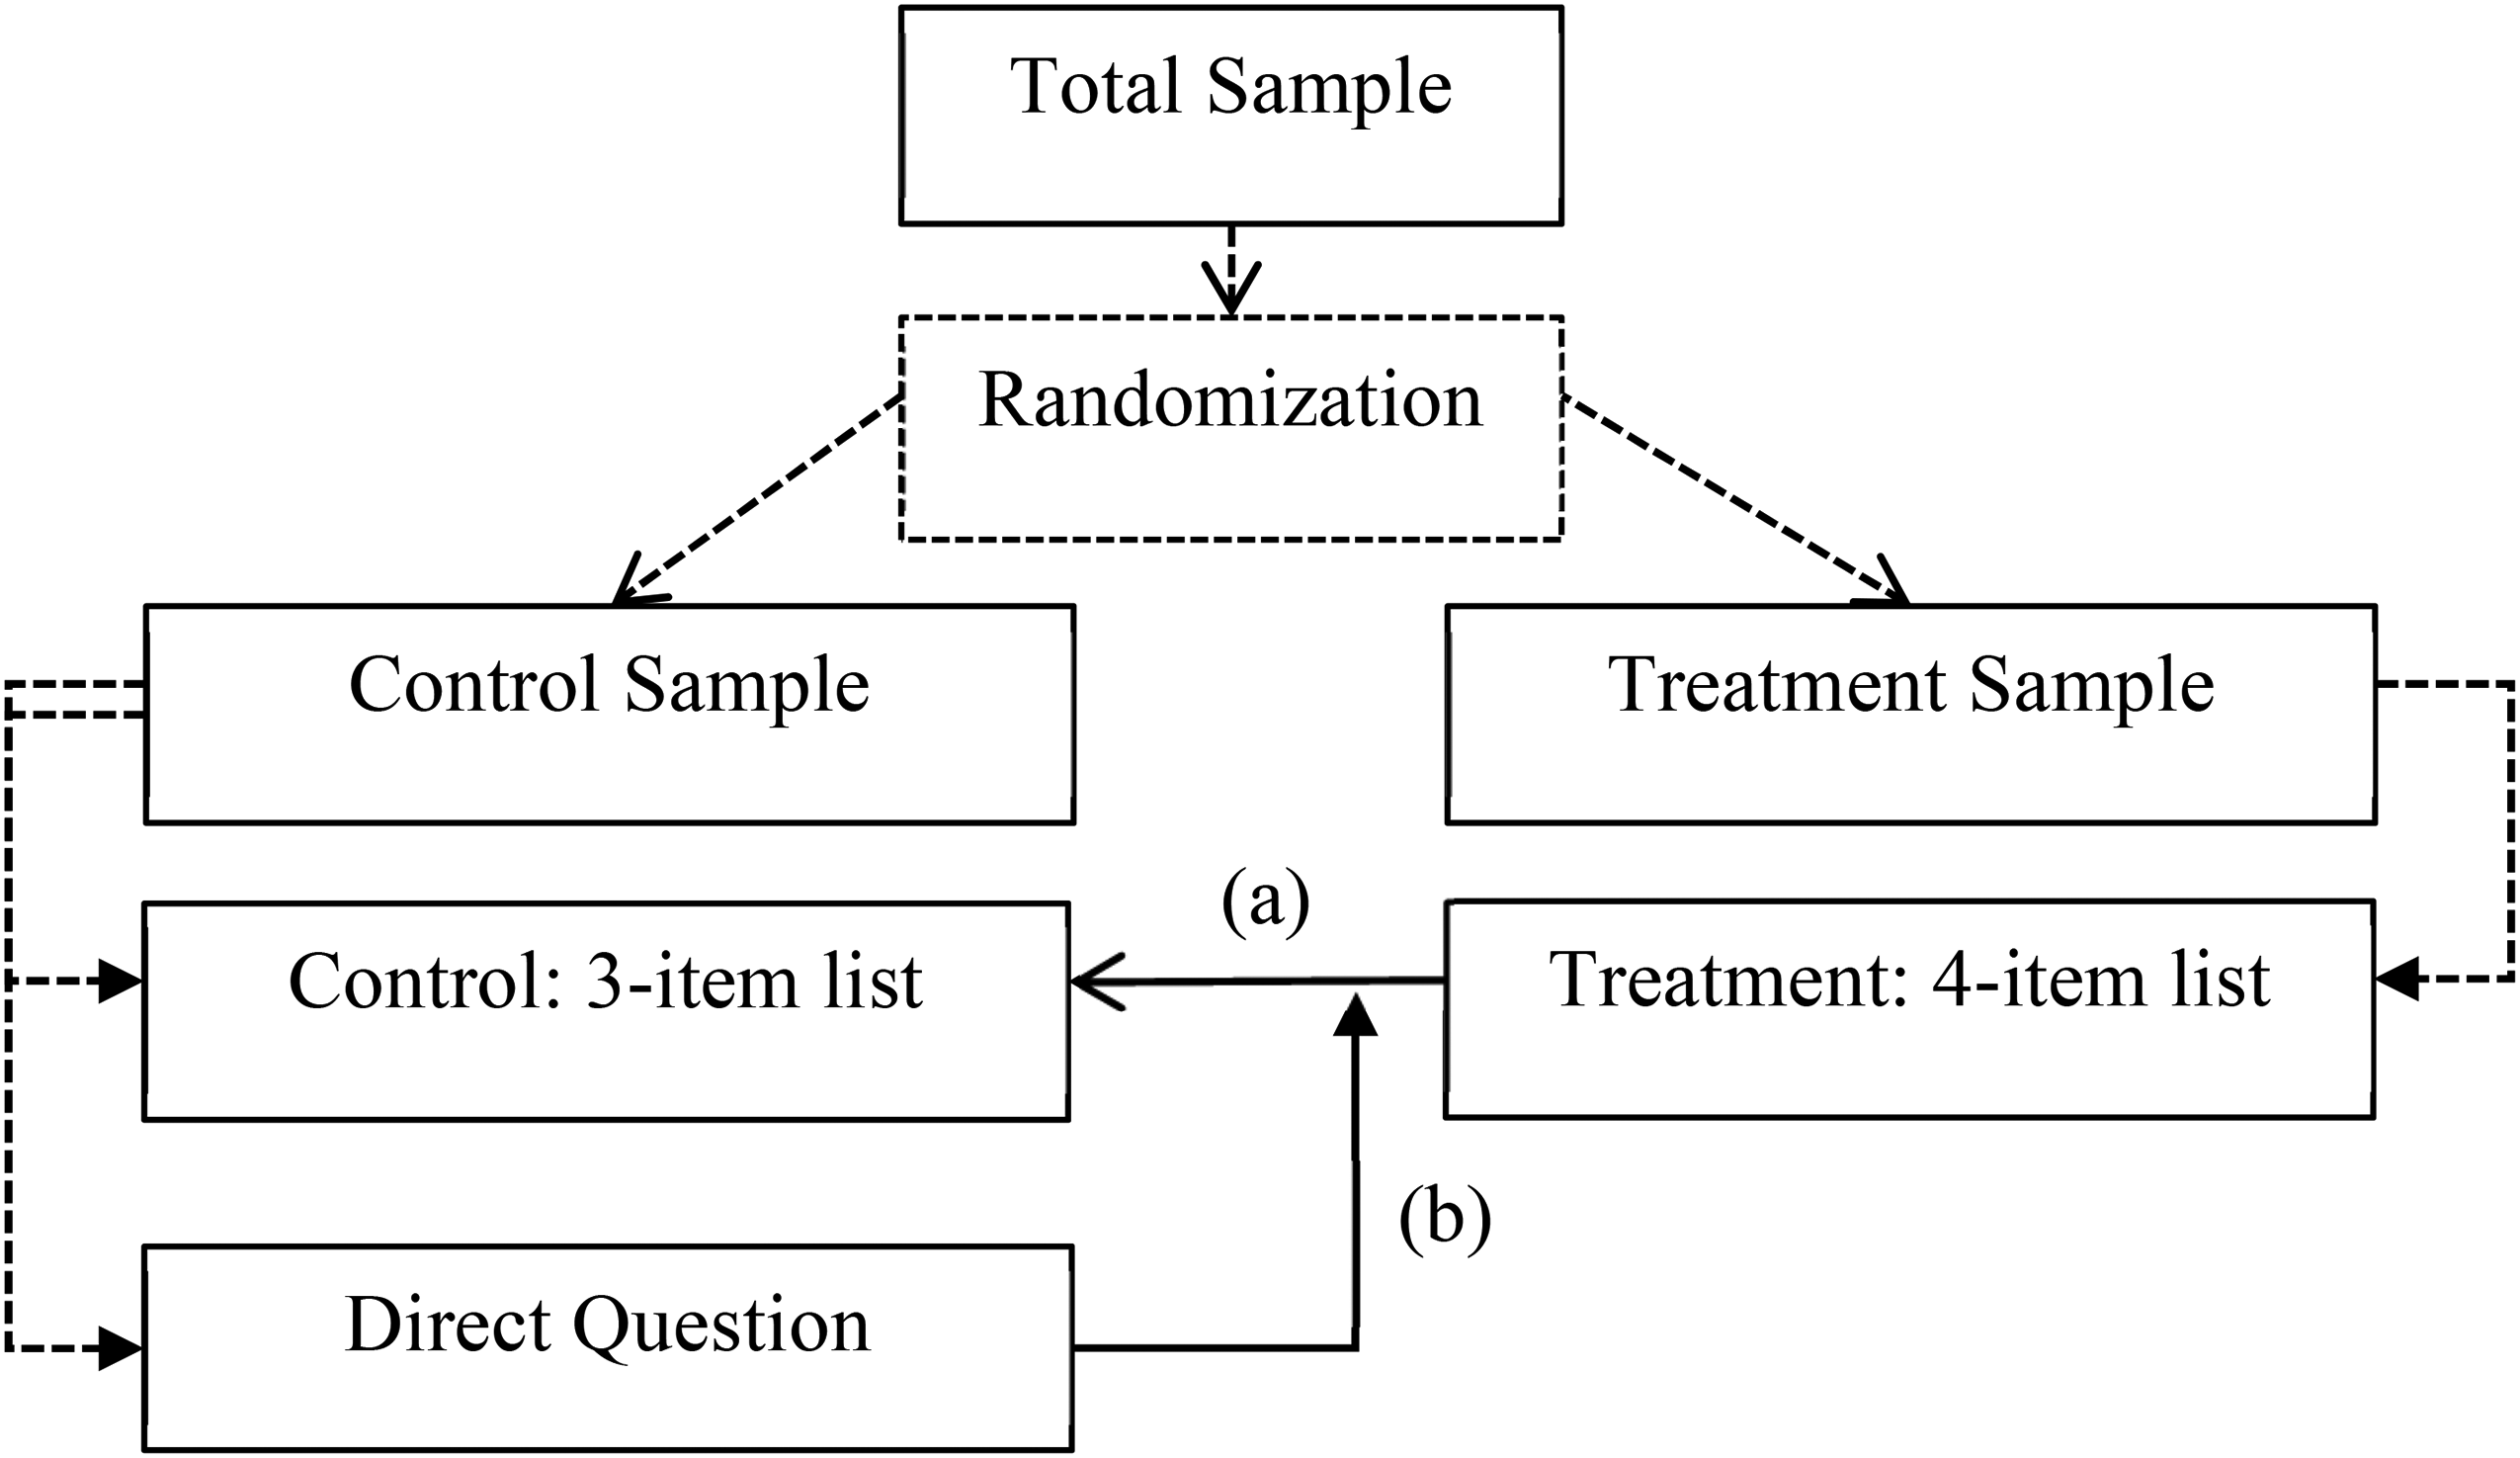
The experiment used in this work was embedded in three independent ESM waves: June 2017, July 2017, and April 2019. Inserted into the questionnaire after questions focused on consumer sentiment, the list experiments preceded any background questions on respondents’ socio-demographic characteristics. The general design is shown in Figure 1 and involves two steps. Step one required that the ESM sample for a given wave was randomly assigned to a treatment and control group. The control group was presented with a three-item list question with the following wording: [Control list question] The next questions are about your opinion on a few different issues in Ireland today. I am going to read out three
10
things that you may or may not support. After I read all three, just tell me HOW MANY of them you support. I don't want to know which statements, just HOW MANY.
Design of Experiment.
− Higher weekly state pension
− Lower tax on diesel
− Bigger fines for litter
The response to this question was a number between zero and three, from which a mean response and standard deviation can be derived. At the same time as the control group was receiving the three-item list, respondents assigned to the treatment group were presented with a similar four-item list question that included the same prompt as the control list question, the same three list items given to the control group, and a single additional focal item. [Focal/Sensitive item; ESM June, 2017] More Black people coming to live in Ireland [Focal/Sensitive item; ESM July, 2017] More Muslim people coming to live in Ireland [Focal/Sensitive item; ESM April, 2019] More Polish people coming to live in Ireland
As was the case for the control list, a mean response and associated standard deviation can be derived for the treatment. Of note, the mean response to the subset of items shared by the three-item control list and the four-item treatment list should be the same, since the two group are randomly assigned.
Step two, immediately following the three-item control list, respondents assigned to the control group received a direct question comparable to each of the focal items in the treatment list. The exact wording is as follows: [Direct question; ESM June, 2017] Would you support more Black people coming to live in Ireland? [Direct question; ESM July, 2017] Would you support more Muslim people coming to live in Ireland? [Direct question; ESM April, 2019] Would you support more Polish people coming to live in Ireland?
Responses to these direct questions were binary, allowing respondents to indicate yes/no. The three-item control list, four-item treatment list, and binary direct question provide all information needed to estimate overt support (openly expressed), covert support (expressed under conditions of absolute and permanent anonymity), and social desirability bias (the difference between overt and covert support). Figure 1 reports the sequence and samples that constitute the control and each treatment group in the list experiment.
The detailed description of the design offered above should not detract from its simplicity and intuition. The basic idea is that the mean response to the control list is subtracted from the mean response to the treatment list. The result is interpretable as the proportion who covertly expressed support for a given frame, which is indicated by (a) in Figure 1. This covert estimate can be subtracted from the direct question to assess the extent to which antipathy is masked, which is indicated by (b) in Figure 1. In both cases, the comparison's core is a simple test of means (see Creighton, Schmidt, and Zavala-Rojas 2019 and Creighton et al. 2019 for an introduction to the design).
In sum, then, the list experiment provides three key measures of attitudes. First, the direct question measures overt sentiment and is comparable to a standard survey. Second, subtracting the mean response to the control list from the mean response to one of the treatment lists (e.g., Muslim) measures covert sentiment as the individual-level response pattern cannot be known, providing absolute and permanent anonymity. Third, the difference between the overt and covert estimates measures the extent to which anonymity results in a distinct level of support/opposition, which is interpretable as social desirability bias.
Assumptions and Limitations of the List Experiment
For controversial topics, bias in estimates of public opinion is a well-known and documented phenomenon (see Blair et al. 2019 for a recent meta-analysis of the list experiment). The list experiment, due to comparability with standard survey collection modes and questionnaire design, has emerged as an increasingly popular approach to address over-reporting of desirable behaviors/opinions and under-reporting of undesirable behaviors/opinions (Glynn 2013; Imai 2011; Kiewiet de Jonge and Nickerson 2014). That said, for the list experiment to offer insight above and beyond what one can ascertain with a standard survey, maintaining anonymity is crucial. If a respondent selects all items in a list question, termed a ceiling effect, or no items, termed a floor effect, the response for any single item could be deduced. Thus, the response would be plausibly vulnerable to social desirability pressure akin to a direct survey question on the controversial topic, at least if we assume the respondent is aware of the potential for individual preferences to be known.
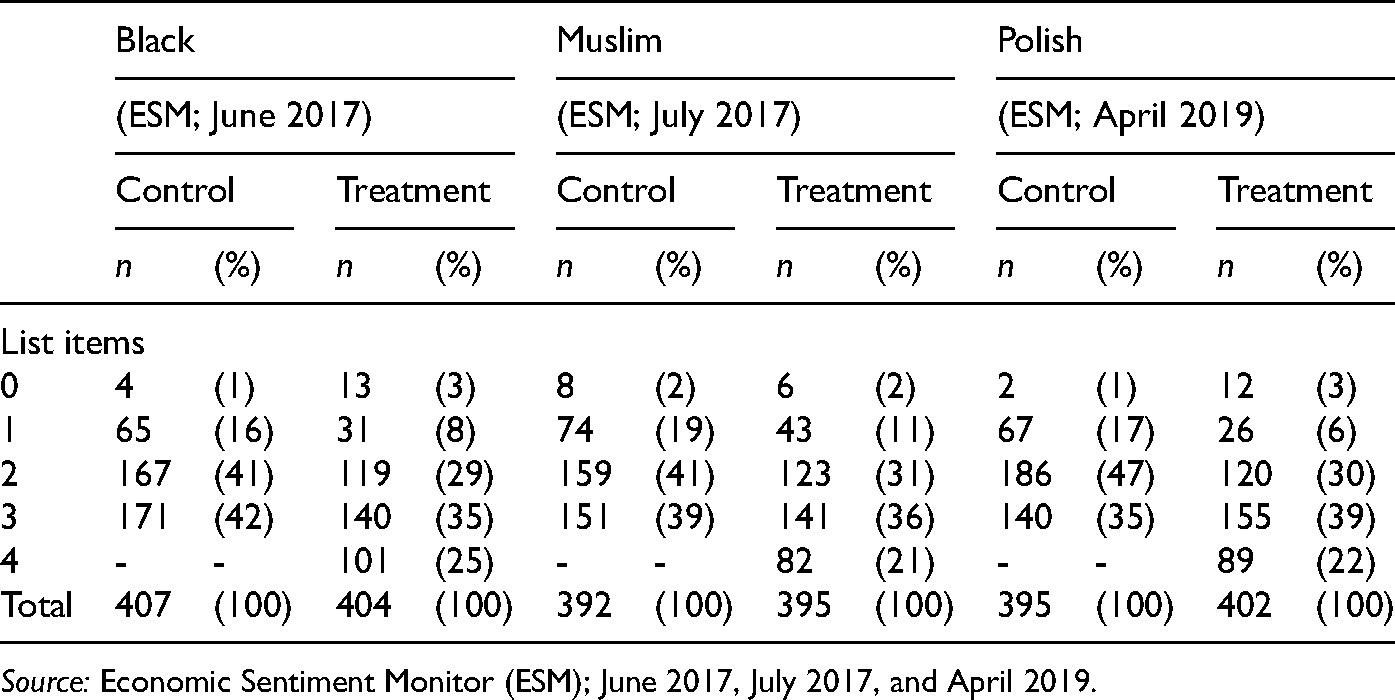
Table 2 reports the distribution of responses by number of items and survey wave. Of note, observed floor and ceiling effects are indicative but do not reveal respondents who changed their response when confronted with giving a response of zero or equal to the total number of items in the list. In other words, we can only account for responses where a respondent hit the ceiling or floor and decided not to adjust the response accordingly. The pattern of responses for the treatment list, which reveals support for the controversial focal item, indicates that up to a quarter of respondents are subject to a ceiling effect. 11 Evidence of floor effects is negligible, with three percent or fewer respondents for any given frame or experimental group selecting zero.
Distribution of List Items by Immigrant Frame and Experimental Group.
Source: Economic Sentiment Monitor (ESM); June 2017, July 2017, and April 2019.
The implication for interpretation is that up to 25 percent of respondents for a given frame did not enjoy total and permanent anonymity. However, we contend that the estimates are less biased than they might seem. The design of the list experiment used in this analysis is intended to allow respondents to avoid revealing intolerance. The ceiling effect does result in the revelation of targeted bias, as agreement with an item in any given frame indicates support, not opposition. As a result, agreement with all list items would not reveal intolerance, which is the source of social desirability pressure the list experiment is designed to mitigate, as agreement indicates support.
We suggest that for a list-experiment design that considers agreement with more items to be relatively more desirable, covert estimates remain an improvement over overt (i.e., direct) questions, even in the presence of ceiling effects. Importantly, we do not suggest that our estimates are unbiased. Instead, we consider the estimated covert response to be less biased and, as such, a modest and important improvement over standard survey techniques.
Results
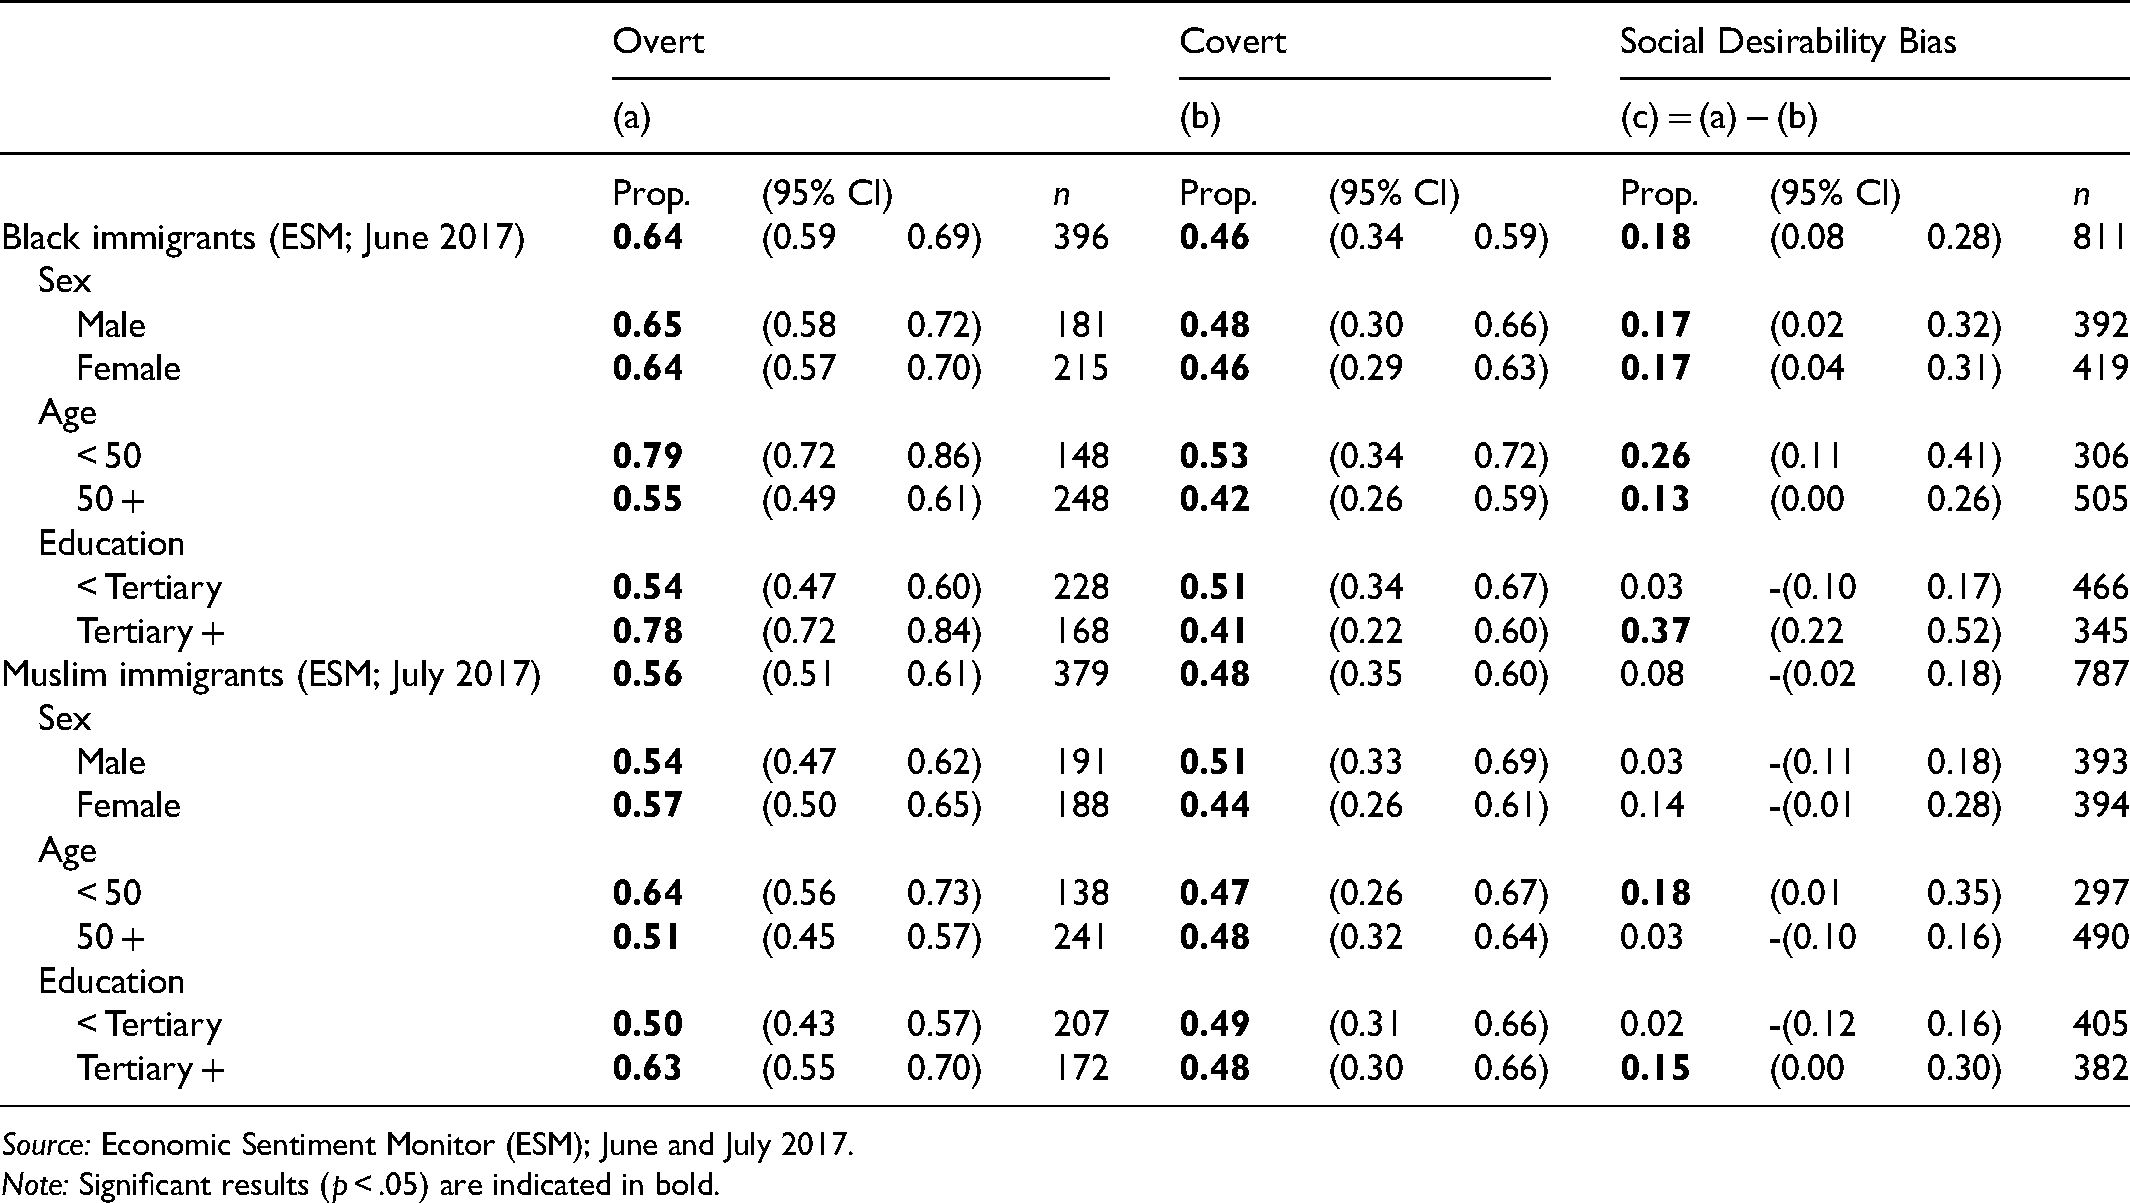
Tables 3 and 4 reveal that social desirability bias significantly changes the extent to which Irish people's attitudes toward Black and Polish immigrants are expressed but that attitudes toward Muslim immigrants are not similarly biased (i.e., social desirability pressure is less or absent). Approximately 20 percent of our sample held, but significantly concealed, non-supportive attitudes toward Black (Table 3) and Polish immigrants (Table 4). In contrast, estimates of social desirability for attitudes toward Muslim immigrants do not significantly deviate from zero. The absence of significant masking of antipathy toward Muslim immigrants in Ireland is similar to trends documented in the United States (Creighton and Jamal 2015), but the confidence interval indicates that the finding should be interpreted with caution, since some level of masking would avoid detection with the available sample size.
Estimates of Overt Support, Covert Support and Social Desirability Bias—Black Immigrants and Muslim Immigrants.
Source: Economic Sentiment Monitor (ESM); June and July 2017.
Note: Significant results (p < .05) are indicated in bold.
Estimates of Overt Support, Covert Support and Social Desirability Bias—Polish Immigrants.
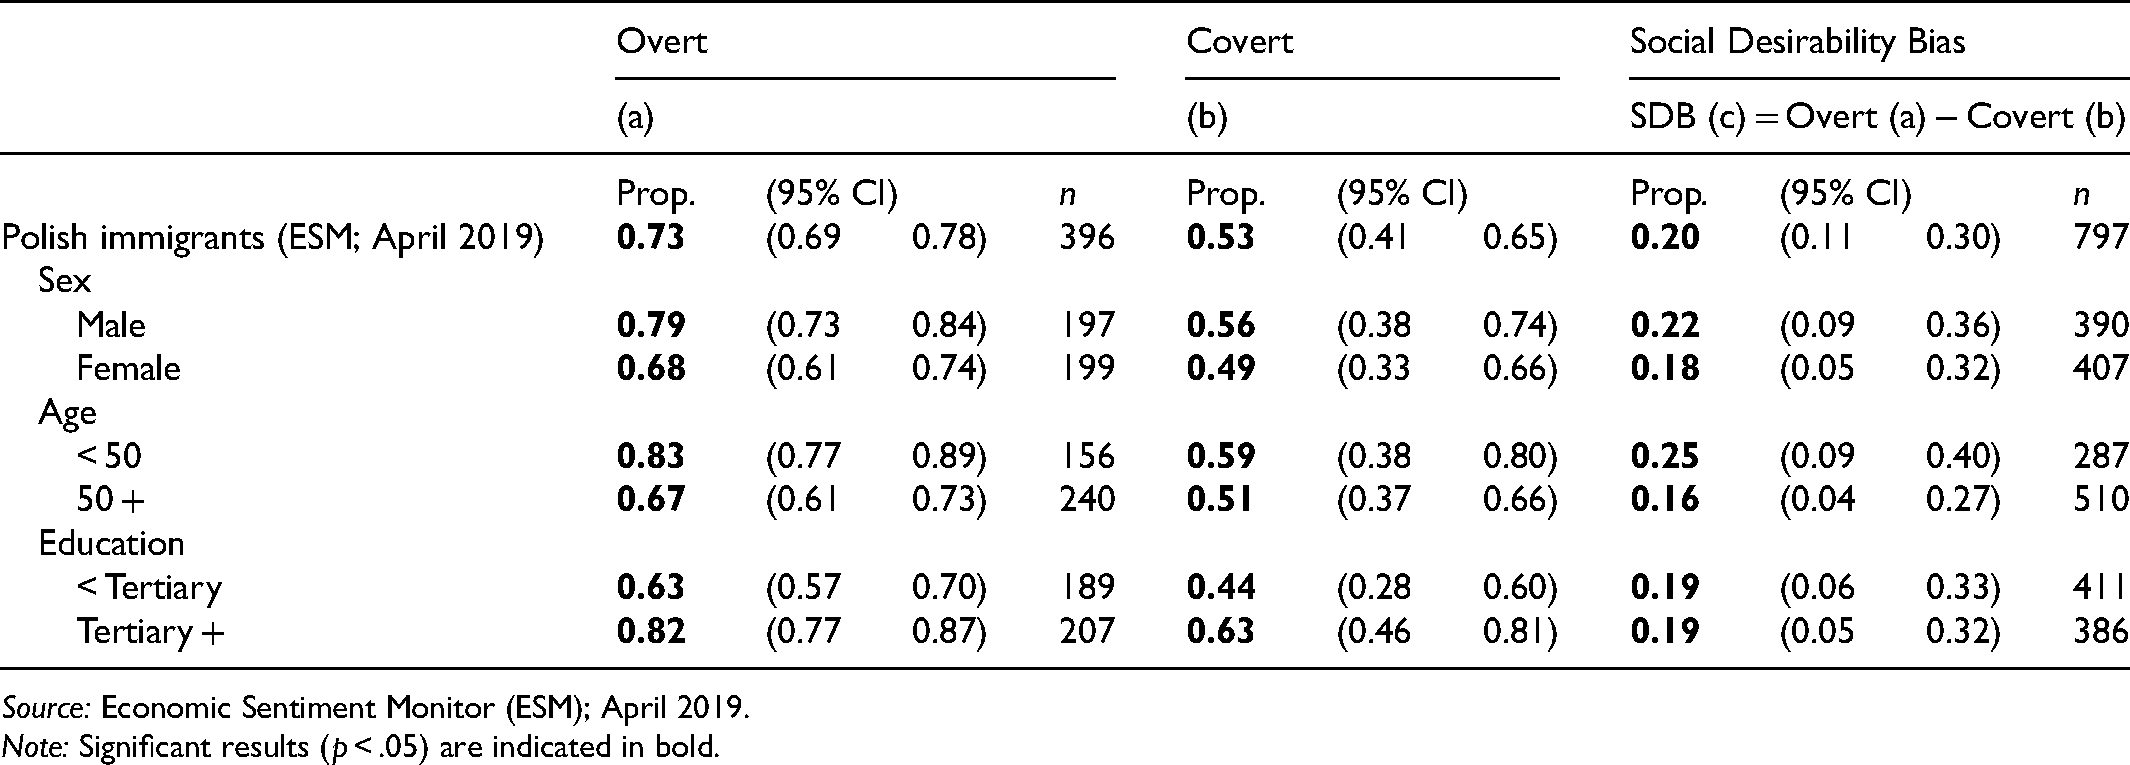
Source: Economic Sentiment Monitor (ESM); April 2019.
Note: Significant results (p < .05) are indicated in bold.
We find substantial variation in overtly expressed support for each immigrant group. Conversely, we find that levels of covert support are quite consistent across immigrant groups. As mentioned, covert estimates and, moreover, the difference between overt and covert attitudes (i.e., social desirability bias) must be interpreted with caution, as the list experiment results in notably wide confidence intervals. That said, these initial results compare favorably with evidence from the United States (Creighton and Jamal 2015), the Netherlands (Creighton, Schmidt, and Zavala-Rojas 2019; Creighton et al. 2019), and the UK (Creighton and Jamal 2020), where social desirability does not result in significant masking of antipathy for some immigrant groups.
When considering subpopulations, defined by sex, age, and education, results suggest that there is variation in both overt support and masking of antipathy. Specifically, we find that young and highly educated respondents openly expressed more positive attitudes toward immigrants but were also more likely to mask their negative attitudes toward both Black and Muslim immigrants. For instance, 37 percent of the highly educated sample held, but concealed, non-supportive attitudes toward Black immigrants, compared to just three percent of the less-educated sample (Table 3). This finding indicates that the educational gradient in attitudes toward each group was no longer significant when covert attitudes were considered. There is also evidence to suggest sex differences in attitudes, albeit limited, in that men were somewhat more likely to support Polish immigration than women.
Tables 5 and 6 present results from formal tests comparing attitudes to each immigrant frame. Significant results at the 5-percent level are indicated in bold. Relative to differences between overt attitudes, results suggest that covert attitudes deviated from one another to a lesser extent. Of note, tests of overt and covert differences were not similarly sensitive. When of similar magnitude (e.g., Black vs. Polish for older respondents), covert differences result in larger confidence intervals relative to overt estimates, as their calculation requires accounting for variation in the treatment and control list. When we consider each sample in its entirety (without disaggregating them by socio-demographic characteristics), we see that respondents were more negative toward Muslim migrants than toward other migrant groups (Tables 5 and 6). In fact, the bottom left-hand portion of Table 6 reveals substantially less overt support for Muslim immigration than for Polish immigration across all socio-demographic groups. We also find that men, young people, and the highly educated openly revealed more positive attitudes toward Black immigrants than toward Muslim immigrants and that older people and the less educated overtly favored Polish immigration over Black immigration (Table 5). Overt support for Black immigration was 23 percentage points lower than overt support for Polish immigration among the highly educated (Table 5).
Differences in Overt Support, Covert Support and Social Desirability Bias by Immigrant Frame, Sex, Age, and Education.
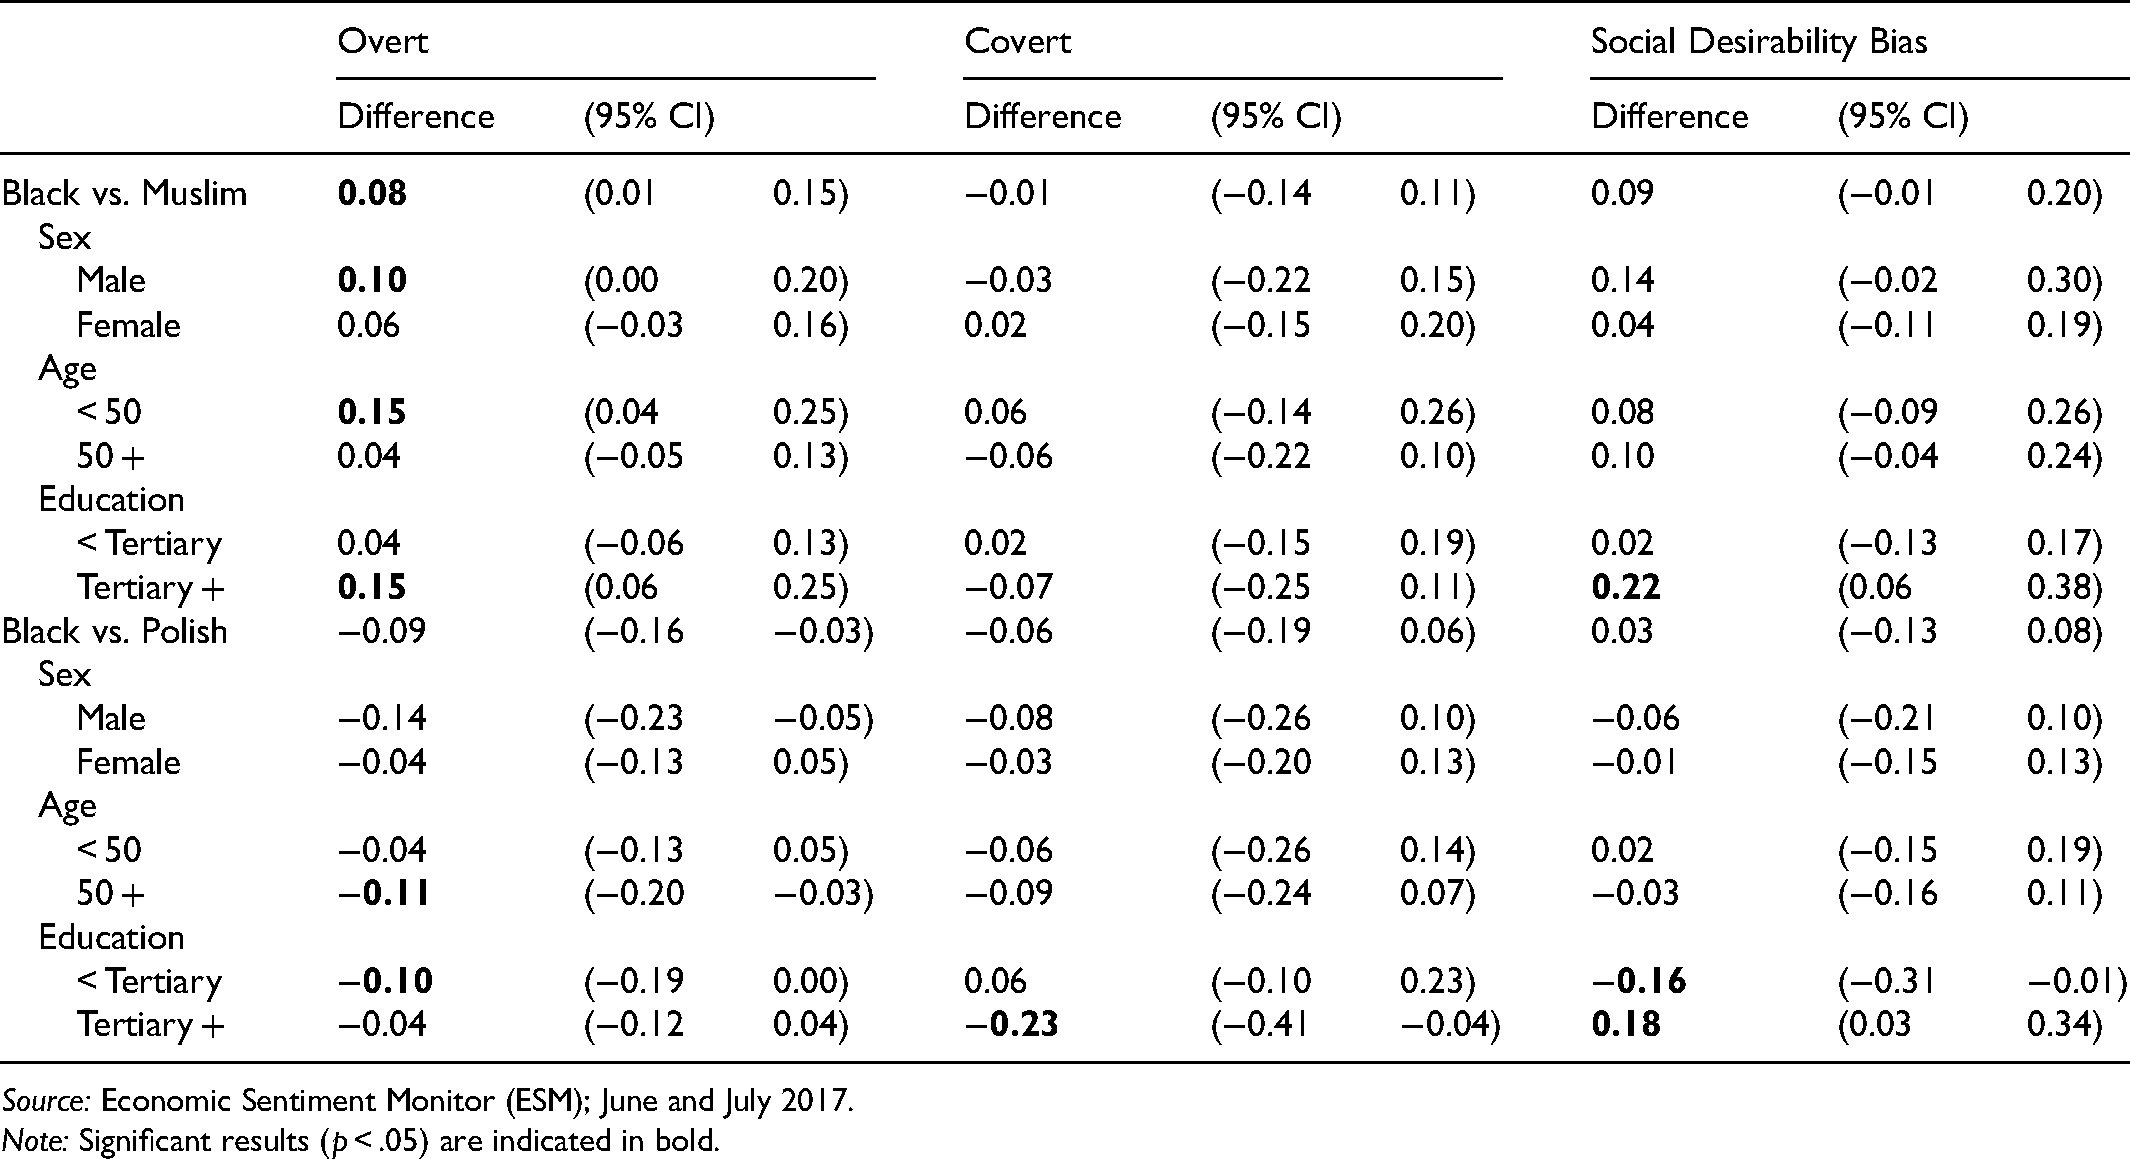
Source: Economic Sentiment Monitor (ESM); June and July 2017.
Note: Significant results (p < .05) are indicated in bold.
Differences in Overt Support, Covert Support, and Social Desirability Bias by Immigrant Frame, Sex, Age, and Education.
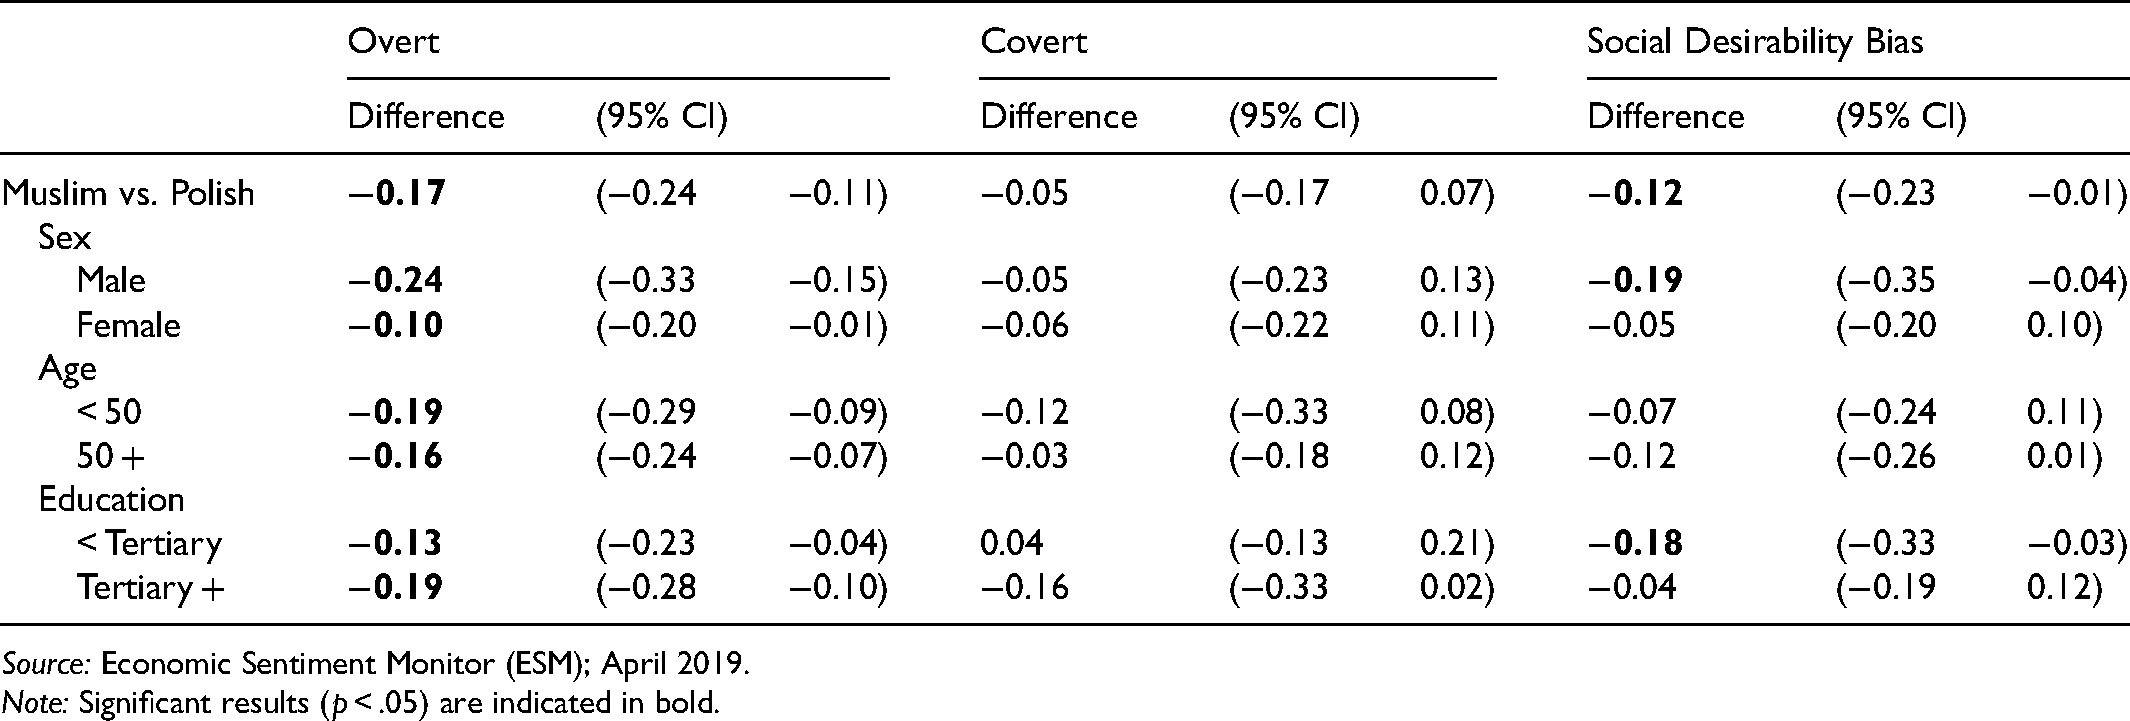
Source: Economic Sentiment Monitor (ESM); April 2019.
Note: Significant results (p < .05) are indicated in bold.
We also see that some groups were more likely to mask attitudes toward some types of immigrants than toward others. Overall, this masking is explained by a respondent's willingness to openly express antipathy toward Muslim immigrants. Social desirability bias among highly educated respondents was more common when considering race/ethnicity (i.e., Black immigrant frame) than when considering religion (i.e., Muslim immigrant frame). Similarly, men and the less educated were more likely to mask antipathy toward Polish immigrants than toward Muslim immigrants.
Regarding the comparison between attitudes toward Black and Polish immigrants, we find that more educated respondents were more likely to mask antipathy regarding the race/ethnicity frame. There is an educational gradient in social desirability bias for the Black immigrant frame, which is not found for the Polish immigrant frame (Table 5). Overall, our key finding is that social desirability bias affected the reporting of Irish people's attitudes toward Black and Polish immigrants, but not toward Muslim immigrants. Approximately one-fifth of Irish respondents held, but concealed, non-supportive attitudes toward Black and Polish immigrants, but fewer than one in 10 masked antipathy toward Muslim immigrants, which echoes findings on respondents’ willingness to express negative attitudes toward Muslims in the United States (Creighton and Jamal 2015) and the UK (Creighton and Jamal 2020).
Conclusion/Discussion
To offer an interpretative layer to the findings from our list experiment, it is useful to return to our initial research questions. We sought to ascertain if distinct frames (religion, race/ethnicity, and EU origin) elicited distinct levels of support for immigrant groups and, moreover, distinct levels of masking by respondents. The list experiment proved useful in that it offered a modest step toward comparing overtly expressed sentiment and sentiment expressed only under conditions of absolute and permanent anonymity. When coupled with a context like Ireland, which has experienced large-scale historical emigration and non-trivial recent immigration from EU and non-EU countries, the results offer several insights.
First, religion is a bright line in Ireland, at least when attitudes to immigrant groups are openly expressed. Results indicate that antipathy toward Muslim immigrants was higher than that expressed toward Polish and Black immigrants. Relative to race/ethnicity and EU origin frames, religion occupies a distinct place in terms of eliciting overt antipathy in Ireland. Moreover, we suggest that there is little evidence of pressure to moderate overt expression of targeted opposition (or reduced support) for Muslim immigrants in Ireland. One caveat, however, is worth underlining. These results do not reveal the source of the antipathy or the mechanism(s) by which social desirability pressure is relieved, as the list experiment does not offer that level of interpretation. However, we do suggest that the answer to the first research question (i.e., If immigrants to Ireland are framed by race/ethnicity, religion, or EU origin in a survey experiment, does it change the level of support expressed by the Irish population?) is yes, at least in part. More specifically, we conclude that Muslim immigrants are seen differently than other immigrant frames in Ireland. In general, however, this targeted perception of difference is relegated to overt expression of attitudes. Religion, specifically Islam, is not clearly a distinctly opposed immigrant characteristic when sentiment is covertly expressed.
Second, the Irish public does not significantly mask opposition toward Muslim immigrants. As mentioned above, this experiment is suggestive, but not definitive, as confidence intervals are notably large for covert estimates and, by extension, tests of difference in social desirability bias. That said, even with the imprecise estimates, significant social desirability pressure is found for the race/ethnicity and EU origin frames. In other words, our answer to the second research question (i.e., If immigrants to Ireland are framed by race/ethnicity, religion, or EU origin in a survey experiment, does it change the extent to which support by the Irish population is masked?) is also yes, but nuance in interpretation is required. While religion is less subject to masking, tests between groups for estimates of social desirability bias are less conclusive, with only Muslim versus Polish frames indicating significant differences.
We also conclude that education is significantly and substantively related to the experience of social desirability pressure. Better-educated respondents reported greater support for immigration, regardless of frame, but also significantly masked. This masking was not shared by less-educated respondents when considering Muslim and Black immigrants. EU origin seemed to elicit social desirability pressure, regardless of respondents’ educational background. We suggest that educational gradients in support—with greater education being associated with greater tolerance—are better understood as a pattern of overt expression. In the presence of anonymity, the better educated are more likely than the less educated to indicate reduced support, particularly if the immigrant frame is defined by race/ethnicity or religion.
Why does the masking we document matter? Openly expressed antipathy, such as racial harassment and negative media coverage, can certainly influence the health and well-being of immigrant and ethnic minority populations (Wallace, Nazroo, and Bécares 2016). Yet covert attitudes might be more likely to impact behaviors and decisions that occur in private, for example, recruitment for employment or voting. This notable difference between overtly and covertly expressed sentiment is one plausible explanation for why (openly expressed) attitudes toward ethnic minorities are not always good predictors of behavior uncovered using field experiments (Pager and Quillian 2005). Indeed, findings from this list experiment are broadly consistent with that of a field experiment in Ireland, albeit during the Celtic Tiger boom (McGinnity and Lunn 2011). The authors found high levels of recruitment discrimination toward applicants with European, Asian, and African names, compared to Irish applicants. Exploring anonymously expressed attitudes can, thus, contribute to deeper understandings of different contexts of reception faced by different immigrant groups.
Although the attributes made salient in each frame intended to capture how religion, race/ethnicity, and EU origin shaped perception of immigration, our approach has limits. The design cannot fully delineate aspects of opposition rooted in material concerns (e.g., labor-market competition) from those defined by socio-cultural distance. SIT is notably neutral on this distinction (Brown 2000; Tajfel 1970; Tajfel et al. 1971; Tajfel and Turner 1986) and focuses instead on the extent to which in-group or out-group membership matters, whether for labor-market outcomes or socio-cultural position. Perhaps, this shortcoming reflects reality, as identity itself is never defined (or definable) on a single dimension. In other words, the use of framing to increase a specific attribute's salience does not eliminate other associated characteristics. In the case of Polish immigration, the largest immigrant group in Ireland and demographically weighted toward working ages, the case for less socio-cultural distance on dimensions like race/ethnicity and religion does not eliminate or attenuate a perception by some of competition for work or wages.
We suggest that the frames analyzed in this article concretely map onto recent migration dynamics, which have been defined by notable religious/racial diversity and an influx of EU labor (e.g., Poles) (McGinnity et al. 2018). We were sensitive to the need to ask questions privileging attributes about which respondents were plausibly familiar. That said, it is notable that Poles were the only group about which sentiment was masked among the less educated, which indicates a hesitancy to express antipathy in the educational strata associated with the sector of the Irish economy to which Poles are most likely to incorporate. However, we hesitate to interpret the similarity across frames in covert sentiment to be indicative of a limited role for economic considerations.
Instead, we find the clearest articulation of our overall contribution to be our understanding of how SIT shapes the expression of anti-immigrant sentiment. Being a relative in-group member leads to the experience of less overt antipathy but does not necessarily indicate more tolerance when anonymity can be preserved. As a result, the Irish population views immigrant groups that are more socio-culturally distant and newcomers who are co-religionists, co-ethnics, and EU members more similarly than overt sentiment might suggest. In other words, anti-immigrant sentiment is layered, and surface-level tolerance must be counterbalanced with a clear understanding that masked sentiment could be substantively more negative. This commonality is something that SIT would not predict, nor would it emerge if one does not consider that opposition to immigration is frequently, significantly, and substantively masked. The key insight, then, is that in-group preferences affect what is expressed and, moreover, masked.
Footnotes
Declaration of Conflicting Interests
The author(s) declared no potential conflicts of interest with respect to the research, authorship, and/or publication of this article.
Funding
The author(s) received no financial support for the research, authorship, and/or publication of this article.