
Abstract
Advocates for refugees often publicize increased numbers of refugees, seemingly to generate greater support for pro-refugee policies. In this research note we test whether reading about a greater number of refugees results in more, less, or unchanged feelings of support for pro-refugee policies via a survey experiment from a national sample of more than 3000 U.S. adults. Accounting for uncertainty over whether the public will perceive differential magnitudes on a logarithmic or linear scale, we find that for U.S. adults as a whole, the magnitude of the number of refugees does not lead to support or opposition to policies to (a) admit more refugees or (b) fund refugee relief abroad. Republicans are much less likely to support such policies compared to Democrats, independent of the number of refugees. Surprisingly, Republicans are more likely than Democrats to respond to larger numbers with greater support for both policies. Refugee advocates should not assume that reporting increased numbers of refugees will result in more public support for funding refugees abroad or refugee admissions in the United States.
Refugee advocates routinely announce large increases in the number of refugees and other displaced people. “Worldwide levels of forced displacement hit new high,” declared a typical headline from a UN News (2024) press release that tallied 120 million people. Similarly, global displacement is at “record levels,” according to the International Organization for Migration (2024). The Internal Displacement Monitoring Center announced that “68.3 million people were living in internal displacement as a result of conflict and violence at the end of 2023, the highest figure since data became available” (IDMC 2024, 3). Claims of unprecedented displacement with accompanying statistics in the tens of millions are then reproduced by humanitarian organizations, journalists, politicians, think tanks, and scholars (Capps et al. 2015, 341; Kallick and Mathema 2016, 4; Los Angeles Times 2017; Hynie 2018, 265; Banulescu-Bogdan 2022, 4).
Such numbers are not only descriptions; they also intend to garner attention. “With global displacement at its highest level on record,” states the formal communications strategy of the UN Refugee Agency (UNHCRs 2015, 4), “there is a temptation to emphasize numbers in order to command media space.” The emphasis on the global number of refugees, or displaced people more broadly, is often the first line of reports and press releases. Humanitarian organizations advocating for resettlement and asylum routinely report the total number of displaced people in the world, including internally displaced persons (IDPs) who make up roughly two-thirds of the total and who are not typically a relevant category for refugee resettlement or asylum (e.g., Refugee Council USA 2024; Welcome Corps 2024).
Historically, Republican and Democratic elites alike have justified overseas refugee aid and resettlement in the United States by referring to large increases in displacement. Taking note of a State Department estimate that “the number of refugees worldwide has doubled during the past decade,” President George H. Bush pledged U.S. commitment in these areas in his 1991 proclamation of Refugee Day (The American Presidency Project n.d.). President Barack Obama's public statement on World Refugee Day in 2014 noted, “This year we mark a grim milestone. Over 51 million people are now refugees, asylum seekers, or IDPs, according to the United Nations High Commissioner for Refugees. That is more than at any time since World War II.” He then lauded the “generosity” of U.S. aid abroad and the U.S. resettlement program (White House 2014).
The purpose of publicizing these numbers is to generate the political will and funding to support relief and protection operations for displaced people and to promote three “durable solutions”: return to places of origin, local integration, or resettlement to a third country. The presumption is that if the problem is presented as being greater, as represented by larger numbers of displaced people, then policymakers and the public will be motivated to take more humanitarian action. However, reporting increased numbers could produce “refugee fatigue” (Ruiz 1995, 153) and less support, no effect, or more support.
Predictions Regarding Larger Refugee Numbers Influencing Policy Attitudes
Only Highly Educated and Attentive Americans Are Affected by Linear Increases
In our survey experiment with a national sample of U.S. adults, we determine if larger announced numbers of refugees on a scale of 1 million, 50 million, 100 million, and 150 million influences support for policies to help refugees. These numbers are within the magnitude of UNHCR's global report of 43 million refugees out of 123 million displaced persons in 2024 (UNHCR 2025a). The experiment's numbers are therefore a good test of our research questions.
Larger numbers may not change attitudes in either a supportive or oppositional direction because the perceived magnitude of the difference between 1 million and 150 million may be small. The commonsensical assumption is that people perceive differences in numbers to be equal in magnitude—that the perceived difference between 1 and 50 is 49, and that the difference between 51 and 100 is 49. However, robust findings in psychology suggest the same difference in numbers is perceived to be less the larger the numbers are, with the relationship between actual difference and magnitude of perception approximating a logarithmic scale. In the words of one of the leading researchers in this area, “a logarithmic representation may remain dormant in all of us for very large numbers or whenever we approximate numbers” (Dehaene et al. 2008, 1219–20). While people can think linearly with greater reflection and training, the impulse, rooted in the nature of the brain, is to perceive magnitude logarithmically (Siegler and Opfer 2003, 237; Dehaene 2009, 254; Rinaldi and Marelli 2020).
An example of this effect is an experiment on the perception of the number of deaths in wars, which found deaths were perceived on a logarithmic scale such that a war with eight times more deaths was perceived as only having twice as many deaths (Fetherstonhaugh et al. 1997, 284). For our study, the translation of 1 million, 50 million, 100 million, and 150 million on the linear scale above results in a logarithmic scale of 6, 7.7, 8, and 8.2. The log base selected does not matter for this analysis. There is not a large perceptual difference between the ends of this logarithmic scale, and thus the difference in the treatment numbers may not generate a policy attitude difference.
Since it is unclear whether people will reflect more intensively on this topic and thus use linear rather than logarithmic reasoning, we test both possibilities throughout the paper. Later in the paper we look for effects among those who are theorized by psychologists to perceive linearly—respondents with more education and those who are more attentive to the interpretive task in the survey. Our analyses of these possibilities then ask whether linear claims do work for these two subsets of the population. If so, then the strategy of advocates may well work by impacting the more influential parts of the population.
The Number of Refugees Leads to Differential Support for Policies in the Entire Population
The dominant assumption among advocates is that larger numbers lead to greater support because people will realize the magnitude of the problem and want to solve it. According to utilitarian moral perspectives, all lives have equal value, and increasing numbers of victims should yield a linear increase in the supportive response (Dickert et al. 2015, 249). However, neutral or inverse effects are also possible. There is evidence from the statements of some government officials that publicizing large numbers of displaced people might produce less support for refugees, given that the same large figures are used to justify restrictions. British Home Secretary Suella Braverman in 2023 called for asylum restrictions based on a think tank's estimate that 780 million people might qualify as refugees under the 1951 Refugee Convention (Oakes and Dubow 2023). The first sentence of the Biden administration's 2024 proclamation blocking most asylum applications on the U.S. southern border began with the justification, “There are more people around the world who are displaced from their homes today than at any point in time since World War II” (White House 2024). Clearly, large and growing numbers of refugees can be used to justify both decreases as well as increases in refugee support.
There is extensive polling about attitudes toward refugees, including whether admissions should be higher, lower, or stay the same. These findings vary by country and whether questions are asked about specific refugee groups or at times of specific crises (Sana 2020, Ipsos 2024). The public tends to overestimate the number of refugees, as they do all out-groups (Thorson and Abdelaaty 2023). A 2016 survey experiment in the United States found that an informational treatment showing the low per-capita hosting of refugees in the United States relative to Germany, France, and Canada did not affect willingness to write a letter to the president in support of refugee admissions (Adida, Lo, and Platas 2018). Yet little is known directly about public reactions to perceived changes in refugee numbers.
Experimental research in the psychology of humanitarianism shows that valuing lives is often “scope insensitive,” meaning “the tendency to be relatively unresponsive to the number of people at risk in large-scale humanitarian catastrophes” (Dickert et al. 2015, 248). Other studies have found that higher need suppresses humanitarian responses. “As the number of people in need of help increases, the degree of compassion people feel for them ironically tends to decrease” (Cameron and Payne 2011, 1). Some experimental studies in psychology have not found that altering the number of victims in humanitarian appeals changes affective responses, willingness to donate or volunteer, or support for ameliorating policies (Hart, Lane, and Chinn 2018). However, there is enough research to suggest at least theoretically that reports of more refugees may be associated with refugee fatigue or neutral attitudes that empirical investigation is warranted. There are several possible mechanisms for scope insensitivity or suppressed humanitarianism that are not mutually exclusive—the identifiable victim effect (IVE), psychic numbing, proportional reasoning, and pseudo-inefficacy.
In the IVE, people tend to display more empathy and are willing to take greater action toward an identifiable victim than a statistic about the number of victims (Small, Loewenstein, and Slovic 2007). Identifiable victims often have more vivid stories that evoke emotion. They can benefit from the humanization of a visual referent, and their experience often unfolds in real time rather than in the abstract world of quantification (Jenni and Loewenstein 1997, 237). The strength of the IVE has become the received wisdom in many policy campaigns, including around refugee support, that use photographs of a single person and prominent testimonials to humanize the issue. Indeed, Adida et al.'s (2018) survey experiment that found that prompting survey respondents to take the perspective of a refugee, which increased their willingness to write a letter to the president supporting refugee resettlement, may create an identifiable victim—the self—in the mind of a respondent.
Even when all victims are identified, eight victims elicit less compassion than one (Kogut and Ritov 2005). One experimental study even found less compassion for two named victims than one (Slovic 2007). The IVE only applies to a single victim. The effect is small but significant. Experiments suggest that on average, an identifiable victim receives approximately 0.10 of a standard deviation greater support than unidentified or statistical victims (Lee and Feeley 2016, 210).
A second mechanism is that statistics themselves may introduce “psychic numbing” in which humans become indifferent to the suffering of others as the scale of suffering increases. Compassion fatigue takes place when caregivers burn out from the toll of caring for others, but psychic numbing does not require direct experience with victims (Slovic 2007). An experiment demonstrating psychic numbing asked participants to make a small donation to Save the Children under one of three conditions: a single identifiable victim, statistical victims in the millions, and a single identifiable victim coupled with statistical information about the prevalence of her condition. Not only did the single identifiable victim receive more contributions than the statistical victims; the addition of statistics reduced contributions to the identifiable victim. A suggested reason for this finding lies in dual process theories of thinking, in which statistical information is processed with slow, analytical thinking, rather than the faster, more affective thinking around individual cases (Small, Loewenstein, and Slovic 2007; Hart, Lane, and Chinn 2018, 2). A study of Swedish students similarly found that adding statistics to a plea for helping Syrian refugees reduced aid compared to an appeal based on a single identified individual (Erlandsson et al. 2016). Humanitarian responses to victims across social divides are driven more by affective processes, such as empathy and feelings of moral worth, than rational utilitarian processes (Bayram and Holmes, 2020).
A third mechanism explaining why greater numbers of refugees might depress public willingness to help is that people prefer to solve problems of a smaller magnitude due to their proportional reasoning. A psychology experiment with university students found that people were less willing to send aid to refugee camps that would save the same number of lives (1500) when the treatment increased the size of the population at risk of death (Fetherstonhaugh et al. 1997). Proportions are easier to intuitively understand than large absolute numbers (Dickert et al. 2015, 250). Proportional reasoning may also drive the IVE. Identifiable victims are part of smaller reference groups, as small as one, in the case of a single victim, and are thus preferred over statistical members of larger groups (Jenni and Loewenstein 1997, 253).
Pseudo-inefficacy is a fourth mechanism explaining scope insensitivity or suppressed humanitarianism. Even if people perceive they can help some victims, information about other victims who are not being helped can create a sense that action is fruitless, thus depressing compassionate action (Dickert et al. 2015, 251). Experimental studies conclude “positive feelings about the child one can help are dampened by negative feelings associated with children who cannot be helped” (Västfjäll, Slovic, and Mayorga 2015).
Finally, there are dynamics particular to public opinion about refugees that could explain why larger reported numbers may not have any net effect, or a negative effect, on attitudes toward policy. Large segments of the public view refugees as a cultural and/or security threat. Many believe their country does not have the resources to help refugees. There is widespread suspicion that people claiming to be refugees are in fact economic migrants, so reports of larger numbers of refugees may be discounted. There is ample evidence for these dynamics in public opinion survey research carried out in the United States and around the world (Sana 2020, Banulescu-Bogdan 2022, Thorson and Abdelaaty 2023, Ipsos 2024).
Distinguishing among the possible reasons for how numbers of reported refugees affect policy attitudes, and the extent to which they lie in the architecture of the brain's perception or cultural mechanisms particular to the politics of refugee policy, are beyond the scope of this paper. Rather, we simply examine the direction of the effect, if any, of reports of increased numbers of refugees.
Larger Number of Refugees Only Increases Support among Democrats
Independent of the general mechanisms described above, it is also possible that Democrats and Republicans respond differently to the magnitude of refugee numbers. A 2019 survey found that majorities of Democrats (85%) and Republicans (58%) support admitting refugees. However, Democrats are three times more likely than Republicans to say such admissions are “very important” (Daniller 2019). Other studies have also found that Democrats are more supportive of refugee resettlement than Republicans (Ferwerda, Flynn, and Horiuchi 2017, 2), and Democrats are much more supportive than Republicans of refugees from Syria and asylum seekers from Central America (Wasem 2020, 259). It is possible that Democrats will be more likely to support refugees if they perceive large numbers because they are already more inclined to help refugees.
The inverse may also be true. It is possible that whichever partisan group is more compassionate would be the one negatively impacted by increased numbers. Research has shown that Democrats are more likely than Republicans to value compassion, even if stereotypes about this difference are greater than the partisan distribution of self-reported traits (Scheffer et al. 2022). Republicans may react to increased numbers with more compassionate policies if, (a) they are more compassionate than Democrats, or (b) the Democrats, while compassionate, are more prone to psychic numbing. Therefore, even in the context of much greater support for refugees in general from Democrats, increases in refugees may generate a relatively more compassionate response from Republicans.
Methods
The studies referenced above are suggestive but do not show how a treatment of varying large numbers affect responses. Moreover, some research is conducted on very restricted and unrepresentative samples, such as university students, and is not specifically about refugees. In this paper we report the results of a survey experiment on a sample of U.S. adults to see if reading about larger numbers of refugees changes respondents’ willingness to support refugees by 1) admitting more refugees to the United States and 2) government spending to support refugees who remain outside the United States.
Survey
We fielded a survey in 2024 designed to be roughly representative of the U.S. public. The survey was deemed by the IRB at the authors’ university to be exempt from oversight. The first draft of the survey was cognitively tested on ten respondents (Collins 2014). We then conducted three pretests in sequence that are not analyzed in this paper.
We used the online survey sample provider Lucid Theorem for the pretests and the final sample. Lucid has been extensively used by political scientists who conduct ongoing studies to ensure it remains a viable source (Coppock and McClellan 2019; Hill and Huber 2019). Lucid provided the respondents, and we created the survey instrument in Qualtrics.
Lucid is an opt-in poll, and research in the past decade has shown “few or no significant differences between traditional modes [of survey administration] and opt-in online survey approaches” (Ansolabehere and Schaffner 2017, 89). Lucid sets quotas for age, gender, race/ethnicity, and region to reflect U.S. Census figures. We obtained a national sample of 3288 U.S. adults between June 4 and July 10, 2024.
Before online surveys, it was difficult to say what percentage of the people taking a phone survey or a mailed paper and pencil survey were paying attention to the questions. In recent years, social scientists have developed techniques to identify and exclude the inattentive. The main method is “attention check” questions that have an obvious answer if the respondent is attentive to the instructions (Berinsky, Margolis, and Sances 2014; Berinsky et al. 2021).
A few questions into the survey, we asked the “what happens in government” attention check question, and later in the survey a slightly modified version of the “what is your favorite color” question, both developed by Berinsky and colleagues (2016). Upon failing the attention check, respondents are electronically sent out of the survey. Twenty-four percent failed the first attention check and were sent out of the survey, which is a fairly standard rate (Peyton, Huber, and Coppock 2021; Evans 2024, 164). In the second attention check, another 8.4% failed. Therefore, and more precisely, this is a survey of the more attentive people in the United States, which is an acceptable bias given our concern with public policy, as we assume the more attentive are more likely to influence policy.
Another method of ensuring that only attentive respondents are analyzed is to remove people who answer the survey so quickly that they could not have been paying adequate attention. While there is no set standard for “too fast,” scholars tend to set a floor based on how fast they themselves could answer the survey. The mean finishing time was 1556 seconds, and the median was 645—just over ten minutes. We removed an additional 0.7% of the remaining sample who finished in less than three minutes.
There is increasing concern that surveys are taken by bots. One way to search for bots is to compare the age of each respondent according to Lucid with the age the respondent reported in our survey. Assuming these figures could legitimately diverge by as much as five years because of when the respondent entered the panel, another 2.8% of respondents with more than a five-year discrepancy were excluded as being of unknown provenance. Qualtrics also has a bot detection algorithm that produces a score between 0 and 1 for each respondent. A score of less than 0.5 means the respondent was likely a bot. Only 0.7% scored below 0.5, and these few cases were also excluded. 3065 cases remained.
Within the survey we asked an experimental-design vignette survey question: “Now we have some questions on a different topic. Imagine reading from a trusted source that there are [number] million people around the world who have fled their homes because of violence and war.” Where we write [number] above, 25% of the respondents were randomly assigned to see the number as 1, and 25% each were assigned to see 50, 100, and 150 respectively. As is standard methodological practice, we created a manipulation check to ensure that the respondents noticed the key part of the narrative that was randomly assigned (Mutz 2011).
We used a “factual” manipulation check where the answer does not require any interpretation by the respondent (Kane and Barabas 2019, 248). Our manipulation check followed the two dependent variable questions described further below and asked, “We are interested in which parts of survey questions are noticed. In the previous question, how many people had fled their homes?” The four choices were 1 million, 50 million, 100 million, and 150 million. The respondent successfully received the stimulus if their choice matches what they saw in the vignette. Manipulation checks are traditionally used as a threshold condition for the legitimacy of the vignette question. That is, if a statistically significant portion of the respondents do not get the manipulation check correct, then the experiment is invalid (Mutz 2011, 85).
Our standard was to evaluate if respondents internalized the number exactly, so we created a dichotomous variable where the correct answer receives a 1 and any incorrect answer gets a zero. Fifty-nine percent of respondents were correct. A one-sample t-test evaluated whether this variable is larger than 50%, where 0.5 represents an equal chance of getting it right or wrong. This produces a t-value of 10.3, which is highly significant, thus indicating that the manipulation was successful. Methodologists generally recommend keeping those who fail the manipulation check in the sample (Aronow, Baron, and Pinson 2019), so we follow that practice for the first analyses but relax that recommendation for some later analyses.
After the vignette we asked two follow-up questions that asked for 0–100 slider responses, which will serve as the dependent variables in our analysis. The first was “Please slide the marker on the response bar to indicate your answer. Compared to now, how much should the U.S. government spend on programs in other countries to help these people?” with 0 having the label of “less” and 100 the label “more.” We then asked, “We have another question about the people fleeing their homes. Compared to now, how many of these people should the government allow into the U.S.?” This question also had a 0–100 slider with 0 having the label of “less” and 100 the label “more.”
We selected these as measures of support for refugee policy because admissions of refugees (via resettlement or asylum) and financing services for refugees abroad are the two principal ways the U.S. government helps refugees. It is important to distinguish between admissions and funding abroad because there is often political support for helping refugees as objects of distant charity through international aid but not to accept them as new neighbors (IPSOS 2024). Funding refugee programs abroad can be a strategy of both caring for refugees and controlling them by keeping them at a distance (FitzGerald 2019). Similarly, a survey experiment on how information about climate migration was perceived by U.S. Democrats and Republicans found that reading coverage of the issue increased support for measures to help potential migrants adapt and stay home but did not affect support for admission (Raimi et al. 2024).
Note that the respondent does not know the current level of spending or refugee admissions, so these responses should not be thought of as rational policy calculations. Most members of the public do not pay close attention to policy details. The survey responses are better interpreted as reflecting feelings toward refugee spending and admissions, not a mathematical calculation. Like most public opinion researchers, we seek to measure “issue-specific ‘moods’” rather than deeply informed and cogitated policy positions (Berinsky 2017, 323).
The random assignment of the refugee number in the vignette to a respondent creates two useful analytic properties. First, the respondent cannot determine the underlying hypothesis of the investigators because the respondent does not know that other respondents are being shown a different number. If we had created separate questions about, for example, 1 million refugees, and another about 100 million refugees and so on, respondents might determine the purpose of the questions and give what they perceive to be the socially acceptable response.
The second analytic property is that the randomly assigned variable (the number of refugees) is not correlated with any properties of the respondent because of the random assignment, and thus only simple statistics are necessary. For example, there is no need to control for other attributes of a respondent with a regression model to avoid spurious effects. This is the same as a clinical trial in medicine, where there is no need to control for participants’ education, race, and so on because the participants were randomly assigned to the treatment and control groups (Mutz 2011).
Respondents in the pool had earlier given the online survey sample provider their political party identification, which we coded into a party identification score with strong Democrat receiving the score of 1, not very strong Democrat a 2, Independent Democrat and Other—leaning Democrat a 3, Independent—neither and Other—neither a 4, Independent Republican and Other—leaning Republican a 5, not very strong Republican a 6, and strong Republican a 7.
There are two groups that scholars of numeric perception find to be more likely to perceive numbers linearly. The first is the more highly educated. Respondents also provided the sample provider with their education level, which was coded on a scale of: 1 (some high school or less), 2 (high school graduate and other post high school vocational training), 3 (completed some college no degree), 4 (associate's degree), 5 (bachelor's degree), and 6 (post-bachelor's degrees). To examine whether the more attentive are influenced by the number of refugees, we will compare those who did and did not pass the manipulation check described above.
Results
General Population Results
To examine the relationship between the number of refugees and feelings about policy, we produced correlation coefficients (n = 2884) between the number shown in the vignette (1, 50, 100, or 150 million), coded in linear form, and the respondent's selection on the 0–100 sliding scale of allowing fewer (value = 0) and more (value = 100) refugees into the United States. The correlation for the linear scale is −.003 (p = .895). The correlation coefficient for the question of spending more on refugees (n = 2958) is .015 (p = .512). Neither is statistically significantly different from zero. There is no relationship between the linearly expressed number of refugees and support for either policy.
What about the smaller differences in perceived magnitude from people's intuitive logarithmic perception? We conducted a correlation between the logarithm of the number of refugees in the vignette (6, 7.7, 8, and 8.2) and each of the dependent variables. Refugee admissions had a correlation of .006 (p = .814) and spending on refugees abroad had a correlation of .033 (p = .150). For both the linear and logarithmically perceived number of refugees, there is no relationship between the number of refugees and support for prorefugee policies.
Our analyses posit a linear statistical relationship between the number of refugees and the response (not to be confused with a linear perception of numbers). We tested whether there is a non-linear relationship between numbers and response, and there is not. 1
Partisan Differences in Response to Increased Numbers of Refugees
Democrats are much more supportive of refugee admissions and funding than are Republicans. In the 100-point thermometer, the mean response on admissions is 55.7 for strong Democrats and 26.0 for strong Republicans. For more spending on refugees abroad, the responses are 61.1 and 43.1, respectively. However, the question in this paper is not about existing orientations to refugee policies, but whether reading of a larger number of refugees will shift average attitudes. That is, are Democrats or Republicans more influenced by news of larger refugee numbers?
We created a linear regression model where refugee admissions is the dependent variable and the independent variables include the number of refugees, party identification, and an interaction term between the number of refugees and party identification. The analysis shows a weak interaction effect (p = .044), but in a surprising direction. The more Republican and less Democratic the respondent is, increasing numbers of refugees results in the respondent thinking that more refugees should be admitted (see Table 1, Column 1).
OLS Coefficients for Opinion on Refugee Policy, Overall and Simple Slopes.
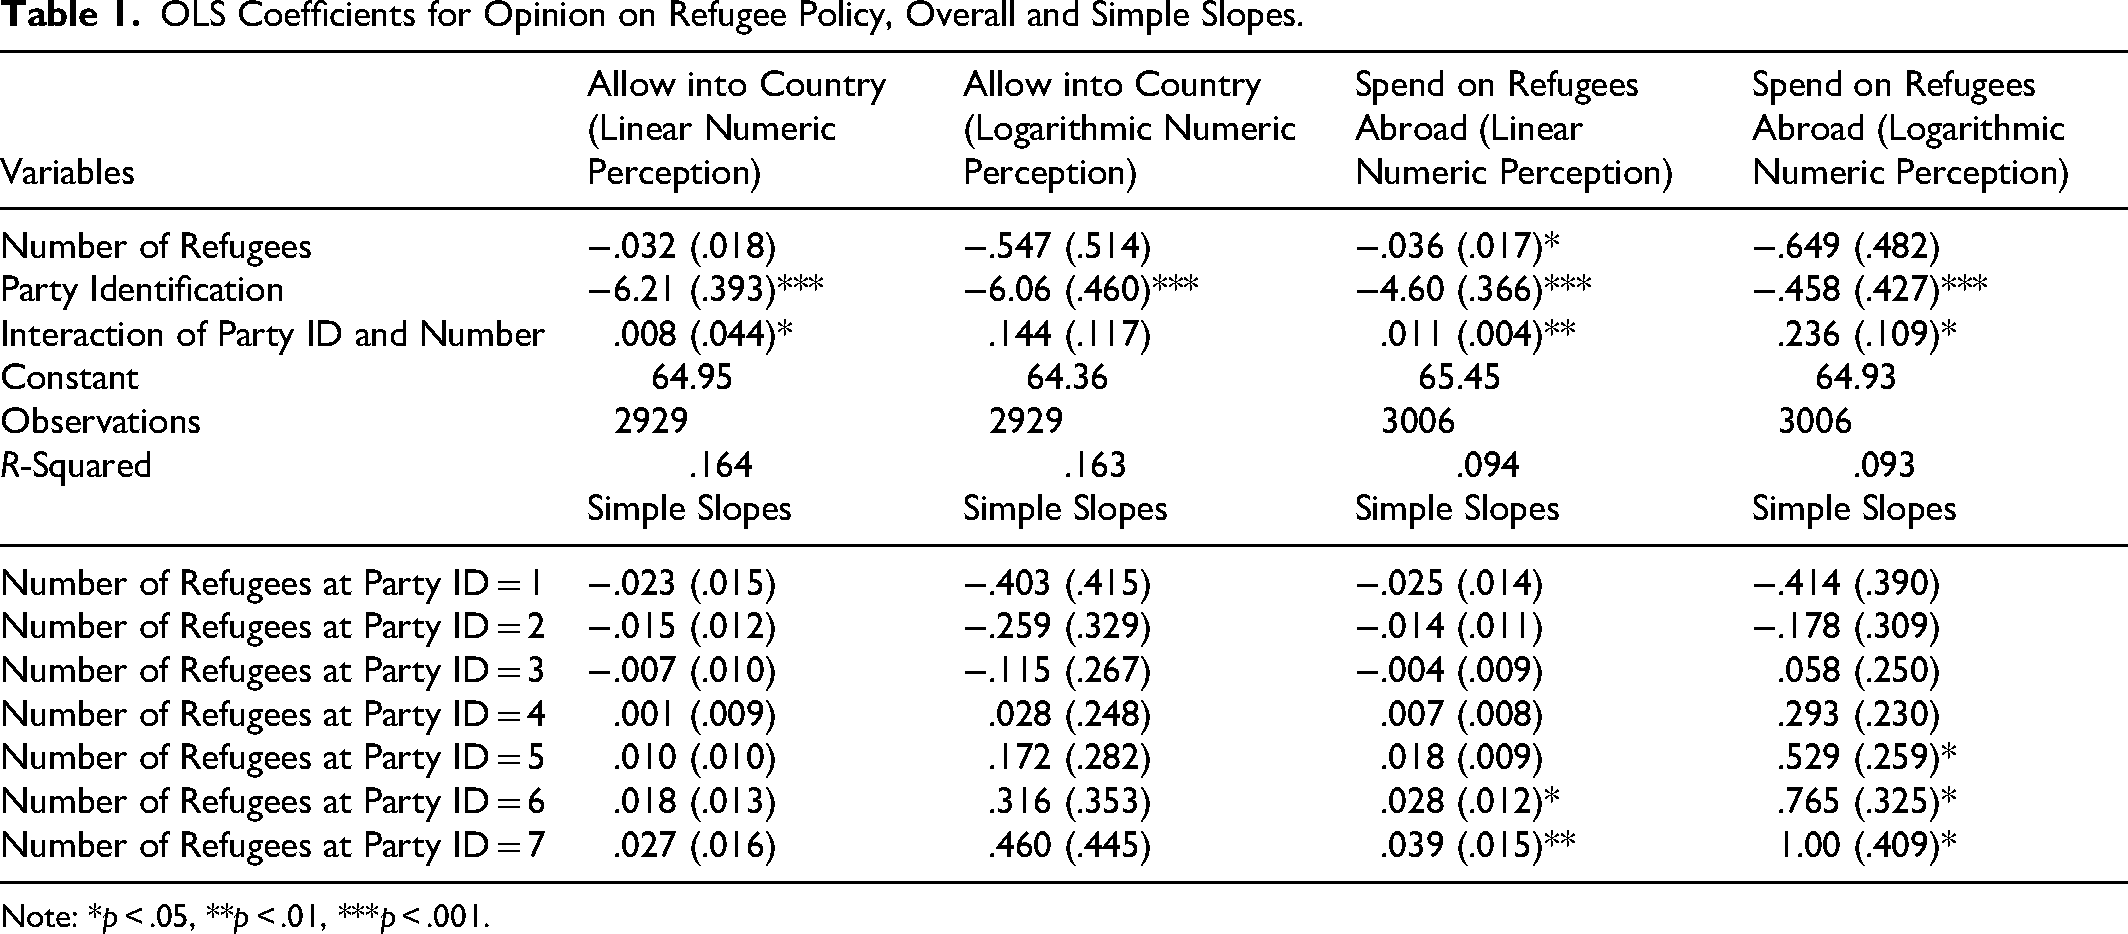
Note: *p < .05, **p < .01, ***p < .001.
We conducted a simple slopes analysis in Stata by examining the slope between the number of refugees and attitude toward policy at each level of party identification using average marginal effects. In the lower part of each column in Table 1, we see the coefficients for the slope for the number of refugees on the dependent variable for each step of the party identification scale. This shows the overall interaction effect is the result of a combination of Democrats being slightly less likely to want to admit more refugees when facing increasing numbers, with independents having essentially no effect, but Republicans having a similarly small-sized and inverse effect as the Democrats.
We conducted an analogous analysis using the log of the refugee number (Table 1, Column 2), which shows the interaction effect in the same direction but not significant (p = .219). The simple slopes analysis for the logarithmic analysis shows the same pattern as the linear number analysis.
We see the same patterns for the question about spending on refugees, but both the linearly (Column 3) and logarithmically expressed numbers (Column 4) are significant. Given the baseline differences between the parties on support for refugee policies, Republicans become slightly more generous in the face of a larger global refugee crisis relative to Democrats. We lack the data to examine the source of this difference, but we can speculate. Democrats on average are more likely than Republicans to say they value compassion (Scheffer et al. 2022). We speculate that Democrats may tend to be more compassionate and are consequently more subject to psychic numbing in the face of a larger problem.
Respondents Who May Perceive Numbers Linearly
Again, the common assumption is that people will see increases in numbers as linear, and thus 150 million is three times worse than 50 million, thus motivating a more compassionate response. As described above, we found that in the population as a whole, and if people are perceiving numbers linearly, the increase does not motivate a response. Neither does the logarithmically perceived increase generate such a response.
Perhaps there is a sub-set of Americans who are more attentive to statistics they read. Perhaps more attentive respondents will be more affected by reports of more refugees.
We cannot distinguish respondents who perceive numbers linearly, but we can separately analyze the types of respondents that the numeric perception literature suggests are more likely to think linearly. This research suggests that people can think linearly with greater reflection and with the training associated with formal education (Siegler and Opfer 2003, 237; Dehaene 2009, 254; Rinaldi and Marelli 2020). We can then examine whether the more educated and respondents who are more attentive in the survey are motivated by larger numbers of refugees.
To compare by levels of attention, we use the manipulation check question described above. In previous analyses, consistent with practices in experimental surveys, we examined all of the respondents regardless of whether they passed the check. To see if the attentive (who passed the manipulation check) are those who respond to higher numbers, presumably because they engage in linear numeric perception, we ran correlations as above with the 59% who were exactly right about the number we presented to them to look for a relationship between refugee numbers and policy. We repeated this with the 41% who selected the incorrect answer.
In the analyses of both the attentive and the inattentive there is no relationship between numeric magnitude and either policy outcome. The correlation for the linear perceived numbers are .004 and −.002, respectively, and for the logarithmic number perception −.025 and .004. We created interaction regression models analogous to the partisanship analyses above, with an interaction effect of the correct manipulation check answer × the number of refugees (see Table 2, Columns 1–4). In this more formal test, the interaction effect is not significant either, showing more formally that attentiveness does not lead to being moved by larger refugee numbers.
OLS Coefficients for Opinion on Refugee Policy, Education and Attentiveness.
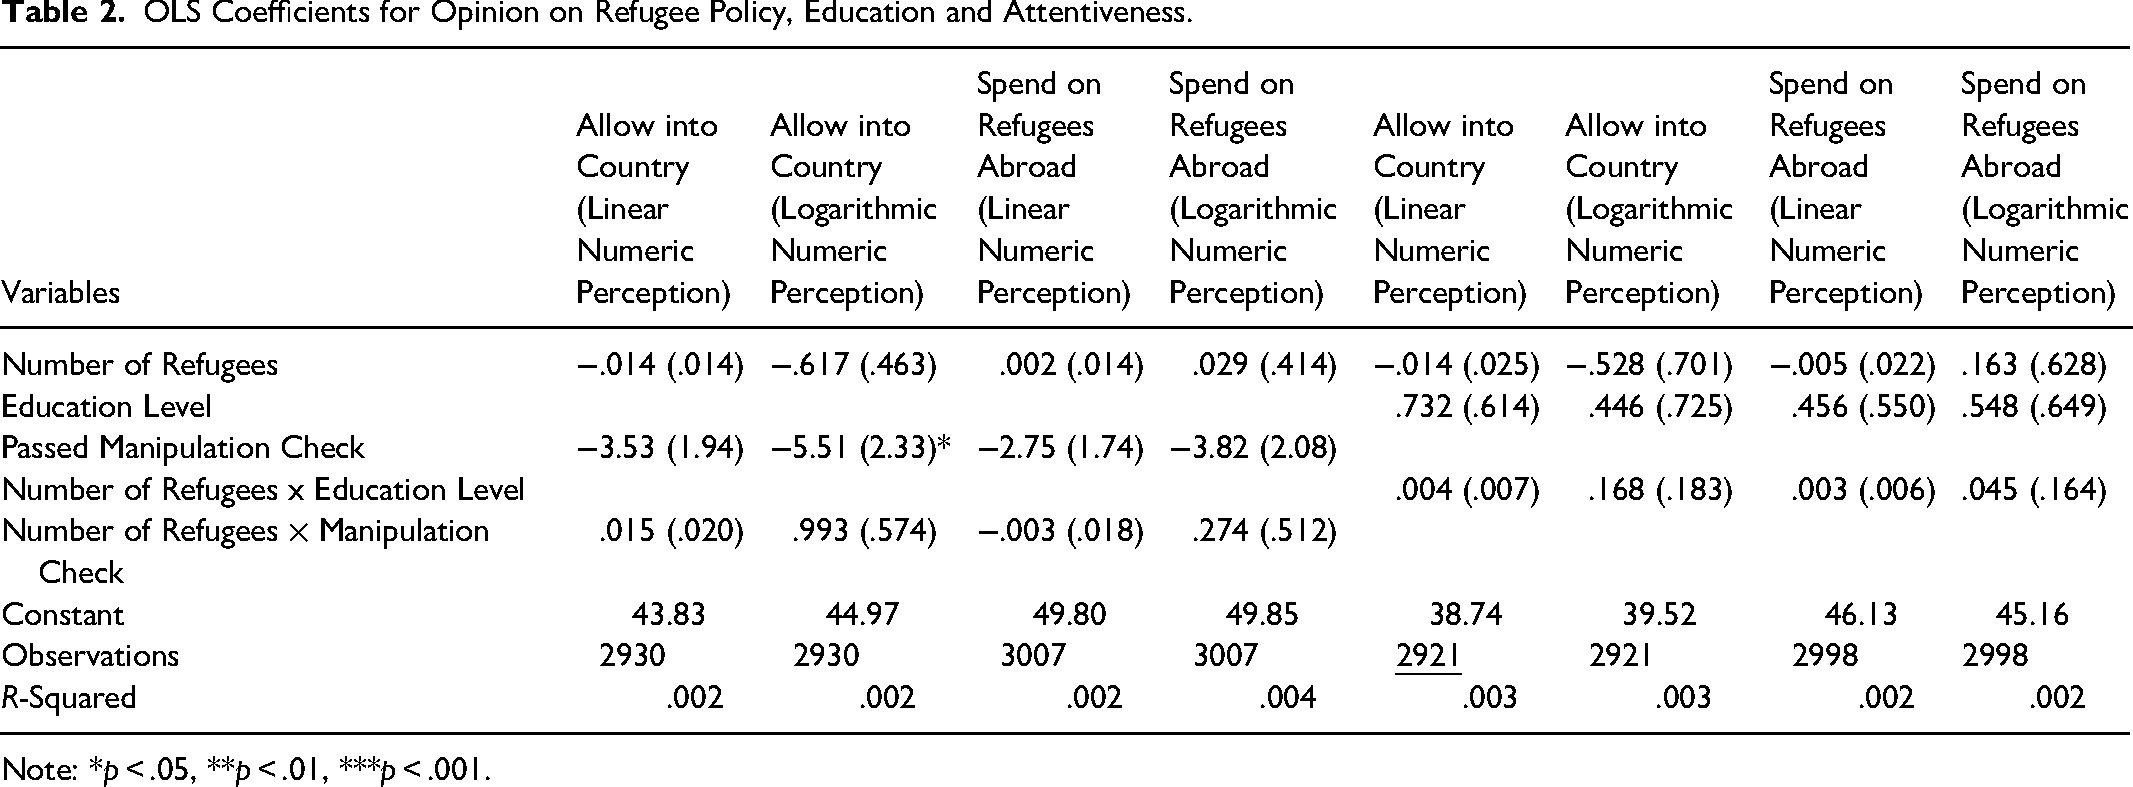
Note: *p < .05, **p < .01, ***p < .001.
Education trains people to ignore their logarithmic instincts and use linear perception. To exemplify the comparison, we ran correlations analogous to those above for respondents with a bachelor's degree or more, and another set of correlations for those with those who have a high school degree or less. For the more educated group, the correlation between the linear number and expenditures on refugees abroad is .03, and on the admissions measure it is .01. The logarithmic measure's coefficients are .03 and .03. None of these are statistically significant. For the less educated group, the coefficients for the linear measure are −.02 and −.03 (and the logarithmic .00 and −.03). Again, none of these are statistically significant.
A more formal comparison using regression with interaction terms, analogous to the analyses for partisan identification and the manipulation check analysis, uses all the respondents and a continuous measure of educational attainment. This also shows no significant difference by levels of education (see Table 2, Columns 6–9). Those who are thought to perceive large numbers linearly are not moved by increased numbers of refugees.
Conclusion
We see no relationship in the overall adult U.S. population between the described magnitude of the refugee crisis and willingness of respondents to help refugees either through admission or funding abroad. One explanation could be that the increase in numbers is not perceived to be large due to the default logarithmic numeric perception of the public. However, even those thought to be more likely to have linear numeric perception do not show an effect.
Perhaps much larger numbers would generate a difference in overall support. For example, if we had tested 1 million, 1 billion, and 5 billion we might have seen a difference, but 5 billion is over half the global population, and we wanted our test to fit more closely with realistic policy prescriptions.
Even though Republicans are less likely than Democrats to support either refugee admissions or funding for refugees abroad, an increase in the described magnitude of the global refugee crisis produces a more supportive policy response the more Republican the respondent. We lack the data to explain this finding and can only speculate that Democrats, who tend to value compassion more in their self-reporting in other surveys, are more prone to psychic numbing. This effect provides a very small increase in support for policy compared to the very large mean difference between Democrats and Republicans.
What is to be done? We are not suggesting that refugee advocates should depress their reporting of the size of the global refugee population, and our analyses suggest that such reports will not produce a public backlash against supportive policies. They should report the most credible estimates they can with available methodologies.
Statistics are used operationally by agencies that provide relief and protection, but they are also used in the aggregate to provide accountability to donors and raise funds (Crisp 1999). In 2025, the two largest sources of UNHCR funding were governments (80%) and voluntary contributions by private individuals and organizations (15%) (UNHCR 2025b). Governments, philanthropies, and individuals are unlikely to fund activities if they do not have a sense of the scope of the problem or the number of beneficiaries. For researchers, credible refugee statistics are necessary to answer many basic questions. What are the major drivers of displacement? How important are levels of persecution and conflict compared with economic variables, family relationships, geographic distance, and legacies of labor migration and colonial ties (Schmeidl and Jenkins 2003; Davenport, Moore, and Poe 2003)? Answering these questions requires a times series of stocks and flows of refugees that are the dependent variables. Refugee flows and stocks are also independent variables in studies of their impacts on outcomes in host countries (Myers et al. 2024). Clearly, publishing statistics on refugees in fine-grained detail as well as in the aggregate serves many useful functions. However, no one should be under the illusion that reporting higher numbers is going to result in greater public support for admissions or funding abroad, at least in the United States.
Toward that end, care should be taken to avoid conflating refugees with other types of displaced persons, such as IDPs and people displaced due to disasters, environment, and climate change. Even if the original reports separate refugees, following the statutory definition in the 1951 Convention, from other types of displaced people, these figures are often conflated by other authors in ways that likely mislead readers. For example, academic and policy reports about refugee resettlement in the United States routinely begin by citing the UNHCR figure for total displacement, including IDPs and other categories that are not relevant to refugee resettlement (e.g., Kallick and Mathema 2016, 4; New American Economy 2017, 1; Tran and Lara-García 2020, 117; Refugee Council USA 2024; Welcome Corps 2024).
Future research could test the strength of several basic psychological mechanisms to explain reactions to changing numbers. Whether proportional reasoning explains attitudinal outcomes could be tested by experimentally varying the unit of analysis to the percent of a particular group or country that has been displaced, or the unit of analysis of the place of potential refuge (the world vs a local neighborhood, for example) (see Erlandsson et al. 2016, 128). The mechanism of pseudo-inefficacy could be tested with a treatment that emphasizes how many refugees are left unprotected compared to those who are protected by a particular policy. Further research should also conduct similar experiments in other countries with different levels of refugee resettlement, asylum, and donations to relief abroad. Within the U.S. context, the extreme politicization of refugee policy only emerged during the mid-2010s and intensified during the two Trump presidencies. A restudy if the refugee issue becomes less politically salient may yield different results.
Footnotes
Acknowledgement
The authors thank Allan Colbern, David Barner, and three anonymous IMR reviewers for their suggestions on earlier drafts.
Funding
The authors received no financial support for the research, authorship, and/or publication of this article.
Declaration of Conflicting Interests
The authors declared no potential conflicts of interest with respect to the research, authorship, and/or publication of this article.