
Abstract
The indirect assessment of adverse effects on fertility in cynomolgus monkeys requires that tissue sections of the testis be microscopically evaluated with awareness of the stage of spermatogenesis that a particular cross-section of a seminiferous tubule is in. This difficult and subjective task could very much benefit from automation. Using digital whole slide images (WSIs) from tissue sections of testis, we have developed a deep learning model that can annotate the stage of each tubule with high sensitivity, precision, and accuracy. The model was validated on six WSI using a six-stage spermatogenic classification system. Whole slide images contained an average number of 4938 seminiferous tubule cross-sections. On average, 78% of these tubules were staged with 29% in stage I-IV, 12% in stage V-VI, 4% in stage VII, 19% in stage VIII-IX, 18% in stage X-XI, and 17% in stage XII. The deep learning model supports pathologists in conducting a stage-aware evaluation of the testis. It also allows derivation of a stage-frequency map. The diagnostic value of this stage-frequency map is still unclear, as further data on its variability and relevance need to be generated for testes with spermatogenic disturbances.
Keywords
Introduction
Cynomolgus monkeys (Macaca fascicularis) are frequently used to evaluate the safety of novel pharmaceuticals, before such products are evaluated in clinical studies. One particular concern addressed in such nonclinical safety evaluations is male fertility. Fertility in cynomolgus monkeys can only be indirectly examined, with the most critical endpoint being the microscopic evaluation of the testis. Guidelines and scientific publications recommend that the microscopic evaluation of the testis be performed with awareness of the stage that each individual seminiferous tubule cross-section is in.2,4 Stage in this context refers to a specific association of various germ cell types at a specific time point of spermatogenesis. Spermatogenesis is a complex continuum of cellular differentiation. Microscopically, twelve distinct stages of the seminiferous epithelium can be differentiated in cross-sectioned periodic acid-Schiff (PAS)-stained testis tubules from cynomolgus monkeys. 6 Distinguishing between these twelve stages is difficult and requires significant training and experience. Moreover, cross-sections of individual seminiferous tubules from cynomolgus macaques may contain one or more spermatogenic stages with intermingling of germ cells at the borders of adjacent stages, resulting in a subjective determination of stage frequency.5,15
A typical cross-section from a testis of a sexually mature cynomolgus monkey contains more than 4000 cross-sections of seminiferous tubules (unpublished data; see Table 4). It is not practical for a pathologist to evaluate more than 10% of those; hence, any manual evaluation is associated with a great dimension of uncertainty. This is where the merit of digital pathology and automation lies. Deep learning approaches have previously been taken to develop automated methods for spermatogenic staging in mice, rats, and dogs. These models have proven to allow a faster yet reliable stage-aware evaluation of the testis.7,12,16
Our objective was to develop an automated method for spermatogenic staging in cynomolgus monkeys. The method was supposed to show high (above 90%) precision and sensitivity and should allow generation of a stage-frequency map. We approached this task using three U-Net-based deep learning models and a decision tree classifier. The model was trained by comparing the staging results of the deep learning model with the staging results of two in-house experts. After training, we validated the model on a further subset of images. We created stage-frequency maps for the model-generated staging data and for the expert-generated staging data and compared those with published stage-frequency data. 6
Materials and Methods
Animal Source
The testes used in the development of the deep learning model came from healthy cynomolgus monkeys with proven sexual maturity. 9 We provide origin and age of each animal in the Supplemental Data. The animals were used in studies where they were assigned to the control group, meaning they were treated with pharmaceutical excipients but not pharmacologically active substances. All animal experiments had been performed in reference to Directive 2001/83/EC of the European Parliament and of the Council on the Community code relating to medicinal products for human use and had the objective to determine the toxicity and toxicokinetics of a novel, previously unexplored pharmaceutical for human use. All experiments were conducted in an AAALAC-accredited facility in compliance with Directive 2010/63/EU of the European Parliament and of the Council on the protection of animals used for scientific purposes and were approved by respective authorities and an Institutional Animal Care and Use Committee.
Processing of Testes Tissue
Testes were fixed in modified Davidson’s fluid for 24 to 72 hours before being transferred to 10% neutral buffered formalin for storage. Testes were trimmed, processed, and embedded in paraffin blocks, sectioned at three to five microns, mounted on glass microscope slides, and stained with hematoxylin and eosin (H&E) or PAS using standard procedures.
Generation of Whole Slide Images
Whole slide images (WSIs) of testis sections were generated using a Leica Aperio AT2 scanner at 40× original magnification. In total, we used 22 WSI of individual testes from 13 animals for development and validation of the deep learning model (Supplemental Data). Ten WSI originated from tissue sections stained with PAS and 12 WSI originated from tissue sections stained with H&E.
Common microscopic findings in the cynomolgus monkey testis would be increased stromal collagen, tubule degeneration, tubular dilatation, germ cell exfoliation, hypospermatogenesis, and inflammatory cell infiltrate. 3 For algorithm development, WSIs were only generated from tissue sections for which a pathologist had confirmed that no morphological observations were present. For validation, minimal multifocal tubule degeneration was recorded for 2 out of 6 WSI (Supplemental Data).
Deep Learning Model Configuration
Digital images (WSI) were read using the software libraries from Open-Slide software, which is a vendor-neutral software for digital pathology. Three U-Net-based deep learning models (Figure 1) were used to develop an automated spermatogenic staging based on an automated spermatogenic staging approach in rodents.5,11 The first model (3 class model) was trained to segment out each tubule and lumen, extracting 512 × 512 three-dimension tiles at 10× and 40× resolutions. A second model (six-class model) segments out five specific germ cell populations, ie, Spermatogonia (Spg), Spermatocytes (Spcs), Meiotic figures (MF), Round Spermatids (RSpt), and Spermatids of stage X (SptX) at 40× resolution. A third model (two class model) segments Elongated Spermatids (ESpt) at 40× resolution (Figure 2). After segmentation, all results were saved tubule-wise to extract the 17-dimensional feature vector corresponding to each tubule. The features corresponding to each tubule were formulated based on presence or absence of certain germ cells along with their morphological features such as shape and size. The network has 31 convolution layers, four transpose convolution layers, and one up-sampling layer. In a manner like the U-Net architecture, skip connections are introduced to the network to facilitate gradient backpropagation optimization, and thereby solving the vanishing gradient problem.
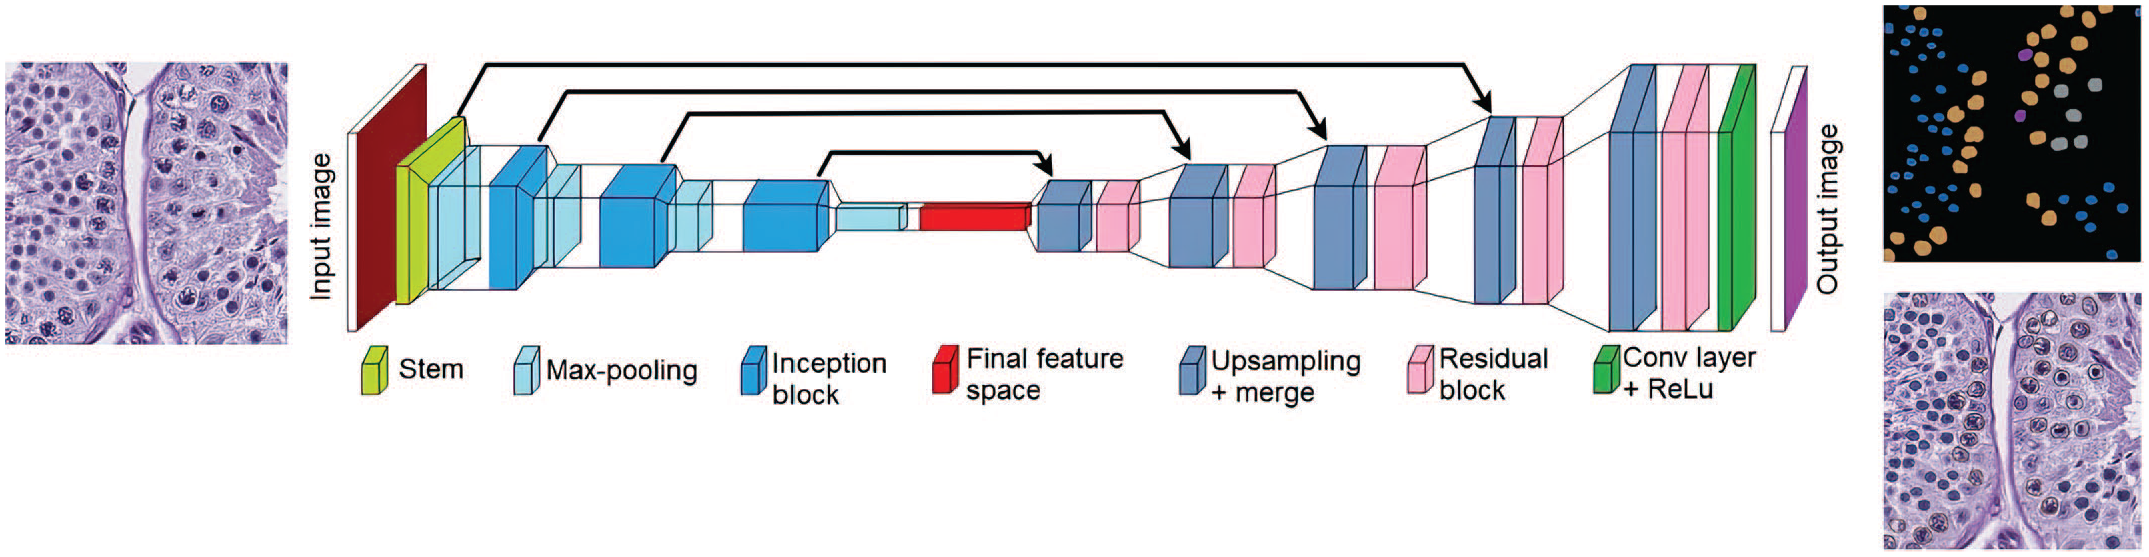
Network architecture of modified U-NET used for semantic segmentation of various parameters.
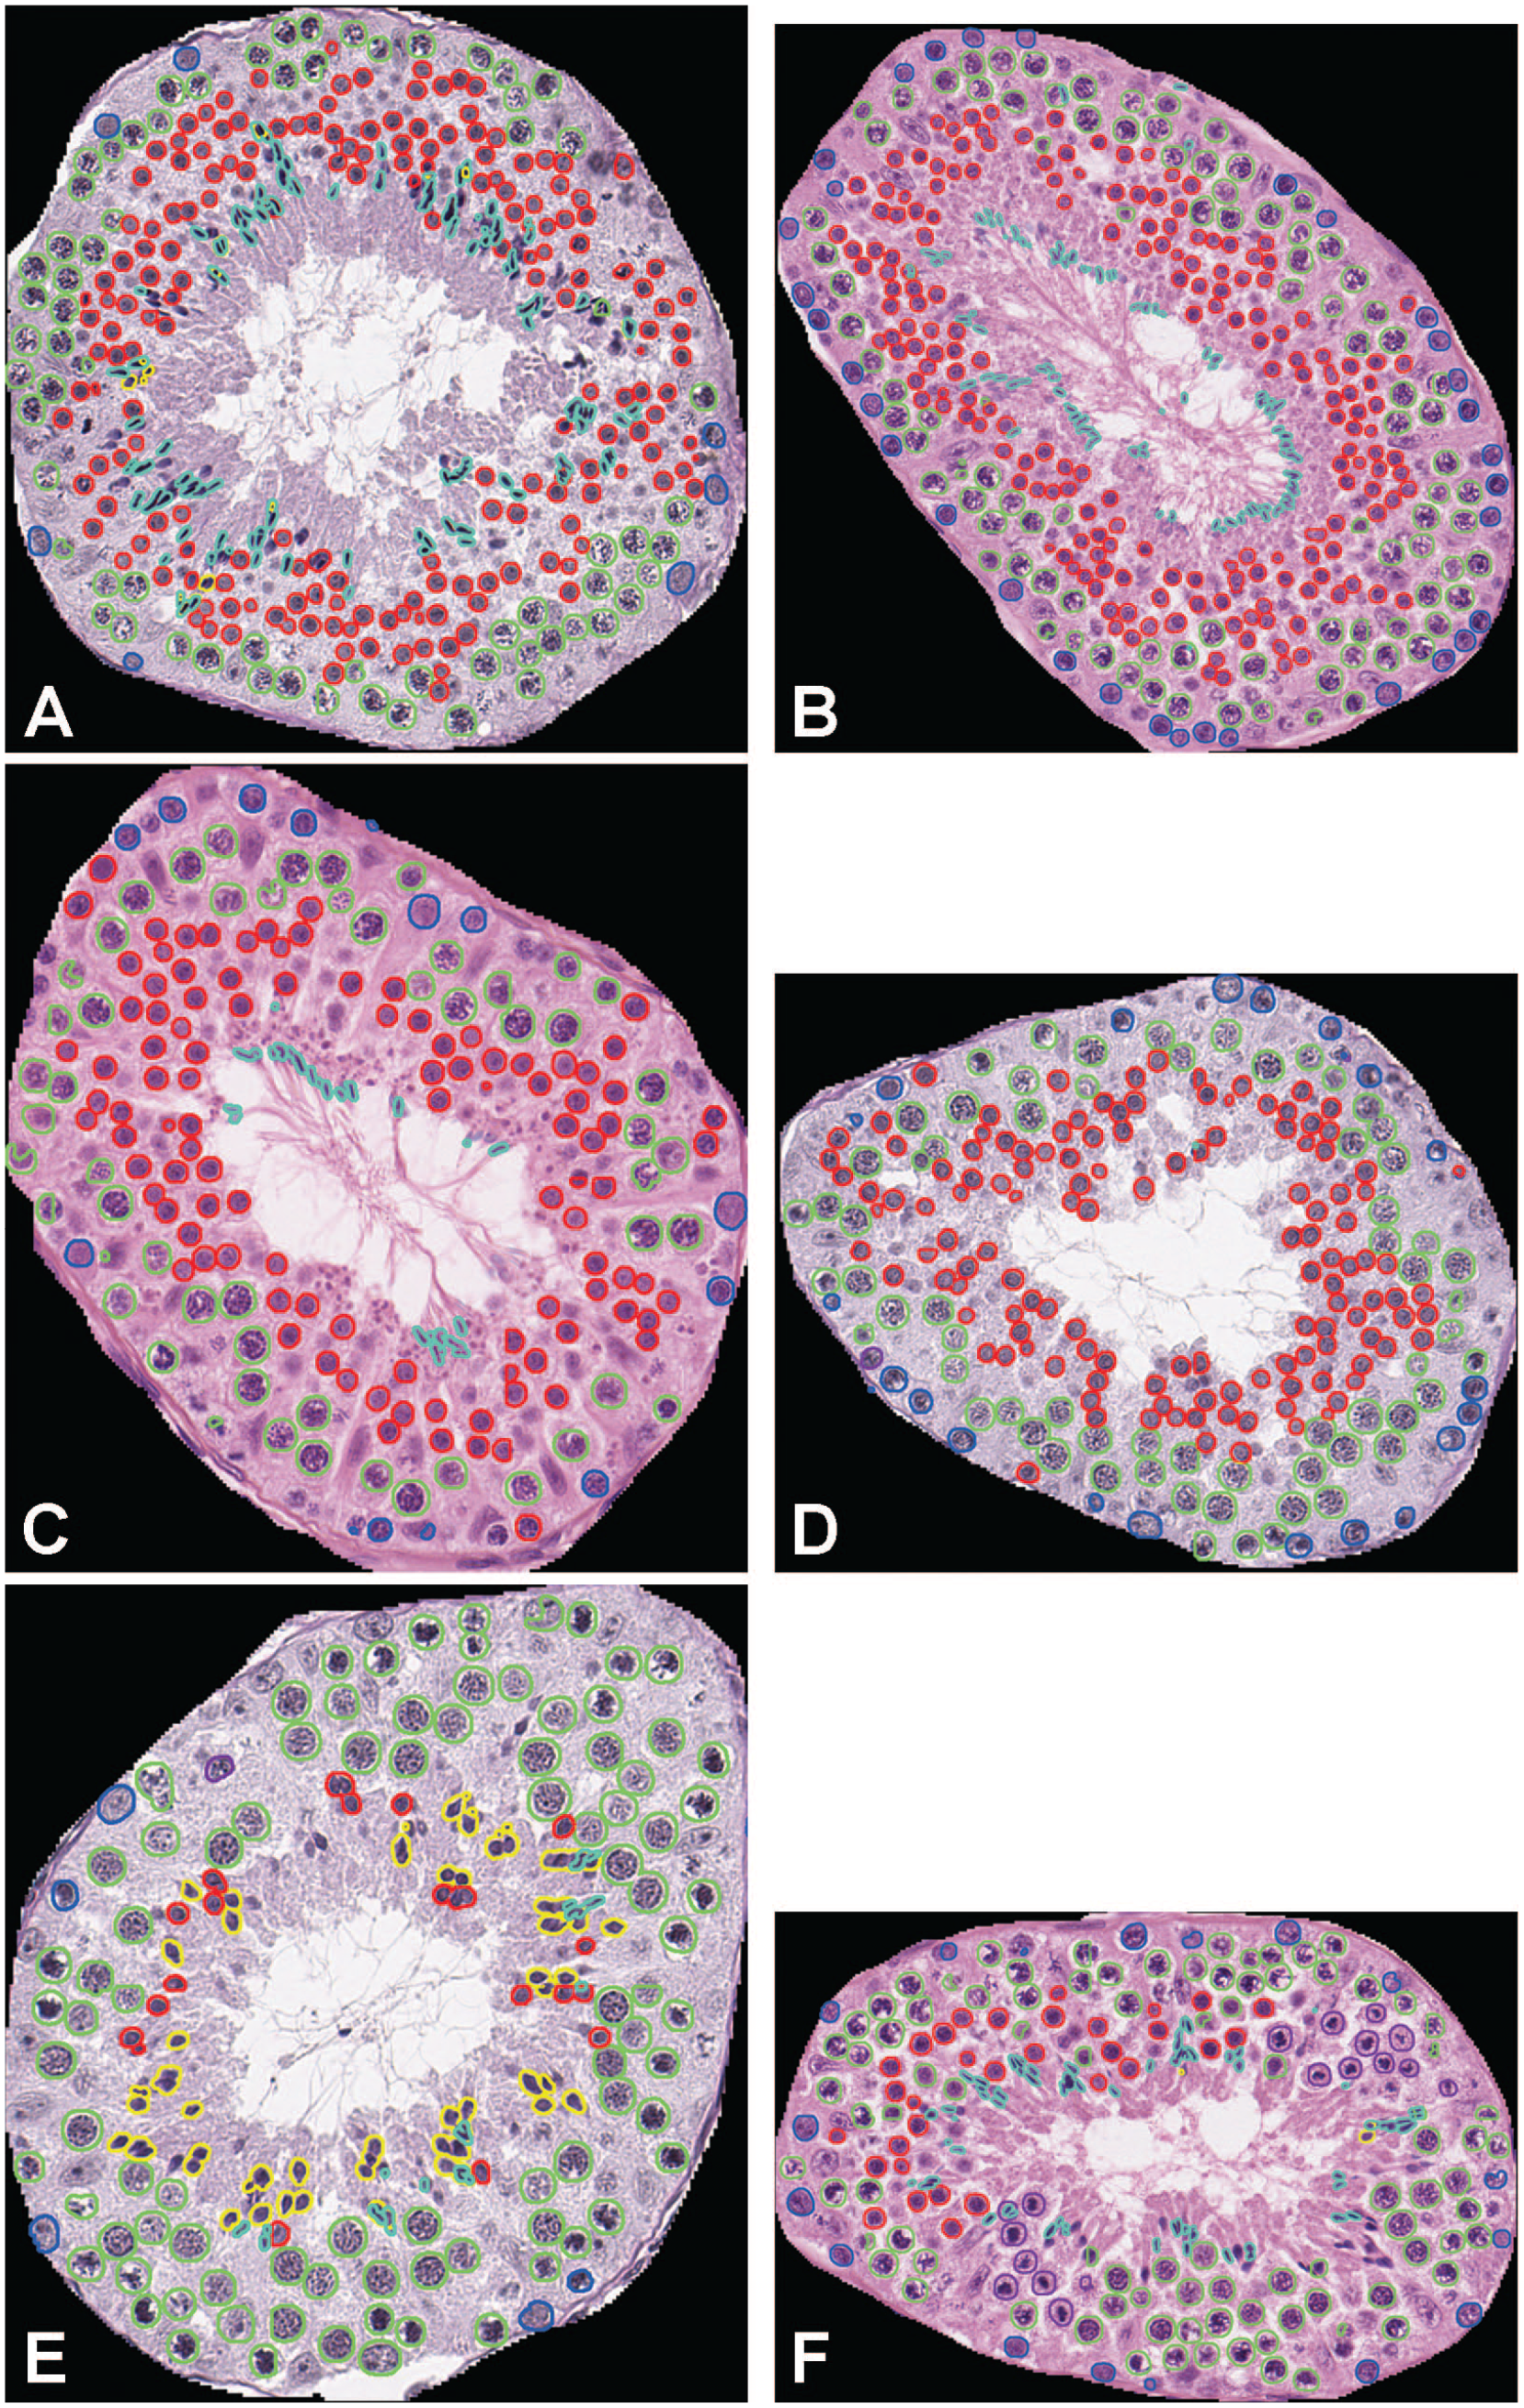
Annotation of germ cell populations in 6 seminiferous tubule cross-sections, one for each of the 6 different stage categories: (a) stage I-IV, (b) stage V-VI, (c) stage VII, (d) stage VIII-IX, (e) stage X-XI, (f) stage XII. Color code: Spermatogonia (dark blue), Spermatocytes (green), Round spermatids (red), Elongated spermatids (light blue), Meiotic figures (purple), Spermatids of stage X (yellow).
The models were IId in Keras framework with TensorFlow-backend where we used Adam optimizer, categorical cross-entropy loss function, batch size of eight, and learning scheduler to set the learning rate. During training, the learning rate started at 0.005 and grew by one decimal point every 150 epochs. Each convolution layer was initialized using the Xavier initializer, and a batch-normalization layer was added after every layer. We have also used augmentation techniques, viz, Hue, Saturation, Gamma correction, and so on to make the model generalized. The model was trained until it converged, at which point validation loss was added to track the convergence. After accurate segmentation of seminiferous tubule and lumen by inferencing the tubule and lumen segmentation model on 512 × 512 tiles at 10× magnification, the tile-level results were stitched together. We also infer the other two models (six-class model and ESpt model) on 512 × 512 tiles at 40× magnification. Using the individual tubule’s coordinates at 10× magnification, we extracted the corresponding tiles at 40× magnification to get the germ cells present in that tubule. We then extracted the 17-dimensional feature vector corresponding to each tubule.
The segmentation models were trained on NVIDIA RTX A6000 GPU with 48 GB GPU memory and 64 GB system memory (RAM). We also used python programming language for the extraction of features corresponding to each tubule.
The Dice Similarity Index (DSC) was calculated for each of the three segmentation models by determining the DSC for the foreground classes of each model (eg, for the 6 class model the DSC is calculated for the five foreground classes) and then by calculating the mean DSC for each model.
For classification of spermatogenic stages, a decision tree was incorporated to classify the tubules into defined stage categories. The learning and decision-making by the trained decision tree classifier is like those that pathologists consider while deciding on a particular stage. We trained the decision tree-based classifier using scikit-learn libraries in python. The average time taken to stage the tubules was 0.8 ± 0.15 seconds per tubule.
Exclusion Criteria and Staging Criteria
Spermatogenesis occurs in the seminiferous tubules. These are long U-shaped tubules which form their U-turn at the periphery of the testis as both distal ends drain into the central rete testis. A section through the testis contains numerous cross-sections of the seminiferous tubules. Each cross-section has a round to elliptical shape and is composed of the peripherally located epithelium and the centrally located lumen. Thickness of epithelium and lumen changes depending on the stage.
The model was trained to segment out individual cross-sections of seminiferous tubules. Only transversely sectioned tubules with a single distinct lumen were included in the staging classification. Longitudinally sectioned tubules and tubules without a distinct lumen were excluded and designated as “not classified.” Exclusion of longitudinally sectioned tubules is common practice and has been performed for automated staging in rodents. 5 Those tubules generally do not provide an adequate cross-section of seminiferous epithelium for evaluation and would be excluded by a pathologist in a subjective evaluation as well. The exclusion of longitudinally sectioned tubules was performed by the model based on the minor and major axis of the tubule (both the minor axis and the major axis of the ellipse were measured; any tubule with a minor axis below 126 micrometer, a major axis above 882 micrometer or an aspect ratio above 3 was excluded). Longitudinally sectioned tubules were excluded from staging because they often contain more than one spermatogenic stage. In cynomolgus macaques, up to 20% of seminiferous tubule cross-sections may display features of more than one stage. The evolutionary occurrence of such multistage tubules is well known in primates, with humans showing the highest proportion of multistage tubules, but the cause for this phenomenon is still unknown.10,12,15
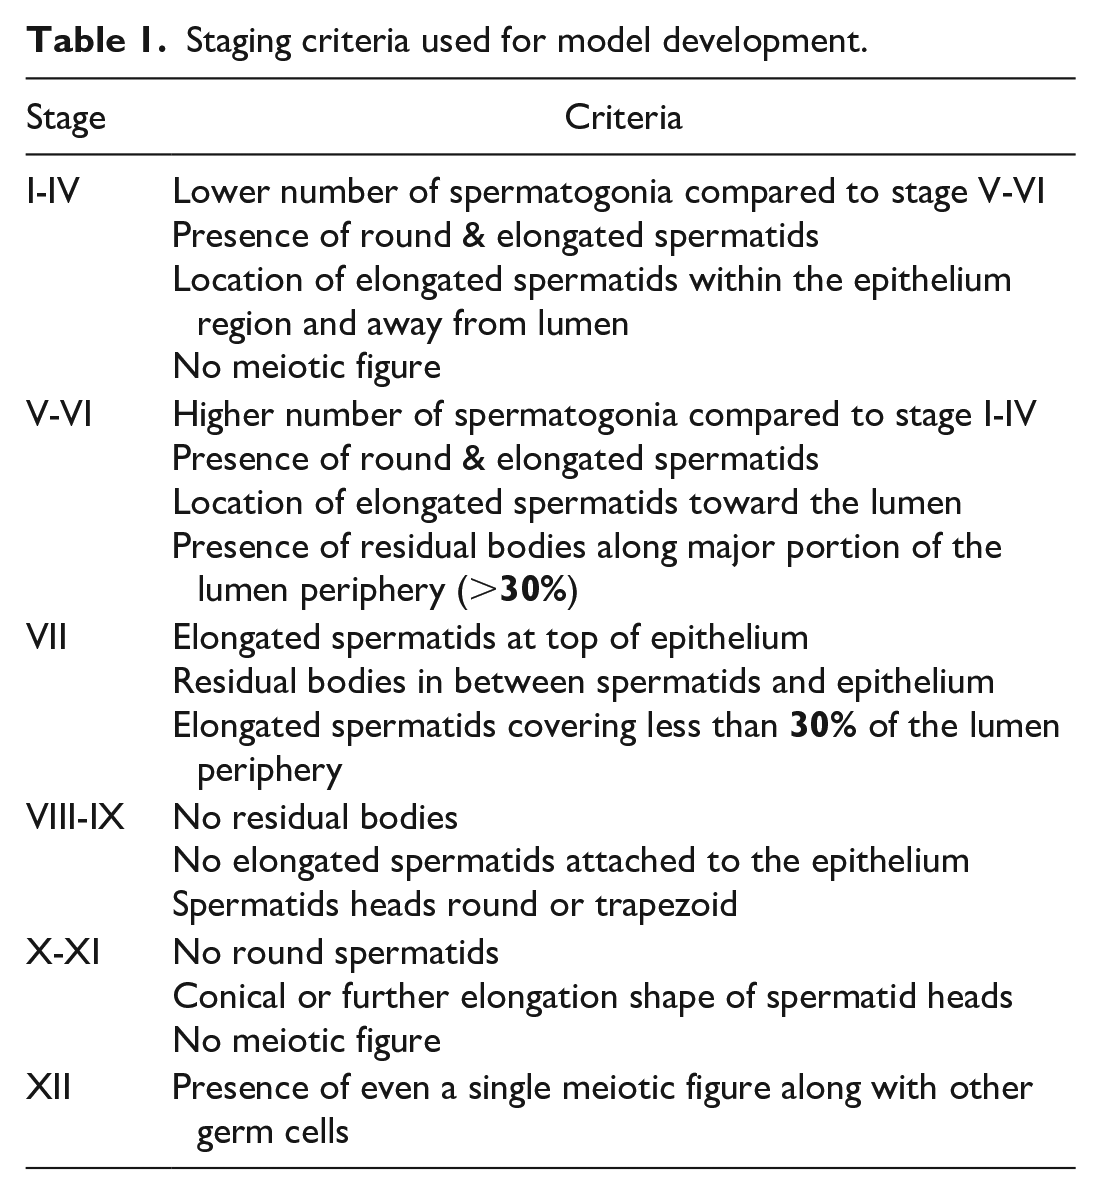
For the remaining seminiferous tubule cross-sections, staging criteria were defined by an in-house expert in spermatogenic staging, based on the cellular composition of the twelve stages of the spermatogenic cycle as described by Dreef et al. 6 Based on a simplified classification with six stages in human testis, 13 and based on experience that was obtained throughout model development, we used the following six categories for spermatogenic staging: stage I-IV, stage V-VI, stage VII, stage VIII-IX, stage X-XI, and stage XII (Table 1).
Staging criteria used for model development.
Deep Learning Model Development
For training of the first model, that is tubule and lumen segmentation, a total of 900 tiles at 10× magnification were selected by taking 450 tiles each from the H&E sections and the PAS sections. For training of the second model, a total of 780 tiles at 40× magnification were selected by taking 360 tiles from H&E sections and 420 tiles from PAS sections. For training of the third model, which is a binary model for ESpt, a total of 668 tiles at 40x magnification were selected by taking 320 tiles from the H&E-sections and 348 tiles from the PAS sections.
We started the model development with seven WSI from PAS-stained slides, annotated by an expert. We trained the model to accurately (1) dissect the WSI into individual tubules, (2) exclude longitudinally cut cross-sections and cross-sections without a lumen, (3) differentiate six different types of germ cells (Spg, Spcs, MF, RSpt, SptX, ESpt), and (4) assign the correct stage to each individual tubule. With reference to staging, we started with the following eight categories: stage I-IV, stage V, stage VI, stage VII, stage VIII-IX, stage X, stage XI, and stage XII.
Annotations made by the model were reviewed by an in-house expert and any difference was recorded. Training of the algorithm was continued, and staging criteria were adapted as needed. As the deep learning model was not able to differentiate between stage V and stage VI, which is mainly achieved by the presence of residual bodies in stage VI, we combined both stages for subsequent classification. The model was also not able to differentiate between stage X and stage XI, which is mainly achieved by the shape of the spermatid head. Therefore, we combined stage X and stage XI for subsequent classification (Figure 3).
Annotation of seminiferous tubule cross-sections in a WSI. Brown = not classified (ie, tubules that were excluded from staging), orange = stage I-IV, green = stage V-VI, dark blue = stage VII, light blue = stage VIII-IX, pink = stage X-XI, yellow = stage XII.
We started development of the model with WSI from PAS-stained slides because PAS sections are frequently used for manual staging, as acrosome caps are specifically pointed out. However, classification of spermatogenic stages by our deep learning model does not depend on acrosome cap detection. Therefore, we exploited the same model for WSI from H&E stained sections. As concordance with manual staging was similar between PAS-stained and H&E-stained sections, we subsequently used WSI from both stains for further development to make the model stain-independent.
Model Performance Metrics
Performance of the deep learning model was evaluated with three WSI from PAS-stained slides and with six WSI from H&E-stained slides (Supplemental Data). These WSI were not included in training of the segmentation model and the decision tree-based classifier model. For both cohorts, confusion matrix and performance metrics were generated. To evaluate the performance of the decision tree classifier, we calculated the precision, recall (sensitivity), and f1-score (symmetrically representing both precision and recall) corresponding to each stage. The combined data for all stages were then used to calculate the overall accuracy of the model when compared with the manual staging.
Deep Learning Model Validation
Finally, the deep learning model was validated using six WSI from H&E-stained slides originating from three animals that had been assigned to the control group of a pharmaceutical safety study (Supplemental Data). For validation, each WSI was evaluated by the model and the following data were generated for each tile (ie, the evaluated cross-section of a seminiferous tubule) per WSI:
tile ID (continuous number assigned by the model).
tubule circumference.
stage to which the individual tubule was assigned (either one of the six categories or “not classified”).
Based on the data for each tile (hereupon referred to as “tubule”), the following parameters were calculated per WSI:
total number of tubules.
percent of tubules staged as “not classified.”
total number of tubules that were classified.
percent of tubules in stage I-IV.
percent of tubules in stage V-VI.
percent of tubules in stage VII.
percent of tubules in stage VIII-IX.
percent of tubules in stage X-XI.
percent of tubules in stage XII.
The stage frequency that was calculated for each WSI was compared with the stage frequency that was independently determined by two in-house experts and to the literature reference that lists a stage frequency for cynomolgus macaques. 6
Results
Performance Metrics
The DSC was calculated for the each of the three U-Net segmentation models. The DSC for model 1 (segmentation of tubules and lumen) was 97.8 (tested on 84 tubules), DSC for model 2 (germ cell segmentation) was 86.74 (tested on 75 tubules), and DSC for model 3 (ESpt segmentation) was 83.63 (tested on 95 tubules).
Performance of the deep learning model was evaluated by comparing stage allocation of 6089 tubules from PAS-stained slides between the model and the subject matter expert in a confusion matrix (Table 2) and by calculating performance metrics (Table 3). The model achieved an average recall (sensitivity) of 0.950, ie, 95% of tubules in the respective stage were found, with the lowest recall for the detection of stage VII (0.872) and the highest recall for stage VIII-IX (0.981). Average precision was 0.949, ie, slightly over 5% of the classified tubules were false positives, with precision ranging from 0.866 (stage XII) to 0.987 (stage I-IV). The f1-score was 0.948 on average, ranging from 0.915 (stage XII) to 0.979 (stage VIII-IX).
Confusion matrix comparing staging of algorithm with ground truth (pathologist), based on the evaluation of 3 WSI from PAS-stained slides and 6 WSI from H&E-stained slides.
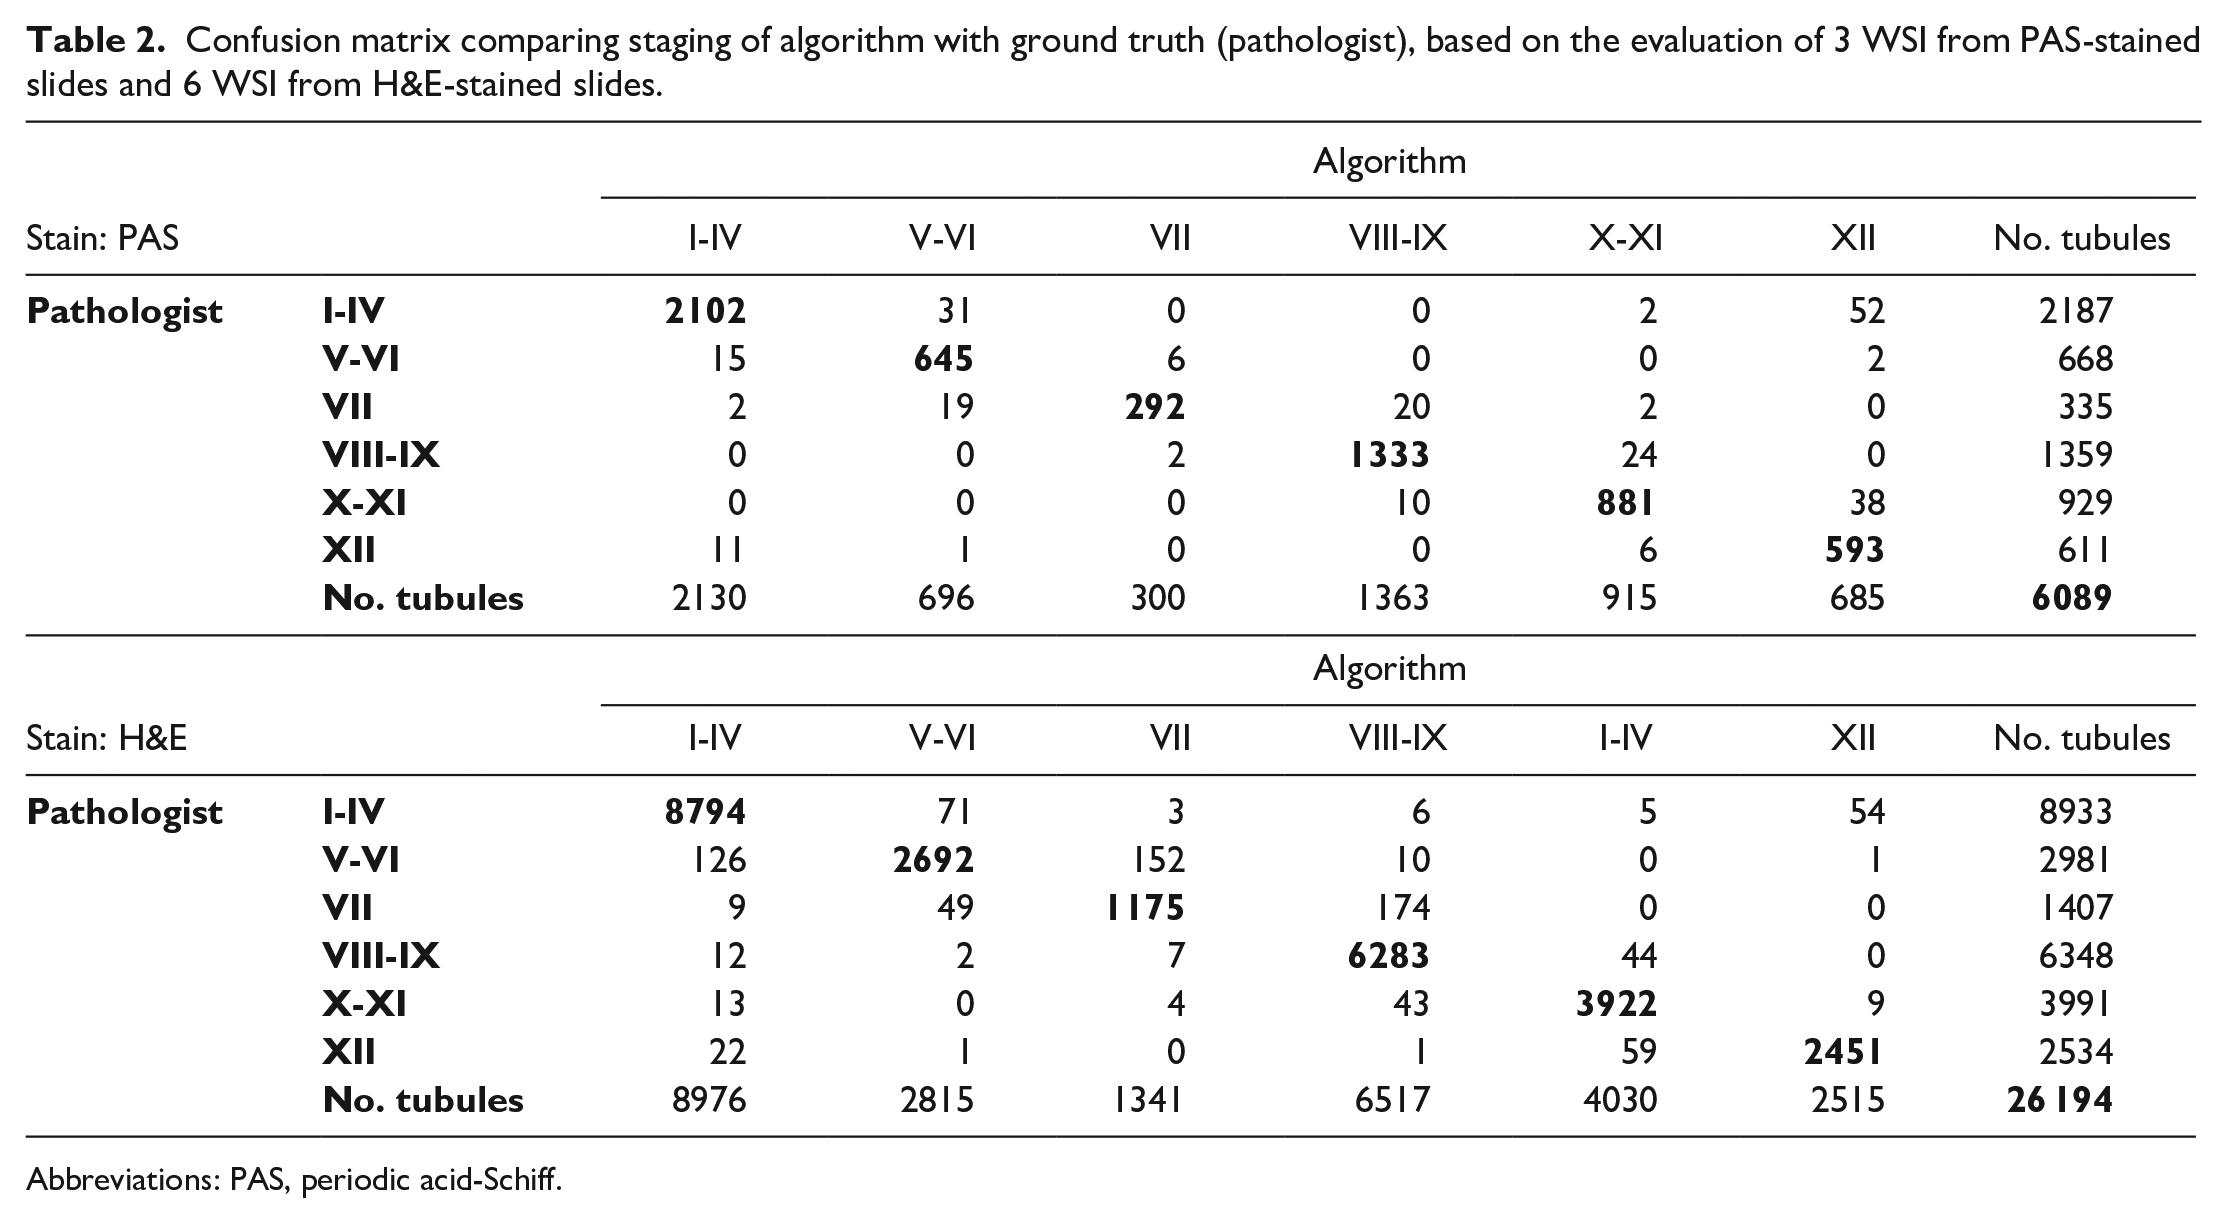
Abbreviations: PAS, periodic acid-Schiff.
Performance metrics for staging of algorithm (version 3), based on the evaluation of 3 WSI from PAS-stained slides.
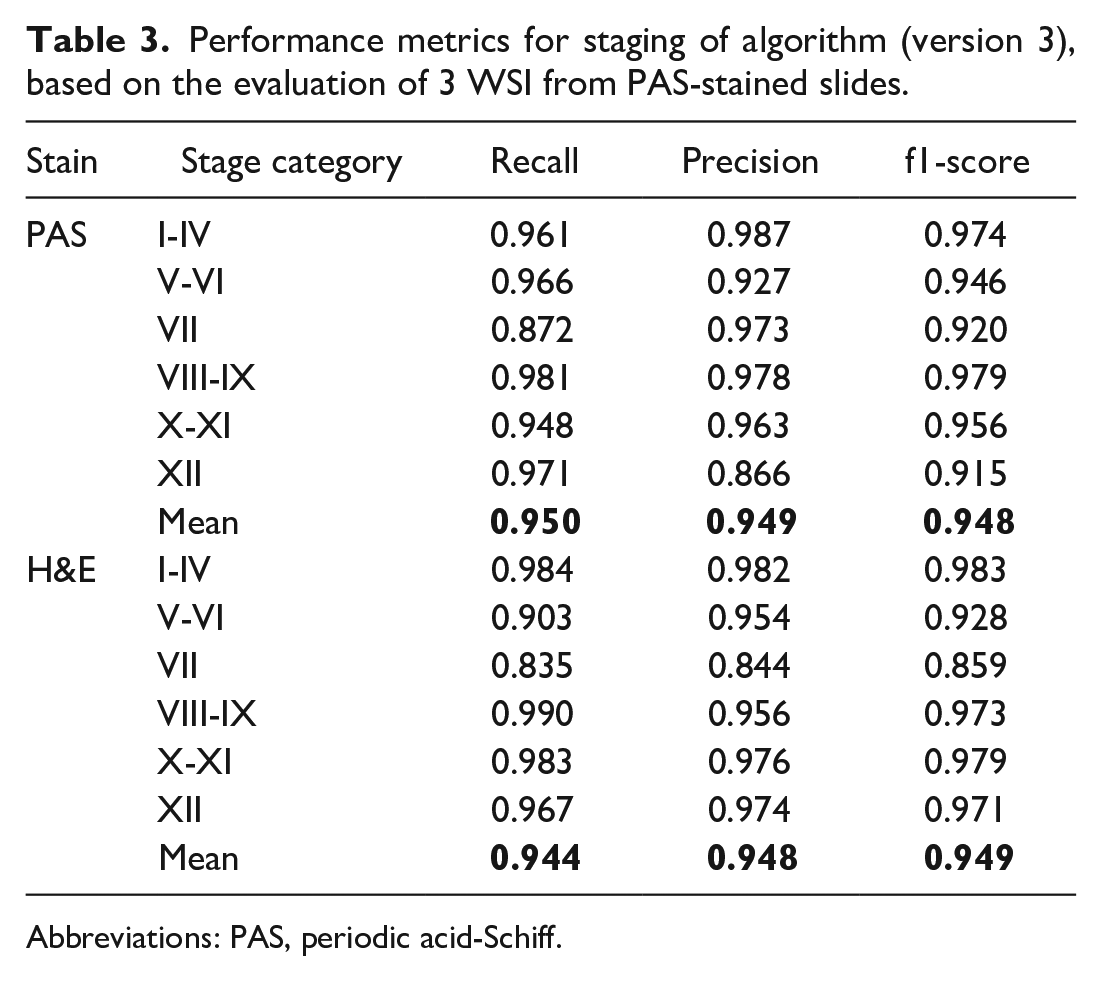
Abbreviations: PAS, periodic acid-Schiff.
The deep learning model was further evaluated by comparing stage allocation of 26 194 tubules from H&E-stained slides between the model and the subject matter expert (Table 2). For H&E, the model achieved an average recall (sensitivity) of 0.944 (min 0.835, max 0.984), an average precision of 0.948 (min 0.844, max 0.982), and an average f1-score of 0.949 (min 0.859, max 0.983) (Table 3).
Validation
The validation data set revealed an average number of 4938 ± 819 (mean ± standard deviation) seminiferous tubule cross-sections per WSI (Table 4). On average, 22 ± 3% of these tubule cross-sections were excluded from staging. Comparing the circumference of the “not classified” tubules vs classified tubules demonstrated that “not classified” tubules have a much higher variability in circumference and a higher average circumference, indicating these are longitudinal sections where potentially features of more than one stage prevent reliable classification (Figure 4). A pathologist would also exclude such tubules from staging. Review by an expert confirmed that “not classified” tubules were sectioned longitudinally and that many of them comprised more than one spermatogenic stage.
Data generated from the validation conducted with 6 WSI from 3 animals (left and right testis each).
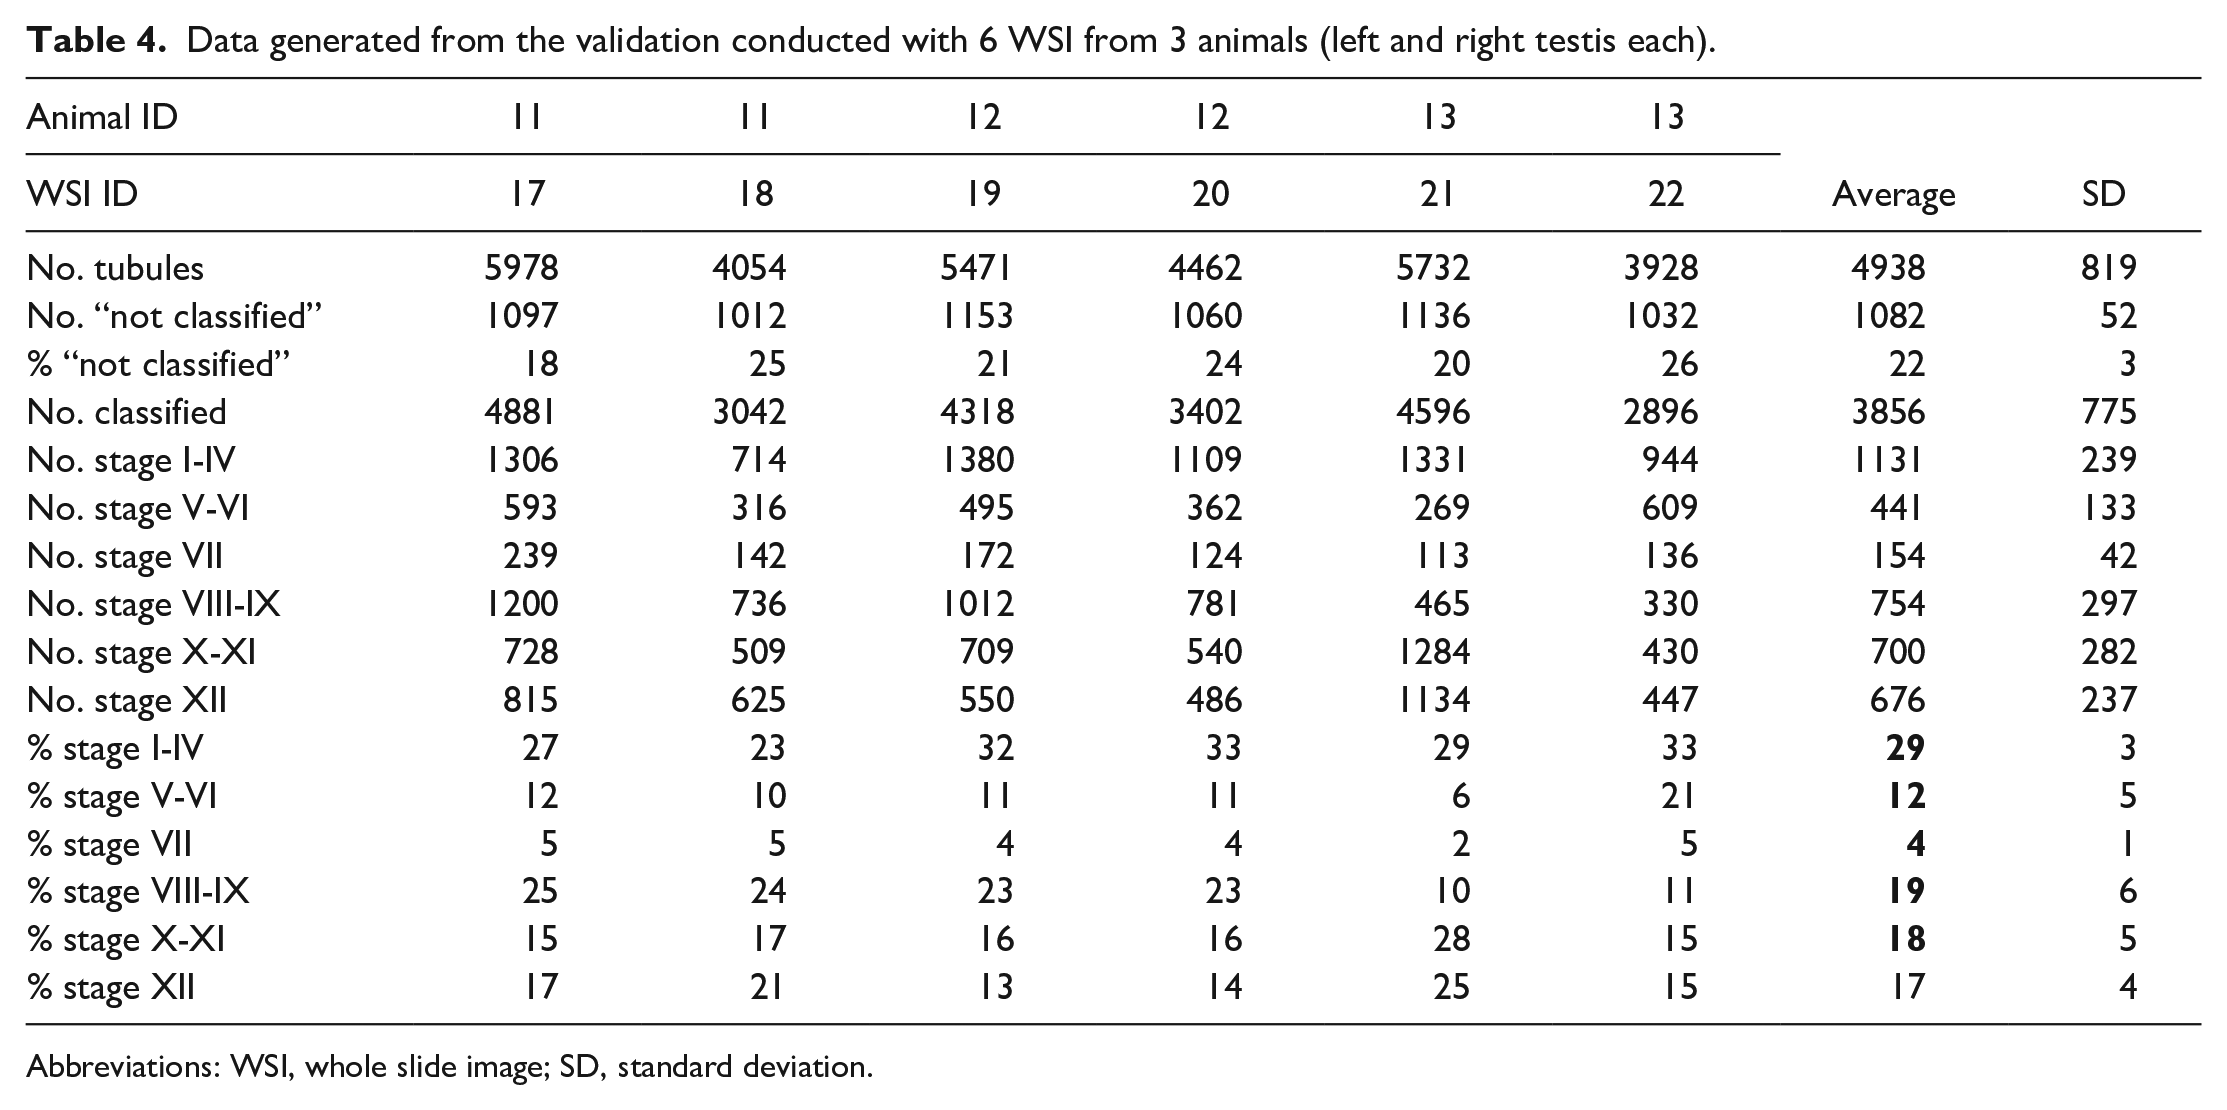
Abbreviations: WSI, whole slide image; SD, standard deviation.
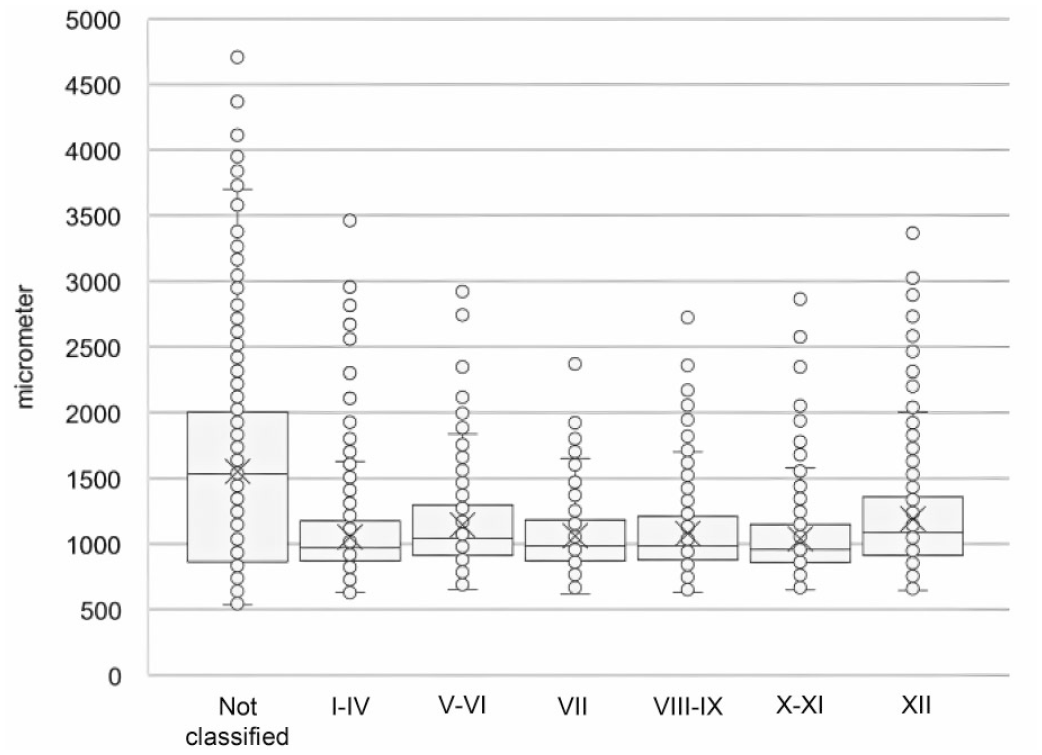
Whisker plots of circumference (in micrometer) of analyzed tubule cross-sections from the 6 WSI of the validation data set, split by classification category of the deep learning model. n.c. = not classified.
For validation of the model, stage frequency was calculated for each WSI (Table 4). The average frequency of stages was as follows (mean ± standard deviation): 29 ± 3% were in stage I-IV, 12 ± 5% in stage V-VI, 4 ± 1% in stage VII, 19 ± 6% in stage VIII-IX, 18 ± 5% in stage X-XI, and 17 ± 4% in stage XII. It was noted that variability across WSIs was mainly caused by one WSI (WSI ID 21) from one animal (animal ID 13). This WSI was reviewed by a pathologist, but no abnormality was detected, and no obvious difference was noted compared to the other WSI in this data set.
Discussion
Deep learning–based spermatogenic staging is already established for rats, ie, an animal species that is widely used for nonclinical studies investigating male fertility. 5 It has also been developed for mice and dogs.8,16 Cynomolgus monkeys are far less commonly used for an indirect assessment of fertility, but if they are, they are typically the only animal species that is used to investigate safety before humans are exposed to the product. Therefore, it is important to maximize the information that can be derived from such studies. Concerning testicular spermatogenesis, cynomolgus monkeys are different from rodents such that approximately 20% of tubules show more than one spermatogenic stage.5,15 Therefore, spermatogenic staging is time-consuming and prone to subjectivity, which makes it an attractive target for automation.
We have used a series of three U-Net-based deep learning models to segment seminiferous tubule cross-sections and identify six specific germ cell populations. This was combined with a decision tree classifier to allocate each seminiferous tubule cross-section to one of the six defined stage categories. This approach is very similar to how automated staging has been developed for rats. 5 Xu et al 16 took a similar approach for spermatogenic staging in mice and developed a model that segments tubule region and detects types of spermatogenic cells, followed by a decision tree classification into three initial stage groups (early, mid, and late stage), followed by another model further classifying the mid stage tubules. Automated staging in dogs was conducted using a slightly different approach, where a U-Net-based multiclass segmentation model was used to define the exact boundary of tubules and classify their stage simultaneously, and a second multiclass model was used to detect nuclear boundary and types of germ cells. 12
In cynomolgus macaques, an arbitrary system to distinguish 12 different stages was proposed, 6 based on the work of Clermont and Leblond in 1959 who differentiated 12 stages in rhesus macaques. 2 Briefly, this system distinguishes between early stages (I-VI), where stages are mainly differentiated by acrosomal features in round spermatids, and late stages (VII-XII), where stages are mainly differentiated by the nuclear shape of elongated spermatids. This general principle of spermatogenic staging is like that used in other species. During development of our model, we experienced difficulties of the model to differentiate between all 12 stages defined by Dreef et al. 6 Therefore, some stages were combined, ie, stage I-IV, stage V-VI, stage VIII-IX, and stage X-XI. Combining certain stages of spermatogenesis to facilitate easier staging is common practice. It was performed in rats for stages II-III, IV-VI, and XII-XIII, 7 in mice for stages I-II, 16 and in dogs for stages I-II, III-IV, and VI-VII. 12 In humans, only six stages are typically used for staging, with I and II as early stages and III-VI as late stages. 1 Our system of six categories is also differentiating between early stages and late stages. Early stages are further subdivided in two categories (I-IV and V-VI), and late stages are further subdivided in four categories (VII, VIII-IX, X-XI, XII). This classification allows for a sufficiently detailed evaluation of all major cellular events in spermatogenesis, including differentiation of A spermatogonia into B spermatogonia (stage VIII-IX), differentiation of preleptotene spermatocytes (stage VII), meiosis (stage XII), acrosome formation (stage I-IV), spermatid elongation (stage X-XI), and spermatid release (stage V-VI).
On average, the deep learning model excluded 22% of all seminiferous tubule cross-sections from staging. These tubules are longitudinally sectioned and typically contain more than one spermatogenic stage per cross-section. This is a well-known phenomenon in primates, and pathologists would also exclude those tubules from a manual staging assessment. Nevertheless, on average more than 3000 seminiferous tubule cross-sections per WSI remain for classification (Table 4).
The deep learning model provides a stage frequency map, ie, for each WSI, the frequency of the six stage categories is given. The stage frequency that was determined by our model was compared to the stage frequency that was independently determined by two in-house experts and to a literature reference. 6 The comparison revealed discrepancies across the 4 evaluations, with reasonable consensus for stage I-VI, stage VIII-IX, and stage X-XI (Table 5). Per our staging criteria, stage VII is characterized by elongated spermatids at the top of the epithelium covering less than 30% of the lumen and by residual bodies in between spermatids and epithelium (Table 1). This criterion is very strict, particularly regarding the 30% cut-off. This might explain why recall and precision were the lowest for stage VII, and it may also explain why our model (and the in-house subject matter experts) determined fewer stage VII tubule cross-sections (4 to 6%) than what is reported in the literature (12.5%). 6 Frequency of stage XII was higher in the model-generated data compared with in-house subject matter experts (SMEs) and published data. 6 The higher frequency of stage XII in the model-generated data compared with in-house SMEs could be related to the very tight staging criterion that even a single meiotic body will result in the classification of stage XII. Further studies on stage frequency on a much larger cohort of animals and WSI are needed to better understand the endogenous variability in stage frequency and how this information could help in detecting adverse effects on the testis.
Comparison of stage frequency between algorithm, two subject matter experts (SME) and data taken from Dreef et al. 6
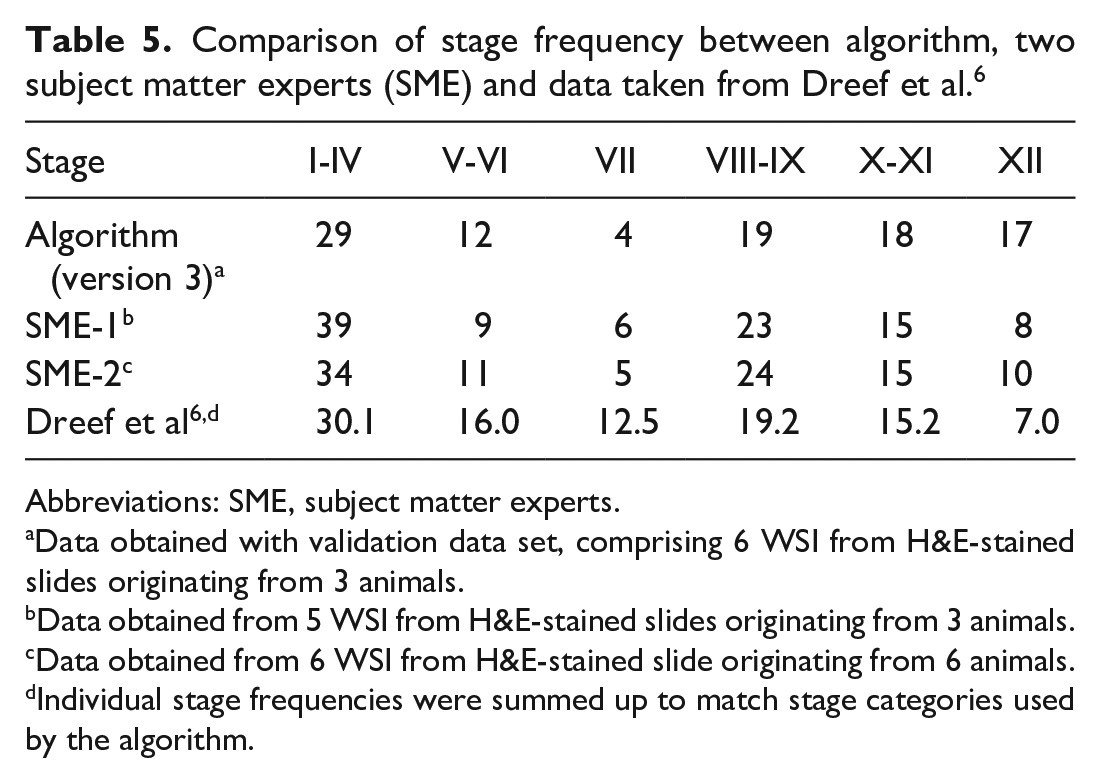
Abbreviations: SME, subject matter experts.
Data obtained with validation data set, comprising 6 WSI from H&E-stained slides originating from 3 animals.
Data obtained from 5 WSI from H&E-stained slides originating from 3 animals.
Data obtained from 6 WSI from H&E-stained slide originating from 6 animals.
Individual stage frequencies were summed up to match stage categories used by the algorithm.
Whole slide images for the development of the module were from Asia-origin animals, whereas those used for validation were from Mauritius-origin animals. It is unlikely that this aspect interfered with the validation of the model. Although Mauritius-origin animals are known to reach sexual maturity earlier than Asia-origin cynomolgus monkeys, the general features of spermatogenesis are similar across both origins. 9 In a recent study, differences in testicular histology between Asia-origin and Mauritius-origin animals were smaller than the intra-individual variability within each origin. 14
Our deep learning–based model classifies six stages of spermatogenesis by means of detecting six different types of germ cells (Spg, Spcs, MF, RSpt, SptX, ESpt) and associating them with a specific time point of spermatogenesis, like the approach taken by a pathologist. Based on its mode of function, the model would be able to generate stage-wise germ cell counts. We have not started the evaluation of such quantitative data yet, but we intend to conduct such analysis in the future to explore if such data could assist the overall pathology evaluation of testes. Stage-specific germ cell quantification was reported from a deep learning model used on dog testis 8 and was generally in agreement with the expected distribution. However, such quantitative data have so far not been used for detection of spermatogenic abnormalities.
The application of this deep learning model on WSI from testes with functional or morphological abnormalities is a logical next step. It remains to be seen, if stage frequency maps and stage-specific germ cell quantification add value to the mere stage-aware morphological evaluation of the testis.
This model was developed for potential application in regulatory nonclinical safety studies which are conducted to characterize potential hazards for human patients. Yet, the model has so far not gone through a validation process that fulfills all the requirements that are outlined by Good Laboratory Practice (GLP) regulations. Nevertheless, controlled and adequately documented application of this model will allow us to gain experience and to explore its potential benefit in safety assessment, particularly if stage frequency mapping and germ cell quantification are included. By no means will this model replace a pathologist evaluating the testis slides, but it will certainly help the pathologist to reach a consistent and informative conclusion on potentially adverse effects on male fertility.
In conclusion, we have developed a deep learning model that can classify cross-sections of seminiferous tubules in WSI derived from H&E-stained or PAS-stained testis slides of cynomolgus monkeys with high sensitivity, precision, and accuracy. The model supports pathologists in conducting a stage-aware evaluation of the testis, to provide important data for the indirect assessment of male fertility. The model also allows derivation of a stage frequency map, of which the significance remains uncertain, as additional data on the variability and relevance of stage frequency in cynomolgus monkeys are required.
Supplemental Material
sj-docx-1-tpx-10.1177_01926233241234059 – Supplemental material for Deep Learning–Based Spermatogenic Staging in Tissue Sections of Cynomolgus Macaque Testes
Supplemental material, sj-docx-1-tpx-10.1177_01926233241234059 for Deep Learning–Based Spermatogenic Staging in Tissue Sections of Cynomolgus Macaque Testes by Lars Mecklenburg, C. Marc Luetjens, Annette Romeike, Rohit Garg, Pranab Samanta, Amogh Mohanty, Tijo Thomas and Gerhard Weinbauer in Toxicologic Pathology
Footnotes
Declaration of Conflicting Interests
The author(s) declared no potential conflicts of interest with respect to the research, authorship, and/or publication of this article.
Funding
The author(s) disclosed receipt of the following financial support for the research, authorship, and/or publication of this article: This study was funded by Labcorp.
Supplemental Material
Supplemental material for this article is available online.
References
Supplementary Material
Please find the following supplemental material available below.
For Open Access articles published under a Creative Commons License, all supplemental material carries the same license as the article it is associated with.
For non-Open Access articles published, all supplemental material carries a non-exclusive license, and permission requests for re-use of supplemental material or any part of supplemental material shall be sent directly to the copyright owner as specified in the copyright notice associated with the article.