
Abstract
Quantification of fatty vacuoles in the liver, with differentiation from lumina of liver blood vessels and bile ducts, is an example where the traditional semiquantitative pathology assessment can be enhanced with artificial intelligence (AI) algorithms. Using glass slides of mice liver as a model for nonalcoholic fatty liver disease, a deep learning AI algorithm was developed. This algorithm uses a segmentation framework for vacuole quantification and can be deployed to analyze live histopathology fields during the microscope-based pathology assessment. We compared the manual semiquantitative microscope-based assessment with the quantitative output of the deep learning algorithm. The deep learning algorithm was able to recognize and quantify the percent of fatty vacuoles, exhibiting a strong and significant correlation (r = 0.87, P < .001) between the semiquantitative and quantitative assessment methods. The use of deep learning algorithms for difficult quantifications within the microscope-based pathology assessment can help improve outputs of toxicologic pathology workflows.
Keywords
Nonalcoholic fatty liver disease (NAFLD) is caused by the accumulation of excess neutral fats or triglycerides in the liver of patients without previous exposure to alcohol. 1,2 Considered the most prevalent liver disease in the Western world with incidence of 25% to 30%, 3 NAFLD can lead to a more dangerous necroinflammatory condition, termed nonalcoholic steatohepatitis (NASH). 4 As there are no approved treatments for NAFLD and NASH, they are considered disorders with high unmet clinical therapeutic needs, 5 a fact that has facilitated the development of a large number of clinically relevant rodent models. 2,5
Histologically, the accumulation of fat in hepatocytes can be classified into microvesicular and macrovesicular steatosis. Microvesicular steatosis is characterized by small fat-filled vacuoles surrounding the nucleus. 6 As the condition progresses, the vacuoles increase in size and push the nucleus to the periphery of the cell, a condition termed macrovesicular steatosis. 2 However, as has been shown before, this is a difficult finding to assess and is characterized by intra- and interobserver variability in the pathologists’ evaluation of these histological findings. 7 –10 Therefore, automated computational methods to quantify these changes can increase accuracy, decrease variability, and provide continuous quantification (and not semiquantitative grading). 9
A major hurdle in automatically quantifying liver steatosis is to accurately detect the micro- and macrovesicles. In hematoxylin and eosin (H&E) staining, there exist several structures which contain clear glass, including not only the fat vesicles but also the lumina of vessels (eg, portal and central veins, portal arteries, and sinusoids) and bile ducts. 9
Recent advances in the fields of digital pathology, tissue image analysis, and artificial intelligence (AI) have been used in the field of toxicologic pathology. AI is a tool that could be used to differentiate between normal and abnormal samples and to reduce inter- and intralaboratory variability that exists when using semiquantitative grading systems. 11
While cited in previous papers, it is important to distinguish between different terms commonly associated with AI. The term AI encompasses any algorithm that aims at making machines capable of performing human tasks. Machine learning and deep learning are types of AI algorithms: Machine learning is a method of statistical learning where each instance in a data set is described by a set of features or attributes. In contrast, the term deep learning is a method of statistical learning that extracts features or attributes from raw data by using neural networks with many hidden layers, big data, and powerful computational resources. 12 In the context of vacuole detection, if a machine learning-based approach was used, the features extraction (shape, texture, color, etc.) and classification/segmentation would have been individual tasks driven by 2 independent algorithms. However, with deep learning, the neural network takes the images as input and performs both feature extraction and classification/segmentation.
In this study, we compared the traditional semiquantitative microscope-based evaluation by an experienced toxicologic pathologist to a deep learning-based identification and quantification application that was performed on a computer screen that is connected to a microscope camera that feeds images in real time to that computer. To perform this comparison, we used data extracted from 2 studies that were aimed to test the effects of dietary broccoli on NAFLD progression, using 2 different mouse models. 13
The AI application (AIRA Matrix) used in this study is based on a semiautomated algorithm and was developed using a segmentation framework for vacuole quantification via deep learning. In this method, a selective tiling technique was initially used to generate tiles that include complete lumina (vascular and bile duct) and large vacuoles without any partial regions, followed by a supervised learning method using an encoder–decoder convolution neural network (CNN) architecture for segmenting individual vacuoles.
By separating the larger input image into smaller images with equal-sized tiles, and then by training a supervised learning framework to segment individual vacuoles, the tiles are capable of being trained in the CNN to avoid resizing the input image and maintain object magnification. First, overlapping tiles are extracted with a fixed overlap percentage of T by uniformly distributing across the input image. We choose an overlap of T = 25% in our algorithm. This helps in achieving complete coverage of the image while maintaining a constant overlap between tiles. To address the issue of misclassification of lumina (vascular and bile duct) as large vacuoles, a method aimed at detecting regions in a digital image that have peculiar properties, called blob detector, is applied to extract large white blobs (lumina and large vacuoles). In this algorithm, the blob detector identifies white spaces in the image (intensity, color, and saturation are the necessary cues used by the blob detector). The output of the blob detector therefore captures both vacuoles and nonvacuole white regions in a digital image. An empirical threshold is applied on the size of a blob/region to eliminate very large white spaces. The remainder of the detected regions are passed on for deep learning inference to eliminate lumen and other regions which have similar shape characteristics as that of a vacuole. This selective tiling improves the model performance in distinguishing between a lumen and a large vacuole.
This step is followed by a supervised learning method using an encoder–decoder CNN architecture for segmenting individual vacuoles. The network used in this step consists of a 4-stage encoding and a 4-stage decoding architecture. To implement residual learning, output of each stage of the encoding branch is added to the input of the analogous stage of the decoding branch, and the element wise sum is fed into convolution layers for that decoding branch. Final vacuolation percentage is then calculated as the ratio of detected vacuoles to the tissue region ([detected vacuole area]/[Tissue area] * 100). The tissue region is extracted after eliminating all the clear glass regions and any circulating cells appearing at the vessel centers. Color-based thresholding is performed on image to get the clear glass area. Blob detection and morphological operations are then performed on the color thresholded image to eliminate the circulating cells.
Once developed, the AI quantification tool was deployed to perform real-time on the author’s Olympus BX51 microscope that had been outfitted with a digital pathology imaging and display system (Augmentiqs). 14,15 The Augmentiqs system contains a high-resolution camera for viewing and imaging the region of interest, and an OpenAPI through which third-party algorithms and software are deployed, including the abovementioned AI algorithm. The results of the image analysis algorithms are displayed in real time on the screen of a PC, located in close proximity to the microscope, or as augmented reality on top of the optical plane of the specimen within the microscope eyepiece.
The experimental design consisted of 2 different experiments: High-fat diet (HFD) experiment: 16 male C57BL/6 J mice, acquired from Harlan Laboratories, were randomly assigned to 6 groups (n = 4 animals/group): normal diet; HFD + 10% (wt/wt) dietary broccoli; HFD + 10% (wt/wt) dietary broccoli stalks. The animals were fed the assigned diets for 17 weeks. High cholesterol and cholate diet (HCD) experiment: 16 male C57BL/6 J mice, acquired from Harlan Laboratories, were randomly assigned to 4 groups (n = 4 animals/group): normal diet; diet high in fat high cholesterol (1%) and cholate (0.5%) (HCD; atherogenic diet); HCD + 15% (wt/wt) dietary broccoli; HCD + 15% (wt/wt) dietary broccoli stalks. The animals were fed the assigned diets for 7 weeks.
The mice were housed in a controlled environment (12/12 hours of light/dark cycle, 18 °C -24 °C) with ad libitum access to food and water. At the end of the study, the mice were killed by isoflurane after a 12-hour fast.
For histopathological analysis, the liver tissue was collected, and a sample from the right lobe was placed in 4% formaldehyde. After embedding of the tissues in paraffin, a single section (3-5 µm thick) was cut from each block and stained with H&E. Histopathological changes were described and scored via microscope assessment using a semiquantitative grading (0-4), taking into consideration the severity of the changes: 0 = no lesion; 1 = minimal change; 2 = mild change; 3 = moderate change; and 4 = marked change. 16 The scoring reflects the predominant degree of the specific lesion seen in the entire field of the histology section. The histopathological evaluation was done using the regular microscopic range of magnifications, up to ×600. All experimental procedures were done according to the guidelines of the Authority for Biological and Biomedical Models and were approved by the Animal Care Ethics Committee of the Hebrew University of Jerusalem.
In each individual liver section for both experiments, 5 different microscopic fields (magnification ×600) were selected randomly by a board-certified pathologist, all located in the centrilobular regions (in HFD experiment) or in the perilobular regions (in HCD experiment). To avoid potential bias, the pathologist performed the semiquantitative assessment before the AI algorithm for quantitative assessment was applied. Photos have been taken for documentation purposes.
The deep learning AI algorithm was trained on 750 tiles (512 × 512) extracted from 60 field of view images. The algorithm performance was evaluated on a separate validation data set marked by the pathologist consisting of 75 tiles without any overlap with the training set tiles. The evaluation metrics used for assessing the performance of the algorithm were precision, sensitivity, specificity, and F1 score. The algorithm performed at par or better in comparison with state-of-the-art networks. Further validation studies comparing algorithm output vis-à-vis manual examination output by pathologist will be performed to confirm satisfactory performance characteristics above predefined cutoffs, before application in the laboratory.
For statistical analysis, Tukey’s multiple comparison tests were used to compare the percent of fatty vacuoles in the liver between the different treatment groups. The association between the group average grade of fatty liver assessed by semiquantitative scoring and the percent of fatty vacuoles assessed by AI quantitative evaluation was calculated by the Spearman correlation coefficient.
In the HFD experiment, histopathology examination of the livers showed the highest grade (4) of cytoplasmic fatty vacuoles in animals fed with HFD, lower grade was shown in the animals treated with normal diet and HFD + 10% (w/w) dietary broccoli or broccoli stalks, compared with the HFD group (Table 1). Quantitative evaluation of the percent of fatty vacuoles in the different groups using AI showed that the HFD led to a statistically higher percent of fatty vacuoles in the liver when compared to all treatment groups (Tables 1 and 2). The addition of dietary broccoli statistically reduced the percent of fatty vacuoles in the liver (Tables 1 and 2).
Grade of Hepatocytic Vacuolation Assessed by a Semiquantitative Scale (0-4) Versus Average Percentage of Hepatocytic Vacuolation, Assessed by Artificial Intelligence in HFD Experiment.
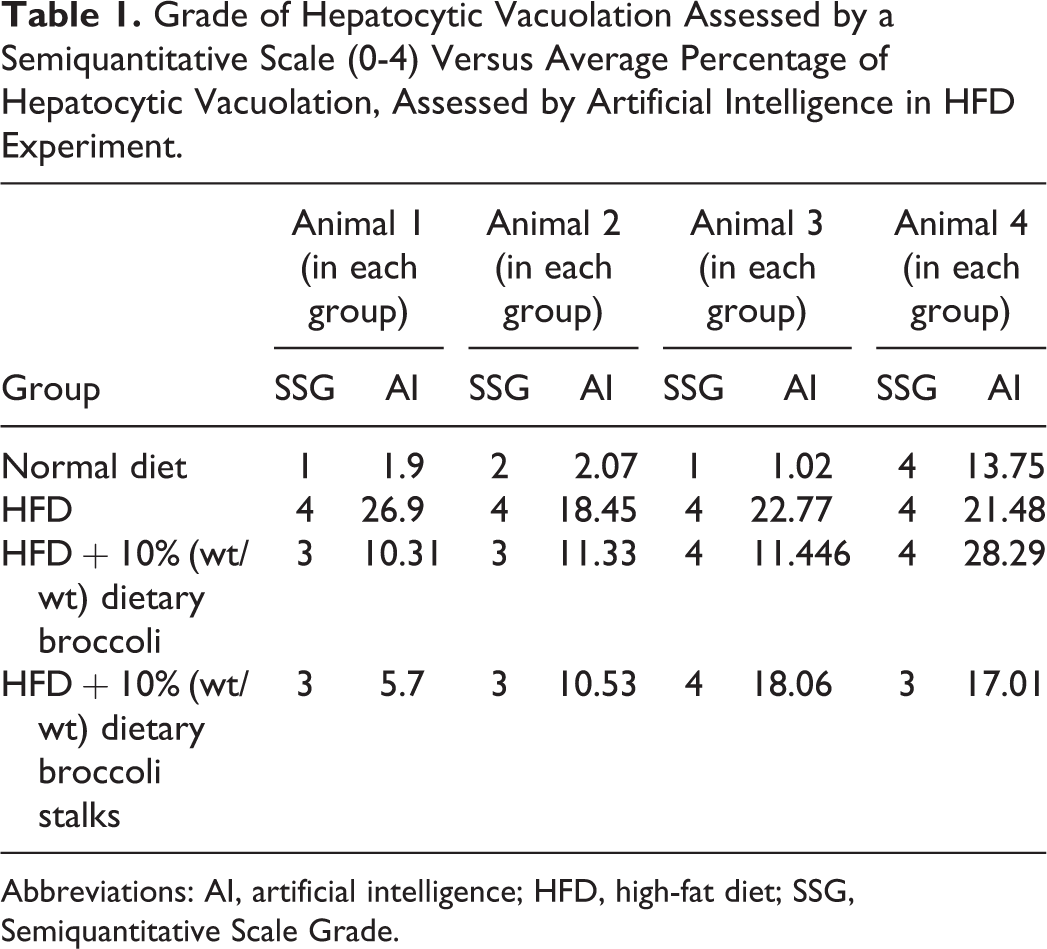
Abbreviations: AI, artificial intelligence; HFD, high-fat diet; SSG, Semiquantitative Scale Grade.
Quantitative Evaluation Using Artificial Intelligence of the Average Percentage of Fatty Vacuoles in the Livers of Animals in HFD Experiment.a
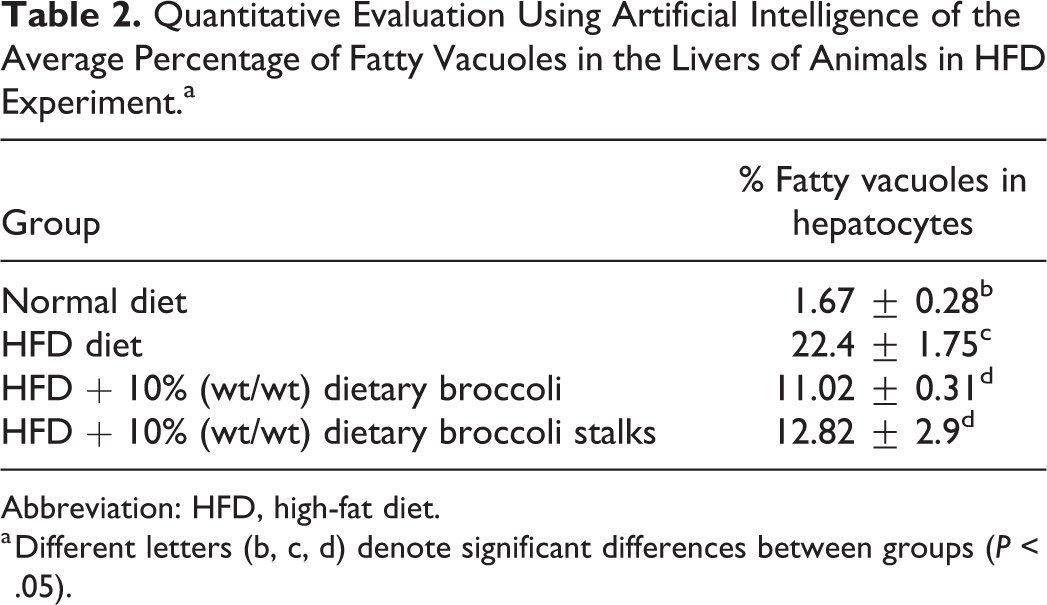
Abbreviation: HFD, high-fat diet.
a Different letters (b, c, d) denote significant differences between groups (P < .05).
In the HCD experiment, histopathologic examination of the livers showed cytoplasmic fatty vacuoles with lower severity grade in the normal diet group, and higher severity grades in the HCD groups, with or without the addition of dietary broccoli (Table 3). Quantitative evaluation of the percent of fatty vacuoles in the different groups using AI showed that the HCD diet led to a statistically higher percent of fatty vacuoles in the liver when compared to normal diet (Tables 3 and 4). The addition of dietary broccoli did not statistically reduce the percent of fatty vacuoles in the liver (Tables 3 and 4).
Grade of Hepatocytic Vacuolation Assessed by a Semiquantitative Scale (0-4) Versus Average Percentage of Hepatocytic Vacuolation, Assessed by Artificial Intelligence in HCD Experiment.
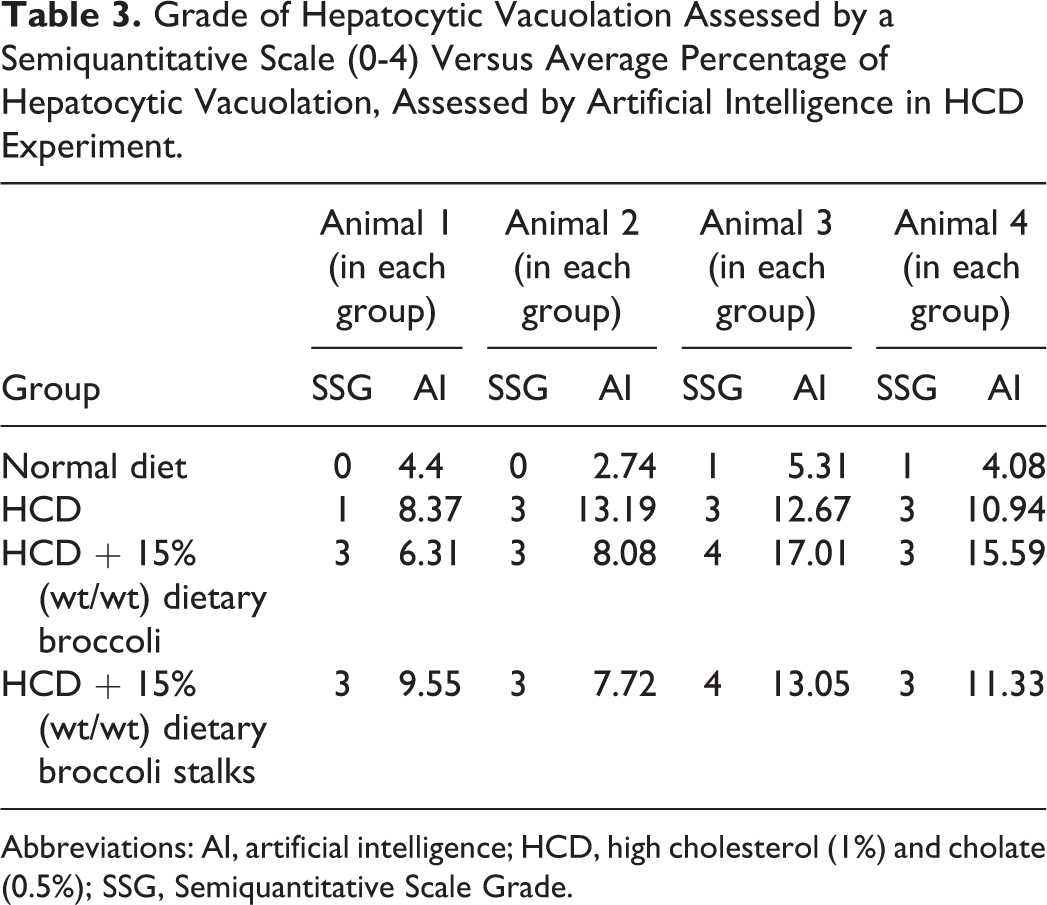
Abbreviations: AI, artificial intelligence; HCD, high cholesterol (1%) and cholate (0.5%); SSG, Semiquantitative Scale Grade.
Quantitative Evaluation Using Artificial Intelligence of the Average Percentage of Fatty Vacuoles in the Livers of Animals in HCD Experiment.a
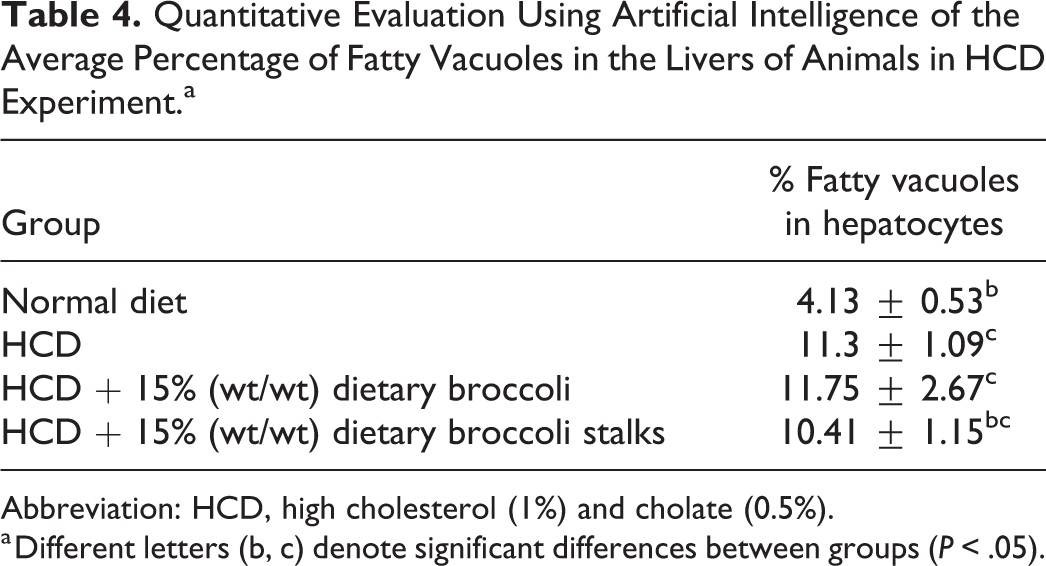
Abbreviation: HCD, high cholesterol (1%) and cholate (0.5%).
a Different letters (b, c) denote significant differences between groups (P < .05).
By using the Spearman’s test, a strong and significant correlation (r = 0.87, P < .001) was found between the microscope-based semiquantitative assessment, and the AI quantitative measurement of fatty vacuoles accumulation in the livers. Representative images showing the correlation between the two methods are shown in Figures 1–8.
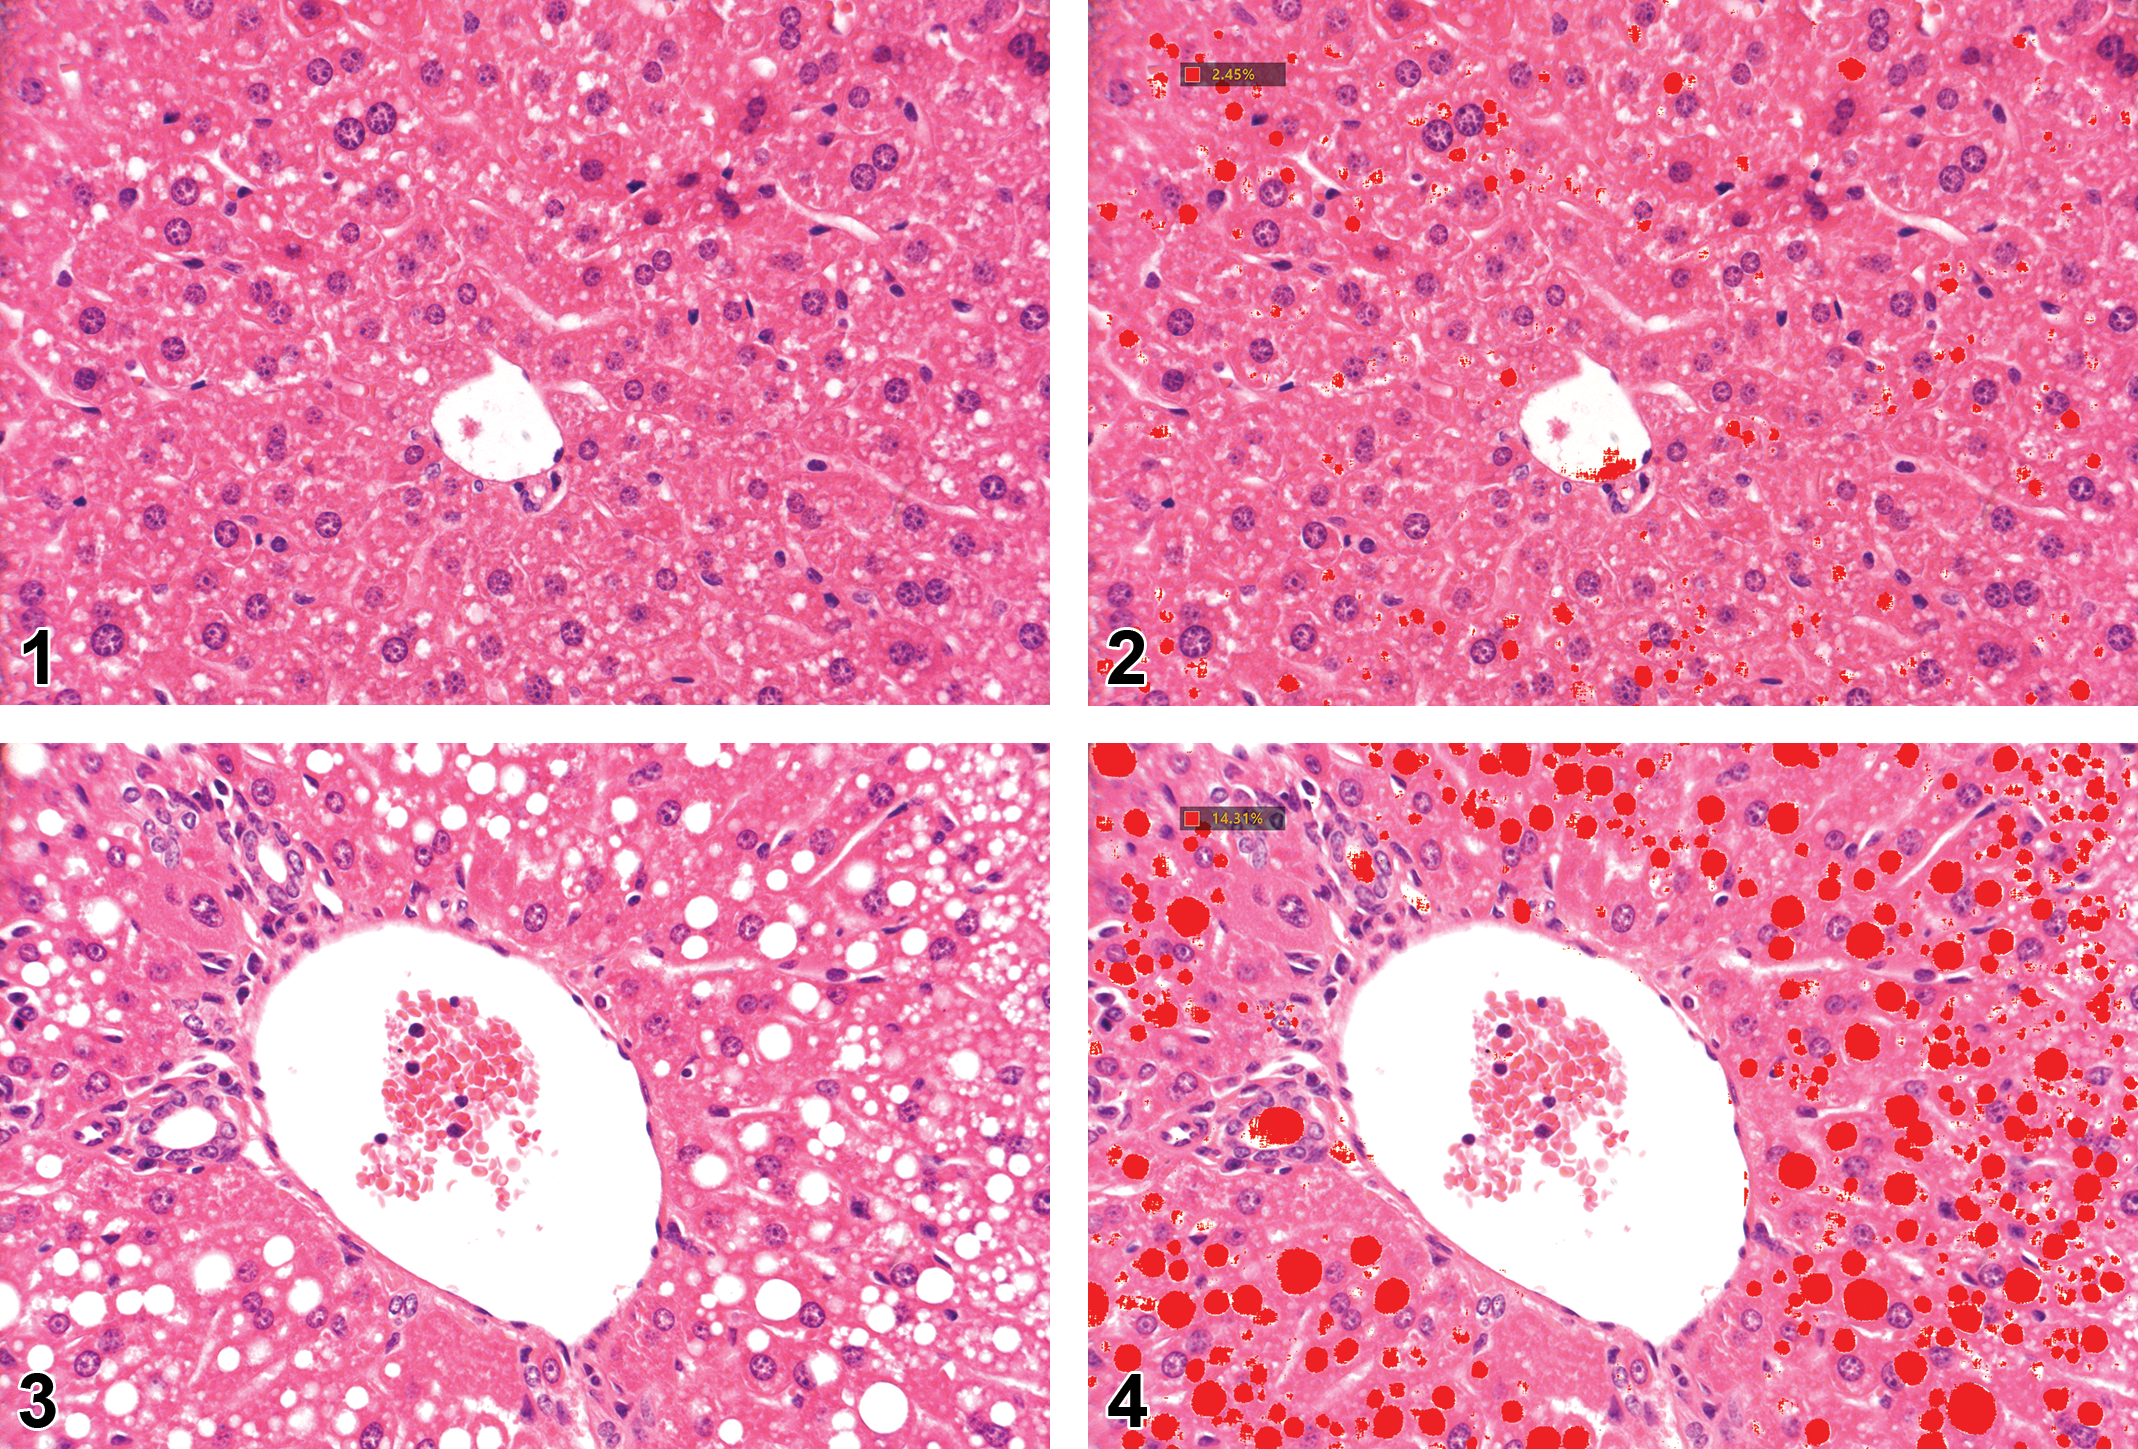
Histology section of the perilobular region of the liver from a mouse fed normal diet for 7 weeks. Hematoxylin and eosin staining.
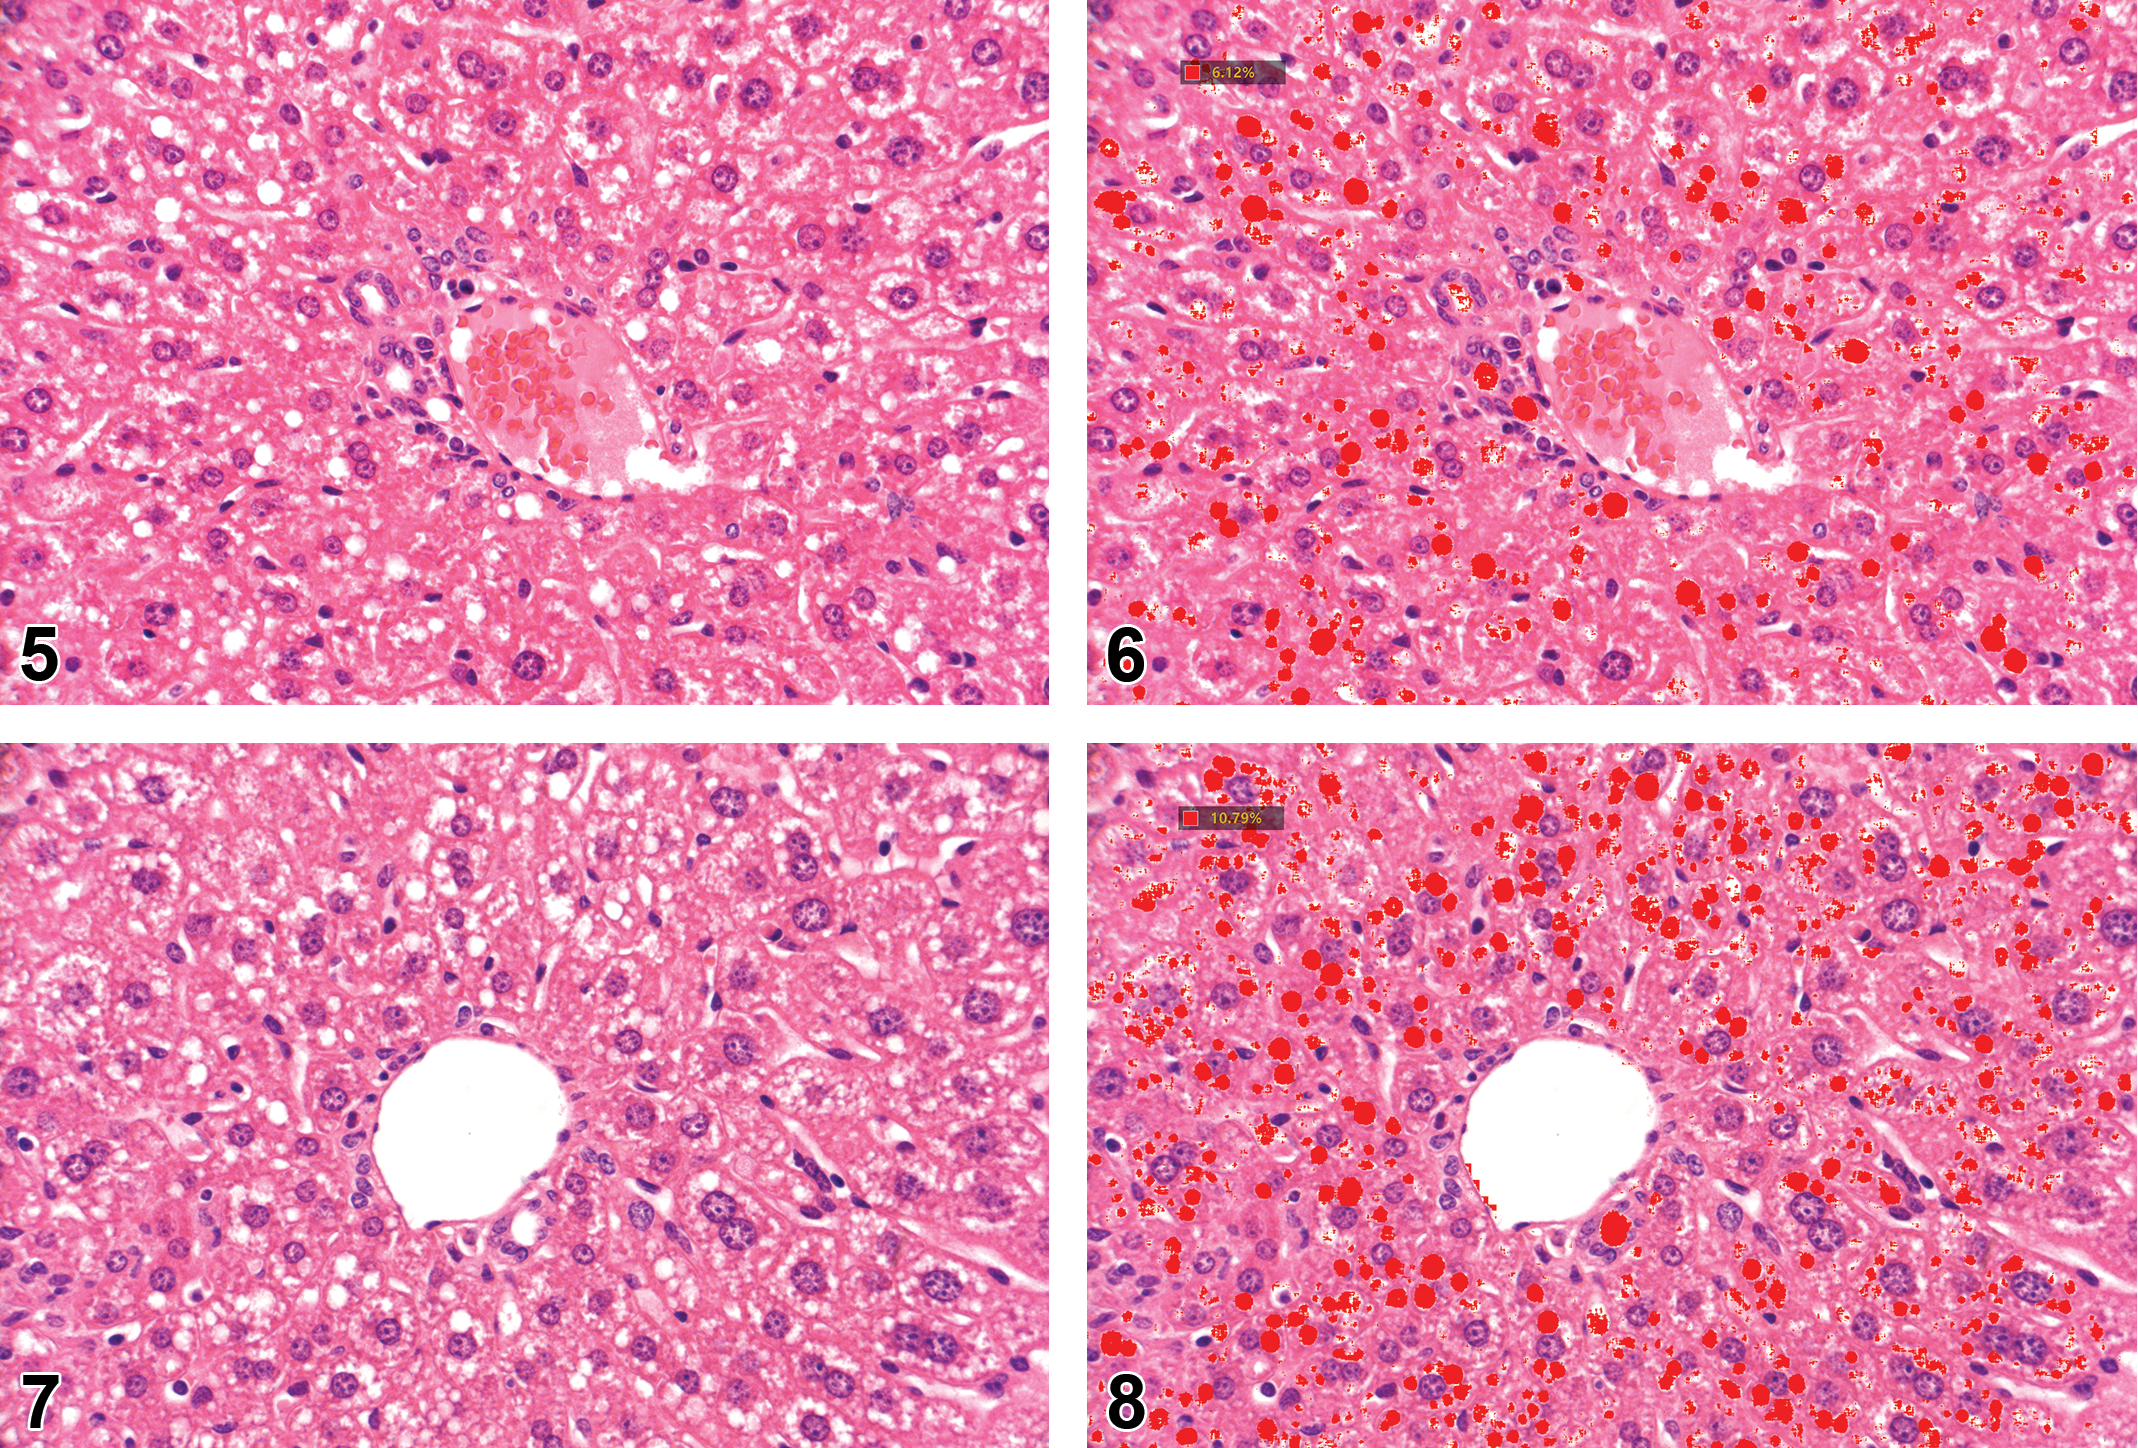
Histology section of the perilobular region of the liver from a mouse fed high-fat diet with 1% cholesterol and 0.5% cholic acid + 15% broccoli for 7 weeks. Hematoxylin and eosin staining.
The use of AI in toxicologic pathology is evolving rapidly and has already been documented in several mouse models. 11 For example, deep learning methods have been used to quantitate deposition of mesangial matrix in glomeruli of a mouse model for diabetic nephropathy 17 as well as to quantitate renal interstitial fibrosis. 18 Convolution neural network algorithm was also used in mice to count tyrosine hydroxylase immunoreactive neurons in the substantia nigra. 19
Such methods are sometimes difficult to implement in tissues where there are significant similarities between the target structures to be quantified and adjacent nonrelevant structures. Such is the case when quantifying fatty vacuole accumulation in the liver where these structures can resemble the abundant lumina of vessels and biliary ducts. Therefore, when implementing new techniques to automatically quantitate such structures, it is essential to properly correlate them with the traditional semiquantitative analysis used in toxicologic pathology.
Using the Spearman test, a strong and significant association was found between the 2 assessment methods. The automated quantitative assessment provided means for performing more reliable and accurate statistical analysis (Tables 2 and 4) to compare the different treatment groups in our model.
Our results using the AI application developed by AIRA Matrix are in strong agreement with a recent study that used a different image analysis software to quantify liver steatosis in a mouse model. 20 In this study, there was also a strong correlation between the automated measurement of steatosis and the steatosis score assessed by a pathologist (r = 0.89). In the same study, the automated image analysis software was also used to assess inflammation and fibrosis, demonstrating strong correlation between the automated and manual measurements. Together with our current study, there is good evidence to support the use of AI for assessing the different components of NAFLD and NASH. This is especially true to the lower grades of steatosis (eg differentiating between minimal pathological changes and normal background findings), where larger variances may exist between different toxicologic pathologists and even between different assessments of the same pathologist. 16 This was also observed in the lower grades of steatosis in the current study. For example, animal 1 in normal diet group of the HCD experiment had a lower grade of hepatocytic vacuolation by manual semiquantitative scoring when compared to animal 4 from the same group, although quantitative evaluation by AI showed a higher percentage of hepatocytic vacuolation in animal 1 (Table 3).
To the best of our knowledge, this is the first study to compare between the quantification results of an AI application for fatty vacuole accumulation and the semiquantitative evaluation performed by a board-certified toxicologic pathologist using a fully microscope-based approach. This method of deploying digital pathology applications such as AI and deep learning within the existing microscope workflow will likely be studied by other scientists in the future. In the field of toxicologic pathology, the use of image analysis in histopathological tissue assessment is expected to continue developing, especially for quantification purposes, to further support the integrity of assessments and diagnoses. We believe that reporting new AI applications and their correlation with microscope-based evaluation will be of great benefit to toxicologist pathologists for future utilization in daily practice.
Footnotes
Acknowledgements
The authors would like to thank Augmentiqs for their assistance in integrating the AI algorithms within the Augmentiqs system, and Dr. Abraham Nyska would like to thank Augmentiqs for allowing him to serve as an unpaid scientific advisor.
Declaration of Conflicting Interests
The author(s) declared the following potential conflicts of interest with respect to the research, authorship, and/or publication of this article. Deshmukh is an employee of AIRA Matrix, Thane, Maharashtra, India.
Funding
The author(s) received no financial support for the research, authorship, and/or publication of this article.