
Abstract
Gliosis, defined as a nonneoplastic reaction (hypertrophy and/or proliferation) of astrocytes and/or microglial cells, is a frequent finding in the central nervous system (CNS [brain and/or spinal cord]) in nonclinical safety studies. Gliosis in rodents and nonrodents occurs at low incidence as a spontaneous finding and is induced by various test articles (e.g., biomolecules, cell and gene therapies, small molecules) delivered centrally (i.e., by injection or infusion into cerebrospinal fluid or neural tissue) or systemically. Several CNS gliosis patterns occur in nonclinical species. First, gliosis may accompany degeneration and/or necrosis of cells (mainly neurons) or neural parenchyma (neuron processes and myelin). Second, gliosis often follows inflammation (i.e., leukocyte accumulation causing parenchymal damage) or neoplasm formation. Third, gliosis may appear as variably sized, randomly scattered foci of reactive glial cells in the absence of visible parenchymal damage or inflammation. In interpreting test article–related CNS gliosis, adversity is indicated by parenchymal injury (e.g., degeneration, necrosis, or inflammation) and not the mere existence of a glial reaction. In the absence of clear structural damage to the parenchyma, gliosis as a standalone CNS finding should be interpreted as a nonadverse reaction to regional alterations in microenvironmental conditions rather than as evidence of a glial reaction associated with neurotoxicity.
Keywords
This article is an opinion piece submitted to the Toxicologic Pathology Forum. This perspective is the particular view of the author. The opinion does not represent an official position of the Society of Toxicologic Pathology (STP), British Society of Toxicological Pathology (BSTP), or European Society of Toxicologic Pathology (ESTP), nor should it be considered to reflect the opinions, policies, or positions of regulatory agencies. The Toxicologic Pathology Forum is designed to stimulate discussion of topics relevant to regulatory issues in toxicologic pathology. Readers of Toxicologic Pathology are encouraged to send their thoughts on these opinion articles or ideas for new discussion topics to
Introduction
Neurotoxicity is a key consideration when developing new therapies for treating neural and nonneural diseases. This concern is acknowledged by wide-ranging regulatory guidance for assessing the neurotoxic potential of test articles (TA) during nonclinical safety testing1 -4; detailed recommendations for neural sampling, processing, analysis, and interpretation of microscopic findings in various nonclinical species5 -15; and ongoing efforts to define and promote standardized terminology for diagnosing changes in neural tissues.16,17 Accordingly, toxicologic pathologists must be prepared to identify and characterize microscopic findings in a spectrum of organs from the central (CNS) and peripheral nervous systems as well as determine their likely cause (i.e., by distinguishing TA-related vs procedure-associated vs incidental background vs artifactual changes from normal microanatomic features) and their implications.18 -21
While relatively uncommon, microscopic findings in the CNS are a particular concern in nonclinical safety testing. This apprehension is based in the limited repair capabilities intrinsic to brain and spinal cord domains. For instance, neuron necrosis is interpreted as “inherently adverse” as neuron loss may permanently impair tissue function or reduce the functional reserve capacity available for responding to new challenges. 22 Importantly, however, some tissue responses in the CNS may be adaptive (neuroprotective) rather than destructive. In such instances, adaptive responses imply that microenvironmental (e.g., intracellular and/or extracellular) conditions have prodded neural cells, especially glia, to reorient from their baseline (homeostatic or “resting”) setting to a reactive (“activated”) status. Gliosis may be either destructive or adaptive depending on the context.23 -32 In some cases, accumulation of reactive astrocytes and/or reactive microglial cells may directly contribute to parenchymal damage.25,26,33,34 Moreover, reactive microglial cells may induce astrocytes to acquire a tissue-destructive (“neurotoxic”) reactive phenotype. 25 Accordingly, glial reactions deserve careful consideration in generating and interpreting neuropathology raw data.
Glial responses in the CNS are a frequent interpretive challenge with respect to setting a “no observed adverse effect level” or similar threshold value. This challenge is common to various TA types (e.g., biologics, cell and gene therapies, small molecules) and routes of administration (e.g., central delivery directly into the brain parenchyma or cerebrospinal fluid [CSF] vs systemically into a blood vessel or organ). This opinion paper describes major patterns of CNS gliosis that may be seen during nonclinical safety studies and offers my perspective regarding options for interpreting and communicating the implications of such glial findings in documents slated for inclusion in regulatory filings to support human risk assessment.
Patterns of Gliosis in the CNS
Several variants of gliosis may be recognized in the CNS of animals in routine formalin-fixed, paraffin-embedded, 4- to 5-µm-thick tissue sections. Diagnostic terminology for these toxicologic pathology findings has been standardized in recent years under the auspices of the INHAND (International Harmonization of Nomenclature and Diagnostic Criteria for Lesions) Project. The INHAND term “gliosis, not otherwise specified” (gliosis, NOS), is applied to findings in which hypertrophy (cell enlargement) and/or hyperplasia (cell proliferation) takes place during the course of CNS parenchymal repair by resident, nonneoplastic astrocytes or microglial cells. 16 This diagnosis is used for findings evaluated in hematoxylin and eosin (H&E)-stained sections only as specific glial cell types typically cannot be identified definitively based solely on cytoarchitectural features showcased by this stain. The INHAND term “astrocytosis” (common alternate designation: “astrogliosis” 33 ) is used when the involved nonneoplastic cells have been positively identified as astrocytes using either cytoarchitectural characteristics in H&E-stained sections (e.g., gemistocytic [enlarged and eosinophilic] morphology) or through the increased expression of glial fibrillary acidic protein (GFAP) or another astrocyte marker.16,35 Similarly, the INHAND term “microgliosis” is used when the nonneoplastic cells have been confirmed as microglial cells using either cytoarchitectural features in H&E-stained sections (e.g., microglial nodules comprised of elongated [crescentic] cells; Figure 1) or by increased expression of ionized calcium-binding adaptor molecule 1 (Iba1, also known as allograft inflammatory factor 1) 36 or a comparable microglial marker.16,35 The GFAP and Iba1 methods used in nonclinical safety studies are routine immunohistochemical procedures. 5 The INHAND term “hyperplasia, glial cell” has been defined in the INHAND lexicon as the specific diagnosis for local, noninvasive accumulation of preneoplastic glial cells. 17 This rare finding is differentiated from nonneoplastic glial responses based on animal age (glial hyperplasia generally occurs in older animals [12 months or more for rodents]); lesion appearance (as foci with circumscribed dimensions, indistinct borders, and often large-sized cells); and low cell density (substantial neuropil separating the hyperplastic cells). 17 Discrimination of glial hyperplasia from gliosis NOS may be difficult in borderline cases. The vast majority of microscopic glial findings in nonclinical safety studies are nonneoplastic responses, so the remainder of this opinion paper is confined to addressing challenges related to characterization and interpretation of gliosis NOS, astrocytosis, and microgliosis.
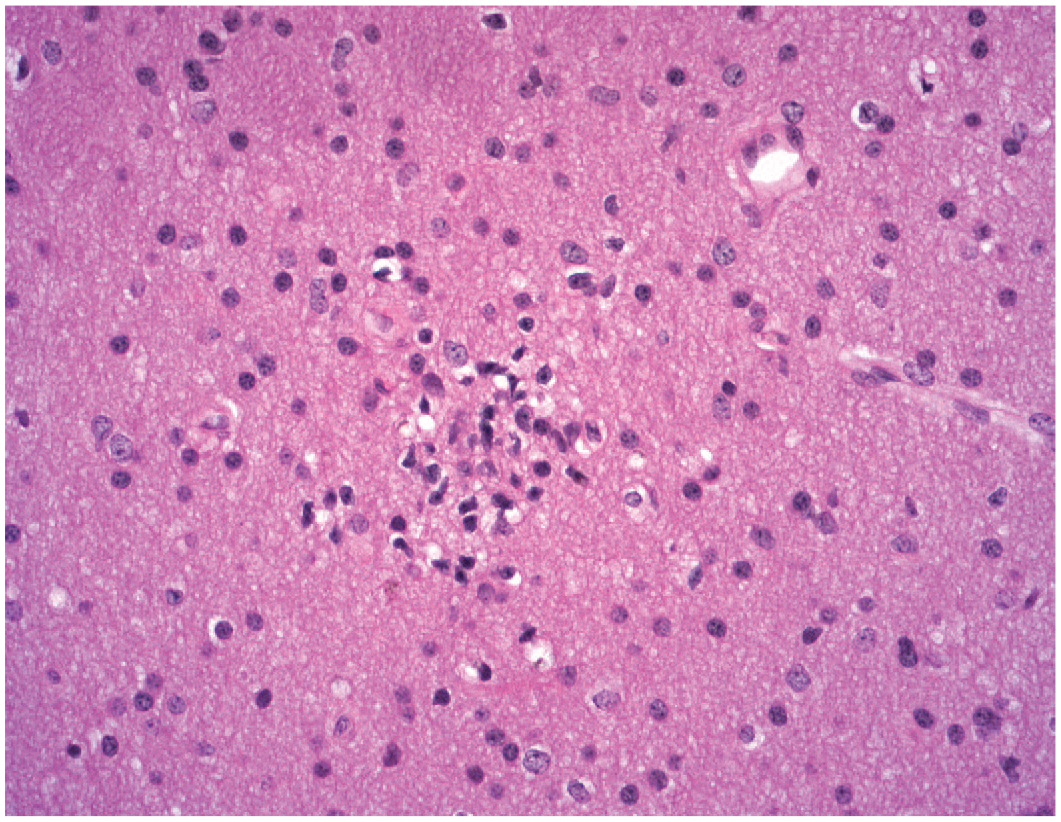
Gliosis as a small, isolated, incidental focus (INHAND diagnosis: “gliosis, NOS”) in the internal capsule of the brain. The elongated shapes of nuclei in this cell cluster are consistent with a microglial origin. The parenchyma is intact but exhibits minimal vacuolation (tiny, clear, white, irregular to oval spaces) adjacent to some of the glial cells. Study design: juvenile control beagle dog. Stain: hematoxylin and eosin. INHAND indicates International Harmonization of Nomenclature and Diagnostic Criteria for Lesions; NOS, not otherwise specified.
Glial Responses Associated With Visible Structural Changes to Neural Parenchyma
Structural disruption of one or more components comprising the CNS parenchyma (i.e., neurons, their neurites [axons and dendrites], and myelin) clearly serves as a stimulus for inciting a glial reaction. Such structural effects may result from exposure to a neuroactive (“neurotoxic”) TA given by any route of administration. However, TA-induced structural changes may be magnified by concomitant physical trauma if the administration procedure uses a semi-rigid (e.g., polyurethane catheter) or rigid (e.g., metal needle) injection device to directly deliver the TA into the CNS parenchyma or CSF. Glial reactions associated with pharmacological activity of a TA tend to occur at consistent sites among similarly treated animals. Bilateral TA-related findings in the CNS are often asymmetric in terms of the size and/or cell density of glial foci (due to regional differences in glial reactivity and not issues with tissue sampling).
The morphological appearance of damage-associated glial reactions in the CNS may assume one of several (often overlapping) patterns when evaluated by bright-field light microscopy. Degeneration/necrosis of neurons or nerve fibers may be obvious in the absence of visible changes in glial numbers or morphology in H&E-stained sections (Figures 2A and 2B) while serial sections processed to highlight a glial cell–specific biomarker may reveal a concurrent, equally pronounced glial reaction (Figure 2C). In other instances, H&E-stained sections may exhibit variable disruption of the neural parenchyma while the most obvious finding is increased tissue cellularity due to the accumulation of glial cells (INHAND diagnosis: gliosis, NOS) and/or incoming leukocytes (INHAND diagnoses: “infiltration” if the parenchyma is not visibly injured, “inflammation” if leukocyte influx is associated with structural damage). Special procedures to detect cell type-specific biomarkers are useful in characterizing the glial and leukocyte populations in such complex lesions (Figures 2C and 3). Severe damage resulting in tissue dissolution (i.e., liquefactive necrosis) is associated with glial responses ranging from accumulation of lipid-laden phagocytes (“gitter” cells), which arise from reactive microglial cells responding to neuroaxonal and/or synaptic terminal disruption,37,38 to production of fibrous connective tissue (so-called “glial scars”) by reactive astrocytes (Figure 4). 39 In such instances, the study pathologist retains the discretion to either apply an INHAND diagnosis that describes one principal finding (e.g., “accumulation, phagocytes”) while providing other information in a comment appended to the diagnosis or to apply a tiered term that integrates many structural details of the finding at once (e.g., “accumulation, phagocytes, with fibrosis, associated with foreign material”). I typically use the first approach as it effectively captures the gist of the change and simplifies the data tables for microscopic findings. Reactive (nonneoplastic) glial cells may be seen within and around neural neoplasms, including primary brain tumors of glial origin (Figure 5). In general, the secondary glial reaction is not diagnosed as a unique finding because the important lesion is the neoplasm.
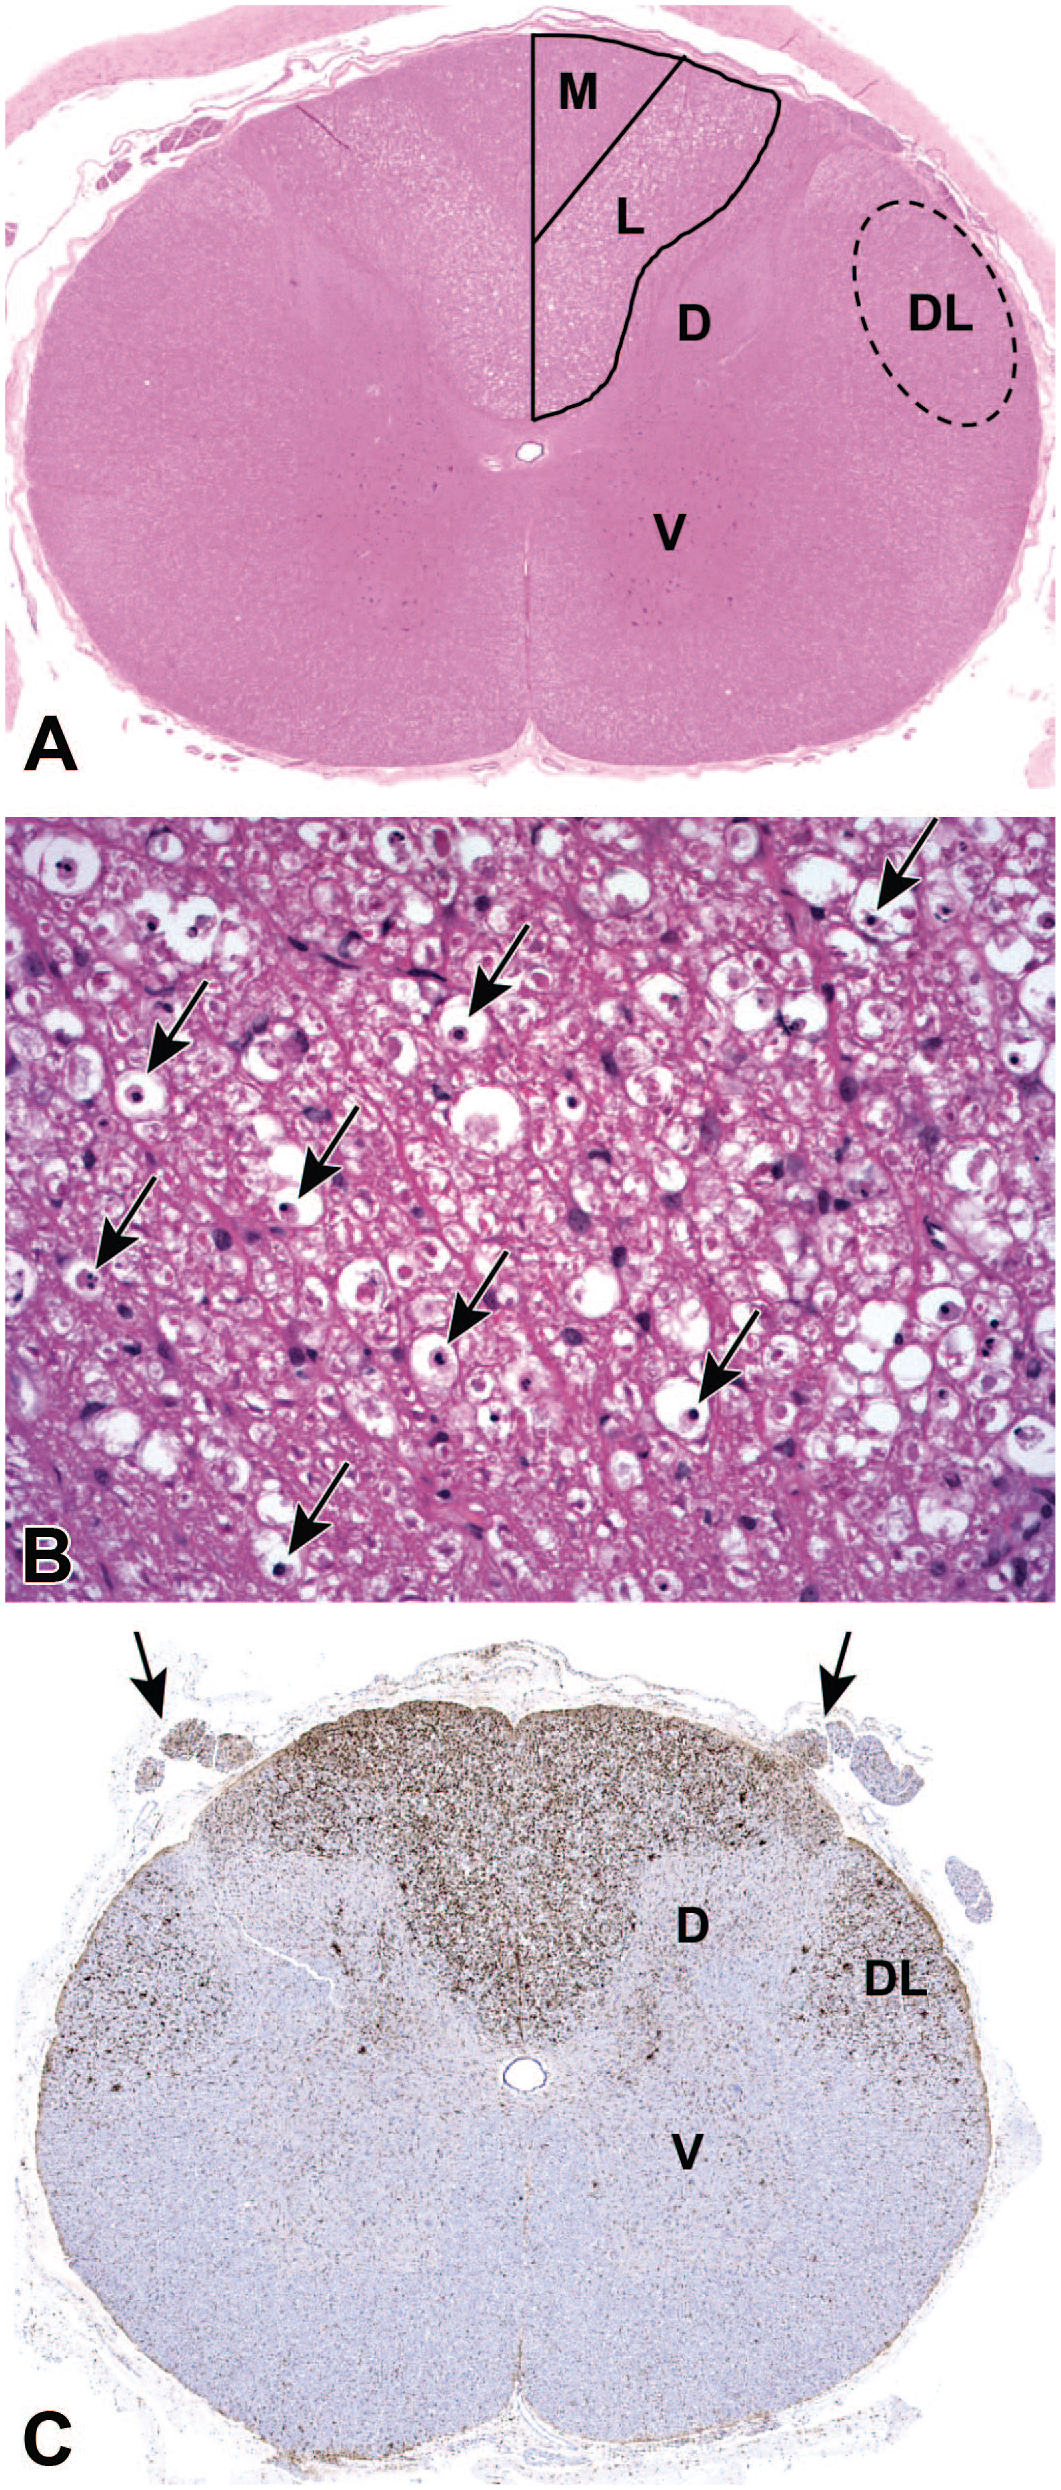
Gliosis associated with test article–related nerve fiber degeneration in the spinal cord. (Panel A) Nerve fiber degeneration and loss is indicated by widespread vacuolation in the white matter tracts of the dorsal (posterior) funiculus, more prominently in the lateral fasciculus (L, the site of DRG sensory axons associated with the forelimb) than in the medial fasciculus (M, the location of DRG sensory axons related to the hind limb) and dorsolateral aspect of the lateral funiculus (DL, the distribution of axons arising from dorsal horn interneurons that relay sensory signals originating from the DRG). (Panel B) High-magnification view of the dorsal funiculus (specifically the lateral fasciculus) white matter demonstrating multiple large white spaces (i.e., voids resulting from nerve fiber degeneration), many of which harbor lipid-laden phagocytes (“gitter” cells [arrows]) that are scavenging axon and myelin sheath debris. (Panel C) Microgliosis, shown by cell enlargement (nearly invisible at this magnification) with enhanced regional expression of the microglial marker Iba1, related to DRG sensory axon degeneration in the dorsal and lateral funiculi of the spinal cord and their associated dorsal spinal nerve roots (arrows). Bilateral symmetry of Iba1 labeling is consistent with a test article–related effect while the widespread distribution (i.e., “marked” severity) is indicative of a substantial secondary microglial reaction to a pronounced (and adverse) primary event affecting nerve fibers. Scattered Iba1-positive microglial cells also are evident in the gray matter (mainly in the dorsal horn [D]) in the interneuron layers that feed axons into the DL portion of the lateral funiculus. Study design: juvenile cynomolgus macaque given a single intrathecal injection in the lumbar cistern of an unspecified gangliotoxic agent. Stains: H&E (Panels A and B) and anti-Iba1 immunohistochemistry (Panel C). [Note: The brown chromogen used in Panel 2C and subsequent figures is 3,3′-diaminobenzidine (DAB)]. D indicates dorsal (posterior) horn gray matter; DRG, dorsal root ganglion; H&E, hematoxylin and eosin; Iba1, ionized calcium-binding adaptor molecule 1; V, ventral (anterior) horn gray matter.
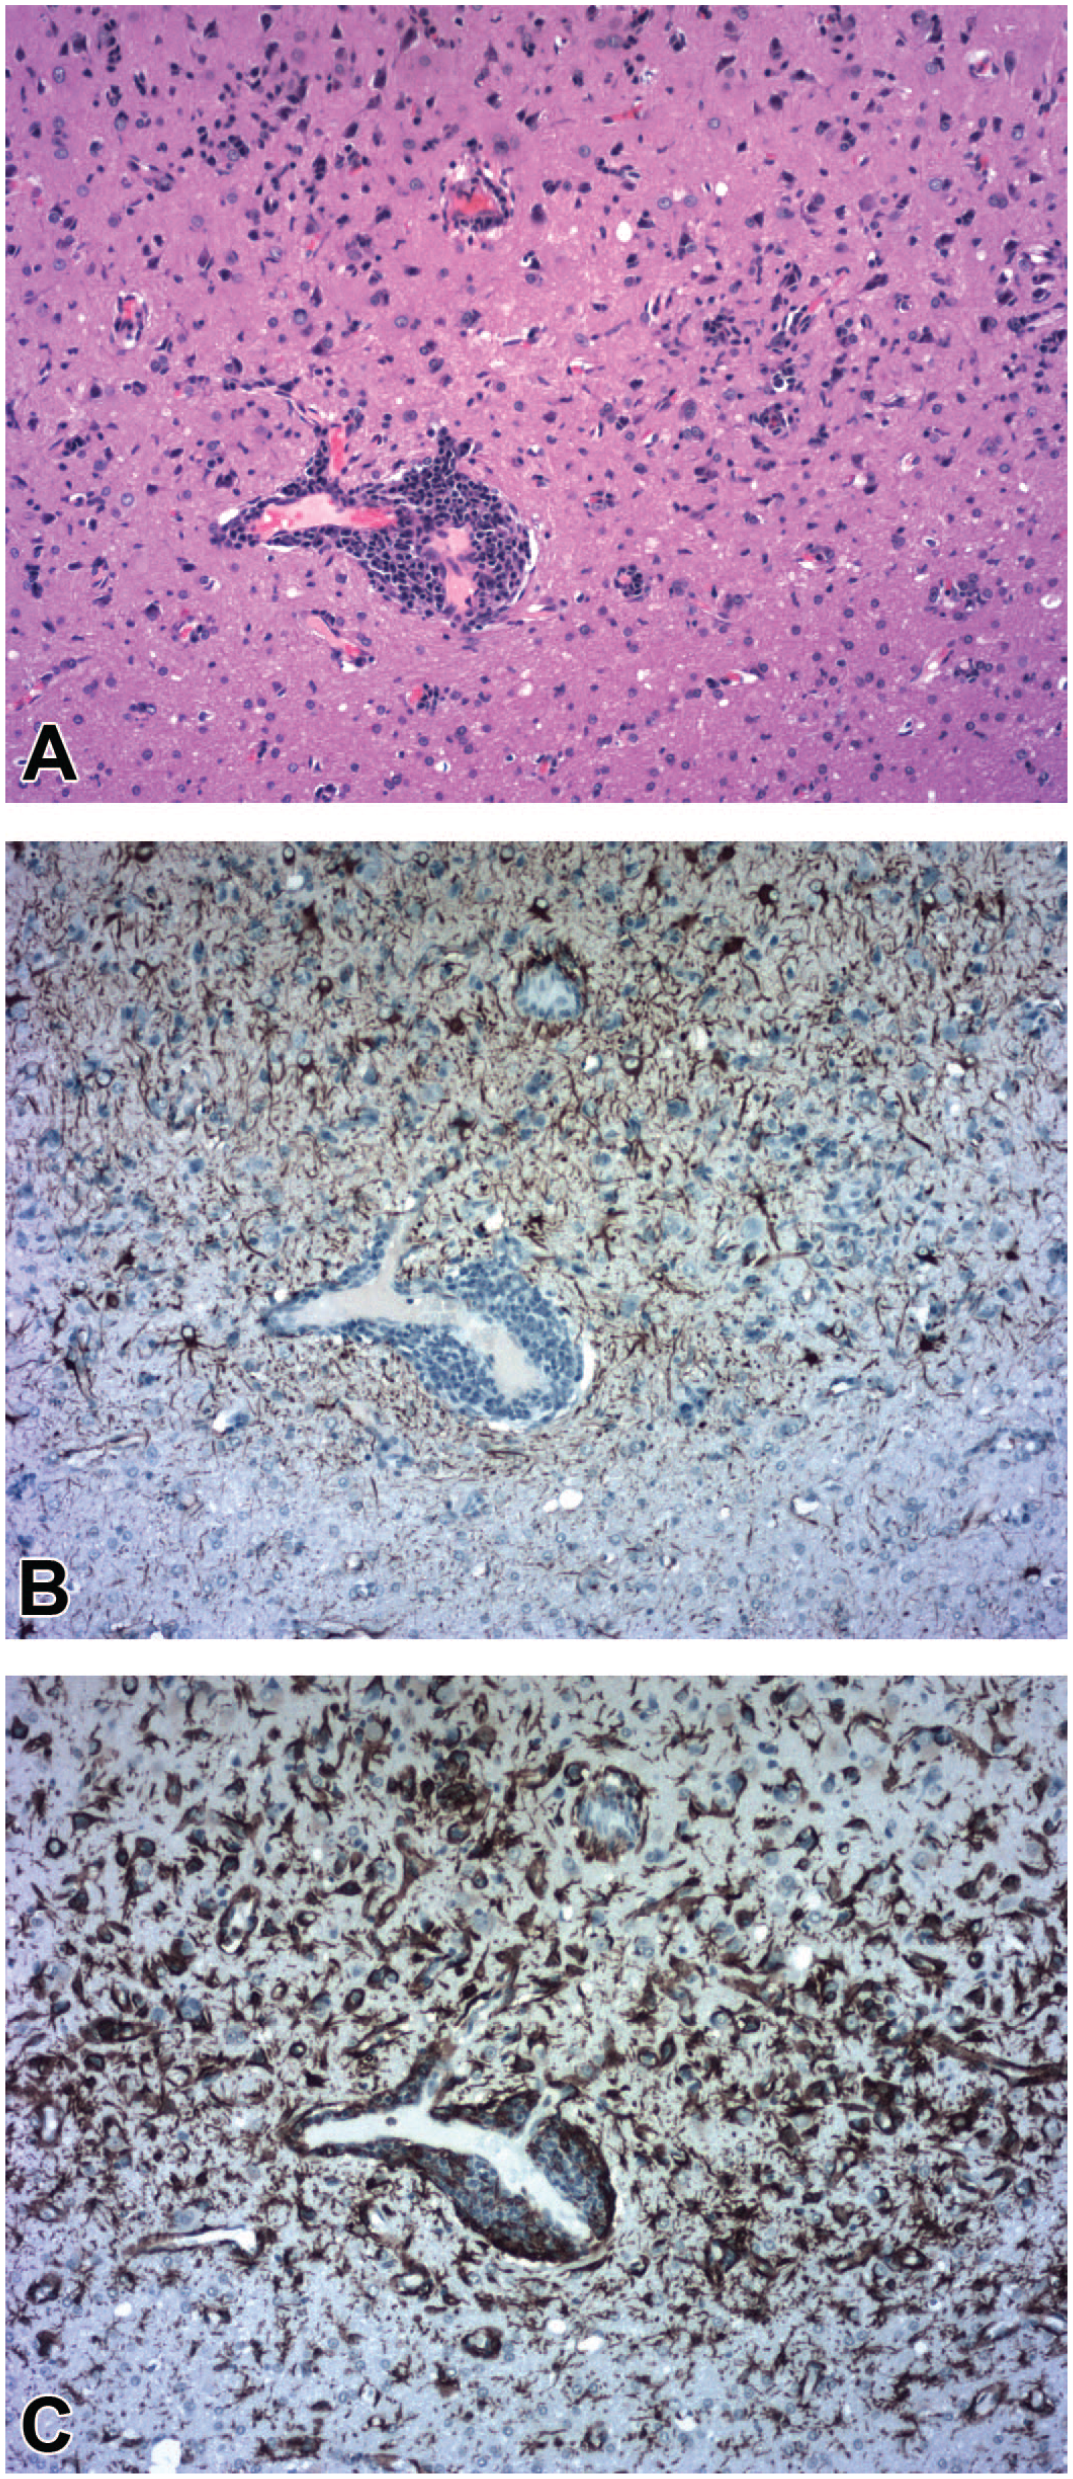
Gliosis associated with procedure-related regional mononuclear cell inflammation and parenchymal degeneration associated with an injection track (i.e., localized physical disruption) penetrating the deep cerebral cortex. (Panel A) Multiple glial cell clusters are evident (especially in the upper right quadrant) in a neuropil field characterized by scattered small white vacuoles indicative of local nerve fiber degeneration. Glial accumulation (INHAND diagnosis: “gliosis, NOS”) is apparent as a more diffuse minimal increase in neuropil cellularity associated with an obvious perivascular leukocyte cuff (INHAND diagnosis: “Infiltrate, mononuclear cell”) encircling a capillary just to the left of the image center. (Panel B) Reactive astrocytes (INHAND diagnosis: “astrocytosis,” in the affected upper half of the image compared to the unaffected lower half) appear as normal numbers of regularly spaced stellate glial cells with nonoverlapping fields of branched processes that exhibit brown cytoplasmic labeling for the astrocyte marker GFAP. (Panel C) Reactive microglial cells are seen in greater numbers (INHAND diagnosis: “microgliosis”) as brown-labeled clusters of elongated cells, often with overlapping fields of branched processes and/or arranged in variably sized aggregates, with enhanced expression of the microglial marker Iba1; labeled cells in the leukocyte cuff are infiltrating macrophages, which are derived from the same embryonic lineage as microglial cells. Study design: juvenile cynomolgus macaque given a single intracerebroventricular injection of an unspecified gene therapy agent into the lateral ventricle. Images are acquired from serial sections stained with H&E (Panel A) or immunolabeled to demonstrate GFAP (Panel B) or Iba1 (Panel C). GFAP indicates glial fibrillary acidic protein; H&E, hematoxylin and eosin; Iba1, ionized calcium-binding adaptor molecule 1; INHAND, International Harmonization of Nomenclature and Diagnostic Criteria for Lesions; NOS, not otherwise specified.
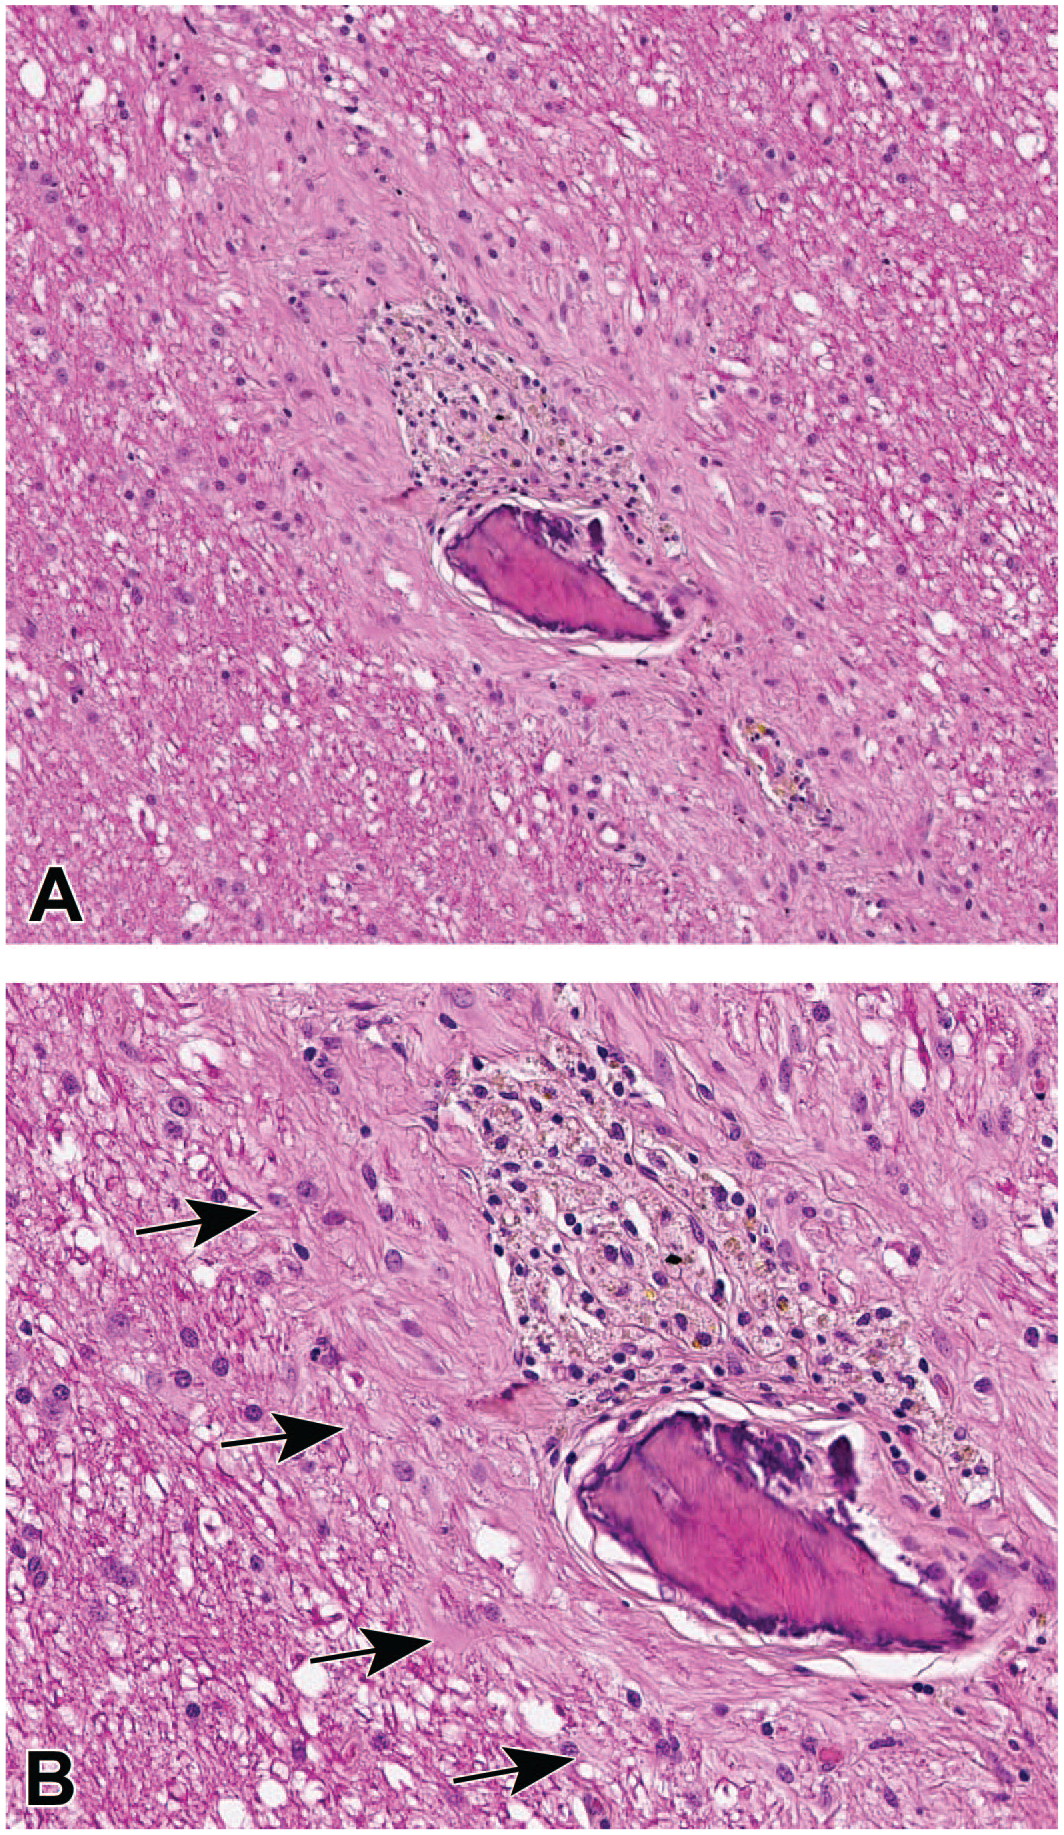
Gliosis forming a barrier (a “glial scar” [INHAND diagnosis: “gliosis, NOS”]) to isolate foreign material along the course of a linear injection track in the brain white matter. (Panel A) A small triangular bone fragment is bounded on one side (above) by a triangular cluster of vacuolated and pigmented phagocytes (microglia-derived “gitter” cells), and the whole site is encircled by a thick rim of dense connective tissue. (Panel B) High-magnification view of the same field as depicted in Panel A showing the interface (arrows) that separates the rim of gliosis (right) from the structurally intact parenchyma (left); the glial scar is characterized by a thick layer of disorganized parallel fibrils containing slightly increased numbers of plump glial cells. Study design: juvenile cynomolgus macaque administered a single intraparenchymal injection of vehicle into a deep brain nucleus. INHAND indicates International Harmonization of Nomenclature and Diagnostic Criteria for Lesions; NOS, not otherwise specified.
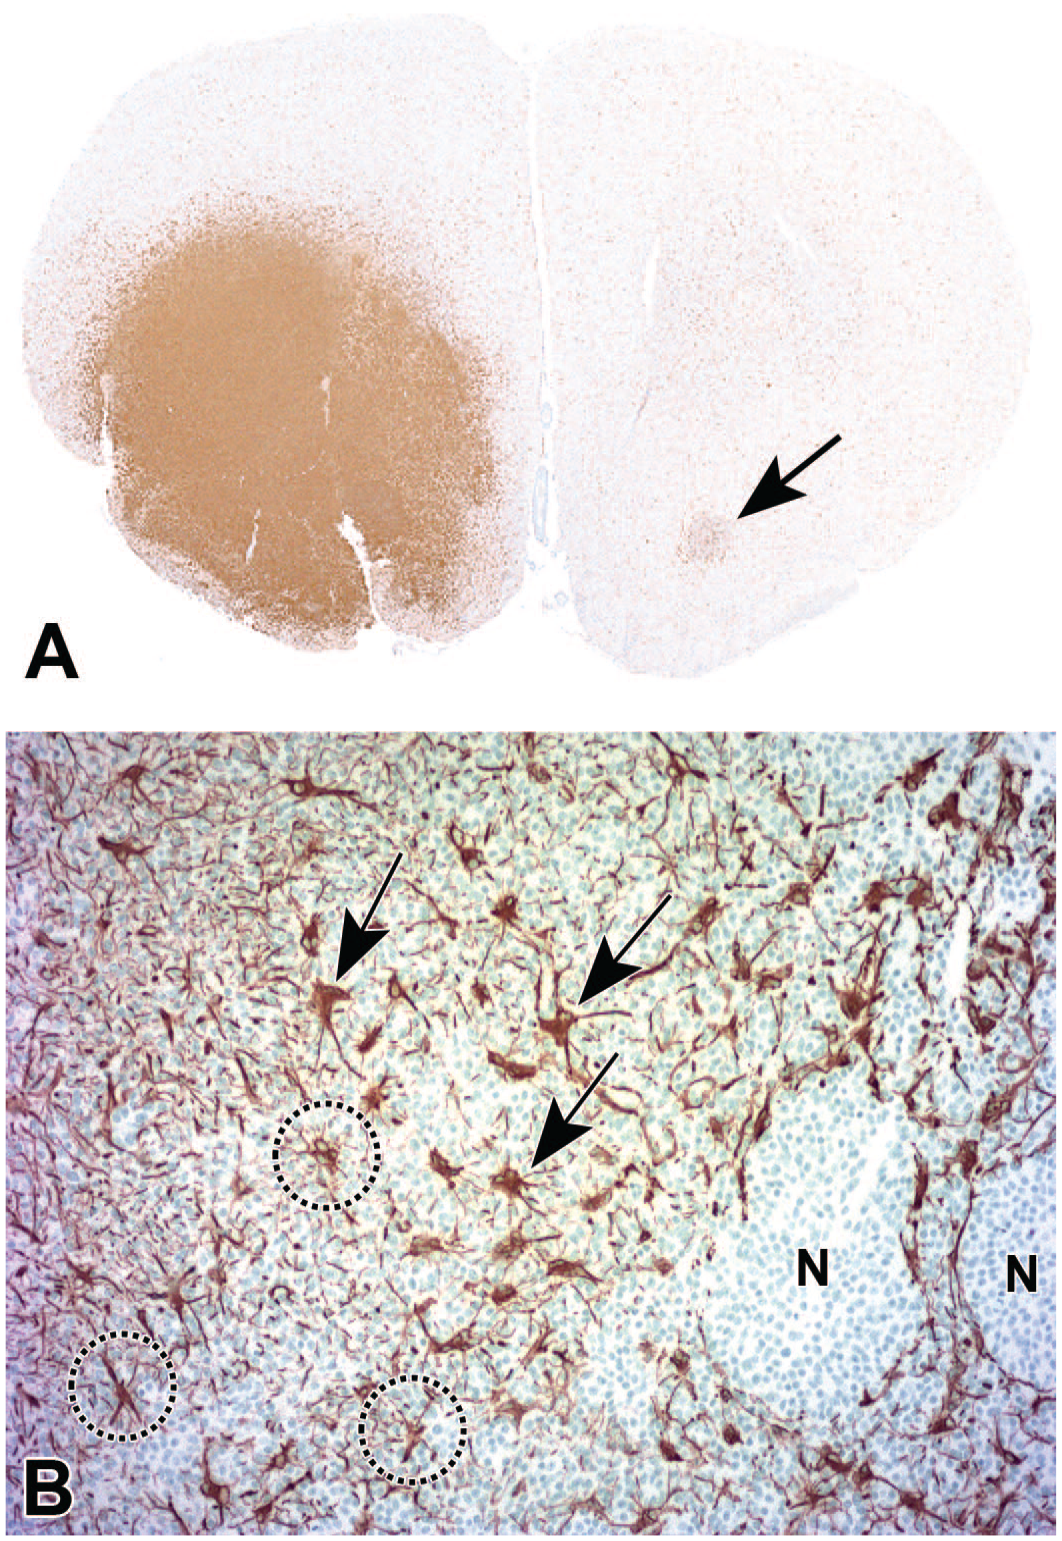
Gliosis associated with a spontaneous glial neoplasm (INHAND diagnosis: “microglial tumor, malignant”) in the striatum (ventral forebrain). (Panel A) Focally extensive expansion of a microglial-derived tumor, indicated by strong labeling for Iba1. A small, faintly labeled region of Iba1-positive cells in the contralateral striatum (arrow) is consistent with either altered interhemispheric neural input from the contralateral (tumor-disrupted) striatum or an incidental focus of reactive microglial cells, where the latter finding may be seen in brains of animals (including controls) of all species, but especially rodents, as a terminal change in the absence of visible structural damage in the involved neural parenchyma. (Panel B) High-magnification depiction of the tumor margin from a serial section showing two phenotypes of GFAP-positive astrocytes within the tumor: enlarged (“reactive” [arrows]) and normal-sized (“homeostatic” [circled]) cells. The processes of the astrocytes do not overlap, indicating that each cell is preserving its individual domain of influence. Coalescing nests of neoplastic microglial cells (N) are not labeled with GFAP, indicating that the cancer stem cells for this tumor have not followed an astrocytic differentiation program. Study design: 2-year-old control Sprague Dawley rat. GFAP indicates glial fibrillary acidic protein; Iba1, ionized calcium-binding adaptor molecule 1; INHAND, International Harmonization of Nomenclature and Diagnostic Criteria for Lesions.
In all these settings, structural changes (e.g., greater cell size [hypertrophy], increased cell numbers [hyperplasia]) and altered molecular signatures (e.g., enhanced GFAP or Iba1 expression) indicate that the reactive glial cells in the vicinity of the damaged neural parenchyma have shifted physiologically from performing homeostatic (maintenance and tissue surveillance) activities to a functionally altered state capable of either protecting or further disrupting the damaged tissue. In nonclinical safety studies, the presence of TA-related parenchymal injury (e.g., damage to neurons, neuronal processes, and/or myelin) should serve as the primary determinant driving decisions regarding adversity. Accordingly, the microscopic evaluation of sites for overt CNS parenchymal damage need not seek to differentiate whether the reactive glia are engaged in neuroprotective versus tissue-destructive tasks.
Glial Responses in the Absence of Visible Structural Changes to Neural Parenchyma
Glial reactions can occur in the CNS in the absence of any discernible disruption to the parenchyma. Such responses may be associated with TA exposure or occur as incidental background findings as neither of these scenarios involves physical trauma to the neural tissue. Glial responses that develop in the CNS in the absence of anatomic evidence for either neuroaxonal and/or myelin damage exhibit two basic patterns, as described below.
In the first variant, the morphological appearances of glial cells and their processes appear to be within normal limits in H&E-stained sections. Accordingly, glial responses of this kind are detected only in specially processed sections immunolabeled to highlight glial cell type–specific markers (GFAP or Iba1) (Figure 6). For example, application of glial markers may reveal increases in the prominence of glial processes (Figure 6A) and/or glial cell numbers (Figure 6B). These changes are given the specific INHAND diagnosis dictated by the glial marker expressed by the particular cell population (i.e., “astrocytosis” [Figure 6A] or “microgliosis” [Figure 6B]). Again, TA-related glial reactions that occur in the absence of visible parenchymal injury often affect consistent sites for multiple animals that receive a specific TA at a particular dose by a given route of administration. For neuroactive TA injected into the CSF or systemically, glial reactions often develop bilaterally, although such findings may be asymmetric in terms of severity.
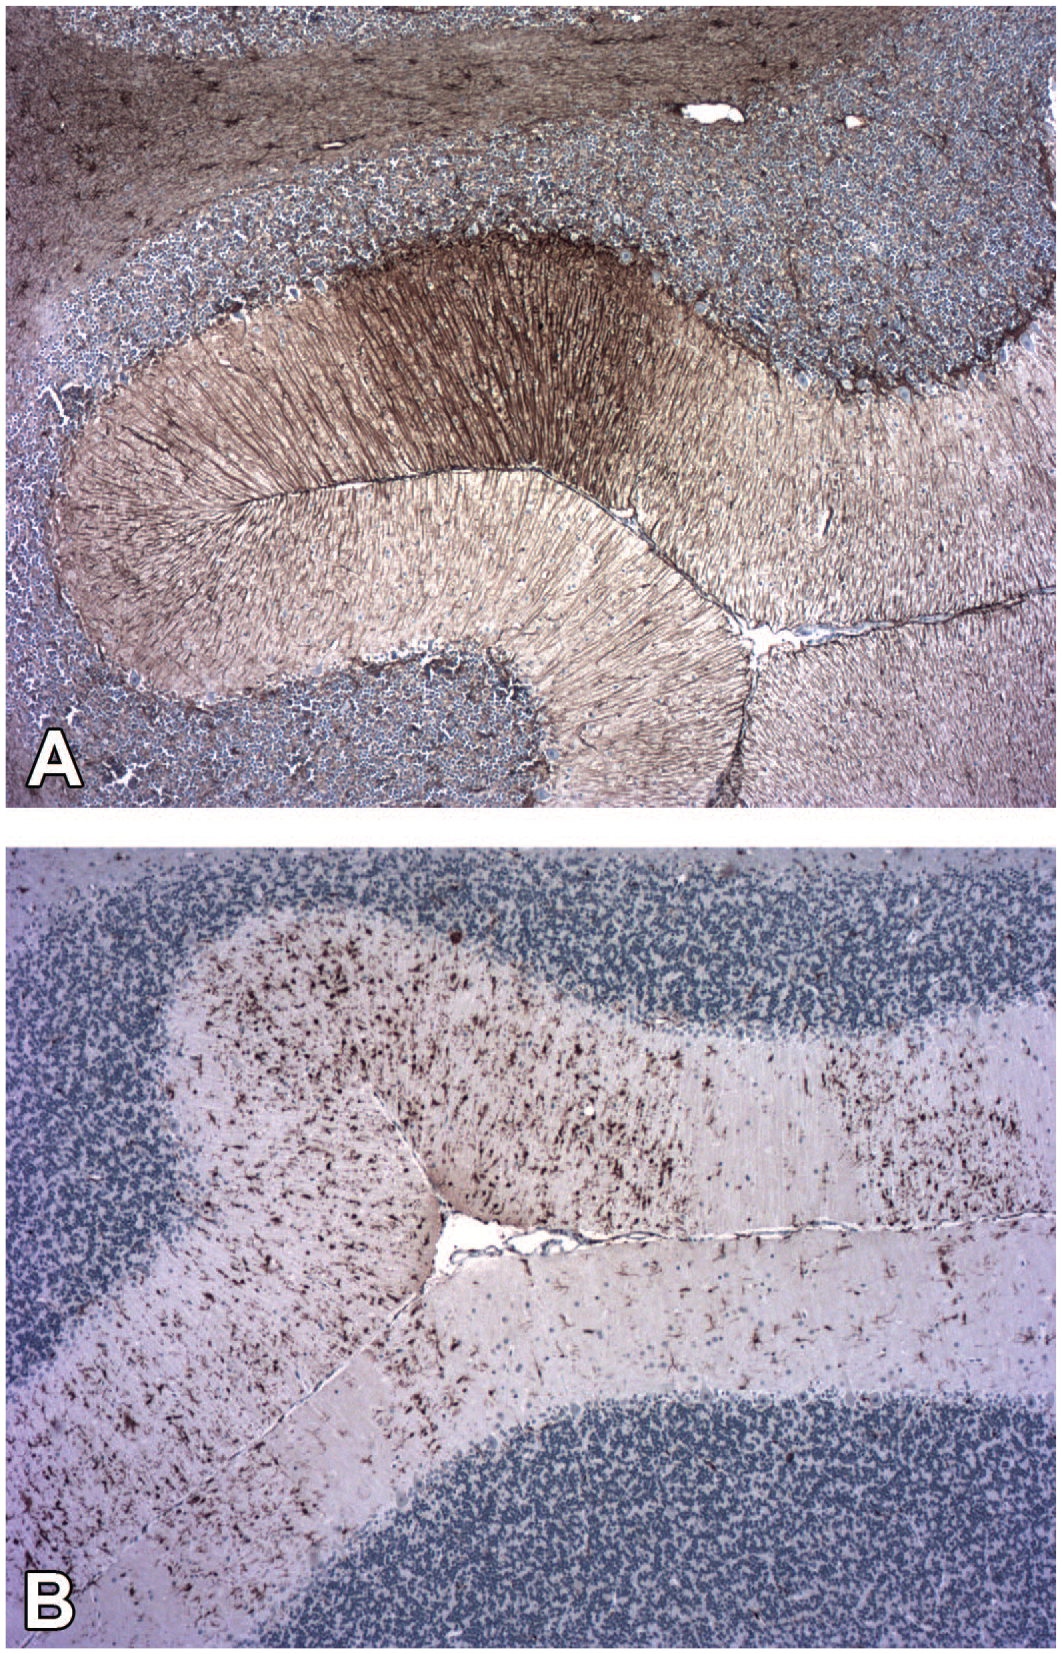
Multilineage gliosis in the absence of visible neuroaxonal degeneration/necrosis within the molecular layer of the cerebellar cortex. (Panel A) Reactive astrocytes (INHAND diagnosis: “astrocytosis”) are seen as a localized quadrilateral focus of parallel cell processes with strong GFAP immunolabeling. (Panel B) Reactive microglial cells (INHAND diagnosis: “microgliosis”) are apparent as increased numbers of enlarged Iba1–immunolabeled cells and cell aggregates dispersed throughout the region. In the affected animals, reactive glial cells were totally (reactive astrocytes) or primarily (reactive microglial cells) confined to the tissue fields shown in these two panels. Study design: juvenile cynomolgus macaque that received one intrathecal injection in the lumbar cistern of an unspecified gene therapy agent. GFAP indicates glial fibrillary acidic protein; Iba1, ionized calcium-binding adaptor molecule 1; INHAND, International Harmonization of Nomenclature and Diagnostic Criteria for Lesions.
In the second pattern, isolated glial foci (INHAND diagnosis: “gliosis, NOS”) may be detected as an incidental background finding in H&E-stained sections. Such foci may be observed anywhere in the brain where they appear as loosely packed aggregates comprised of 10 to 25 cells, but sometimes ranging up to 100 cells (Figure 1); less often, similar but smaller aggregates (10-25 cells) may be observed in the spinal cord. Glial cells in these foci usually have small, dark basophilic, elongate nuclei consistent with a microglial lineage (Figure 1), but in some cases foci also harbor larger, pale basophilic, oval to round nuclei consistent with an astrocytic origin. The associated parenchyma may be honeycombed by occasional small, clear, colorless vacuoles (i.e., local degeneration; Figure 1) but is often structurally unaltered. Typically, only 1 or 2 incidental glial foci are seen in a given animal for common nonclinical species, and the incidence in young adult animals is low (≤1% in rodents, up to 5% in nonrodents depending on the species). My hypothesis for the disparate background incidences of gliosis across species is that spontaneous glial foci are more frequent in nonrodents because more tissue is available for evaluation due to the larger brain size.
A special case of the second variant is the occurrence of incidental glial foci that are invisible in H&E-stained sections but visible in sections labeled to demonstrate a glial marker. This uncommon finding is most often seen in the brains of rodents, including control animals, but does occur in other species; such foci occur in the cerebral cortex, basal nuclei, hypothalamus, or ventral midbrain and occasionally in the spinal cord (usually in the white matter). These foci are evident as loosely packed clusters of faintly (Figure 5A, arrow) to strongly Iba1-positive microglial cells, typically without a corresponding accumulation of GFAP-positive astrocytes. The pathogenesis of these spontaneous glial foci is not known. Microglial cells are now acknowledged as the most dynamic glial cells of the healthy mature CNS.26,40 Thus, one conceivable mechanism for their genesis in control animals is that microglial cells are activated soon after death in response to cell or tissue hypoxia. 41 Another hypothesis is that manipulating unfixed brain tissue during the necropsy causes stressed neural cells to acutely express damage-associated molecular patterns (DAMPs) that invoke a microglial response. This latter hypothesis is based on the proclivity of microglial cells to shift from a homeostatic to reactive phenotype based on shifts in microenvironmental conditions 42 as well as reports that microglia in neural tissues subjected to elevated parenchymal pressure undergo morphological changes (e.g., cell body enlargement, process retraction) indicative of activation. 43
Implications of Glial Reactions in the CNS
Astrocytes and microglial cells fulfill many complex and essential functions needed to maintain CNS parenchymal homeostasis in health, adapt to altered physiological conditions during stress, and resolve parenchymal injury in the face of disease. Both astrocytes25,29,33,44,45 and microglial cells26,32,34,40,46 are regionally heterogeneous in terms of structure and function in health. Interestingly, glial heterogeneity is higher in brain regions prone to degeneration following disease or TA exposure.29,40 Astrocytes33,44 and microglia24,26 both undergo context-specific structural and functional changes that fit them to preserve or remove CNS tissue damaged by various stimuli, including exposure to neuroactive TAs.
Our current understanding of glial biology is that the traditional dichotomous view of astrocytes and microglial cells as either fully “resting” or entirely “activated” is no longer tenable. Instead, resting (or “homeostatic”) glia are among the most active cells in the CNS during health. Moreover, glial responses during physiological stress or frank disease signify a shift to one of many potential differentially activated (or “reactive”) states along a continuum rather than an all-or-none conversion to a single fully activated state.26,33,44 In tissue sections (labeled to demonstrate glial biomarker expression) from common test species, microglial reactions typically become visible more rapidly (within hours to 7 days after stimulus) than astrocytic responses (approximately 7-14 days after stimulus). If a stimulus (e.g., acute disease or exposure to a TA) is confined to a single moment in time or is limited in length, glial responses in the CNS will gradually reverse, with reactive (Iba1-overexpressing) microglia receding quicker than reactive (GFAP-overexpressing) astrocytes. Chronic stimuli (disease, stress, and occasionally TA exposure) tend to sustain persistent, often wide-ranging astrocytic and microglial reactions.
Interpretation of glial responses in the presence of easily distinguished TA-related parenchymal damage (degeneration/necrosis, inflammation, etc.) is comparatively straightforward. Reactive glia (astrocytes and/or microglial cells) often accompany overt TA-related structural damage to neurons, neurites (axons or dendrites), and/or myelin. In such cases, reactive glia often substantially increase the sizes and numbers of both their bodies and their processes, which results in overlapping of the tissue expanse supported by each glial cell 33 (Figures 3A, 3C, and 6B). Complex CNS lesions are usually diagnosed based on the character of the parenchymal disruption (which is irreparable) rather than the nature of the glial reaction (which may regress over time if the parenchymal insult is resolved). If both changes are present, the parenchymal damage and the glial reaction typically should receive separate diagnoses as these associated responses both inform interpretation of the finding. Importantly, however, the biological implications of a standalone glial reaction (i.e., unaccompanied by structural changes in the associated CNS parenchyma) should not be determined based solely on the severity grade. In rare cases, I have observed “marked” microgliosis affecting nearly an entire cerebral hemisphere of a neurologically normal control rat and interpreted the finding as an incidental postmortem change. Similarly, I have rarely seen “mild” gliosis localized bilaterally to a consistent brain domain of several neurologically normal, TA-exposed rats of a given dose group and interpreted the finding as a TA-induced change. In such cases, adversity generally should be assigned based on the presence or absence of parenchymal damage and not the mere existence of a visible glial change.
In contrast, interpretation of glial responses that develop in the absence of TA-related parenchymal damage is often quite challenging, for several reasons. Increased expression of GFAP in reactive astrocytes and/or Iba1 in reactive microglial cells represents clear molecular/structural evidence of a shift away from a homeostatic cell state toward an alternative functional state. The majority of glial biologists currently consider that such differentially activated states reflect the adoption of an adaptive phenotype devoted to parenchymal protection if the extent of the glial reaction (as defined by the size of the affected area and glial cell density) is modest.24,26,33,44 Isolated glial responses (i.e., in the absence of structural evidence for parenchymal destruction) to TA exposure that are characterized by minimal to mild increases (focal or multifocal and variably bilateral [asymmetric or symmetric]) in GFAP and/or Iba1 expression, minimal or no augmentation of glial cell numbers, and no genesis of overlapping processes among neighboring glial cells (Figure 5B) typically are interpreted as a nonadverse reaction rather than as evidence of glial-driven neurotoxicity. This interpretation is consistent with currently recommended practices for making adversity decisions, which state that TA-related adaptations with no deleterious effects on the test species should be considered nonadverse in the context of the particular toxicity study. 47 Such minimal to mild, glia-predominant reactions do not progress over time in the absence of ongoing parenchymal damage.
Conclusion and Recommendations
Glial responses that arise following exposure to a TA, especially if delivered using methods that unavoidably elicit CNS parenchymal damage (e.g., intracerebroventricular or intraparenchymal injections or infusions where brain tissue is physically penetrated by a catheter or needle), must be interpreted with great care. Both astrocytes and microglial cells are intrinsically quite active. Therefore, any microenvironmental disturbance will be detected rapidly, and the involved glial cells will initiate a molecular program that moves them from a homeostatic state to one among a continuum of differentially activated states capable of protecting the injured tissue and/or removing the inciting stimulus. For this reason, the mere presence of a CNS glial reaction cannot be automatically interpreted as definitive evidence for TA-induced tissue injury (i.e., neurotoxicity). Instead, biological implications of glial reactions must be considered using a nuanced weight-of-evidence approach when rendering adversity decisions.
Pathologists and their varied audiences (e.g., toxicologists, regulatory reviewers) will benefit by providing more detailed descriptions of glial reactions seen during nonclinical studies. Such expanded reporting might be implemented simply by adding a very short list of structural features to the current compilation of diagnoses and severity grades. For example, inclusion of a short table with specific structural criteria for grading glial-predominant responses or incorporating one or a few brief sentences in the narrative (to define such fundamental cell attributes as cell aggregation vs dispersion and overlapping vs contiguous fields of cell processes) would provide important supporting information for interpreting the biological relevance of TA-related glial reactions that develop in the absence of substantial (i.e., inherently adverse 22 ) parenchymal disruption. My experience has shown that including such minor embellishments in a pathology report often provides important additional context to support decisions regarding adversity and human risk.
Footnotes
Acknowledgements
The author gratefully thanks his neuropathologist colleagues Dr Elizabeth Galbreath and Dr Robert Garman for their critical conceptual review and also his constant collaborator Ms Beth Mahler for her assistance in optimizing the figures for this paper.
Correction (June 2023):
The caption for figure 2 has been updated since its original publication.
Declaration of Conflicting Interests
The author declared no potential conflicts of interest with respect to the research, authorship, and/or publication of this article. The analysis, conclusions, and opinions expressed in this article are solely those of the author.
Funding
The author received no financial support for the research, authorship, and/or publication of this article.
References
Supplementary Material
Please find the following supplemental material available below.
For Open Access articles published under a Creative Commons License, all supplemental material carries the same license as the article it is associated with.
For non-Open Access articles published, all supplemental material carries a non-exclusive license, and permission requests for re-use of supplemental material or any part of supplemental material shall be sent directly to the copyright owner as specified in the copyright notice associated with the article.