
Abstract
Gliosis, including microgliosis and astrocytosis, can be challenging to interpret in nonclinical studies. Incidences of glial foci in brains and spinal cords of control rats and nonhuman primates (NHPs) were reviewed in the historical control databases from two contract research organizations, including one specializing in neuropathology. In the brain, minimal to mild (grades 1-2) microgliosis was the most common diagnosis, especially in NHPs, although occasional moderate or marked microgliosis (grades 3 and 4) was encountered in both species. Microgliosis was more common in the cerebral cortex, cerebellum, and medulla oblongata in both species and was frequent in the white matter (brain), thalamus, and basal nuclei of NHPs. Gliosis (“not otherwise specified”) of minimal severity was diagnosed in similar brain sub-sites for both species and was more common in NHPs compared with rats. Astrocytosis was most prominent in the cerebellum (molecular layer) of NHPs but was otherwise uncommon. In the spinal cord, microgliosis was most common in the lateral white matter tracts in rats and NHPs, and in the dorsal white matter tracts in NHPs. These data indicate that low-grade spontaneous glial responses occur with some frequency in control animals of two common nonclinical species.
Introduction
Gliosis within the central nervous system (CNS) is an indicator of glial responsiveness to altered conditions in the neural parenchyma.14,16 Such glial effects may represent adaptive responses to local microenvironmental conditions (e.g., antigenic stimuli or chronic stress); secondary glial reactions to tissue damage, such as neuronal necrosis, axonal fragmentation, or myelin disruption; or destructive responses in which glia participate in driving parenchymal injury.3-8
Interpretation of CNS glial cell responses observed during nonclinical toxicity studies is challenging because glia, especially microglia, are the most dynamic cell populations in the CNS; they are primed to respond to even subtle shifts in physiology and/or structural integrity of the neural parenchyma.8,14,18 Also, glial populations exhibit considerable heterogeneity in terms of numbers, morphology, and function across distinct brain sub-sites.11-13 These variables present a conundrum to pathologists deciphering the relevance of glial foci in animals administered novel test articles, especially in studies with (1) relatively small group sizes where glial responses are apparent in only a subset of animals in the group or (2) when extensive changes in glial marker expression occur in multiple CNS domains of a single animal.
A prior case illustrates the difficulties associated with making such decisions. Foci of gliosis (INHAND [International Harmonization of Nomenclature and Diagnostic Criteria] term = “gliosis, not otherwise specified [NOS]”) were observed in hematoxylin and eosin (H&E)-stained sections in association with higher localized expression of the immunohistochemical (IHC) markers ionized calcium-binding adaptor molecular 1 (IBA1; INHAND term = “microgliosis”) and/or glial fibrillary acidic protein (GFAP; INHAND term = “astrocytosis” [alternatively “astrogliosis” 16 ]) in brains of Wistar Han rats treated for 26 weeks with intermittent intravenous (IV) infusions of a human monoclonal antibody targeting an intra-neuronal protein. These foci were evident in various brain sub-sites and at various severity grades for at least one animal per group, including the concurrent controls. The need to differentiate a possible test article-related glial response from a spontaneous background change led to consultation with a team of three experienced neuropathologists who, in seeking to address this question, discovered the scarcity of available control data needed to provide a data-driven answer. A limited search of historical control data (HCD) covering 2 years from one neuropathologist’s institution determined that multiple brain and spinal cord sub-sites harbored these background foci, that microgliosis occurred spontaneously with some frequency while astrocytosis was rare, and that incidental gliosis typically was of minimal to mild extent but with more substantial microgliosis (moderate or marked) concentrated in the hippocampus compared with other CNS sub-sites (unpublished data). Accordingly, the current paper seeks to correct a paucity of literature on this subject by providing a more extensive review to document the incidence and severity of background glial responses (specifically gliosis NOS, microgliosis, and astrocytosis) in brains and spinal cords of control rats and nonhuman primates (NHPs) for oral and IV administration studies recorded in historical control databases of two large contract research organizations (CROs).
Methods
An analysis of the diagnoses “gliosis,” “microgliosis,” and “astrocytosis” in the brain and spinal cord of control rats (adults of various inbred strains and outbred stocks) and NHPs (juvenile and young adults of various species, but mainly cynomolgus macaques [Macaca fascicularis]) from two different sets of HCD, one containing data from 59 nonclinical oral and IV (injection or infusion) toxicity studies, and another containing data from 1135 oral and IV toxicity studies, was conducted. The CNS for these studies was sampled and processed according to currently accepted best practices. 2 All studies were approved in advance by the Institutional Animal Care and Use Committee (IACUC) of the test facilities performing the in-life portions of the studies and were conducted in accordance with relevant national regulations, the Guide for the Care and Use of Laboratory Animals, 8th edition for a US-based CRO site and the UK Animals (Scientific Procedures) Act 1986 and EU Directive 2010/63/EU for a UK-based CRO site.12,13
The first HCD involving 59 rat and NHP nonclinical oral and IV toxicity studies were collected during 7 consecutive years (2016-2022) by a CRO (designated CRO-1) specializing in neuropathology evaluation of nonclinical studies (Tox Path Specialists, LLC, which transitioned later to become the Neuropathology division of StageBio, Inc., Frederick, MD) composed of 2 to 5 American College of Veterinary Pathologists (ACVP) board-certified veterinary anatomic pathologists at any one time, with a total of 8 different pathologists represented over the entire time span. For studies in this database, the neuropathologists assigned diagnoses according to the following criteria. “Gliosis” (i.e., “gliosis, NOS”) was defined as an increase in the numbers and/or sizes of CNS glial cells (astrocytes, microglia, and/or oligodendrocytes) but without precisely identifying the involved cells; this diagnosis was made based on structural features evident in H&E-stained sections. 1 “Astrocytosis” was used for an increase in the numbers and/or sizes of GFAP-positive astrocytes, while “Microgliosis” was applied for an increase in the numbers and/or sizes of IBA1-positive microglial cells. These CNS (brain and spinal cord) diagnoses were often discussed among team pathologists to ensure the accuracy and diagnostic consistency of findings within and across studies.
The HCD were organized using Microsoft Excel (v2008) pivot tables and filtered to include only studies in which test articles were administered orally (by gavage or in the food or water) or IV (by bolus injection or infusion). The data were organized by animal species, route of administration, tissue (brain or spinal cord), tissue sub-site (if warranted), and severity grade. The severity grades were defined as normal (i.e., within normal limits, 0); minimal (grade 1, barely exceeds normal limits and is focal or sporadic), mild (grade 2, more readily apparent than minimal findings and focal or multifocal), moderate (grade 3, pronounced and focally extensive or multifocal), marked (grade 4, pronounced and affecting a prominent portion of the sub-site), or severe (grade 5, very pronounced and affecting most or all of the sub-site). The HCD were organized by species only since other demographic factors (e.g., NHP species and geographic origin, rat stock/strain, sex, age, and supplier) were not available.
Subsequently, specific glial diagnoses (i.e., “gliosis,” “astrocytosis,” or “microgliosis”) and their severity grades were recorded for the organ (brain, spinal cord) and (if available) the organ sub-site. The incidence (as a percentage) for each diagnosis was calculated per organ, and sometimes sub-site, as follows: percent of incidence = the count of a specific diagnosis per organ sub-site divided by the total number of the organ examined per study type using the appropriate stain or immunolabel for that diagnosis × 100. The assumption in performing these calculations was that all major sub-sites of the brain or spinal cord were examined for the appropriate organ where a glial diagnosis was recorded.
The second HCD involving 1135 rat and NHP nonclinical oral and IV studies were collected during the same 7 consecutive years (2016-2022) by a single site of a multinational CRO (designated CRO-2) with a team specializing in neuropathology evaluation of nonclinical studies (Charles River Labs Edinburgh Ltd, East Lothian, Scotland, UK). For studies in this database, the neuropathologists were certified by the ACVP, European College of Veterinary Pathologists (ECVP), or Royal College of Pathologists (RCPath) and assigned diagnoses using criteria comparable to those used by CRO-1. Incidence but not grade was available in this HCD. Because sub-sites were not always recorded across studies, the percent of incidence was calculated as described above, but by organ (brain) or sub-site (spinal cord: cervical, thoracic, or lumbar) as available.
Results
Of the 59 nonclinical studies included in the analysis from CRO-1 (StageBio, Tables 1 and 2), HCD were compiled for 41 rat studies (39 for oral and 2 for IV administration) and 18 NHP studies (3 for oral and 15 for IV administration). Of these studies, approximately half of the control groups were administered a vehicle, while the control manipulation (sham administration vs. vehicle) was not reported for the other half. Altogether, the HCD included 4074 control rats and 696 control NHPs. For brain, sections stained with H&E were available for all animals, while neurohistological IHC methods to highlight reactive glia were performed for a subset. For spinal cord, sections stained with H&E were available for 1169 rats (28.7% of 4074) and 346 NHPs (49.7% of 696), with a subset labeled by neurohistological IHC assays.
Incidences and grades of gliosis NOS, microgliosis, and astrocytosis for various brain sub-sites in control animals for oral and IV administration studies from CRO-1.
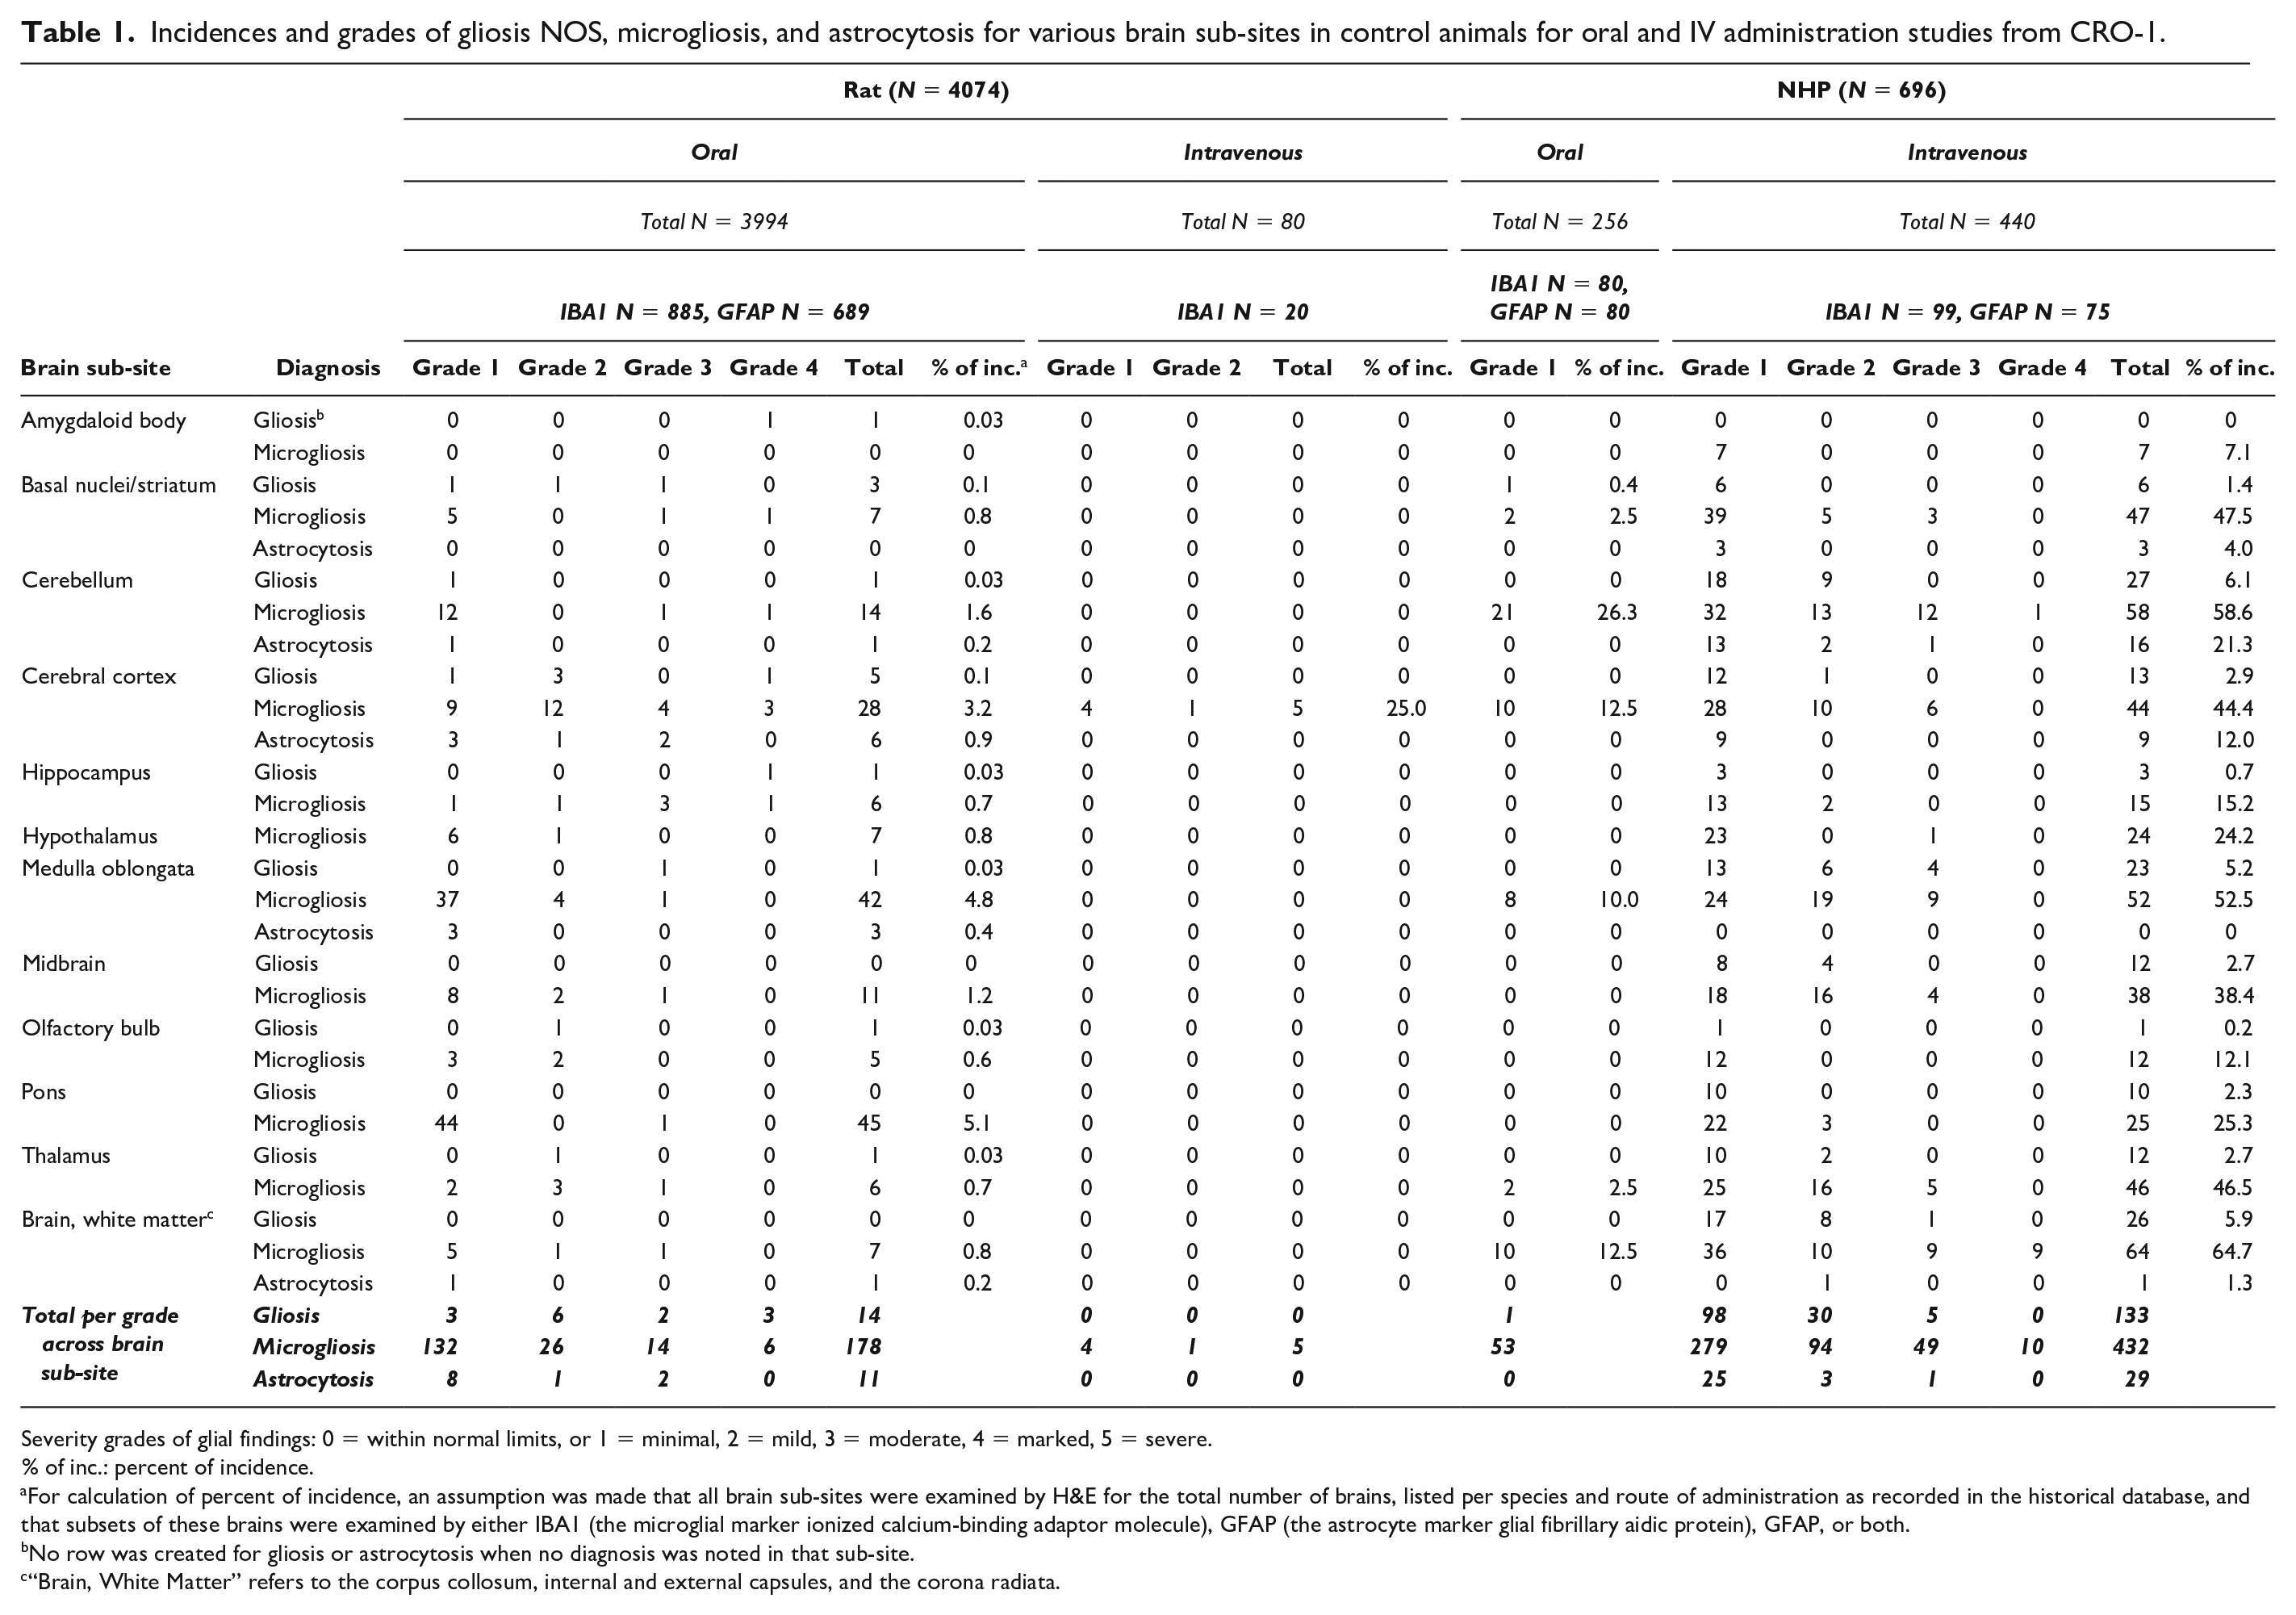
Severity grades of glial findings: 0 = within normal limits, or 1 = minimal, 2 = mild, 3 = moderate, 4 = marked, 5 = severe.
% of inc.: percent of incidence.
For calculation of percent of incidence, an assumption was made that all brain sub-sites were examined by H&E for the total number of brains, listed per species and route of administration as recorded in the historical database, and that subsets of these brains were examined by either IBA1 (the microglial marker ionized calcium-binding adaptor molecule), GFAP (the astrocyte marker glial fibrillary aidic protein), GFAP, or both.
No row was created for gliosis or astrocytosis when no diagnosis was noted in that sub-site.
“Brain, White Matter” refers to the corpus collosum, internal and external capsules, and the corona radiata.
Incidences and grades of gliosis NOS and microgliosis for various spinal cord sub-sites in control animals for oral and IV administration studies from CRO-1.
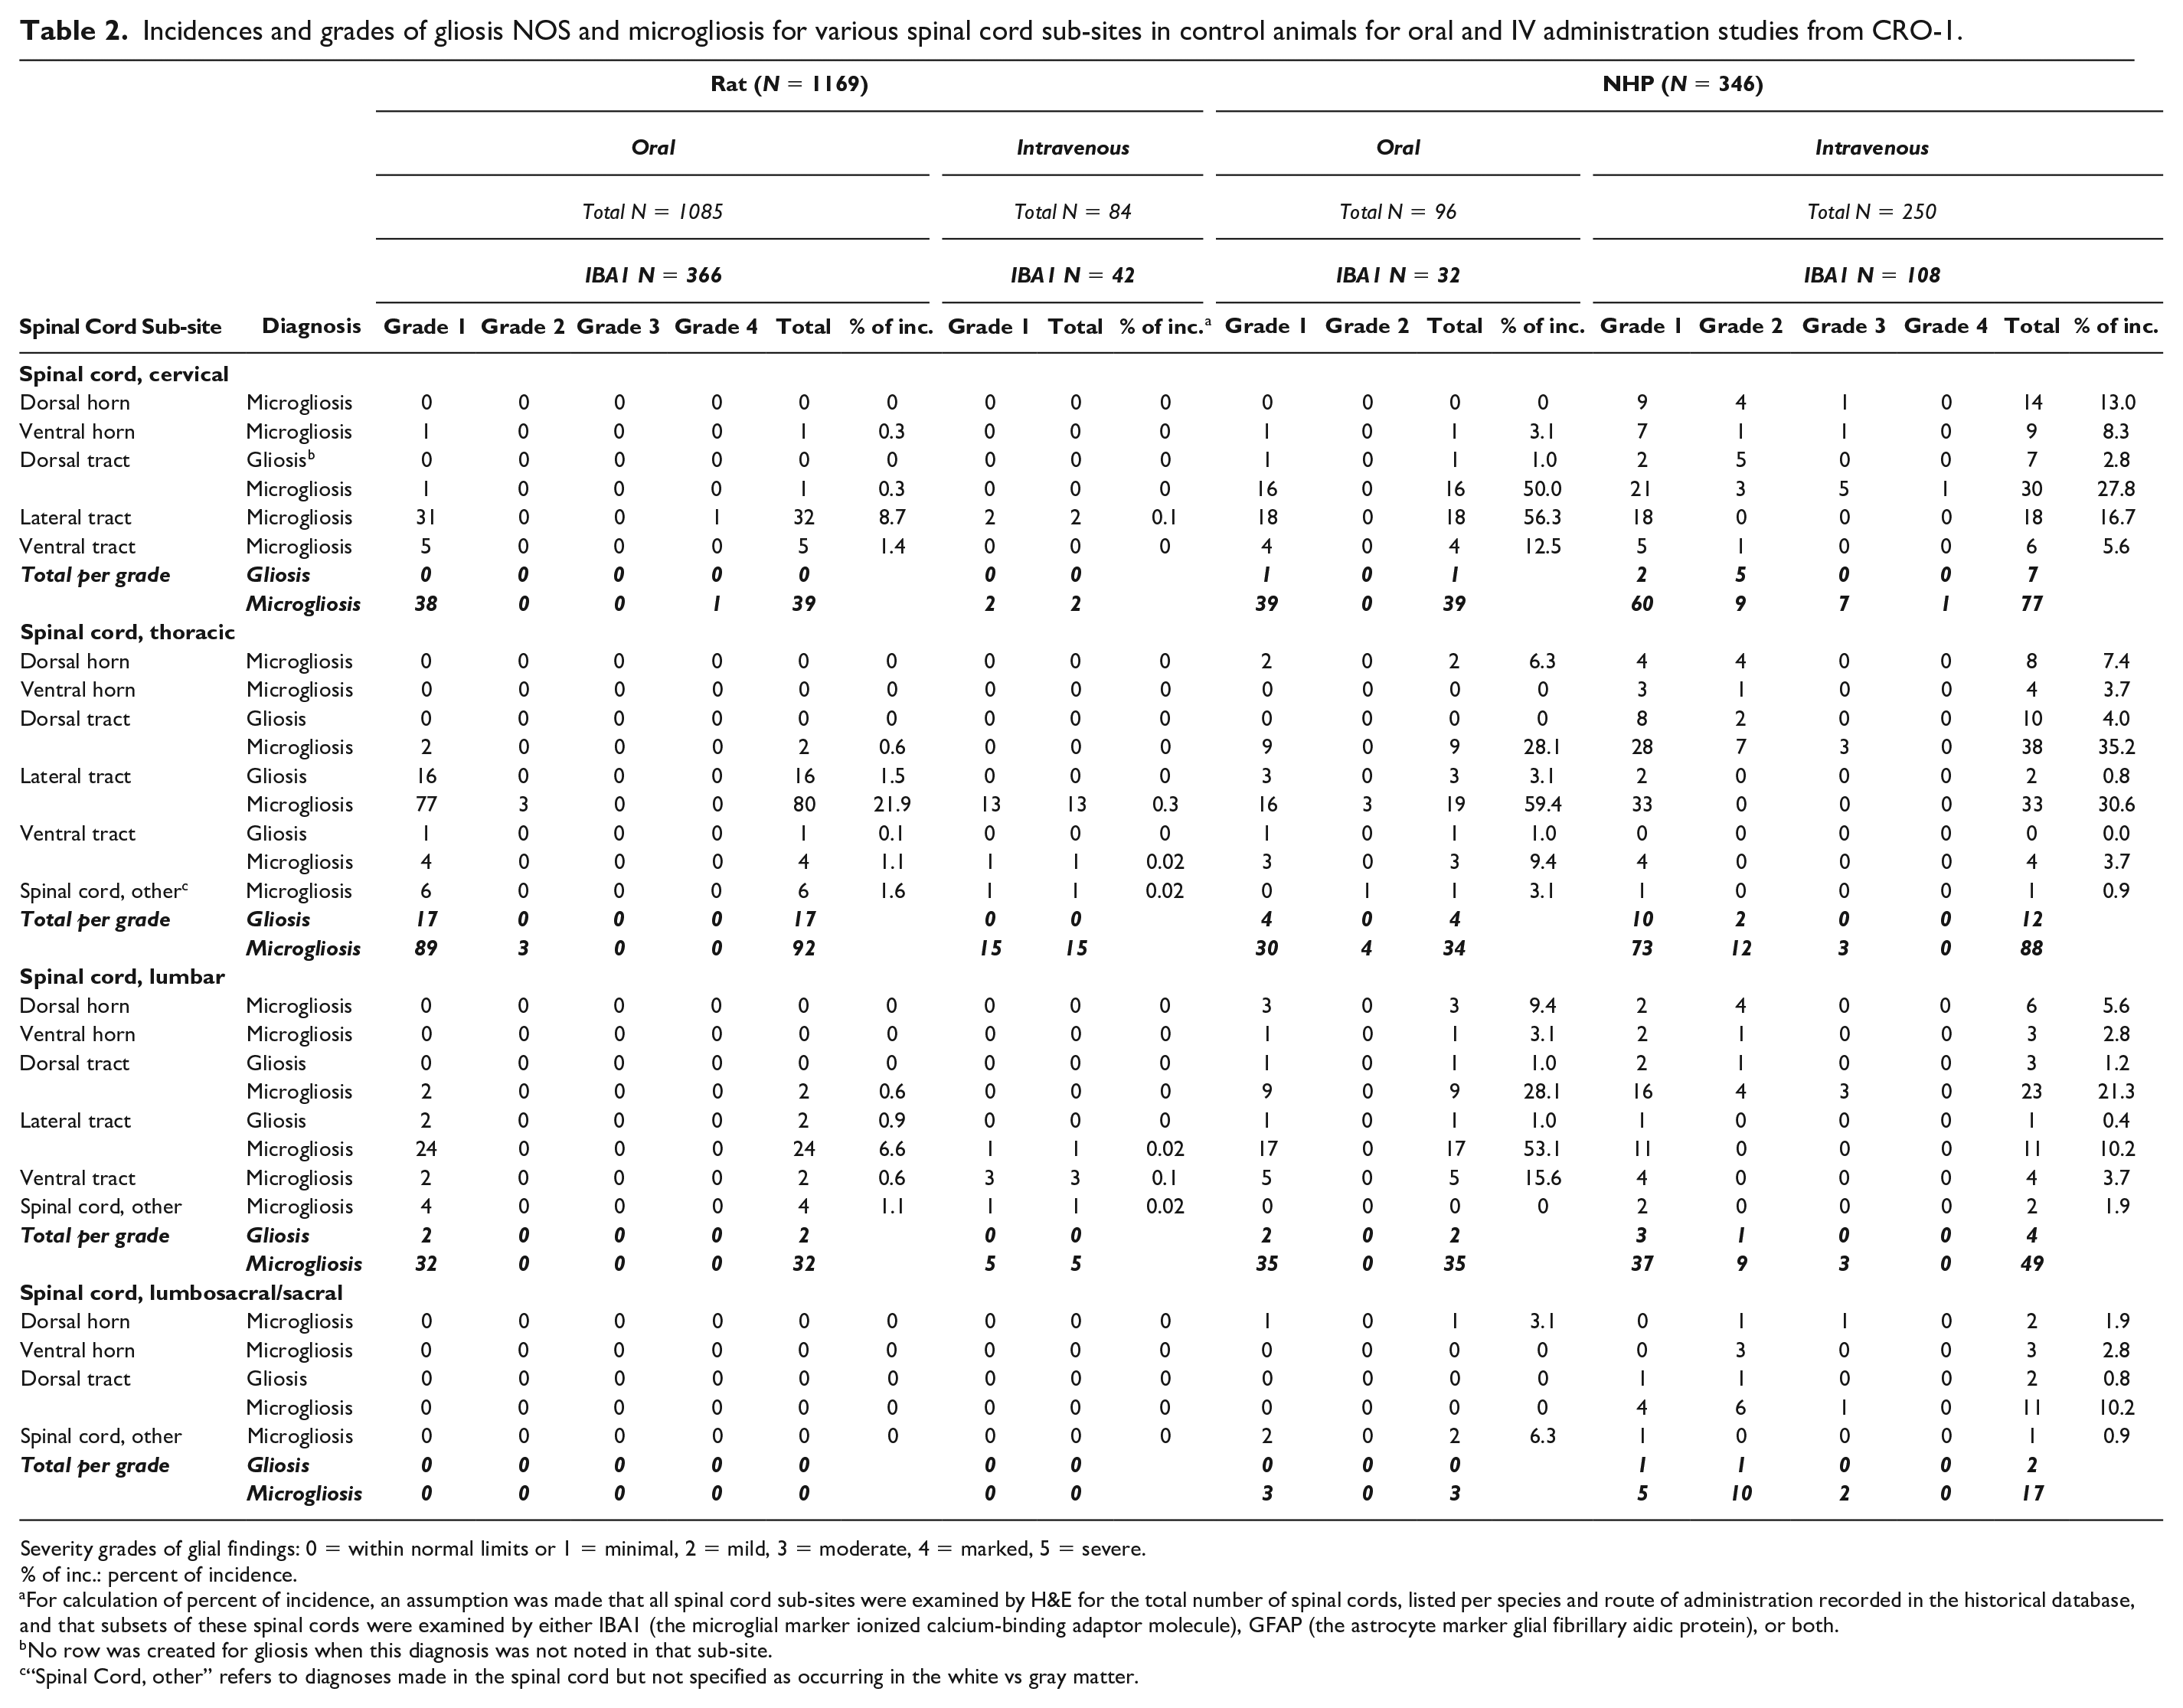
Severity grades of glial findings: 0 = within normal limits or 1 = minimal, 2 = mild, 3 = moderate, 4 = marked, 5 = severe.
% of inc.: percent of incidence.
For calculation of percent of incidence, an assumption was made that all spinal cord sub-sites were examined by H&E for the total number of spinal cords, listed per species and route of administration recorded in the historical database, and that subsets of these spinal cords were examined by either IBA1 (the microglial marker ionized calcium-binding adaptor molecule), GFAP (the astrocyte marker glial fibrillary aidic protein), or both.
No row was created for gliosis when this diagnosis was not noted in that sub-site.
“Spinal Cord, other” refers to diagnoses made in the spinal cord but not specified as occurring in the white vs gray matter.
Of the 1112 nonclinical studies included in the analysis from CRO-2 (Charles River Laboratories, Table 3), HCD were mined from 765 rat studies (670 for oral and 95 for IV administration) and 347 NHP studies (238 for oral and 109 for IV administration). These HCD included 20,616 control rat and 2182 control NHP brains. A subset of studies included spinal cord, with a subset of spinal cord sub-sites noted as reviewed. At least one spinal cord sub-site was available for at 12,037 rats (58.4 % of 20,616) and 735 NHPs (33.7% of 2182). Neurohistological IHC assays were not included in HCD from CRO-2 as their inclusion was not requested by the study sponsors.
Incidences of gliosis NOS for brain and spinal cord sub-sites in control animals for oral and IV administration studies from CRO-2.
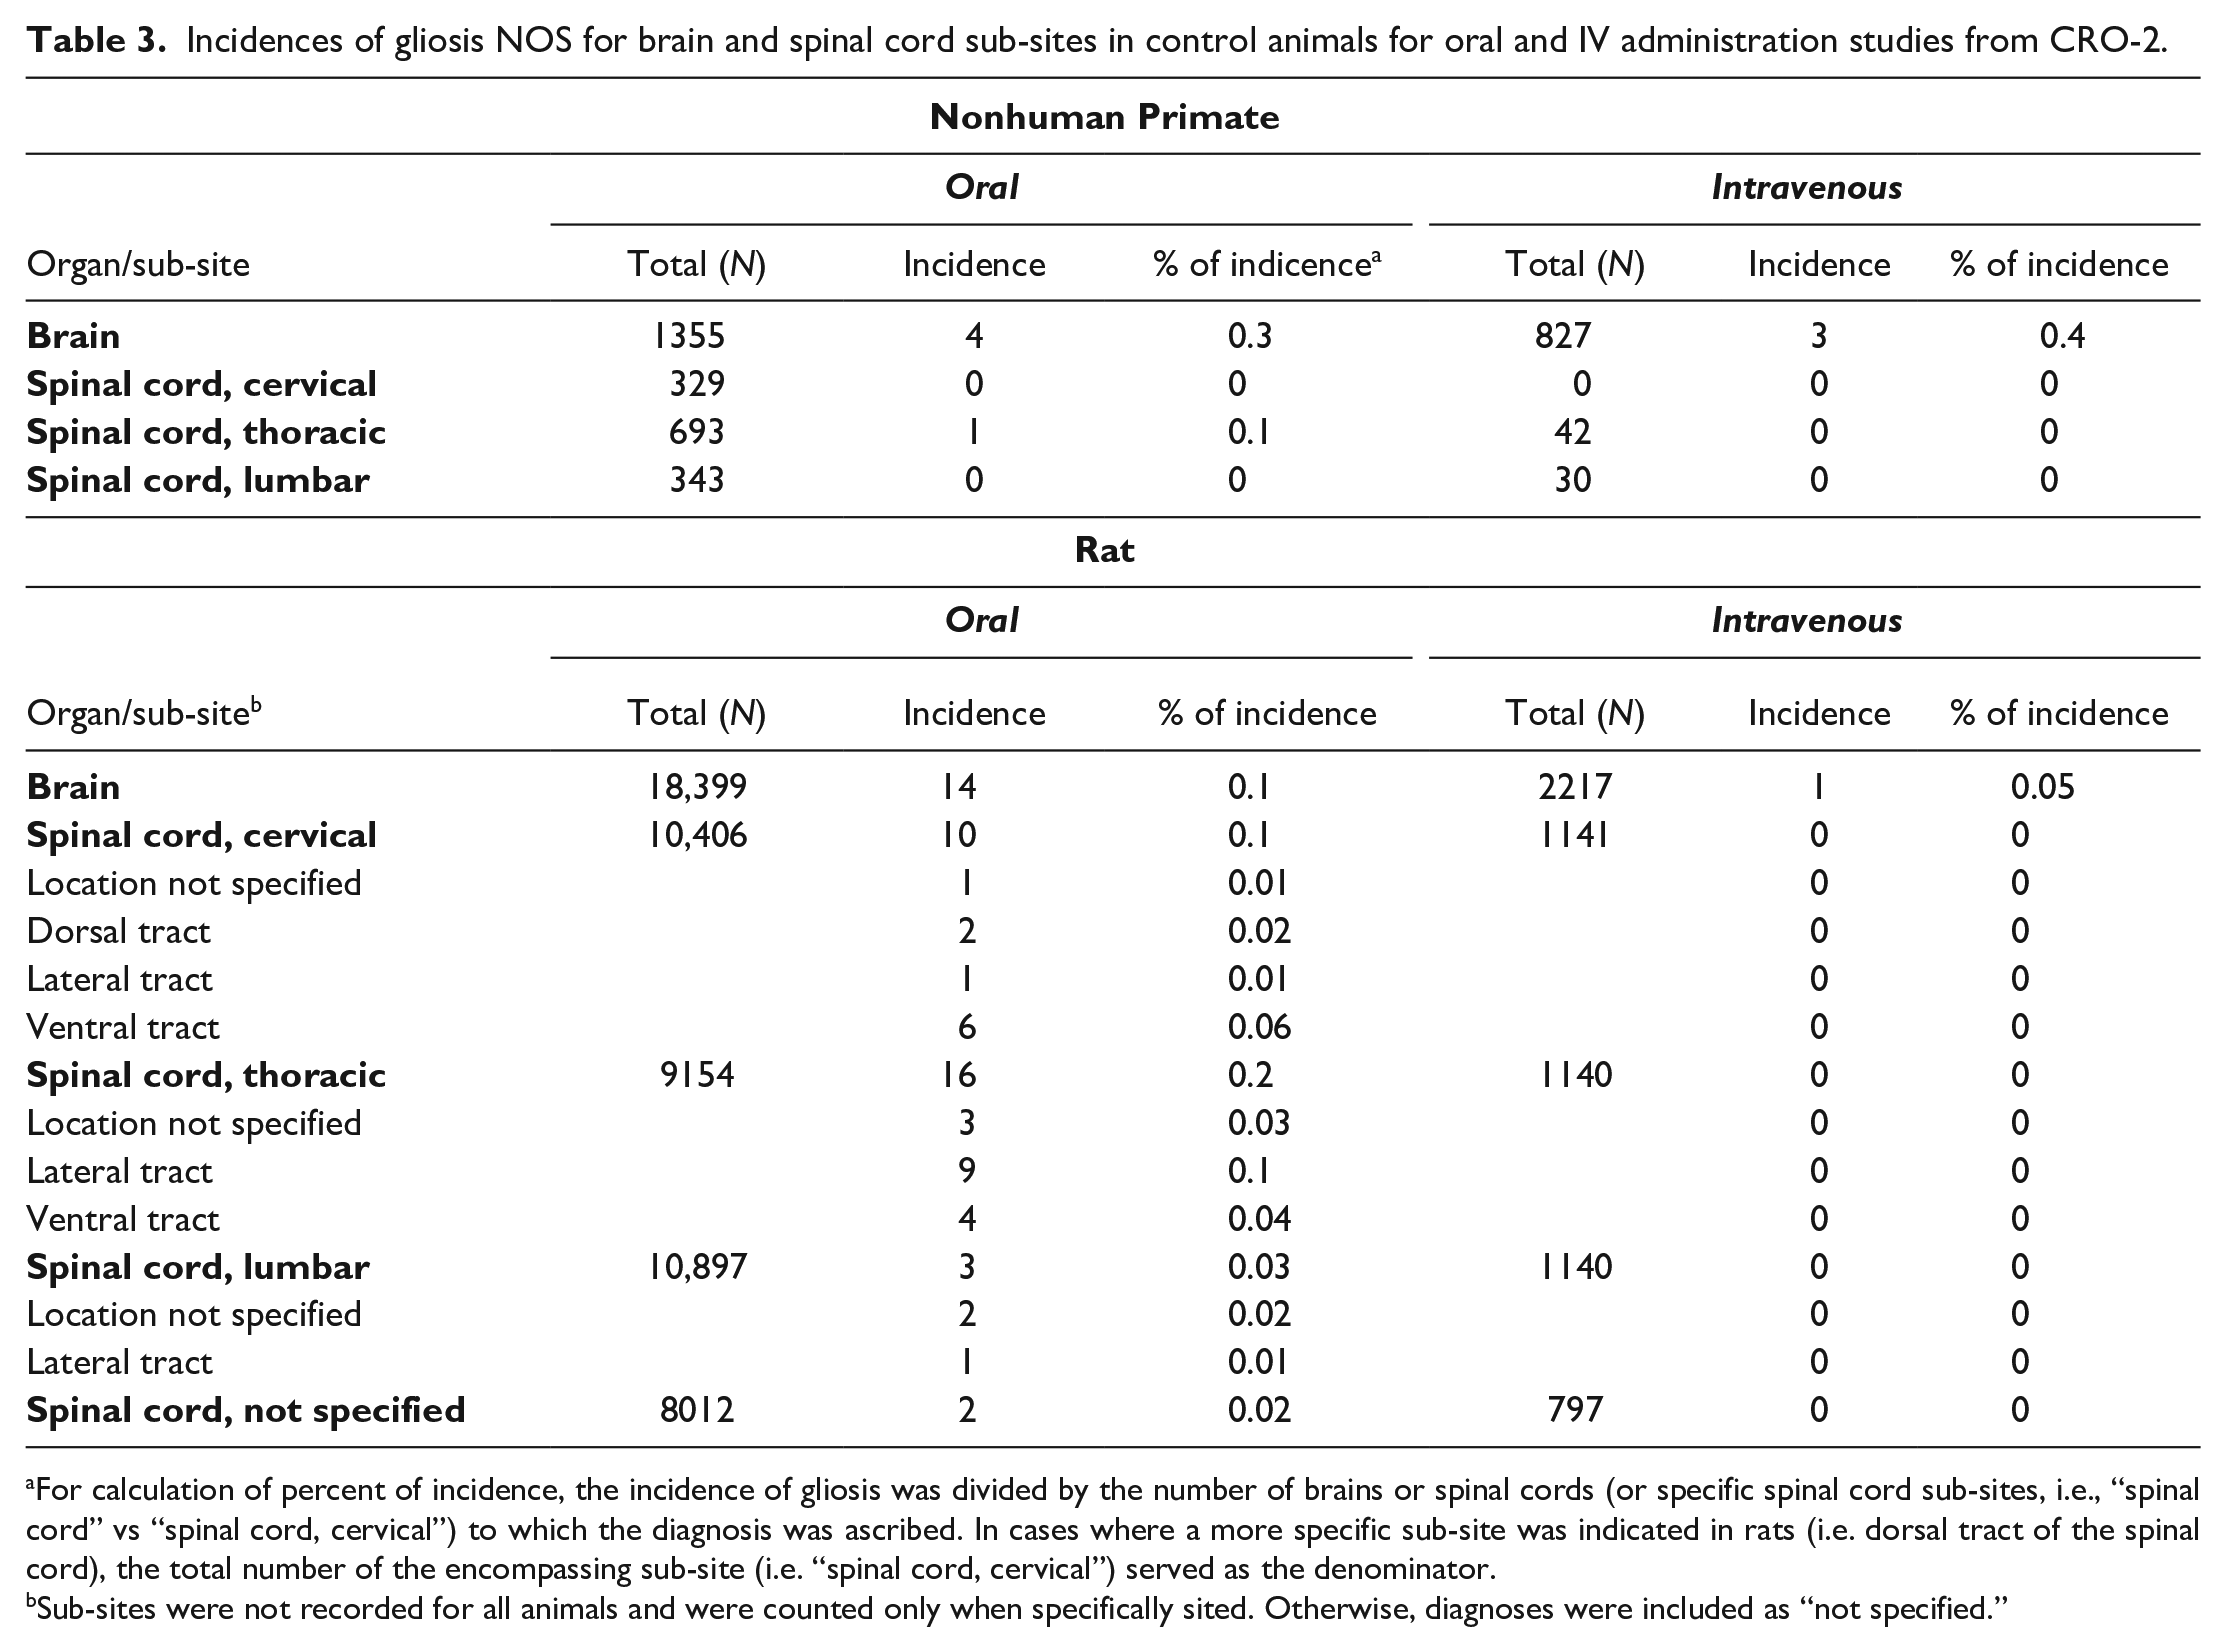
For calculation of percent of incidence, the incidence of gliosis was divided by the number of brains or spinal cords (or specific spinal cord sub-sites, i.e., “spinal cord” vs “spinal cord, cervical”) to which the diagnosis was ascribed. In cases where a more specific sub-site was indicated in rats (i.e. dorsal tract of the spinal cord), the total number of the encompassing sub-site (i.e. “spinal cord, cervical”) served as the denominator.
Sub-sites were not recorded for all animals and were counted only when specifically sited. Otherwise, diagnoses were included as “not specified.”
Glial markers at CRO-1 were examined based on the study design (i.e., as specified a priori in the study protocol) or the pathologist’s post hoc decision that glial findings in IHC-labeled sections should be assessed based on changes evident in the H&E-stained sections. In both species, IBA1 was applied more frequently than GFAP on brain and spinal cord because (1) cell morphology of the glial foci observed in H&E-stained sections exhibited the elongate nuclear morphology typical of microglial cells and (2) because in the study pathologists’ experience increased IBA1 labeling is more common and robust in CNS tissues compared with GFAP. 1 Rat brain sections were labeled to demonstrate possible increased expression of GFAP-positive cells (astrocytes) in 16.9% (689/4074) of animals, and to reveal IBA1-positive cells (microglia) in 22.2% (905/4074) of animals. Rat spinal cord sections were labeled by GFAP IHC in 14.0% (164/1169) and IBA1 IHC in 34.9% (408/1169) of animals. NHP brain sections were labeled by GFAP IHC in 22.3% (155/696) and IBA1 in 25.7% (179/696) of animals. NHP spinal cord sections were labeled by GFAP IHC in 13.6% (47/346) and IBA1 IHC in 40.5% (140/346) of animals.
The incidence and severity grades for gliosis (i.e., gliosis NOS), astrocytosis, and microgliosis as spontaneous findings in control rats and NHPs from CRO-1 are summarized in Tables 1 and 2, and the incidence of gliosis (gliosis NOS) in control rats and NHPs from CRO-2 are summarized in Table 3.
Brain
The diagnosis of “gliosis” (i.e., gliosis NOS) in control rat brains, made by cataloging morphological features in H&E-stained sections, was notably uncommon. This term was assigned only 14 times (combined percent of incidence in 4074 brains = 0.3%) in the HCD from CRO-1, and 15 times (combined occurrence in 20,616 brains = 0.07%) in the HCD from CRO-2. In the HCD from CRO-1, gliosis was most commonly observed in the cerebral cortex (5/4074, 0.1% incidence) and across brain structures was reported over a range of severities, including grade 1 (N = 3), grade 2 (6), grade 3 (2), and grade 4 (3).
In contrast to H&E, glial foci were readily identified in control rat brains by evaluating expression of cell type-specific IHC markers at CRO-1 (Figures 1A and 1B). The most frequent glial reaction identified was microgliosis, the diagnosis applied to an increase in IBA1-immunoreactive cells (Table 1, Figure 1B-D). Microgliosis occurred in 20.2% of control rats (183/905 brains). Microgliosis in the cerebral cortex was the only diagnosis in the control rat brains from IV administration studies (25%, 5 in 20 IBA1-labeled brains). In rat brains from oral administration studies, microgliosis occurred most frequently in the pons (5.1%, 45/885 brains) and medulla oblongata (4.8%, 42/885 brains), followed by the cerebral cortex (3.2%, 28/885 brains), the cerebellum (1.6%, 14/885 brains), and the midbrain (1.2%, 11/885 brains). The distribution of severity grades across examined brain sub-sites is shown in Table 1. Microgliosis was generally minimal to mild (grades 1-2). Moderate to marked (grades 3-4) microgliosis was diagnosed in the cerebral cortex (0.8%, 7/885 brains, Figure 1D), hippocampus (0.5%, 4/885 brains), the basal nuclei/striatum and cerebellum (0.2%, 2/885 brains each), and in the medulla oblongata, midbrain, pons, thalamus, and white matter (0.1%, 1/885 brains each). Astrocytosis was uncommon, with no greater than 6 diagnoses per sub-site (as noted in the cerebral cortex), most of which were minimal to mild (grades 1-2).
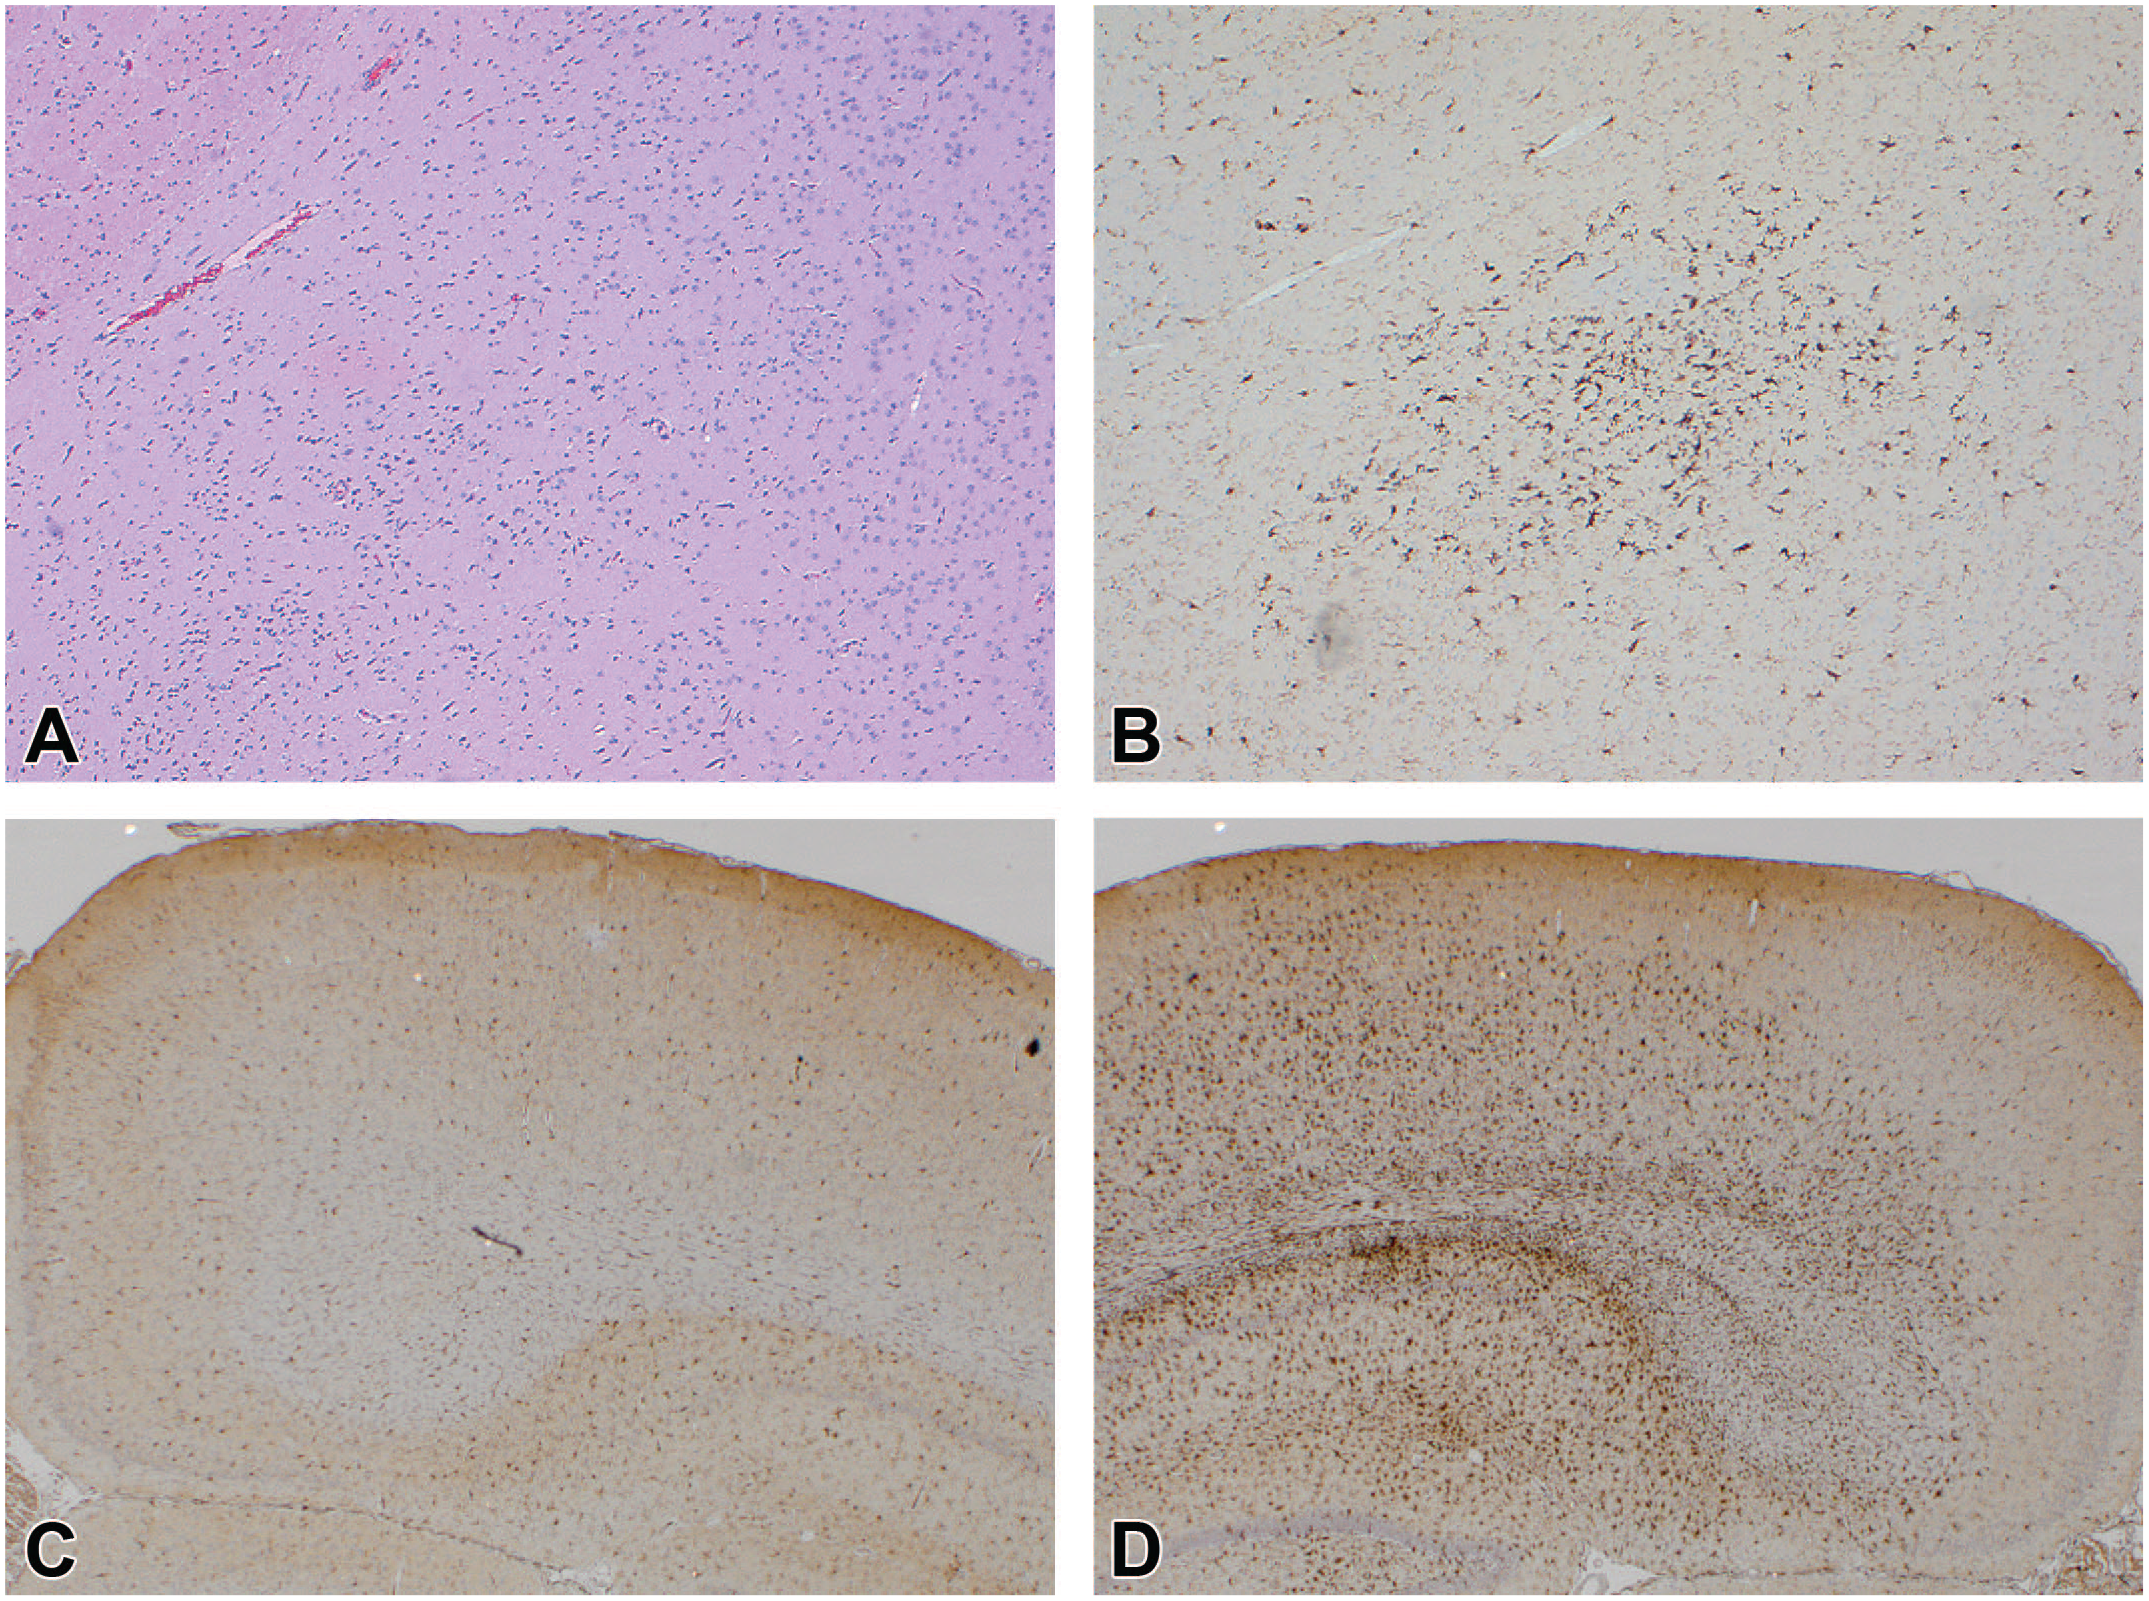
Gliosis (INHAND diagnosis = “gliosis, NOS” as visualized in H&E-stained sections) and microgliosis (INHAND diagnosis = “microgliosis” as seen in IBA1-immunolabeled sections) can be observed as an incidental finding in the brains of control rats in nonclinical toxicity studies. (A) A region of a control rat brain with no remarkable findings (H&E). (B) A serial section for the same region of the rat brain as shown in panel A, showing a focus of minimal (Grade 1) microgliosis; this divergence in detection highlights the importance of IBA1 as a tool for visualizing subtle glial responses in brain parenchyma. (C) Normal IBA1 immunolabeling compared with (D) locally extensive, marked (grade 4) microgliosis as seen in the dorsal cerebral cortex of two control rats. H&E indicates hematoxylin and eosin; IBA1, ionized calcium-binding adaptor molecule 1 IHC; INHAND, International Harmonization of Nomenclature and Diagnostic Criteria; NOS, not otherwise specified.
In the HCD from CRO-1, gliosis (i.e., gliosis NOS) noted in H&E-stained sections was a much more frequent finding in brains of NHPs (19.3% [134/696 brains]) compared with rats (0.3% [14/4074 brains]). Gliosis was frequently minimal (grade 1, 74.4% [99/133] of total gliosis diagnoses, Figure 2A) and sporadic (percent of incidence per brain sub-site ranging from 0.2 to 6.1%) though it was rarely more frequent and extensive, with grades ranging up to 3 (moderate, 3.8% [5/133] of gliosis diagnoses). In the HCD from CRO-2, gliosis was also more common overall in brains of NHPs (0.3% [7/2182]) compared with rats (0.07% [15/20,616]) (Table 3).
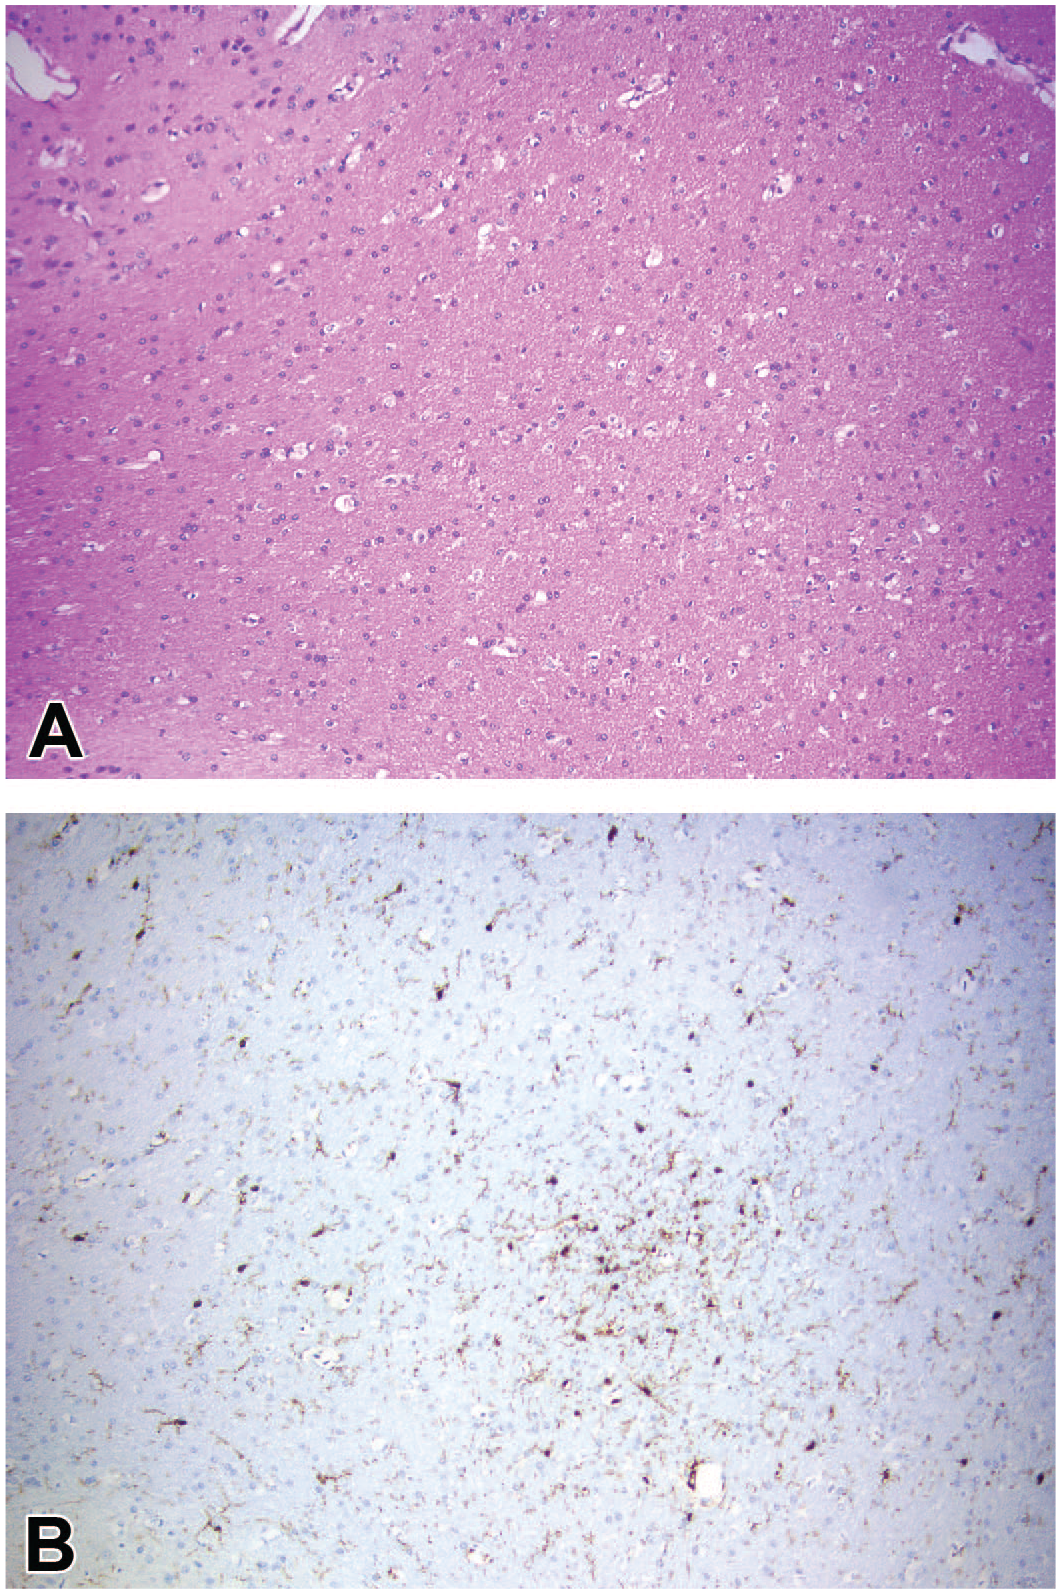
Gliosis and microgliosis can be detected commonly as an incidental finding in the brains of control nonhuman primates (NHP) in nonclinical toxicity studies. (A) A subtle, minimal (grade 1) glial aggregate (INHAND diagnosis = “gliosis, NOS”) in the cerebral white matter in an H&E-stained section from a control NHP (arrow). (B) A serial section depicting the same glial focus present in panel A, demonstrating that the aggregated cells are immunolabeled for IBA1 (INHAND diagnosis = “microgliosis”). H&E indicates hematoxylin and eosin; IBA1, ionized calcium-binding adaptor molecule 1 IHC; INHAND, International Harmonization of Nomenclature and Diagnostic Criteria; NOS, not otherwise specified.
In brains from NHPs in studies with oral (N = 256) and IV (N = 440) routes of administration from CRO-1, microgliosis was the most common glial diagnosis, with 485 findings across sub-sites in 179 IBA1-labeled brains; 53 from oral administration studies (80 brains) and 432 from IV administration studies (99 brains) (Table 1). Microgliosis was noted most often in the white matter in IV administration studies (64.6%, 64/99, Figure 2A and B) with severity ranging from minimal (grade 1, 36/99) to marked (grade 4, 9/99). The sub-sites with the next most frequent diagnoses of microgliosis were the cerebellum (58%, 58/99 brains), with severity ranging from minimal (grade 1, 32/99) to marked (grade 4, 1/99), and the medulla oblongata (52%, 52/99), with severity ranging from minimal (grade 1, 24/99) to moderate (grade 3, 9/99). Microgliosis was also observed frequently in the basal nuclei/striatum (47.5%, 47/99), the cerebral cortex (44.4%, 44/99), the thalamus (46.5%, 46/99), and the midbrain (38.4%, 38/99). In oral administration studies, microgliosis was most frequently seen in the cerebellum (26.3%, 21/80), white matter (12.5%, 10/80), and cerebral cortex (12.5%, 10/80). Astrocytosis was the least common diagnosis, occurring only 29 times (38.7%, 29/75 GFAP-labeled brains), and only in IV administration studies. Notably, astrocytosis was most frequently reported in the cerebellum (55.2%, 16/29), often in the molecular layer.
Spinal Cord
In the HCD from CRO-1 describing control rat spinal cords (N = 1169), gliosis (1.6% [19/1169]) was recorded much less frequently than microgliosis (44.9% [185/408]) (Table 2). Gliosis and microgliosis were most commonly recorded in the lateral white matter tracts in the cervical, thoracic, and lumbar spinal cord, especially in oral administration studies (Table 2). A similar pattern of gliosis was observed in control rats in the HCD from CRO-2, with gliosis occurring infrequently, but with the highest incidence in the lateral tract of the thoracic spinal cord, when specific sub-site was identified (0.1%, 9/9154 thoracic spinal cords, Table 3). Gliosis was also noted in the ventral white matter tracts in the cervical (0.06%, 6/10,406) and thoracic (0.04%, 4/9154) divisions of the spinal cord (Table 3).
In 366 IBA1-labeled control rat spinal cords from oral administratoin studies in the HCD from CRO-1, lateral tract microgliosis occurred approximately twice as often in the thoracic spinal cord (21.9%, 80/366) compared with the cervical (8.7%, 32/366) and lumbar (6.6%, 24/366) spinal cord. Microgliosis was infrequent in the dorsal and ventral white matter tracts of control rats for all spinal cord sub-sites (ranging from 0.3 to 0.6% for each). Almost all microgliosis recorded in the spinal cord was minimal (grade 1) except for four diagnoses in the lateral tracts ranging from mild to marked (grades 2-4). Only minimal (grade 1) microgliosis was evident in the spinal cords from rat IV administration studies. No astrocytosis was diagnosed in the spinal cord of control rats.
In NHP spinal cords from both IV (N = 108) and oral (N = 32) administration studies in the CRO-1 HCD, gliosis in H&E-stained sections was infrequent. Each spinal cord sub-site had from one to three minimal (grade 1) diagnoses of gliosis in oral administration studies in the white matter tracts (N = 96), and between one to ten minimal to mild (grades 1-2) diagnoses across dorsal and lateral white matter tracts in IV administration studies (N = 250). Gliosis in the spinal cord was also very rare in the HCD from CRO-2, with only one diagnosis in 1437 NHP spinal cord sub-sites (Table 3).
The most common glial diagnosis in the NHP spinal cords from the CRO-1 HCD was microgliosis. Compared with gliosis, which was diagnosed 8 times across sub-sites in the cervical spinal cord, 16 times in the thoracic spinal cord, 6 times in the lumbar spinal cord, and 2 times in the sacral spinal cord, microgliosis was diagnosed frequently, including 116 times in the cervical spinal cord, 122 times in the thoracic spinal cord, 84 times in the lumbar spinal cord, and 20 times in the sacral spinal cord. Microgliosis was evident especially within the dorsal and lateral white matter tracts through multiple levels of the spinal cord as foci of IBA1-positive cells (Table 2). Microgliosis in these tracts was primarily minimal to mild (grades 1-2), with rare moderate (grade 3) and one marked (grade 4) diagnosis. Occasional microgliosis (grades 1-3) was also diagnosed in the gray matter of the dorsal and ventral horns in multiple levels of the spinal cord. No astrocytosis was diagnosed in the NHP spinal cords.
Discussion
The current article describes the outcome of an extensive review of incidental glial findings in control rats and control NHPs to define the incidence and severity of gliosis NOS, microgliosis, and astrocytosis in the brain (N = 4074 rats and 696 NHPs) and spinal cord (N = 1169 rats and 346 NHPs) from CRO-1, and gliosis NOS in the brain (N = 20,616 rats and 2182 NHPs) and spinal cord sub-sites (N = 42,687 rats and 1437 NHPs) from CRO-2. Gliosis was substantially more common in the brain and spinal cord of NHPs than in rats in the HCD from both CROs. The most common glial response in both species from CRO-1 was minimal to mild (grades 1-2) microgliosis (evident in IBA1-labeled sections), which occurred much more frequently in NHPs, especially those enrolled in IV administration studies. In both species, gliosis (detected in H&E-stained sections) was recorded much less often than microgliosis, while astrocytosis was rarely observed in GFAP-labeled sections.
While this review was not stratified by strain/stock, animal source/geographical origin, testing facility, animal age, or type of control manipulation (e.g., vehicle vs saline vs untreated), overall trends were identified with respect to the number and severity of glial foci within the CNS of control rats and NHPs, including sub-sites where these diagnoses were more common. Microgliosis was most often minimal or mild and was found within the cerebral cortex, cerebellum, medulla oblongata, or pons in the rat, although the overall occurrence in this species was low. Microgliosis was observed much more commonly in control NHPs and occurred in the same general brain sub-sites as control rats and also extended to involve the thalamus, midbrain, white matter tracts, and basal nuclei. A possible explanation for the more frequent presence of reactive microglia in NHP brains is that substantially more brain tissue was available for examination in the much larger tissue sections evaluated for larger (non-rodent) species. 1 Another important finding was the more common occurrence of microgliosis noted on IBA1 immunolabeled sections compared with the extent of gliosis NOS evident on H&E-stained sections in both species (Figures 1 and 2). This discrepancy emphasizes the importance of including IHC markers (and particularly IBA1) in neuropathology evaluations to improve the likelihood of detecting reactive glia.
In general, the etiopathogenesis of the glial foci in control animals is not known. Glia (especially microglia) are exquisitely sensitive to any disturbance in the local parenchymal microenvironment and are activated in response to any perceived threat.3-5,8,19 In tissue sections, the nature of the neural injury that provokes localized glial activation and proliferation is frequently not evident in the tissue plane available for analysis, even when serial sections are collected. One possible mechanism for unexplained glial foci could be a focal breach in a blood vessel or perturbation of neurotransmitters resulting in activation, 14 though the sporadic nature of glial foci in this scenario coupled with the absence of visible vascular damage would suggest that no universal test article-related impact on blood vessel integrity or local neurotransmitter activity had been induced. Another possibility is that focal activation of microglia (but typically not astrocytes) occurs in hypoxic brain tissues stressed by oxygen deprivation shortly following death. 5
Limitations of this HCD review include a lack of granularity regarding rat strains and stocks and NHP species (and geographic origin), animal ages, the source (vendor) of the animals, the locations and types of testing facility, and the type of control item (vehicle vs saline vs sterile water vs nothing). These limitations were apparent in the differences in the numbers of brain sub-sites exhibiting microgliosis between NHPs in oral administration and IV administration studies, suggesting that some of these glial foci may have been due to a response to the vehicle, highlighting the importance of sufficient numbers of concurrent vehicle controls. Another limitation was that each diagnosis was independently counted for each sub-site of the brain or spinal cord, and the HCD were not used to identify animals with higher overall occurrence (numbers of foci) and/or grades across all sub-sites in the brain. Therefore, any variation in glial responses and between stains and IHC labels across individual animals cannot be determined based on the structure of these data, particularly when considering variations in sampling and repeated sectioning. Additionally, sub-site information and cell type-specific markers (IHC labels) were not available from all studies, hindering complete comparison among the findings in all studies and across the two CROs. Finally, the contribution of multiple pathologists within each organization to the HCD may have resulted in different grading thresholds, and diagnostic drift may have occurred within individual studies, despite carefully defined diagnostic criteria. All of these factors warrant further investigation.
In conclusion, our novel review of two extensive HCD sets provides important context regarding when and where pathologists may encounter gliosis (as gliosis NOS, microgliosis, and/or astrocytosis) as a spontaneous background finding in control rats and NHPs. These data indicate that minimal to mild microgliosis is a more common incidental finding in certain sub-sites of the brain and spinal cord of control animals in nonclinical studies, especially in NHPs. The overall outcome of these findings is that glial responses in the CNS cannot automatically be interpreted as evidence of a test article-related effect, and in particular as a definitive indication for a neurotoxic episode associated with or causing damage to neural parenchyma.
Footnotes
Acknowledgements
The authors would like to acknowledge Melissa Rifkin-Ashwal, Anahita Hormozi, Suzanne Spriggs, Angela Dorsey, and Omar Laouini-De La Pena of the StageBio Neuropathology Research Assistant Team; Romaisa Masood of the Charles River Laboratories Edinburgh Research Associate Team; and Petrina Rogerson of the Charles River Laboratories Edinburgh Pathologists team for maintaining and mining these historical control databases. The authors also thank Drs Mike Betley, Jaime Paulin, and Lisa Mangus of the StageBio Neuropathology team for a discussion of the data and their interpretation.
Author Contributions
The analyses, conclusions, and opinions expressed in this article are solely those of the authors. All authors participated in the discussions involved with formulation and organization of this paper.
Declaration of Conflicting Interests
The author(s) declared no potential conflicts of interest with respect to the research, authorship, and/or publication of this article.
Funding
The author(s) received no financial support for the research, authorship, and/or publication of this article.