
Abstract
Digital pathology has recently been more broadly deployed, fueling artificial intelligence (AI) application development and more systematic use of image analysis. Here, two different AI models were developed to evaluate follicular cell hypertrophy in hematoxylin and eosin-stained whole-slide-images of rat thyroid gland, using commercial AI-based-software. In the first, mean cytoplasmic area measuring approach (MCA approach), mean cytoplasmic area was calculated via several sequential deep learning (DL)-based algorithms including segmentation in microanatomical structures (separation of colloid and stroma from thyroid follicular epithelium), nuclear detection, and area measurements. With our additional second, hypertrophy area fraction predicting approach (HAF approach), we present for the first time DL-based direct detection of the histopathological change follicular cell hypertrophy in the thyroid gland with similar results. For multiple studies, increased output parameters (mean cytoplasmic area and hypertrophic area fraction) were shown in groups given different hypertrophy-inducing reference compounds in comparison to control groups. Quantitative results correlated with the gold standard of board-certified veterinary pathologists’ diagnoses and gradings as well as thyroid hormone dependent gene expressions. Accuracy and repeatability of diagnoses and grading by pathologists are expected to be improved by additional evaluation of mean cytoplasmic area or direct detection of hypertrophy, combined with standard histopathological observations.
Keywords
Introduction
Potential endocrine disruption of thyroid gland function poses an important human health concern in the safety evaluation of regulated substances. 1 Follicular cell hypertrophy is one of the most common effects seen in thyroid gland in toxicity studies and is characterized by diffuse increased cell size and height of the follicular epithelial cells. 1,2 This finding generally may result from several distinct mechanistic pathways and has a wide spectrum of significance ranging from physiological compensatory response to adverse pathological effects, including toxicity and carcinogenicity. 1,3
Several mechanisms of action have been described and categorized as direct or indirect based on the location of the molecular initiating event (MIE). Among the direct thyroid toxicants, some of them may block the ability of the gland to synthesize hormones via the inhibition of crucial key events. For instance, chemicals like the drug propylthiouracil (PTU), methimazole (MMI), or the herbicide amitrole (3-AT) can inhibit thyroperoxydase (TPO), which plays a role in the “integration” of iodide on thyroglobulin. Some others can inhibit the sodium-iodide symporter (NIS), like sodium perchlorate (SP), and thus block the uptake of iodide from blood to thyroid follicular cells. 4
In parallel, liver-mediated thyroid toxicants, named also as indirect thyroid toxicants, disrupt thyroid function homeostasis via the induction of hepatic phase II enzymes (UGTs and SULTs) involved in the catabolism and clearance of thyroid hormones. This mechanism of action has been extensively described in the literature. 1,5 For example, phenobarbital (PB), a common drug, is a well-known liver-mediated thyroid toxicant in rodents. 6,7
Both MIEs (direct or indirect) trigger a decrease of circulating thyroid hormone concentrations, which lead to an activation of the hypothalamus–pituitary axis via a negative feedback and then a stimulation of thyroid gland by thyroid stimulating hormone. If this stimulation is prolonged, histomorphological changes like follicular cell hypertrophy, hyperplasia, and potentially neoplasia could be observed. 1,7,8
In addition to histopathological evaluation, toxicogenomic profiling provides insight into the early signaling perturbations, which may presage toxicological changes in clinical pathology, histopathological, or even ultrastructural changes. 9 Perturbation in thyroid components of hormone synthesis and metabolism pathways, in response to compounds, can be estimated by measuring changes in key gene expressions, like the sodium/iodide symporter solute carrier family 5 member 5 (Slc5a5), thyroglobulin (Tg), and deiodinase-1 (Dio1), 10 using real-time quantitative reverse transcription-polymerase chain reaction (RT-qPCR).
Nevertheless, histopathological evaluation remains the gold standard for decision-making in toxicology and the most reliable indicator for hypothalamic–pituitary–thyroid (HPT) disruption, 1 supported by molecular and hormonal parameters. Morphological histopathological assessment has limitations due to its subjective nature. 11,12 Especially, this is the case for grading the severity 12 of follicular cell hypertrophy, for which various sets of scoring criteria have been proposed. 1 Therefore, toxicological pathologists could benefit from automated quantitative microscopic measurements, beside systematic training and use of standardized guidelines, to evaluate these histopathological alterations objectively. 13 Routine evaluations could be performed more reproducible with high throughput, to enable complex tasks and reduce interobserver variability and bias 14 with quantitative data generation, which might not be available during manual assessment with routine microscopy. 15
The growing advancements in digital pathology and digital image analysis brought innovation in the development of computer-aided tissue examination both in the clinical 16 and the preclinical area. 15,17 –20 For example, a recent milestone was reached in 2017 when the first whole slide imaging system received Food and Drug Administration clearance for digital image evaluation of surgical pathology slides. 21
Artificial intelligence (AI) approaches, particularly supervised deep learning (DL) networks, are based on learning image characteristics from a training set (in our case consisting of images with associated class labels, defined by experienced pathologists), which will best assign labels of interest in a new independent test set. 22 This allows segmentation of different organs and microanatomical compartments, such as follicular epithelium, colloid, and stroma. By segmentation, a class label is assigned to every pixel in the whole slide image (WSI) depending on its characteristics. So, pixels with the same class label share common characteristics. Also, detection of specific morphological changes of cells can be segmented, enabling for complex visual detection, like increased cytoplasm, as present in follicular cell hypertrophy.
Here, we present an innovative approach of DL-based image analysis to segment tissue structures to measure mean cytoplasmic area of follicular epithelial cells in the thyroid gland. Mean cytoplasmic area measuring approach (MCA approach) was tested on 5 studies with hypertrophy-inducing reference compounds, known either as direct (MMI, 3-AT, SP, PTU) or liver-mediated (PB) thyroid gland toxicants. Furthermore, we compared these data to an additional DL classifier trained to directly detect the lesion, thyroid follicular cell hypertrophy, in comparison to nonhypertrophic tissue. This hypertrophy area fraction predicting approach (HAF approach) was tested on two of the aforementioned studies, one with a direct (PTU) and one with a liver-mediated (PB) thyroid toxicant. Correlations of either mean cytoplasmic area or hypertrophy area fraction (the values generated by the 2 different DL models) to pathologist’s grading, colloid area fraction, and gene expression data were used to evaluate the usefulness of these supportive tools for the pathology evaluation.
Materials and Methods
Animal Experiments
All histological slides used for the image analysis are derived from previously conducted studies for the development of new substances (eg, mechanistic characterization of reference compounds, positive or vehicle control groups). All studies were performed according to national and European regulations for the use of laboratory animals and were approved by national authorities and the local ethical committee (French Ministry of Higher Education and Research; agreement number CEEA-57). Assessments were done on all available data of the studies. All test items were administered via gavage to Wistar rats [Crl:WI(Han) or Rj:WI(IOPS Han)]. The study design main differences are summarized in Table 1 for the test set (studies used for evaluation of the trained models) and in the supplemental Table S1 for the training set (slides of studies used to train the model algorithms).
Summary of Study Protocol Differences (Test Set).a
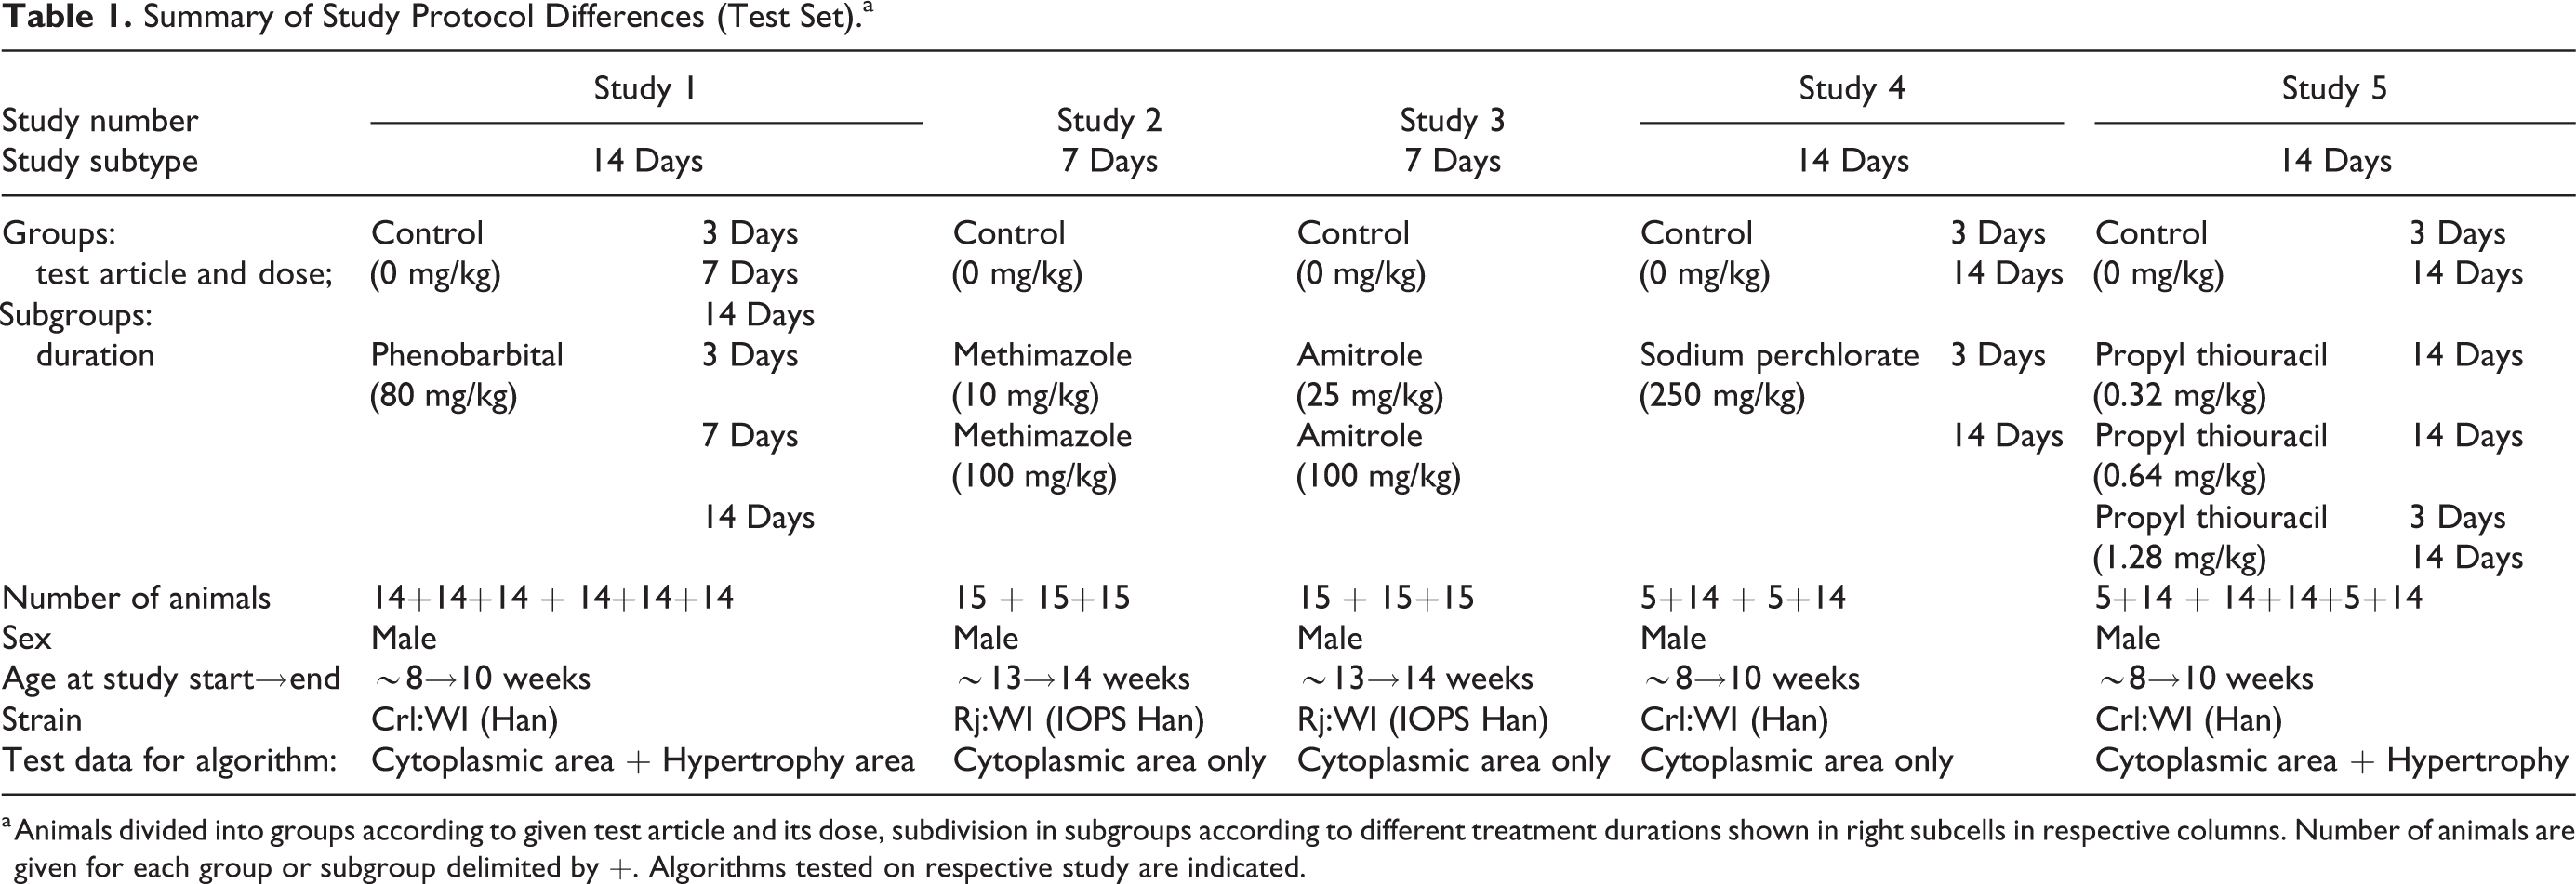
a Animals divided into groups according to given test article and its dose, subdivision in subgroups according to different treatment durations shown in right subcells in respective columns. Number of animals are given for each group or subgroup delimited by +. Algorithms tested on respective study are indicated.
Histopathological Observations
Thyroid gland was fixed in 10% neutral buffered formalin, trimmed according to registry of industrial toxicology animal-data (RITA) trimming guides, 23 paraffin embedded, sectioned at approximately 4 µm, and stained with Hematoxylin & Eosin (H&E), following standard protocols. Histopathological examination, including grading (0 [no hypertrophy detected], 1 [minimal], 2 [mild], 3 [moderate], 4 [marked], or 5 [severe]), was performed by experienced board-certified veterinarian pathologists trained in laboratory animal pathology, using standard light microscopes.
Histopathological Image Analysis
Digitization was performed after slides had been archived for different time intervals, using a digital slide scanner (Aperio AT2, Leica Biosystems Imaging, Inc) with its 20× objective lens (20×/0.75 NA Plan Apo) at resolution 0.5 micron/pixel.
For image analysis of the test set, two sections of thyroid gland per animal were included in the analysis and regions with artifacts like folds, tears, or blurred areas were manually excluded by a pathologist. No thresholding or adjustments have been performed to correct variation in staining or contrast between WSI.
Visiopharm software (version 2020.01 and 2020.03, Denmark) was used to develop DL models and train the algorithms. U-Net architecture 24 DL networks were trained on manually drawn or manually corrected class labels, done by one veterinary pathologist, on WSI from studies not used in the test sets. Each DL network was trained on multiple WSI from multiple studies on control animals and several WSI from two different studies with both control and PTU-treated animals, with at least 150,000 iterations. Detailed information about training set studies is listed in the supplemental material in Table S1. The areas of the regions of interest (ROI) used for training were not standardized between different WSI but were similar in size and adjusted to the distribution of trained classes. In total, more than 15 × 109 μm2 labeled WSI area was subject to training of the different algorithms. Detailed ROI area summaries per slide and study are provided in the supplemental Table S1. Regions of interest and WSI were selected spontaneously by the annotating pathologist to maximize variability in staining and tissue morphology in the training set. Furthermore, basic data augmentation with default settings within Visiopharm were used in the training, including rotation, flipping of labeled tissue regions, as well as changes in brightness and contrast.
Detailed description of stepwise image analysis
Schematic representation of the two developed approaches, outlining their stepwise processes of data prediction, are provided in the supplemental material Figure S1.
Follicular epithelium mean cytoplasmic area determination
The first step was tissue detection, obtained with a DL network, trained to identify thyroid tissue, excluding adjacent parathyroid, adipose, muscular, ectopic thymic tissues, and large blood vessels. A manual step followed to keep only two tissue sections for each WSI, where pathologist excluded remaining sections as well as artifacts. A second DL network was trained to automatically segment follicular epithelium, colloid, and stroma within the previously detected thyroid tissue region, to obtain area measurements. For the last step, Visiopharm’s build-in DL-based nuclei detection network was run only on the previously detected follicular epithelium region, gathering counts and area measurements of follicular epithelial cell nuclei. Subtracting this measurement from follicular epithelium area allowed to extrapolate follicular cytoplasmic area, which divided by the nuclei count, generated the final output of follicular mean cytoplasmic area per animal. Mean follicular cytoplasmic area per group with standard deviation was calculated using GraphPad Prism (version 9 for Windows, GraphPad Software, www.graphpad.com). Furthermore, colloid area fraction was determined, as a percentage of colloid area on the total thyroid surface.
Follicular cell hypertrophy area fraction determination
The HAF approach, detecting follicular hypertrophy, was based on a single DL network, trained to directly predict follicular cell hypertrophy, following the thyroid tissue detection step, previously described. Training data were automatically generated using the second DL network of the MCA approach, used to segment follicular epithelium from colloid and stroma; the network was trained with 150,000 iterations on labels of normal follicular epithelium, generated on 31 WSI of control animals from 3 different studies and with additional labels of hypertrophic follicular epithelium using 25 WSI of PTU-treated animals from 2 studies. These studies were logically excluded from the test set. The output of the algorithm is the percentage of hypertrophic area over the total area of follicular epithelium on each WSI. Mean area fraction of hypertrophic follicular epithelium with standard deviation was calculated per group using GraphPad Prism (version 5.04 for Windows, GraphPad Software, www.graphpad.com).
Gene Transcript Analyses
Tissue sampling, RNA purification and RT-qPCR were done following standard protocols. 25 Briefly, from the left thyroid lobe RNA was isolated using RNeasy Mini kits (Qiagen). Quality controls based on ribosomal RNA electrophoretic profiles were performed using commercial kits and machines varying between studies (LabChip Dx, Perkin Elmer or Bioanalyser Agilent Technologies). Reverse Transcription with commercial kits and master mixes from different companies (Reverse transcription master mix from Fluidigm or High capacity cDNA Archive kit from Applied Biosystems) was performed. Taqman assays (Assays on demand, Applied Biosystems) were used and qPCR reaction was performed using Taqman Gene Expression Master Mix (Applied Biosystems) or FastStart Universal Probe Master Mix (Roche) for different studies on a BioMark machine (Fluidigm). Test- and reference genes are listed in the supplemental Table S2. RNase free water was used as negative control. Real-time quantitative reverse transcription PCR data were analyzed using the Delta Delta threshold cycle Method (ΔΔCT). 26 CT mean values of up to 4 housekeeping genes were used for normalization. Fold change data (2^ ΔΔCT) is depicted in the graphs with normalization to the control group’s average ΔCT.
Statistical Analysis
For follicular mean cytoplasmic area and hypertrophy area fraction, one-way analysis of variance was used to evaluate differences with respective vehicle control groups. Bonferroni correction for multiple comparisons was applied. Trend analysis for dose-dependent effect was done using Post tests for linear trend. Spearman correlation has been performed to correlate parameters, using all available data points. Alpha error = 0.05 was the chosen threshold for significance. P values are reported when ≤.05 as 1 asterisk, P ≤.01 as 2 asterisks, P ≤.001 as 3 asterisks, and P ≤ .0001 as 4 asterisks.
Gaussian distribution was assumed for mean cytoplasmic area and hypertrophy area fraction. Statistical analyses were performed using GraphPad Prism (version 5.04 or 9 for Windows, GraphPad Software, www.graphpad.com).
Results
Mean Cytoplasmic Area Measuring Classifier, MCA Approach
Algorithm for follicular mean cytoplasmic area
Mean cytoplasmic area was estimated using multiple sequential DL algorithms trained to classify follicular epithelium within the detected thyroid tissue, segmenting it from stroma and colloid (Figure 1). The measured area of the follicular cell nuclei was subtracted from the area of total follicular epithelium, then divided by the count of follicular cell nuclei, generating the mean cytoplasmic area output per animal. Their means per group are depicted in Figure 2 and compared to the respective vehicle control group.
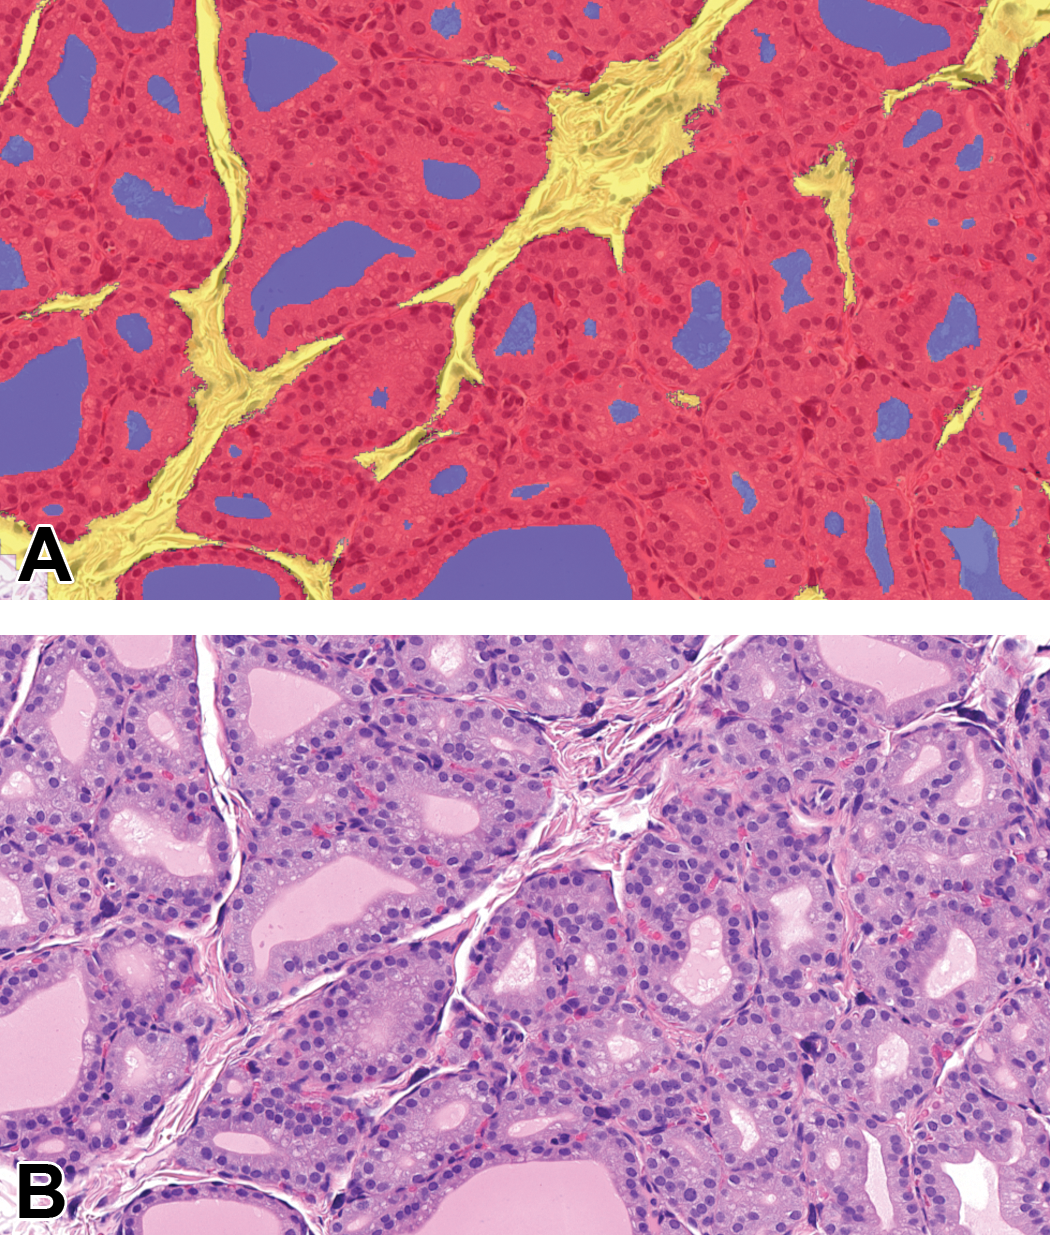
Segmentation achieved by DL algorithm resulting in mean cytoplasmic area measurements. Thyroid gland, H&E, sodium perchlorate (SP)-treated (3 days) study 4. A, Classification as false colored overlay: follicular epithelium in red, colloid in blue, stroma in yellow, nuclei segmentation not shown here. B, Original H&E image.
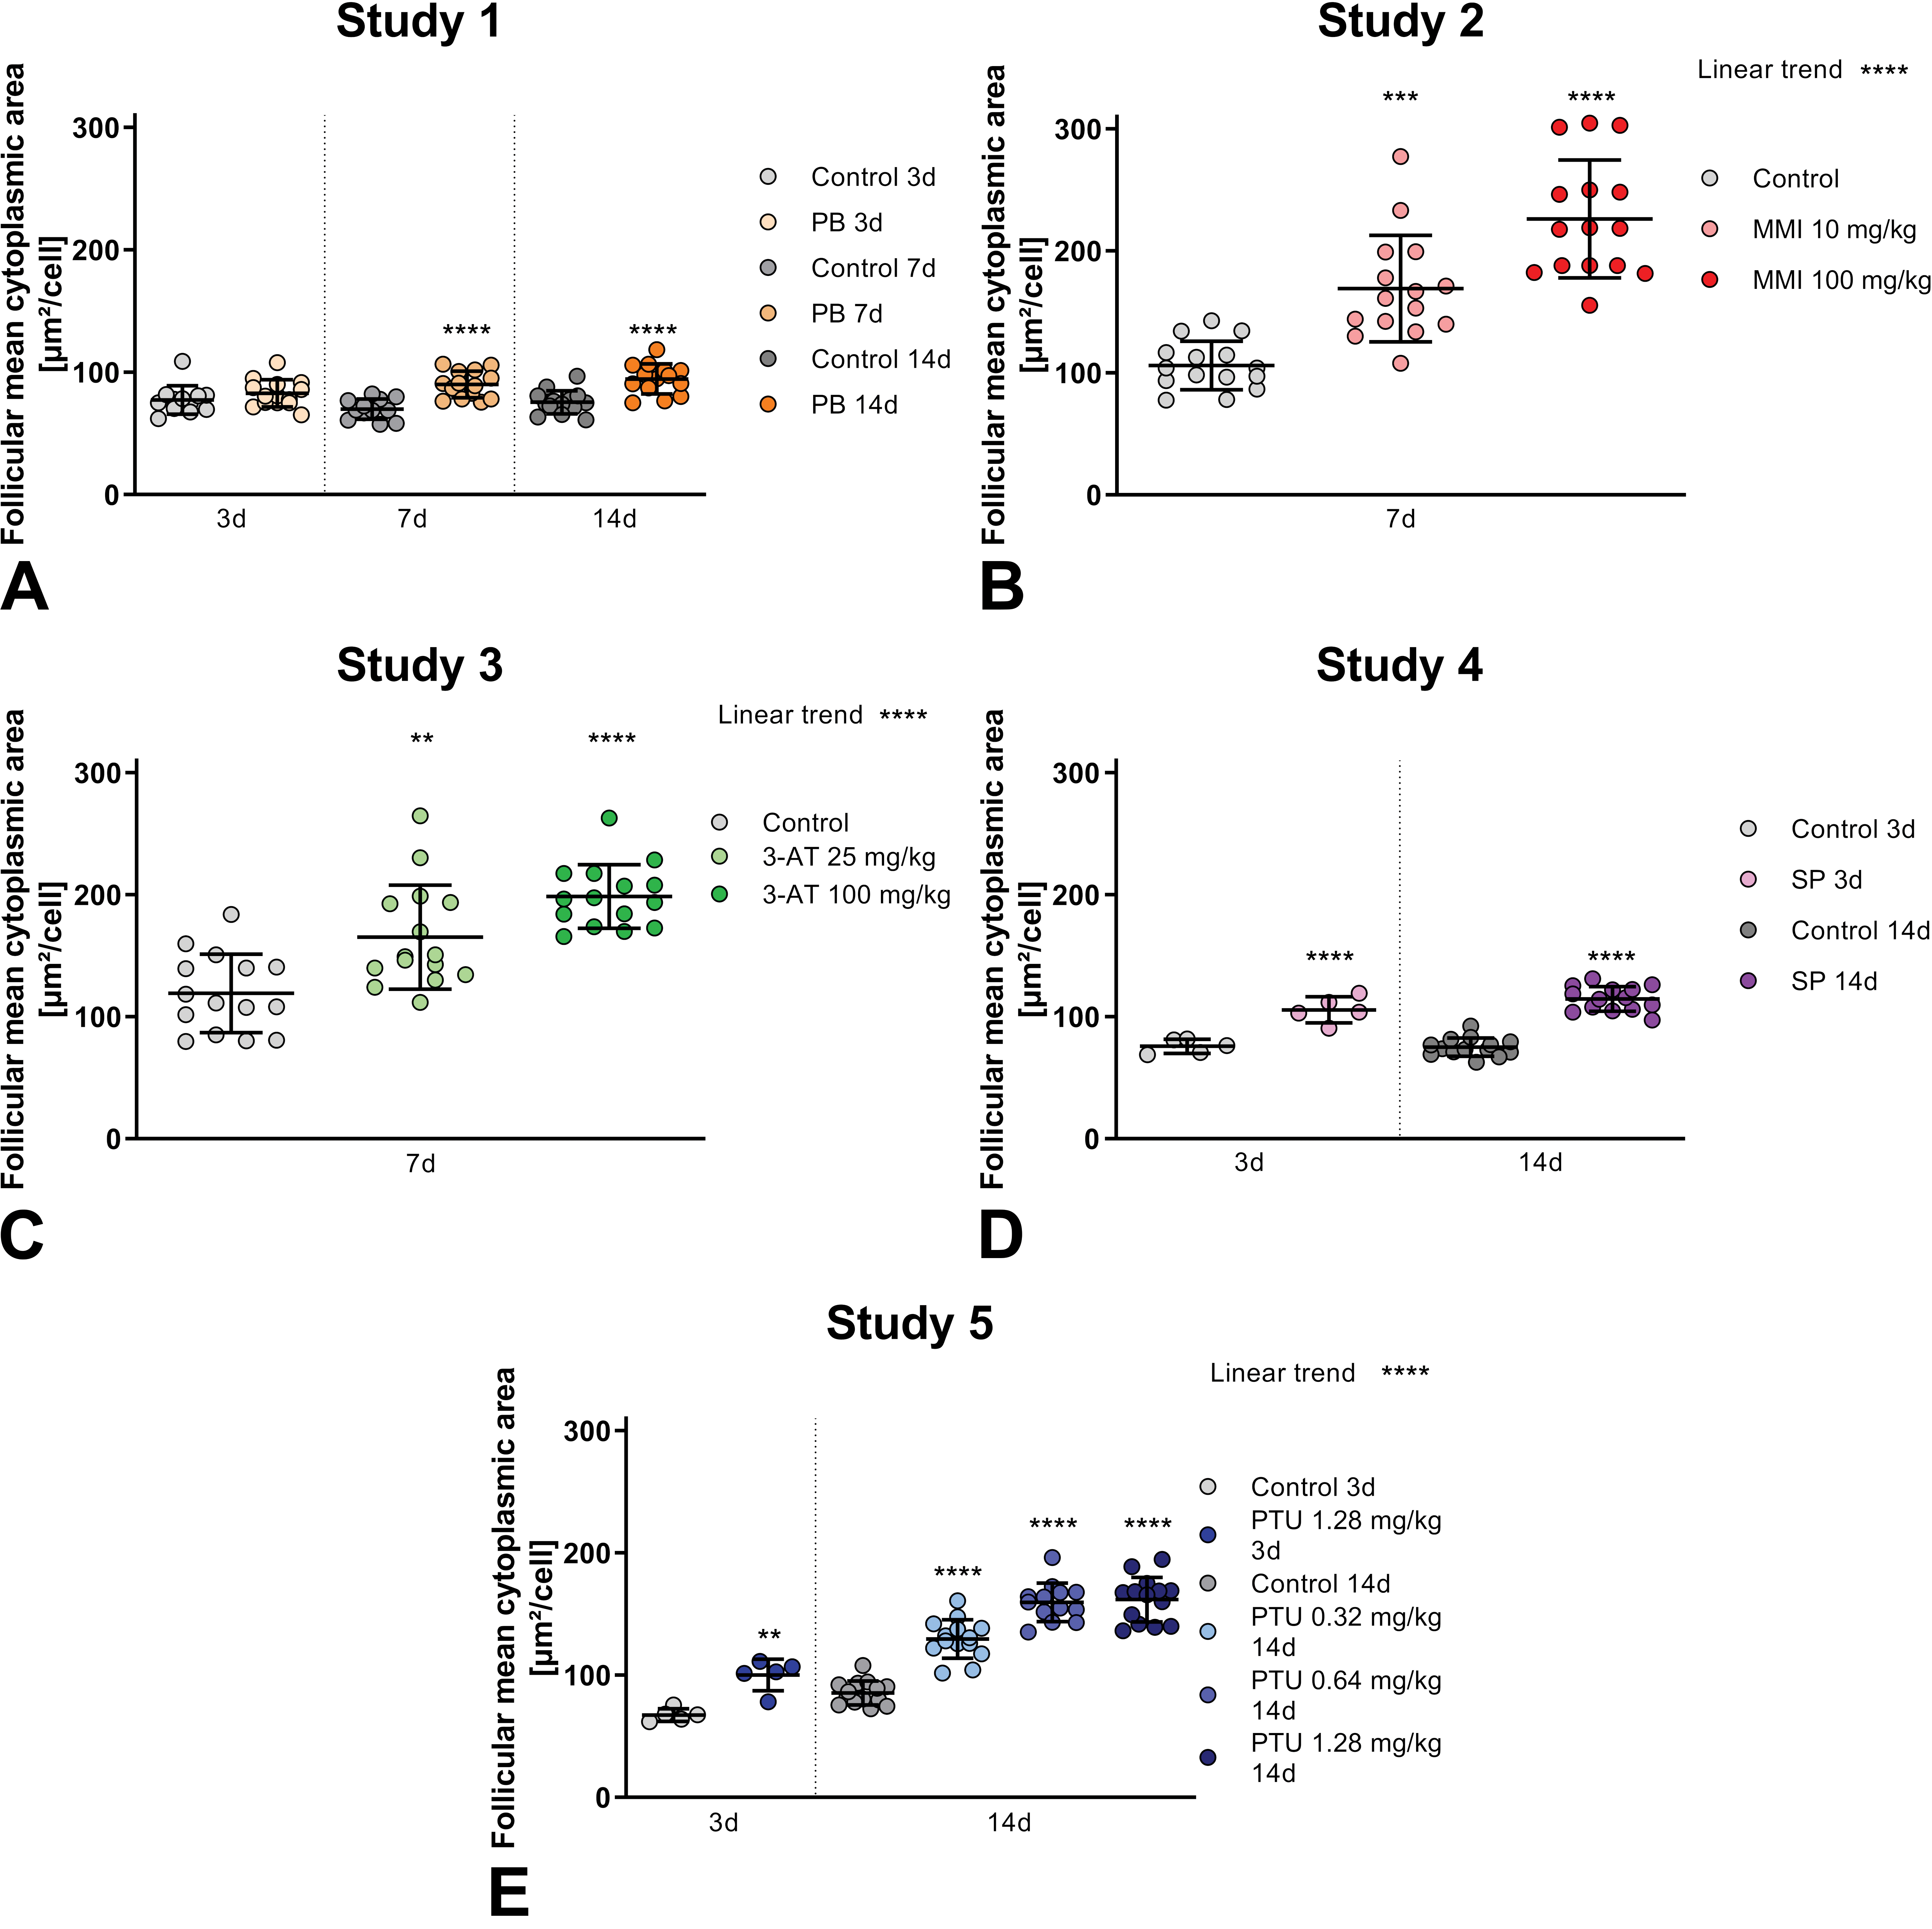
Follicular mean cytoplasmic area measured by DL algorithm. Note color scheme in the respective legend indicating different reference compounds (colors) versus control (gray) groups, when available different dosages (study 2, 3, and 5) or time points (study 1, 4, and 5) are visualized as shades of colors. For study 1-5 (A-E) with phenobarbital (PB), methimazole (MMI), amitrole (3-AT), sodium perchlorate (SP), or propylthiouracil (PTU), respectively, individual values and group- or subgroup-means with standard deviation are shown. Each treated group is statistically compared to its respective control group, significant differences shown as asterisks in the graph. Linear trend analysis for dose-dependent effects shown in upper right corner of respective graph.
Follicular mean cytoplasmic area
Follicular mean cytoplasmic area is significantly increased in all dose groups at all time points in all studies using direct thyroid toxicants (MMI, 3-AT, SP and PTU) (Figure 2 study 2 to 5), whereas in study 1, significant differences of treated animals to vehicle control groups can only be seen after 7 and 14 days of administration of PB, a liver-mediated thyroid toxicant. After 3 days, only a very slight trend to follicular mean cytoplasmic area increase is visible. Since PB induces this follicular cell hypertrophy via changes in the liver, leading to increased metabolization of thyroid hormones, the time span of 3 days was probably not long enough to induce detectable changes in the thyroid gland. Furthermore, the magnitude of increase of follicular mean cytoplasmic area is smaller in animals given the liver-mediated thyroid toxicant PB (study 1) at all time points when compared to the direct thyroid toxicants.
Also, in studies testing direct thyroid toxicants, the increase of mean cytoplasmic area varies in treated versus control groups. Sodium perchlorate treatment (study 4) results in only very subtle increase after 3 days and still only a slight increase after 14 days of treatment. After 3 days of PTU administration (study 5), the difference in follicular mean cytoplasmic area between treated and control groups is evident and increases with the time. In studies including multiple dosages of the same direct thyroid toxicant (study 2, 3 and 5), a highly significant, dose-dependent increase of follicular mean cytoplasmic area is observed. For PTU in study 5, the effect in the high dose group at day 14 is similar to the one of the intermediate dose, suggesting a possible saturation of the effect.
Correlation of histopathological grading to mean cytoplasmic area
Follicular mean cytoplasmic area measured by the DL algorithms was also compared to the histopathological grading performed by pathologist (Figure 3).
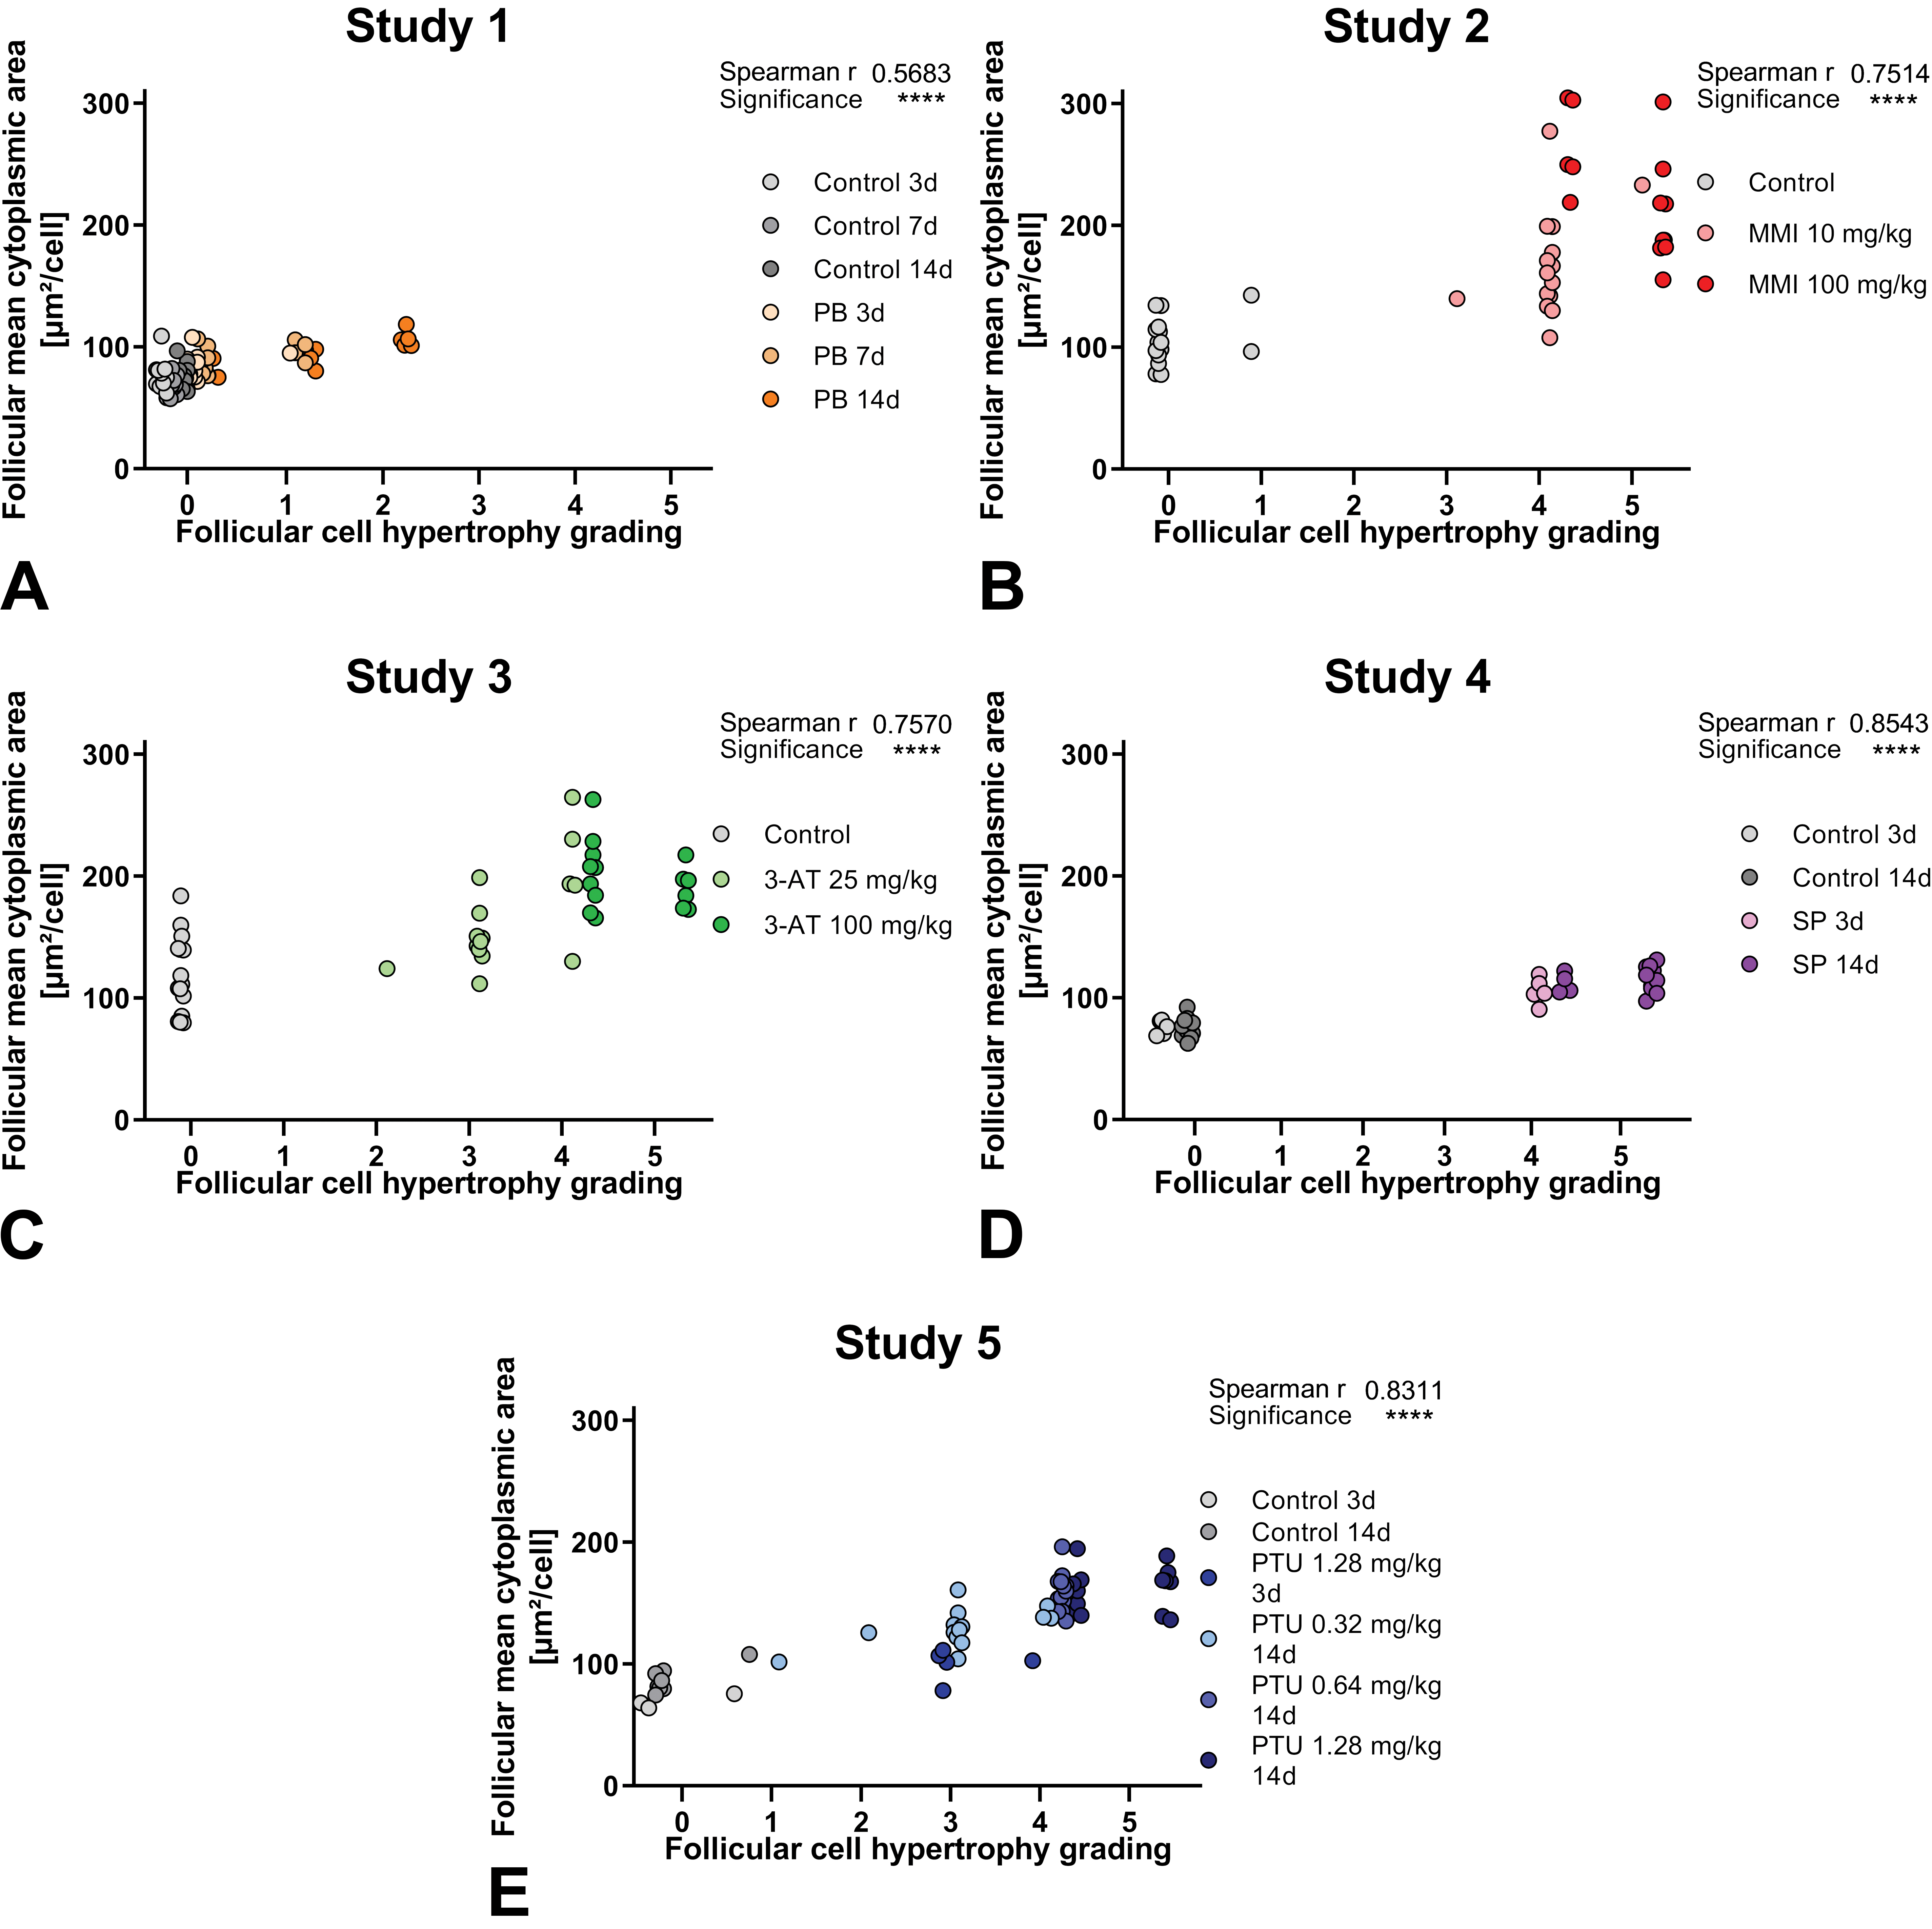
Correlation of follicular mean cytoplasmic area measured by DL algorithm to semiquantitative histopathological observation with grading done by pathologists. For study 1-5 (A-E) with phenobarbital (PB), methimazole (MMI), amitrole (3-AT), sodium perchlorate (SP), or propylthiouracil (PTU), statistical correlation is shown in upper right corner of respective graph. Grades: 0 (no hypertrophy detected), 1 (minimal), 2 (mild), 3 (moderate), 4 (marked), or 5 (severe).
For all studies, these parameters correlate significantly. But, overlapping of different grades given by the pathologists corresponds to similar values of mean cytoplasmic area, including grade 0 (no hypertrophy detected) and ranging to grade 4 in study 5.
The liver-mediated thyroid toxicant PB (study 1) produced a less pronounced increase in follicular mean cytoplasmic area, measured by the DL algorithms, which correlates with the pathologist’s grading, of absent, minimal, or mild follicular cell hypertrophy (grade 0 to 2). Therefore, this is consistent with the histopathological visual examination by the pathologist, in which treated and control groups were not clearly separated by the presence of follicular cell hypertrophy.
Interestingly, in study 4, despite the smaller increase in follicular mean cytoplasmic area, the pathologist graded the follicular cell hypertrophy of all SP-treated animals as marked to severe (grade 4 to 5). Nevertheless, with mean cytoplasmic area, treated and control animals can be clearly separated.
Note that in study 2 and 5 also single animals from the control groups were diagnosed with minimal follicular cell hypertrophy (grade 1).
Correlation of colloid area fraction to mean cytoplasmic area
Along with the increase in cell size of the follicular epithelium, a reduction of colloid accompanies follicular cell hypertrophy in the thyroid gland. 1,2 Therefore, we correlated the follicular mean cytoplasmic area with the percentage of colloid area on the thyroid tissue, both measured by the DL algorithms (see supplemental Figure S2).
In all studies a reduction of colloid area fraction is seen, which correlates with high significance with the increase in follicular mean cytoplasmic area, thus showing inverse correlation between the parameters. Following administration of the liver-mediated thyroid toxicant PB (study 1), decrease in colloid area fraction is less pronounced with no clear distinction with the vehicle control groups. The reduction of colloid area fraction is more evident after treatment with all direct thyroid toxicants, including study 4, in which the change in follicular mean cytoplasmic area was less intense.
Correlation of gene expression to mean cytoplasmic area
Follicular mean cytoplasmic area was compared to gene expression data of known molecular markers for thyroid function (see supplemental Figure S3, Figure S4, Figure S5).
For all tested genes, there is a significant clear correlation between expression data and follicular mean cytoplasmic area in all studies. With a weaker correlation to the parameter Dio1 gene expression in study 2 and 3 with r values around 0.3, the significance of these correlations is also weaker when compared to the other correlations.
As expected, Slc5a5 is positively correlated (Figure S3), whereas Tg shows inverse correlation (Figure S4). In contrast, Dio1 shows positive and negative correlation in different studies (Figure S5). Different responses of gene expression of Dio1 are described for different substances directly inducing follicular cell hypertrophy in the thyroid gland, also for the reference compounds used in these studies. 10
Regarding the fold change of the different gene expressions, the magnitude of change compared to the control group is larger after administration of direct thyroid toxicants compared to administration of the liver-mediated thyroid toxicant PB and is, in general, more pronounced for Slc5a5 than for Tg and Dio1. The absence of clear gene expression changes observed in PB-treated animals is consistent with the fact that no major changes were observed regarding the other parameters.
After treatment with SP (study 4) for only 3 days, there is a higher fold change in gene expression of Dio1 compared to the vehicle control group than after 14 days, suggesting that this might be an early time-point marker. Nevertheless, we should keep in mind that only 5 animals were analyzed in the group “3-day exposure” compared to 15 animals in the group “14-day exposure.”
Dose-dependent differences in perturbation of gene expression is clearly visible in study 2 (MMI) and 3 (3-AT) for Slc5a5.
In our evaluation, Slc5a5 is globally the most consistent marker which correlates well with follicular cell hypertrophy.
Direct Hypertrophy Classifier, HAF Approach
Algorithm for follicular cell hypertrophy area fraction
The HAF approach was based on a DL algorithm trained to directly classify/detect the histopathological change follicular cell hypertrophy in the thyroid gland (Figure 4), generating an output of follicular cell hypertrophy area fraction (Figure 5). It was tested exemplarily on one study with a liver-mediated and one with a direct thyroid toxicant (study 1 and 5).
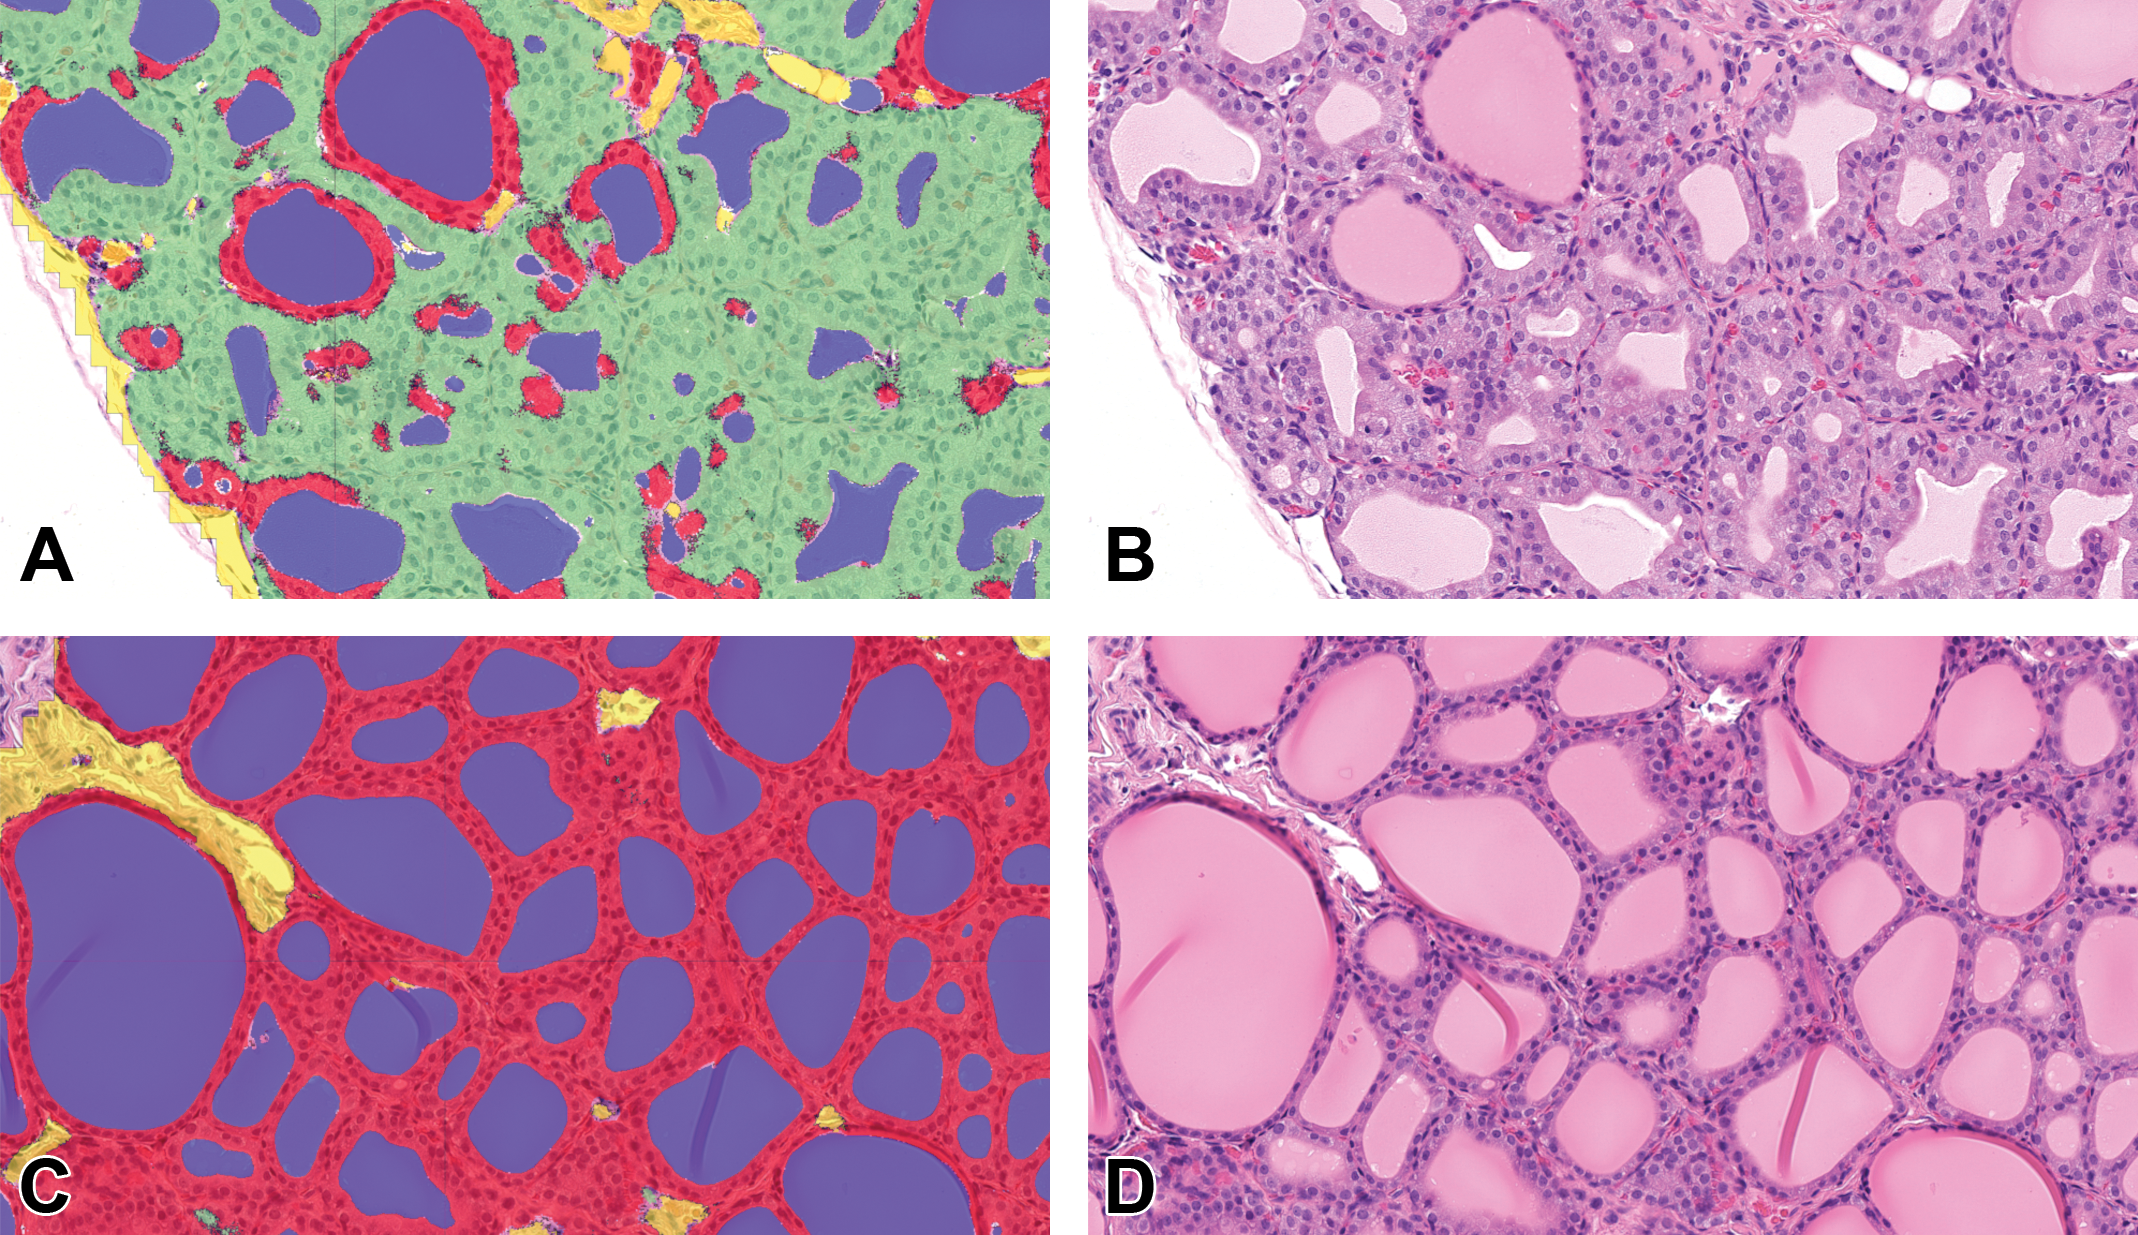
Segmentation achieved by DL algorithm resulting in follicular cell hypertrophy area fraction predictions. Thyroid gland, H&E, A and B images propylthiouracil (PTU)-treated (0.64 mg/kg 14 days), C and D images control, study 5. A and C, Classification as false colored overlay: follicular epithelium detected as hypertrophic in green, follicular epithelium detected as nonhypertrophic in red, colloid in blue, stroma in yellow, nuclei segmentation not shown here. B and D, Original H&E images.
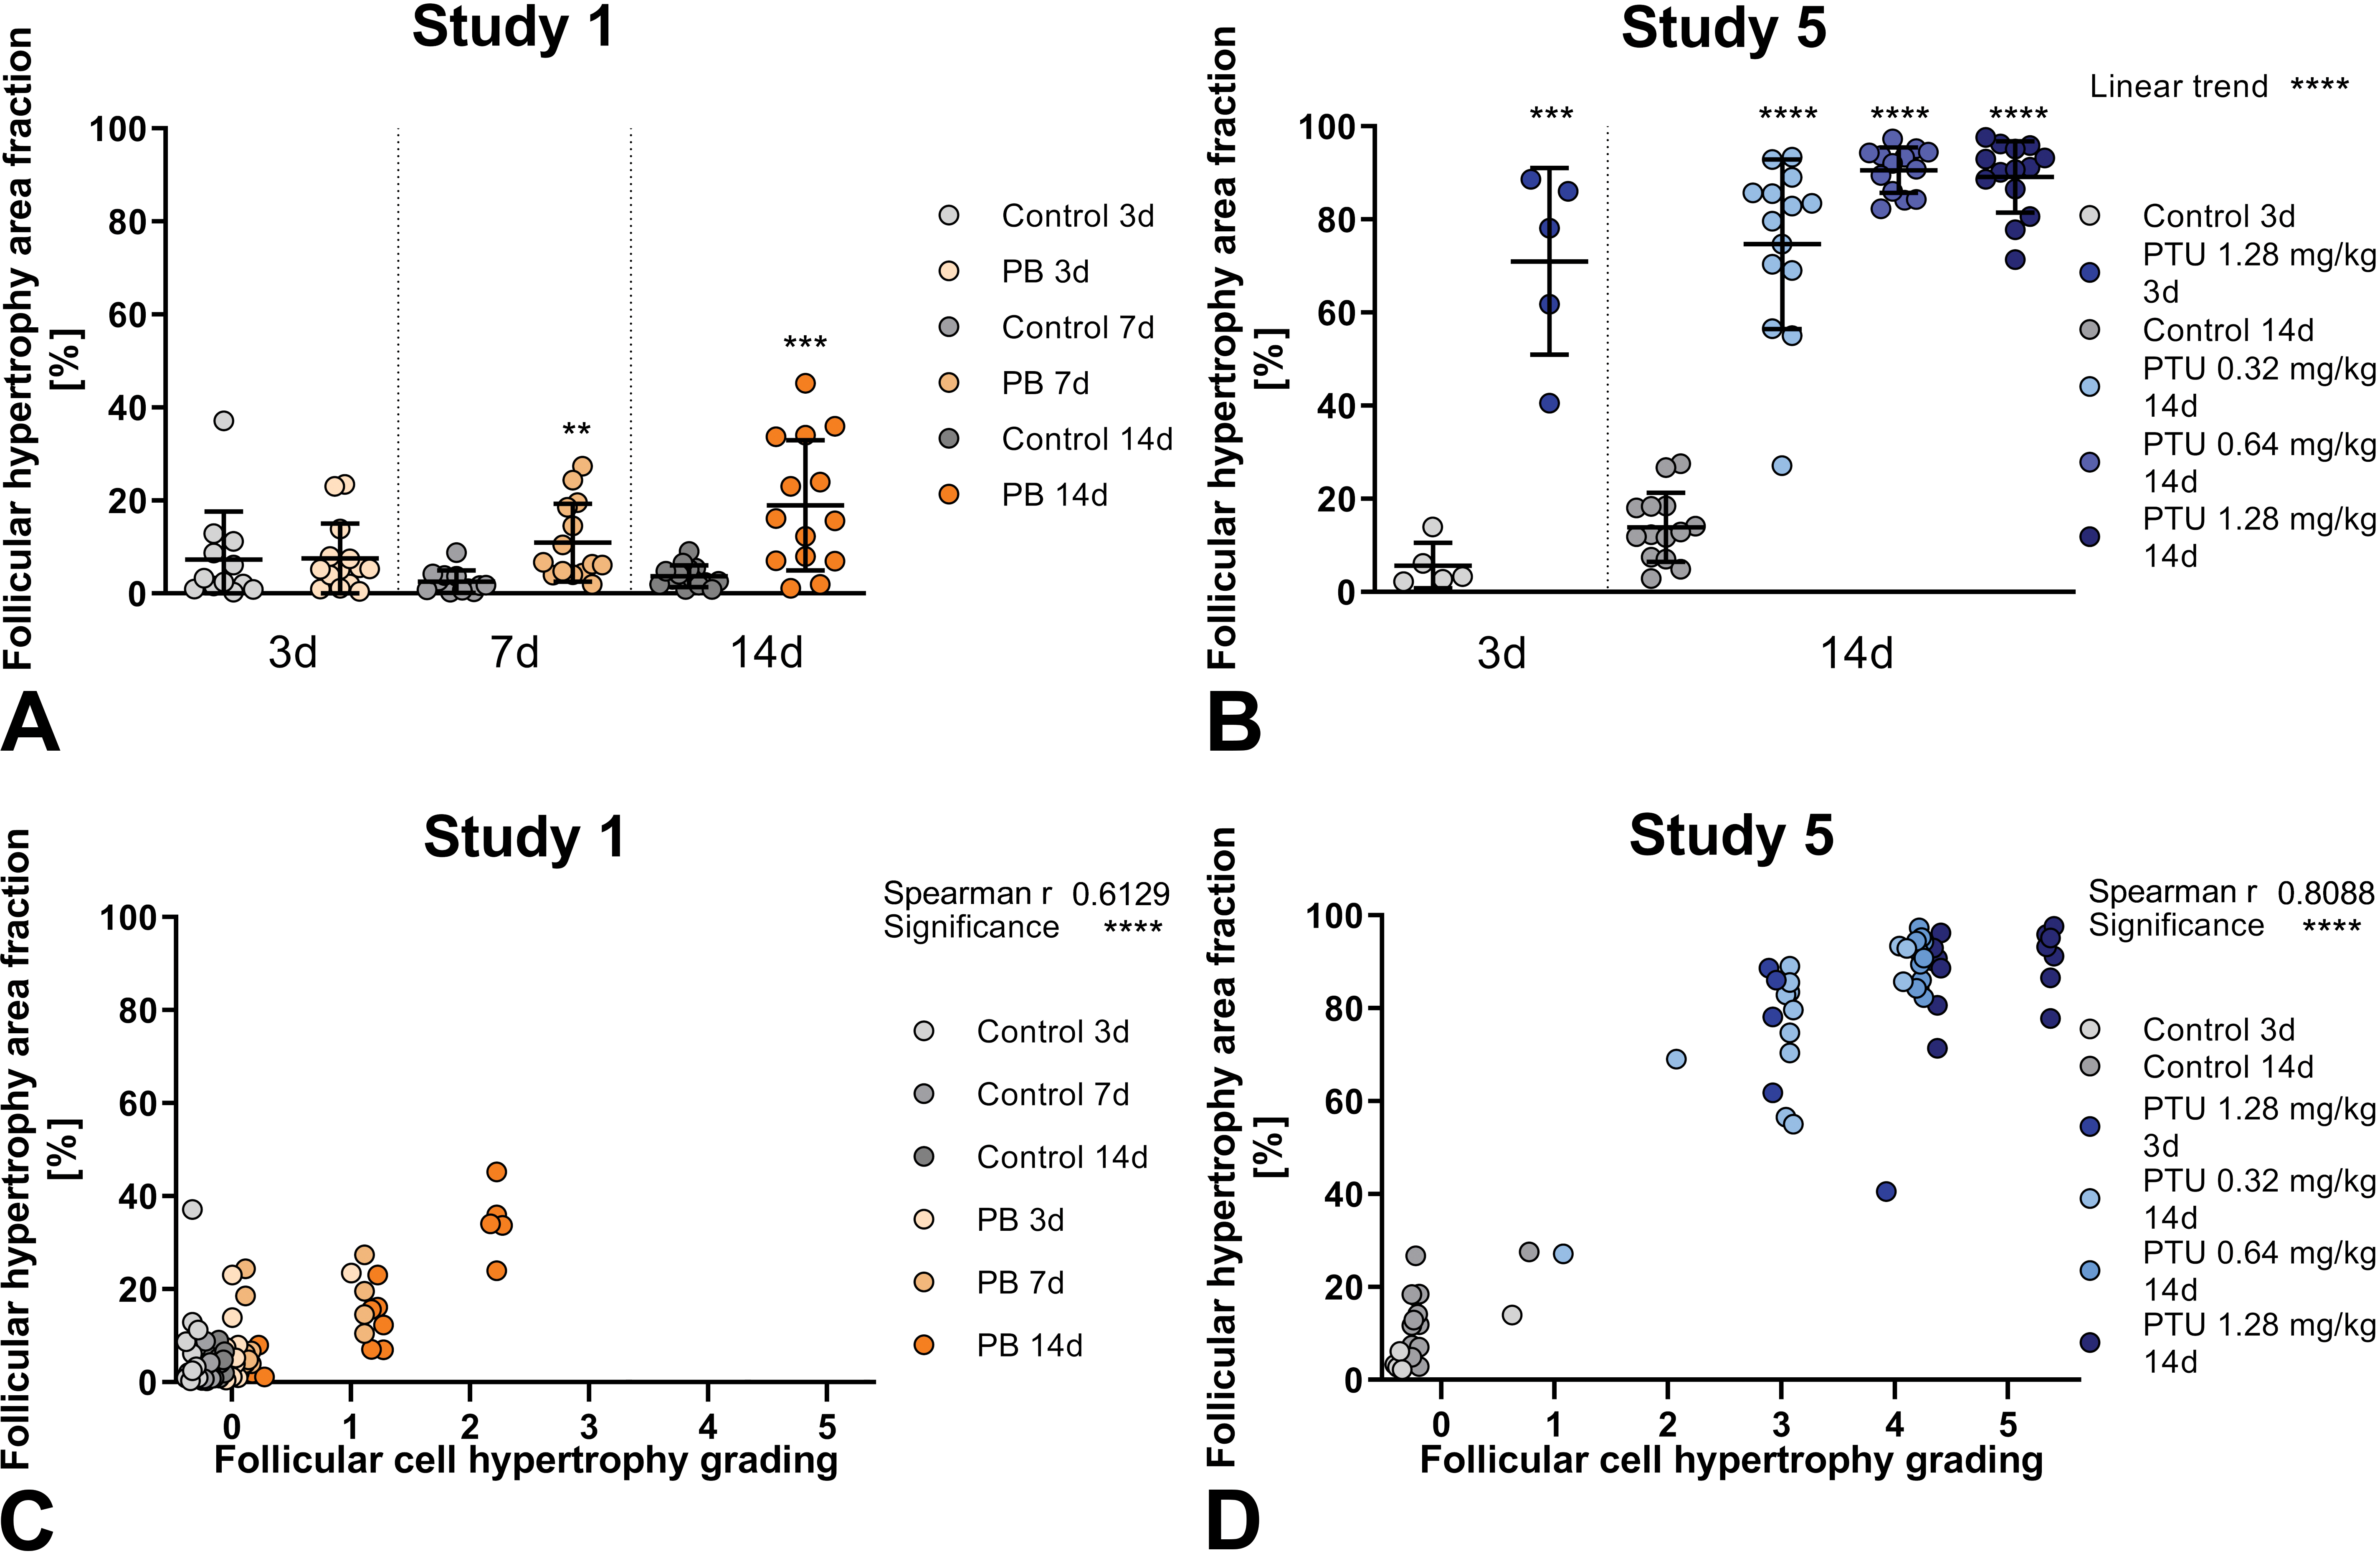
A and B, First row: Follicular cell hypertrophy area fraction predicted by DL algorithm. Note color scheme in the respective legend indicating different reference compounds (propylthiouracil [PTU] blue, phenobarbital [PB] orange) versus control (gray) groups, if available different dosages (study 5) and time points (study 1 and 5) are visualized as shades of colors. Study 1 and 5 individual values and group- or subgroup- means with standard deviation. Each treated group is statistically compared to its respective control group, significant differences shown as asterisks in the graph. Linear trend analysis for dose-dependent effects shown in upper right corner of respective graph. C and D, Second row: Correlation of follicular cell hypertrophy area fraction predicted by DL algorithm to histopathological observation with grading done by pathologists. Statistical correlation shown in upper right corner of respective graph for study 1 and 5. Grades: 0 (no hypertrophy detected), 1 (minimal), 2 (mild), 3 (moderate), 4 (marked), or 5 (severe).
Follicular cell hypertrophy area fraction
All treated groups can be significantly differentiated from the respective vehicle control groups by follicular cell hypertrophy area fraction, shown in the first row of Figure 5 (A and B). The only exception is after 3 days of liver-mediated thyroid toxicant PB treatment, where no significant difference is seen. A linear trend for dose-dependent effects is shown for the follicular cell hypertrophy area fraction, similar to the follicular mean cytoplasmic area.
Comparing the two proposed DL algorithms, the follicular cell hypertrophy area fraction shows larger distinction of the PTU treated groups and the vehicle control groups (study 5) than the follicular mean cytoplasmic area, with an impressive group mean of around 90% of follicular epithelium being hypertrophic in the intermediate and high dose group after 14 days of PTU administration. Especially for the early time point at 3 days of PTU-treatment, already 70% of the follicular epithelium is detected as being hypertrophic, whereas the follicular mean cytoplasmic area in this group was only increased to slightly higher values as the vehicle control group at day 14.
Correlation of histopathological grading to hypertrophy area fraction
Correlation to histopathological grading by the pathologists showed statistical significance for follicular cell hypertrophy area fraction, shown in the second row of Figure 5 (C and D). When compared to mean cytoplasmic area (see Figure 3), hypertrophy area fraction similarly correlates with histopathological grading and furthermore shows better distinction of treated animals to control groups. Nevertheless, similar values for follicular cell hypertrophy area fraction correspond to histopathological overlapping grades ranging from 3 to 5.
Correlation of colloid area fraction to hypertrophy area fraction
Follicular cell hypertrophy area fraction was also correlated to the colloid area fraction, measured by both DL algorithms (see supplemental Figure S6).
The parameters hypertrophy area fraction and colloid area fraction show inverse correlation with high statistical significance with very similar r values as colloid area fraction correlates to cytoplasmic area fraction.
Correlation of gene expression to hypertrophy area fraction
Follicular cell hypertrophy area fraction was also compared to the gene expression data (see supplemental Figure S7).
For all tested genes, there is a significant correlation between expression data and hypertrophy area fraction in both studies. These correlations show similar r values when compared to the respective correlations of gene expression data to cytoplasmic area fraction but there is a tendency to weaker correlation of hypertrophy area fraction with r values slightly closer to 0, except with the Tg and Slc5a5 gene expression in the study 5 where the r values were slightly closer to 1.
Discussion
Algorithm Design and Comparison With Literature
In literature, two other publications 8,14 used AI to evaluate follicular cell hypertrophy. Both quantified follicular epithelial cytoplasm by measuring the average cytoplasmic area, similar to the first herein proposed MCA approach. However, their material and methods sections do not provide detailed descriptions about their algorithm designs, so it is not clear if similar sequential steps are leading to the measured parameter and which microanatomical structures are actually included or excluded in their computational process.
With our first DL network for tissue detection, automated exclusion of nonthyroid gland tissue, like adipose tissue, larger blood vessels, muscle, interspersed parathyroid, or ectopic thymic tissue, was successfully achieved. Furthermore, in the proposed second step, stroma was segmented from follicular epithelium and colloid using another DL network. For the MCA approach, these steps are followed by the last step of DL-based nuclei detection and count within the epithelial compartment and area measurements to calculate the mean cytoplasmic area.
With our HAF approach, outputting hypertrophy area fraction, for the first time to our knowledge, a DL network which directly detects hypertrophy of thyroid follicular cells, has been introduced. This task can be classified as more complex, when compared to our first MCA approach and previously published approaches, because it not only allows for recognition of the microanatomical structures but also for direct prediction of the histopathological change.
Presumed Results
Output results of vehicle control versus treated groups
All the compounds used in the studies are well established inducers of follicular cell hypertrophy in the thyroid gland. 4 Both proposed approaches successfully detected an increase in mean cytoplasmic area and hypertrophy area fraction, respectively, in all treated groups, compared to their controls. The only nonstatistically significant difference was present in the PB-treated group after 3 days of exposure. Since PB is a liver-mediated thyroid toxicant, inducing the follicular cell hypertrophy via increased metabolization of thyroid hormones, the 3-day administration period was presumably not long enough to produce hypertrophy in the thyroid gland. Liver end points of these animals support this with only minimal to mild hepatocellular hypertrophy (grade 1 and 2) diagnosed after 3 days of PB treatment (see liver data previously published by Pischon et al 27 ).
Furthermore, the magnitude of increase of follicular mean cytoplasmic area is smaller in animals given the liver-mediated thyroid toxicant (study 1) at all time points when compared to the direct thyroid toxicants. The same is also evident in the hypertrophy area fraction, where PB-treated animals presented lower percentages when compared to direct toxicants.
Correlation with the gold standard
Both DL-derived parameters, mean cytoplasmic area and hypertrophy area fraction correlate, as expected, with accepted end points. Artificial intelligence and DL methods are validated against current quality standards to ensure effectiveness and concordance. 28 Histopathological observations by the pathologist, colloid area fraction, and gene expression data of study 1 to 5 are in consensus with effects reported for the used xenobiotics in the literature 10,29,30 and are therefore suitable for correlations with AI-derived outputs. Comparisons between morphometric data and other relevant pathological and molecular, semiquantitative and quantitative parameters have been enabled by the availability of results obtained by the AI algorithms in a continuous numerical scale. 8
Correlation with gene expression
We can note the presence of a correlation of the DL methods with the gold standard but also with molecular biomarkers. Indeed, the follicular mean cytoplasmic area is well correlated with the expression of 3 genes classically used to study thyroid function, such as Slc5a5, Tg, and Dio1. 30
Slc5a5 is the gene coding for the NIS allowing the entry of iodide from the bloodstream into the cytoplasm and is therefore a key transporter in the synthesis of thyroid hormones. For all the products studied, the expression of this gene is well correlated with the mean cytoplasmic area. It is interesting to note that a lower deregulation is observed in the case of an indirect thyroid toxicant, such as PB. Moreover, the expression of the Slc5a5 gene may provide additional information in discriminating the mode of action. Indeed, in the case of SP and PB, a mild increase in mean cytoplasmic area was observed in both studies. On the other hand, the expression of the Slc5a5 gene is clearly increased following treatment with SP, whereas this upregulation is very weak in the case of PB.
Tg, a macromolecule, is a precursor of T3 and T4 synthesis located in the colloid. As in the case of Slc5a5, there is a good correlation between the mean cytoplasmic area and the expression of Tg gene. This correlation is slightly less marked with MMI but this can be explained in part by the high variability observed in the measurement of the mean cytoplasmic area. As with Slc5a5, deregulation is less important in the case of PB.
Dio1 is the deiodinase involved in the conversion of T4 to T3 in different tissues. The correlation between Dio1 gene expression and mean cytoplasmic area is variable depending on the products studied. Similar to Slc5a5, the measurement of Dio1 gene expression provides additional information in the discrimination of the modes of action. Indeed, for SP and PB, even though the follicular mean cytoplasmic area is not greatly impacted, the measurement of Dio1 gene expression allows the discrimination between treatment groups for SP (direct thyroid toxicant) but not for PB (indirect thyroid toxicant). It is not surprising that there is a negative correlation with PTU because it is not only an inhibitor of TPO but also of Dio1 gene expression. 31 However, we could expect to observe a stronger correlation in the case of MMI.
Overall, there is a good correlation between the two parameters, molecular and morphological. The concomitant use of these DL models and molecular parameters, in association with additional marker genes of thyroid function, allows us to be more accurate in the identification of the mode of action, especially for products inducing only little increase of the mean cytoplasmic area but also for subtoxic dose levels.
Unexpected Results
Values of mean cytoplasmic area, computed using the MCA approach, have slight differences between the studies in their mean baseline values of control groups but also differences in interindividual variability within each group. Particularly in study 2 and 3, individual values are quite scattered within the groups including the vehicle control group. Ideally, all control animals should have similar cell dimensions, based on the use of same species, strain (WI: Han) and similar age. But especially growing male animals can have interindividual differences in thyroid activity and therefore varying height of the follicular epithelium. 1 Study-specific differences could originate from intrinsic characteristics of the studies. Animals used for study 2 and 3, originated from a different breeder with slightly older animals, compared to the other studies. Animals in study 2 and 3 were approximately 14 weeks old at the study end, compared to animals of approximately 10 weeks of age in study 1, 4, and 5. Therefore, the slight difference in mean cytoplasmic area could represent normal strain or age-specific variability. An alternative hypothesis could be based on senescing of staining, since glass slides from these studies had been stored longer (approximately 5 years) in the archives, compared to the other studies. The effect of the fading of aged stained slides is a well-established variable for the output of AI predictions. 32 In fact, some long-time archived studies were included in the training set to increase morphological variability due to archiving and make our algorithm more robust. Furthermore, tissue preparation, fixation, and staining can slightly vary between studies. These differences can all potentially hamper the correct segmentation of follicular cytoplasm, affecting the final numerical output and algorithm performance. Hence, comparison of absolute mean cytoplasmic area, across multiple studies, should be carefully evaluated, considering the variability introduced in the training set and critically reviewing the differences in study designs.
Overlapping of different gradings of thyroid follicular cell hypertrophy by the pathologist over similar values of predicted mean cytoplasmic area was observed. Especially in study 4 only a small difference in mean cytoplasmic area corresponds to a large difference in grading (grade 0 to grade 4 or 5) by the pathologist (see Figure 3). This could be due to overestimation of changes by the pathologist, but this is unlikely considering the magnitude of difference between grade 0 to 5; moreover, no standardized grading scheme for follicular cell hypertrophy has been generally accepted. 1 Mean cytoplasmic area is depicting the overall mean cytoplasm size where a few very large cells or a lot of only minimally enlarged cells might lead to similar values. However, those 2 scenarios could lead to a different interpretation and therefore a different grading by the pathologist. Thus, how to translate a possibly more objective measured value 33 back to the grading scheme, used by pathologists, which is influenced by multiple factors (not only the cell size), needs to be evaluated with further research.
Interestingly, hypertrophy area fraction allows a better differentiation of control and treated animals. There is less overlapping of similar hypertrophy area fraction values with grade 0 and high grades, but still overlapping between adjacent gradings is present. This might point to a higher sensitivity of the parameter hypertrophy area fraction, compared to mean cytoplasmic area.
It is stated that variation in thyroid gland morphology across different species, sexes, strains, and studies complicates application of a common set of grading criteria. 1 Thus, repeatability between different pathologists can be improved, providing them with continuous numerical data defining the hypertrophic change.
Furthermore, in the setting of grading criteria, the degree of change (ie, estimate of effect on cell size) and the distribution (ie, extent of gland affected) are considered fundamental. 1 The 2 readouts hereby presented, respectively, mean cytoplasmic area and hypertrophy area fraction, objectify and quantify these parameters. Thus, integrating these readouts in the grading system can increase its accuracy.
Conclusion
The two novel DL-based models presented herein are useful supporting tools for the pathologist to evaluate follicular cell hypertrophy in the thyroid gland. The predicted DL model outputs, follicular mean cytoplasmic area and hypertrophy area fraction, as well as colloid area fraction, are quantitative parameters which can be complemented with molecular end points (like gene expression of thyroid function markers) and have great potential to improve inter- and intra-observer variability, accuracy, sensitivity, and efficiency of the pathologists’ diagnose, grading, and interpretation.
Supplemental Material
Supplemental Material, sj-docx-1-tpx-10.1177_01926233211052010 - Artificial Intelligence in Toxicological Pathology: Quantitative Evaluation of Compound-Induced Follicular Cell Hypertrophy in Rat Thyroid Gland Using Deep Learning Models
Supplemental Material, sj-docx-1-tpx-10.1177_01926233211052010 for Artificial Intelligence in Toxicological Pathology: Quantitative Evaluation of Compound-Induced Follicular Cell Hypertrophy in Rat Thyroid Gland Using Deep Learning Models by Valeria Bertani, Olivier Blanck, Davy Guignard, Frederic Schorsch and Hannah Pischon in Toxicologic Pathology
Supplemental Material
Supplemental Material, sj-docx-2-tpx-10.1177_01926233211052010 - Artificial Intelligence in Toxicological Pathology: Quantitative Evaluation of Compound-Induced Follicular Cell Hypertrophy in Rat Thyroid Gland Using Deep Learning Models
Supplemental Material, sj-docx-2-tpx-10.1177_01926233211052010 for Artificial Intelligence in Toxicological Pathology: Quantitative Evaluation of Compound-Induced Follicular Cell Hypertrophy in Rat Thyroid Gland Using Deep Learning Models by Valeria Bertani, Olivier Blanck, Davy Guignard, Frederic Schorsch and Hannah Pischon in Toxicologic Pathology
Supplemental Material
Supplemental Material, sj-docx-3-tpx-10.1177_01926233211052010 - Artificial Intelligence in Toxicological Pathology: Quantitative Evaluation of Compound-Induced Follicular Cell Hypertrophy in Rat Thyroid Gland Using Deep Learning Models
Supplemental Material, sj-docx-3-tpx-10.1177_01926233211052010 for Artificial Intelligence in Toxicological Pathology: Quantitative Evaluation of Compound-Induced Follicular Cell Hypertrophy in Rat Thyroid Gland Using Deep Learning Models by Valeria Bertani, Olivier Blanck, Davy Guignard, Frederic Schorsch and Hannah Pischon in Toxicologic Pathology
Supplemental Material
Supplemental Material, sj-docx-4-tpx-10.1177_01926233211052010 - Artificial Intelligence in Toxicological Pathology: Quantitative Evaluation of Compound-Induced Follicular Cell Hypertrophy in Rat Thyroid Gland Using Deep Learning Models
Supplemental Material, sj-docx-4-tpx-10.1177_01926233211052010 for Artificial Intelligence in Toxicological Pathology: Quantitative Evaluation of Compound-Induced Follicular Cell Hypertrophy in Rat Thyroid Gland Using Deep Learning Models by Valeria Bertani, Olivier Blanck, Davy Guignard, Frederic Schorsch and Hannah Pischon in Toxicologic Pathology
Supplemental Material
Supplemental Material, sj-tif-1-tpx-10.1177_01926233211052010 - Artificial Intelligence in Toxicological Pathology: Quantitative Evaluation of Compound-Induced Follicular Cell Hypertrophy in Rat Thyroid Gland Using Deep Learning Models
Supplemental Material, sj-tif-1-tpx-10.1177_01926233211052010 for Artificial Intelligence in Toxicological Pathology: Quantitative Evaluation of Compound-Induced Follicular Cell Hypertrophy in Rat Thyroid Gland Using Deep Learning Models by Valeria Bertani, Olivier Blanck, Davy Guignard, Frederic Schorsch and Hannah Pischon in Toxicologic Pathology
Supplemental Material
Supplemental Material, sj-tif-2-tpx-10.1177_01926233211052010 - Artificial Intelligence in Toxicological Pathology: Quantitative Evaluation of Compound-Induced Follicular Cell Hypertrophy in Rat Thyroid Gland Using Deep Learning Models
Supplemental Material, sj-tif-2-tpx-10.1177_01926233211052010 for Artificial Intelligence in Toxicological Pathology: Quantitative Evaluation of Compound-Induced Follicular Cell Hypertrophy in Rat Thyroid Gland Using Deep Learning Models by Valeria Bertani, Olivier Blanck, Davy Guignard, Frederic Schorsch and Hannah Pischon in Toxicologic Pathology
Supplemental Material
Supplemental Material, sj-tif-3-tpx-10.1177_01926233211052010 - Artificial Intelligence in Toxicological Pathology: Quantitative Evaluation of Compound-Induced Follicular Cell Hypertrophy in Rat Thyroid Gland Using Deep Learning Models
Supplemental Material, sj-tif-3-tpx-10.1177_01926233211052010 for Artificial Intelligence in Toxicological Pathology: Quantitative Evaluation of Compound-Induced Follicular Cell Hypertrophy in Rat Thyroid Gland Using Deep Learning Models by Valeria Bertani, Olivier Blanck, Davy Guignard, Frederic Schorsch and Hannah Pischon in Toxicologic Pathology
Supplemental Material
Supplemental Material, sj-tif-4-tpx-10.1177_01926233211052010 - Artificial Intelligence in Toxicological Pathology: Quantitative Evaluation of Compound-Induced Follicular Cell Hypertrophy in Rat Thyroid Gland Using Deep Learning Models
Supplemental Material, sj-tif-4-tpx-10.1177_01926233211052010 for Artificial Intelligence in Toxicological Pathology: Quantitative Evaluation of Compound-Induced Follicular Cell Hypertrophy in Rat Thyroid Gland Using Deep Learning Models by Valeria Bertani, Olivier Blanck, Davy Guignard, Frederic Schorsch and Hannah Pischon in Toxicologic Pathology
Supplemental Material
Supplemental Material, sj-tif-5-tpx-10.1177_01926233211052010 - Artificial Intelligence in Toxicological Pathology: Quantitative Evaluation of Compound-Induced Follicular Cell Hypertrophy in Rat Thyroid Gland Using Deep Learning Models
Supplemental Material, sj-tif-5-tpx-10.1177_01926233211052010 for Artificial Intelligence in Toxicological Pathology: Quantitative Evaluation of Compound-Induced Follicular Cell Hypertrophy in Rat Thyroid Gland Using Deep Learning Models by Valeria Bertani, Olivier Blanck, Davy Guignard, Frederic Schorsch and Hannah Pischon in Toxicologic Pathology
Supplemental Material
Supplemental Material, sj-tif-6-tpx-10.1177_01926233211052010 - Artificial Intelligence in Toxicological Pathology: Quantitative Evaluation of Compound-Induced Follicular Cell Hypertrophy in Rat Thyroid Gland Using Deep Learning Models
Supplemental Material, sj-tif-6-tpx-10.1177_01926233211052010 for Artificial Intelligence in Toxicological Pathology: Quantitative Evaluation of Compound-Induced Follicular Cell Hypertrophy in Rat Thyroid Gland Using Deep Learning Models by Valeria Bertani, Olivier Blanck, Davy Guignard, Frederic Schorsch and Hannah Pischon in Toxicologic Pathology
Supplemental Material
Supplemental Material, sj-tif-7-tpx-10.1177_01926233211052010 - Artificial Intelligence in Toxicological Pathology: Quantitative Evaluation of Compound-Induced Follicular Cell Hypertrophy in Rat Thyroid Gland Using Deep Learning Models
Supplemental Material, sj-tif-7-tpx-10.1177_01926233211052010 for Artificial Intelligence in Toxicological Pathology: Quantitative Evaluation of Compound-Induced Follicular Cell Hypertrophy in Rat Thyroid Gland Using Deep Learning Models by Valeria Bertani, Olivier Blanck, Davy Guignard, Frederic Schorsch and Hannah Pischon in Toxicologic Pathology
Footnotes
Acknowledgments
We thank the technical team of Mechanistic Toxicology & Pathology group of Bayer CropScience SAS for their support in retrieval and digitalization of histopathological glass slides and gene expression analysis. We thank David Mason and Alime Sema Teksen for technical support of Visiopharm software.
Declaration of Conflicting Interests
The author(s) declared the following potential conflicts of interest with respect to the research, authorship, and/or publication of this article. Frederic Schorsch, Olivier Blanck, Davy Guignard, and Valeria Bertani are currently or were previously employees of Bayer Crop Science SAS, a developer of agricultural products. Hannah Pischon is an employee of Nuvisan ICB GmbH. None of the authors received a compensation, additional to their salary, for this publication. This research study was a feasibility study/proof of concept. Results are published to make data available for the public and do not promote a product commercially exploited by Bayer.
Funding
The author(s) received no financial support for the research, authorship, and/or publication of this article.
Supplemental Material
Supplemental material for this article is available online.
References
Supplementary Material
Please find the following supplemental material available below.
For Open Access articles published under a Creative Commons License, all supplemental material carries the same license as the article it is associated with.
For non-Open Access articles published, all supplemental material carries a non-exclusive license, and permission requests for re-use of supplemental material or any part of supplemental material shall be sent directly to the copyright owner as specified in the copyright notice associated with the article.