
Abstract
Digital pathology evolved rapidly, enabling more systematic usage of image analysis and development of artificial intelligence (AI) applications. Here, combined AI models were developed to evaluate hepatocellular hypertrophy in rat liver, using commercial AI-based software on hematoxylin and eosin-stained whole slide images. In a first approach, deep learning-based identification of critical tissue zones (centrilobular, midzonal, and periportal) enabled evaluation of region-specific cell size. Mean cytoplasmic area of hepatocytes was calculated via several sequential algorithms including segmentation in microanatomical structures (separation of sinusoids and vessels from hepatocytes), nuclear detection, and area measurements. An increase in mean cytoplasmic area could be shown in groups given phenobarbital, known to induce hepatocellular hypertrophy when compared to control groups, in multiple studies. Quantitative results correlated with the gold standard: observation and grading performed by board-certified veterinary pathologists, liver weights, and gene expression. Furthermore, as a second approach, we introduce for the first time deep learning-based direct detection of hepatocellular hypertrophy with similar results. Cell hypertrophy is challenging to pick up, particularly in milder cases. Additional evaluation of mean cytoplasmic area or direct detection of hypertrophy, combined with histopathological observations and liver weights, is expected to increase accuracy and repeatability of diagnoses and grading by pathologists.
Keywords
Introduction
In the development of pharmaceutical and agrochemical compounds, hepatocellular hypertrophy in rodent toxicity studies is a critical finding, due to its frequency of occurrence and its broad spectrum of significance, ranging from adaptive physiological responses to adverse pathological effects, including toxicity and carcinogenicity. 1,2
Hepatocellular hypertrophy refers to an increased size of hepatocytes and is considered a trait of adaptative enzyme induction, particularly phase I and II drug metabolic enzymes, when associated with an increased protein synthesis or increased number of cytoplasmic organelles. 2
A large number of xenobiotics, with different chemical structures, induce hepatocellular hypertrophy with an increase in liver size, weight, and functional capacity.
Most xenobiotics associated with hypertrophy are bifunctional inducers, 1,2 like phenobarbital (PB), which induces both phase I (e.g., cytochrome P450 [CYP] isoforms: CYP2B, CYP2C, and CYP3A) and phase II (e.g., microsomal uridine diphosphate glucuronosyltransferase [UGT] enzymes) xenobiotic metabolizing enzymes. 3 –5
The result of enzyme induction in rodent livers includes altered pharmacokinetic profiles and toxicological effects in the liver itself and other organs. 6 An approach to detect enzyme induction is quantitative determination of messenger RNA levels by using real-time quantitative reverse transcription-polymerase chain reaction (RT-qPCR). Phenobarbital elicits increased expression of the human Cyp2b6, the murine Cyp2b10, and the rat’s Cyp2b1 genes but is also associated with upregulation of subfamilies CYP1A, CYP2C, CYP3A, and UGT. 7 Since toxicogenomic profiling may anticipate clinical chemistry, histopathology, or even ultrastructural changes, it is possible to gain insight into the early signaling perturbations that presage toxicologic change. 8
In addition to those molecular approaches or other routine clinical pathology measurements, histopathological evaluation remains the gold standard for decision-making in toxicology because it allows a broad evaluation of the changes in organs. Particularly, morphological assessment of hepatocellular hypertrophy may add an important and valuable qualitative parameter to support decision-making for diagnosing and grading. However, morphological analysis is essentially limited by its subjective nature and differences in visual perception and judgment between independent observers. This is especially the case for grading the severity 9 of hypertrophy, which can be challenging and less precise than relying on liver weight or quantitative measurement of enzyme induction. 2 Therefore, beside systematic training and use of standardized guidelines, in order to evaluate these histopathological alterations objectively, toxicologic pathologists could benefit from automated quantitative microscopic measurements. 1,10
The advent of whole slide imaging in digital pathology has brought innovation in the development of computer-aided examination of tissue via digital image analysis, both in preclinical 11,12 and clinical 13 areas. Although image analysis tools not only reduce bias generated by both visual and cognitive errors, they also enable generation of data from tissue slides that may not be available during manual assessment via routine microscopy. 12
Furthermore, automated image quantification can perform routine evaluations in a reproducible manner with high throughput, greatly reducing interobserver variability, and enabling complex tasks. 14
In preclinical studies, some approaches, mainly cell-based classifier and simple pattern recognition algorithms, 15,16 have been tested using whole slide image (WSI) analysis as a supportive tool for the pathologist’s evaluation of hepatocellular hypertrophy. 1,14,17
However, digital pathology and image analysis are experiencing important innovations introduced by artificial intelligence (AI) approaches. These have been applied to a variety of image processing and classification tasks, like object recognition, as well as higher-level tasks, such as computer-aided diagnosis and prognosis definition, based on new histological patterns. 18 It has been estimated that these innovations, driven by AI, might reduce or eliminate the 10% error/discordance rate in the characterization of microscopic lesions by toxicologic pathologists. 11
Artificial intelligence approaches, particularly deep learning methods, typically involve a training set of images with associated class labels, defined by experienced pathologists, and subsequent interrogation of new input image data with no pre-existing assumptions, defined as test set. The process is based on learning the optimal image features from a training set, which will best predict attribution to labels of interest in a test set. 18 This allows segmentation of complex structures, such as single hepatocytes, detection of specific cellular morphologic changes, or enabling for complex visual evaluations, such as increase in cytoplasm content for hypertrophy.
Here we present an innovative approach of image analysis, including deep learning techniques, to segment liver tissue structures and nuclei to obtain a mean cytoplasmic area of hepatocytes; this approach is tested on 2 studies with the hypertrophy-inducing reference compound PB.
We evaluate the usefulness of this supportive tool for pathology evaluation by comparing the generated values of mean cytoplasmic area to pathologist’s grading, relative organ weight, and gene expression data.
Furthermore, for a selected study, we compare these data to a deep learning classifier directly trained to detect hepatocellular hypertrophy in comparison to normal tissue.
Materials and Methods
Animal Experiments
For this publication, existing histological slides from previously conducted studies (mechanistic characterization of reference compounds or additional positive control and vehicle control groups) for the development of new substances were used for the image analysis. Thus, study protocols and available groups are not equal between the different studies. All studies were performed according to the national and European regulations, regarding the use of laboratory animals, and were approved by the national authorities and the local ethical committee (French Ministry of Higher Education and Research; agreement number CEEA-57). Evaluations were done on all available data generated from the studies. All test items were administered via gavage to Wistar rats (Charles River Laboratories, St Germain-sur-l’Arbresle, France or R. Janvier, Le Genest St Isle, France). The most important differences in the study designs of the test set are summarized in Table 1, 19 whereas studies used for development of the algorithms (training set) are listed in Supplemental Table S1. 20
Summary of Study Protocol Differences (Test Set). 19,a
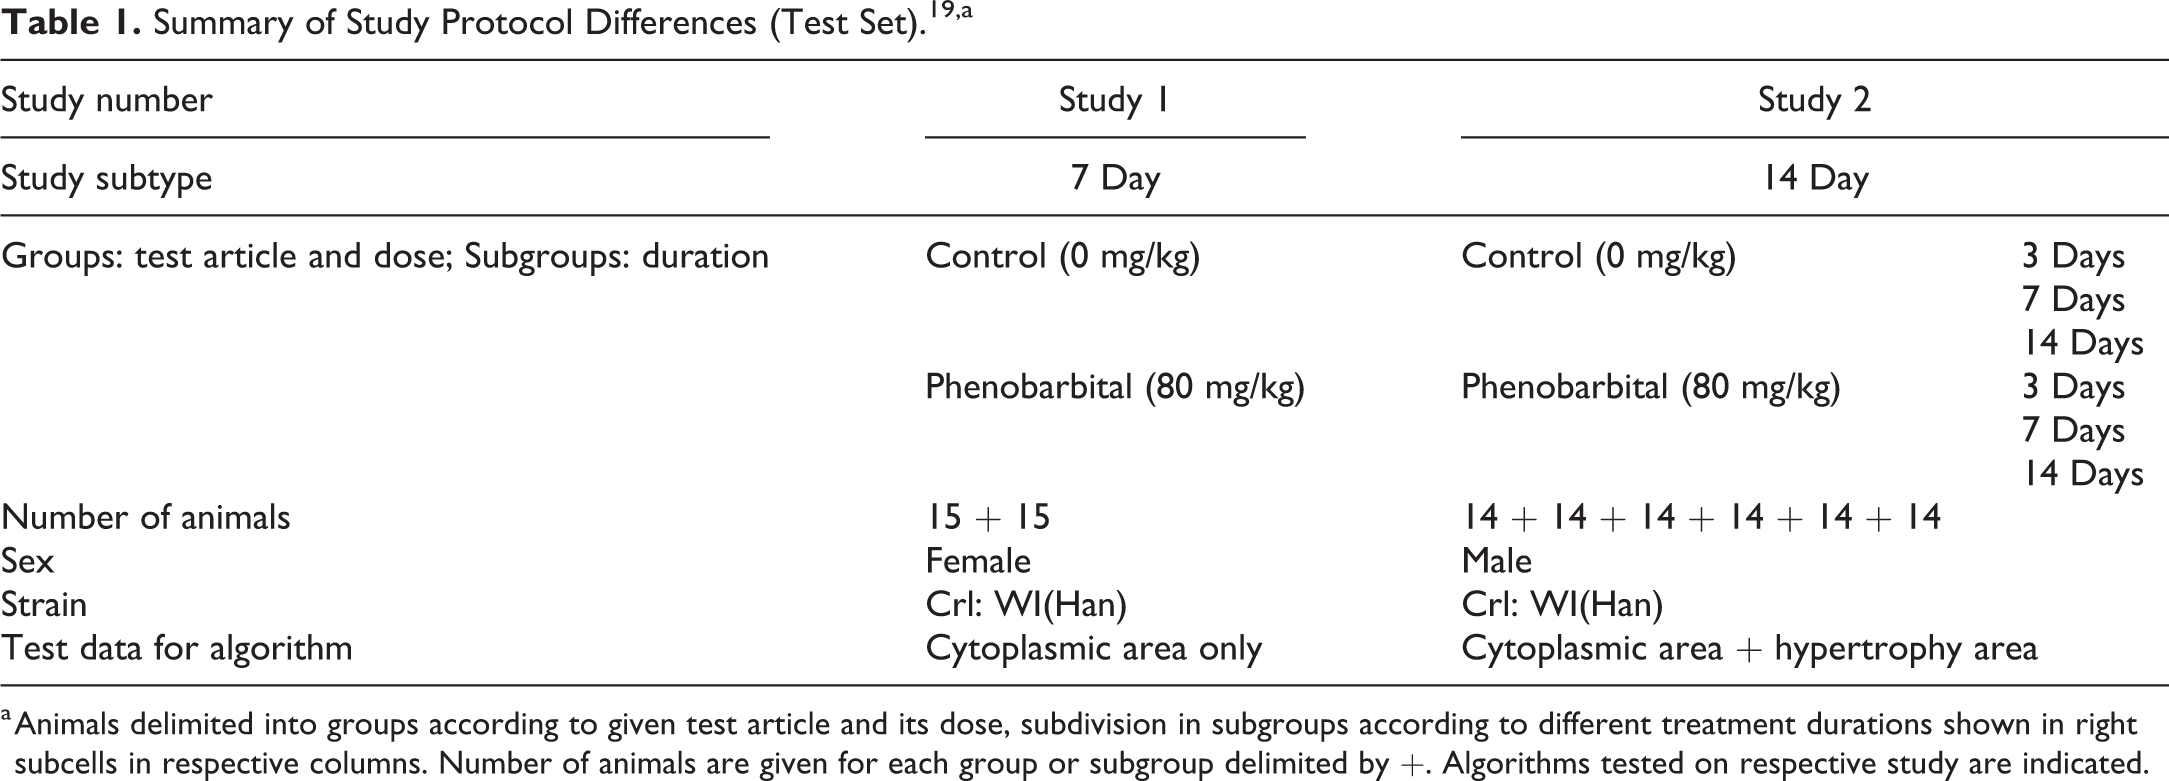
a Animals delimited into groups according to given test article and its dose, subdivision in subgroups according to different treatment durations shown in right subcells in respective columns. Number of animals are given for each group or subgroup delimited by +. Algorithms tested on respective study are indicated.
Histopathological Observations
Liver was weighed, using a precision scale, prior to fixation in 10% neutral buffered formalin. Fixed tissue was trimmed according to Registry of Industrial Toxicology Animal-data trimming guides, 21 paraffin embedded, sectioned at approximately 4 µm, and stained with hematoxylin and eosin (H&E) using standard protocols. Histopathological examination, including grading (0 [no hypertrophy detected], 1 [minimal], 2 [mild], 3 [moderate], 4 [marked], or 5 [severe]), has been done under standard light microscopes by experienced board-certified veterinary pathologists trained in laboratory animal pathology.
Histopathological Image Analysis
Slides were digitized, after different periods of being archived, using a digital slide scanner (Aperio AT2, Leica Biosystems Imaging, Inc). Slides were scanned with a 20× objective lens (20×/0.75 NA Plan Apo) at resolution 0.5 microns/pixel.
For image analysis of the test set, the right medial liver lobe was included in the analysis; areas with artifacts like folds, tears, or blurred areas were excluded manually. No manual adjustments for variation in staining, contrast, or thresholding between WSIs have been performed.
Visiopharm software (version 2020.01 and 2020.03, Denmark) was used to train the deep learning networks for development of our AI algorithms. We trained our deep learning networks (U-Net architecture 22 ), exclusively on manually drawn or manually corrected labels, within fully labeled regions of interests (ROI). Labels were done by veterinary pathologists, on WSIs from studies only used in the training sets. Each deep learning network was trained on at least 28 WSIs from 7 different studies with at least 250,000 iterations. Detailed information about the studies used in the training sets is listed in Supplemental Table S1. 20 The areas of the ROIs were not standardized but were adjusted according to the distribution of trained classes and were similar in size between different WSIs. In total, 105×106 µm2 labeled liver tissue was subject to training of the different algorithms. Detailed ROI area summaries per slide and study are provided in Supplemental Table S1. 20 The ROIs and WSI were selected freely by the annotating pathologist focusing on including as much variability in staining and tissue morphology as possible in the training set. The variability of the training set was furthermore increased by basic data augmentation as built in default settings within Visiopharm training, including rotation, flipping of labeled tissue regions, as well as changes in brightness and contrast.
Detailed description of stepwise image analysis
Hepatocellular mean cytoplasmic area determination
A simple tissue detection step, using thresholding techniques, selected automatically on the slide the area containing tissue, excluding the border area in a rim of 200 pixels (around 400 µm) due to frequent artifacts in this region. A manual step followed, excluding different organs, which might have been on the same glass slide, the second liver lobe for time efficiency reasons as well as artifacts like large folds or tears. Afterward, a deep learning classifier, trained to differentiate between portal tracts and central veins, was run including postprocessing steps to improve the predictions. As a last step, a second deep learning algorithm was used to segment sinusoids, to be excluded, and hepatocellular nuclei from the rest. This rest was considered to be hepatocellular cytoplasm and was divided into predicted cytoplasm of each single hepatocyte. Since distinct cell borders are hard to detect in H&E stained sections, the division into single cells was done by radiating expansions around the detected nuclei, until it reached an expansion around the neighboring nuclei or a different class label other than cytoplasm. Postprocessing was performed in this step, including sorting the individual hepatocytes in zonal affiliation according to their distance to previously classified portal tracts and central veins. In proximity of 200 µm to the respective structure, hepatocytes were defined as centrilobular or periportal, all remaining hepatocytes were considered to be midzonal. Areas of cytoplasm of each hepatocyte were measured separately, rejecting cytoplasm lacking a nucleus, enabling evaluation of the variability of cell size within 1 slide (data not shown). Mean hepatocellular cytoplasmic area with its standard deviation per animal was calculated using Excel (AVERAGE and STDEVP, Excel, Microsoft Office 365 ProPlus). Mean hepatocellular cytoplasmic area per group with standard deviation was calculated using GraphPad Prism (version 5.04 for Windows, GraphPad Software, www.graphpad.com). The postprocessing also allowed for detection of binucleated cells (only those with 2 nuclei not fully separated by cytoplasm are detected) and evaluation of their zonal distribution (see Supplemental Figure S1). 23
Hepatocellular hypertrophy area fraction determination
In a different approach, a deep learning network was trained to directly classify/detect hepatocellular hypertrophy following the tissue detection and the classification step of central veins and portal tracts, as described before. This direct classifier of hepatocellular hypertrophy was trained also with manually drawn or manually corrected labels of normal hepatocellular cytoplasm as the first class and hypertrophic hepatocellular cytoplasm as the second class and sinusoids and nuclei as further classes. The training set was composed of the same 28 control WSIs from the same 7 studies, as the other algorithms were already trained with, but additionally, labels of hypertrophic hepatocellular cytoplasm, using 6 WSIs of the study number 1 with moderate hepatocellular hypertrophy, were added to train the direct classifier algorithm. This study was logically excluded from the test set for the evaluation with this algorithm. Total area of hypertrophic cytoplasm is divided by the area sum of hypertrophic and nonhypertrophic cytoplasm to gain the percentage of hepatocellular hypertrophy per animal. Mean hepatocellular hypertrophy area fraction per group with standard deviation was calculated using GraphPad Prism (version 5.04 for Windows, GraphPad Software, www.graphpad.com).
Gene Transcript Analyses
Tissue sampling, RNA purification, and RT-qPCR analysis were performed according to the standard protocols. 24 Briefly, RNA from a small portion of liver of around 250 mg was isolated using RNeasy Mini kits (Qiagen). RNA was quantified and controlled using the Quant-iT RiboGreen RNA Assay Kit (Invitrogen) on the Infinite F500 machine (Tecan). Quality and integrity of RNA were assessed based on the ribosomal RNA electrophoretic profiles using a LabChip GX Touch (Perkin Elmer). The qPCR reaction was performed using the Taqman Gene expression master mix (Applied Biosystems) with preamplified complementary DNAs (reverse transcription master mix, Fluidigm) and Taqman assays (Assays on demand, Applied Biosystems) on a BioMark machine (Fluidigm). Test genes and reference genes are listed in Supplemental Table S2. 25 RNase free water was used as negative control. The RT-qPCR data were analyzed using the Delta Delta threshold cycle Method. 26 Normalization was done using cycle threshold (CT) mean values of up to 4 housekeeping genes. Fold change data (2ΔΔCT) are depicted in the graphs normalized to the average ΔCT of the control group.
Statistical Analysis
For hepatocellular mean cytoplasmic area and hypertrophy area fraction, analysis of variance (ANOVA) was used to evaluate differences with respective vehicle control groups. A correction for multiple comparisons (Bonferroni) was applied. Correlation between parameters has been performed for all available data points, using Spearman correlation; α error = 0.05 was the chosen threshold for significance. P values are reported when P ≤.05 as 1 asterisk, P ≤ .01 as 2 asterisks, P ≤ .001 as 3 asterisks, and P ≤ .0001 as 4 asterisks.
Gaussian distribution of mean cytoplasmic area and hypertrophy area fraction was assumed. Statistical analyses were performed using GraphPad Prism (version 5.04 for Windows, GraphPad Software, www.graphpad.com).
Results
Mean Cytoplasmic Area Measuring Classifier
Algorithm for hepatocellular mean cytoplasmic area in zonal differentiation
We calculated the mean cytoplasmic area using multiple deep learning algorithms trained to classify the different microanatomical structures, like portal tracts and central veins or to segment sinusoids and hepatocellular nuclei from the rest, declared as hepatocellular cytoplasm, artificially split into single cells around detected nuclei. The hepatocytes were assigned to a specific zone by their distance to the classified portal tracts and central veins, yielding values for cytoplasmic areas of centrilobular, midzonal, and periportal hepatocytes. Figure 1 shows an example of the fully classified liver tissue after all algorithms ran over it. Cytoplasmic area was measured for each cell separately within the transverse section of 1 liver lobe. Based on these data, the mean cytoplasmic area per slide, equaling per animal, was calculated for each zone and means per group were compared to the vehicle control of the respective zone. The data for 2 different studies are depicted in Figure 2.
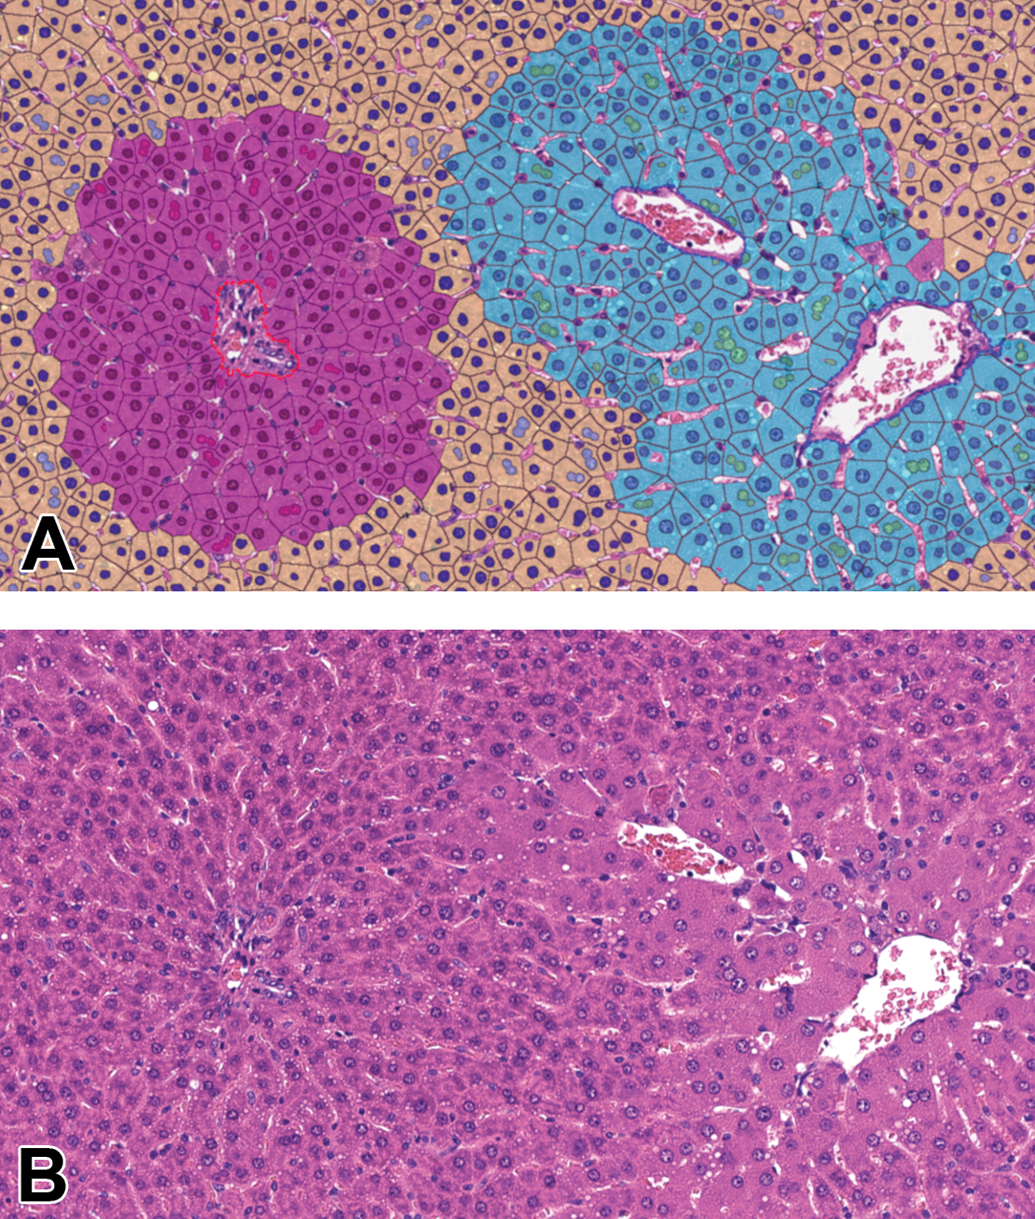
Segmentation achieved by AI algorithm resulting in mean cytoplasmic area measurements. Liver, H&E, original scan 20×, phenobarbital (PB)-treated study 1. A, Classification as false colored overlay: hepatocellular cytoplasm according to zones (centrilobular cyan, midzonal yellow, periportal magenta), hepatocellular nuclei in darker color according to zones, binucleated cells in lighter color according to zones (only if 2 nuclei connecting), portal tract surrounded by red dashed line, central vein surrounded by blue dashed line, sinusoids no false color. B, Original H&E image. AI indicates artificial intelligence; H&E, hematoxylin and eosin.
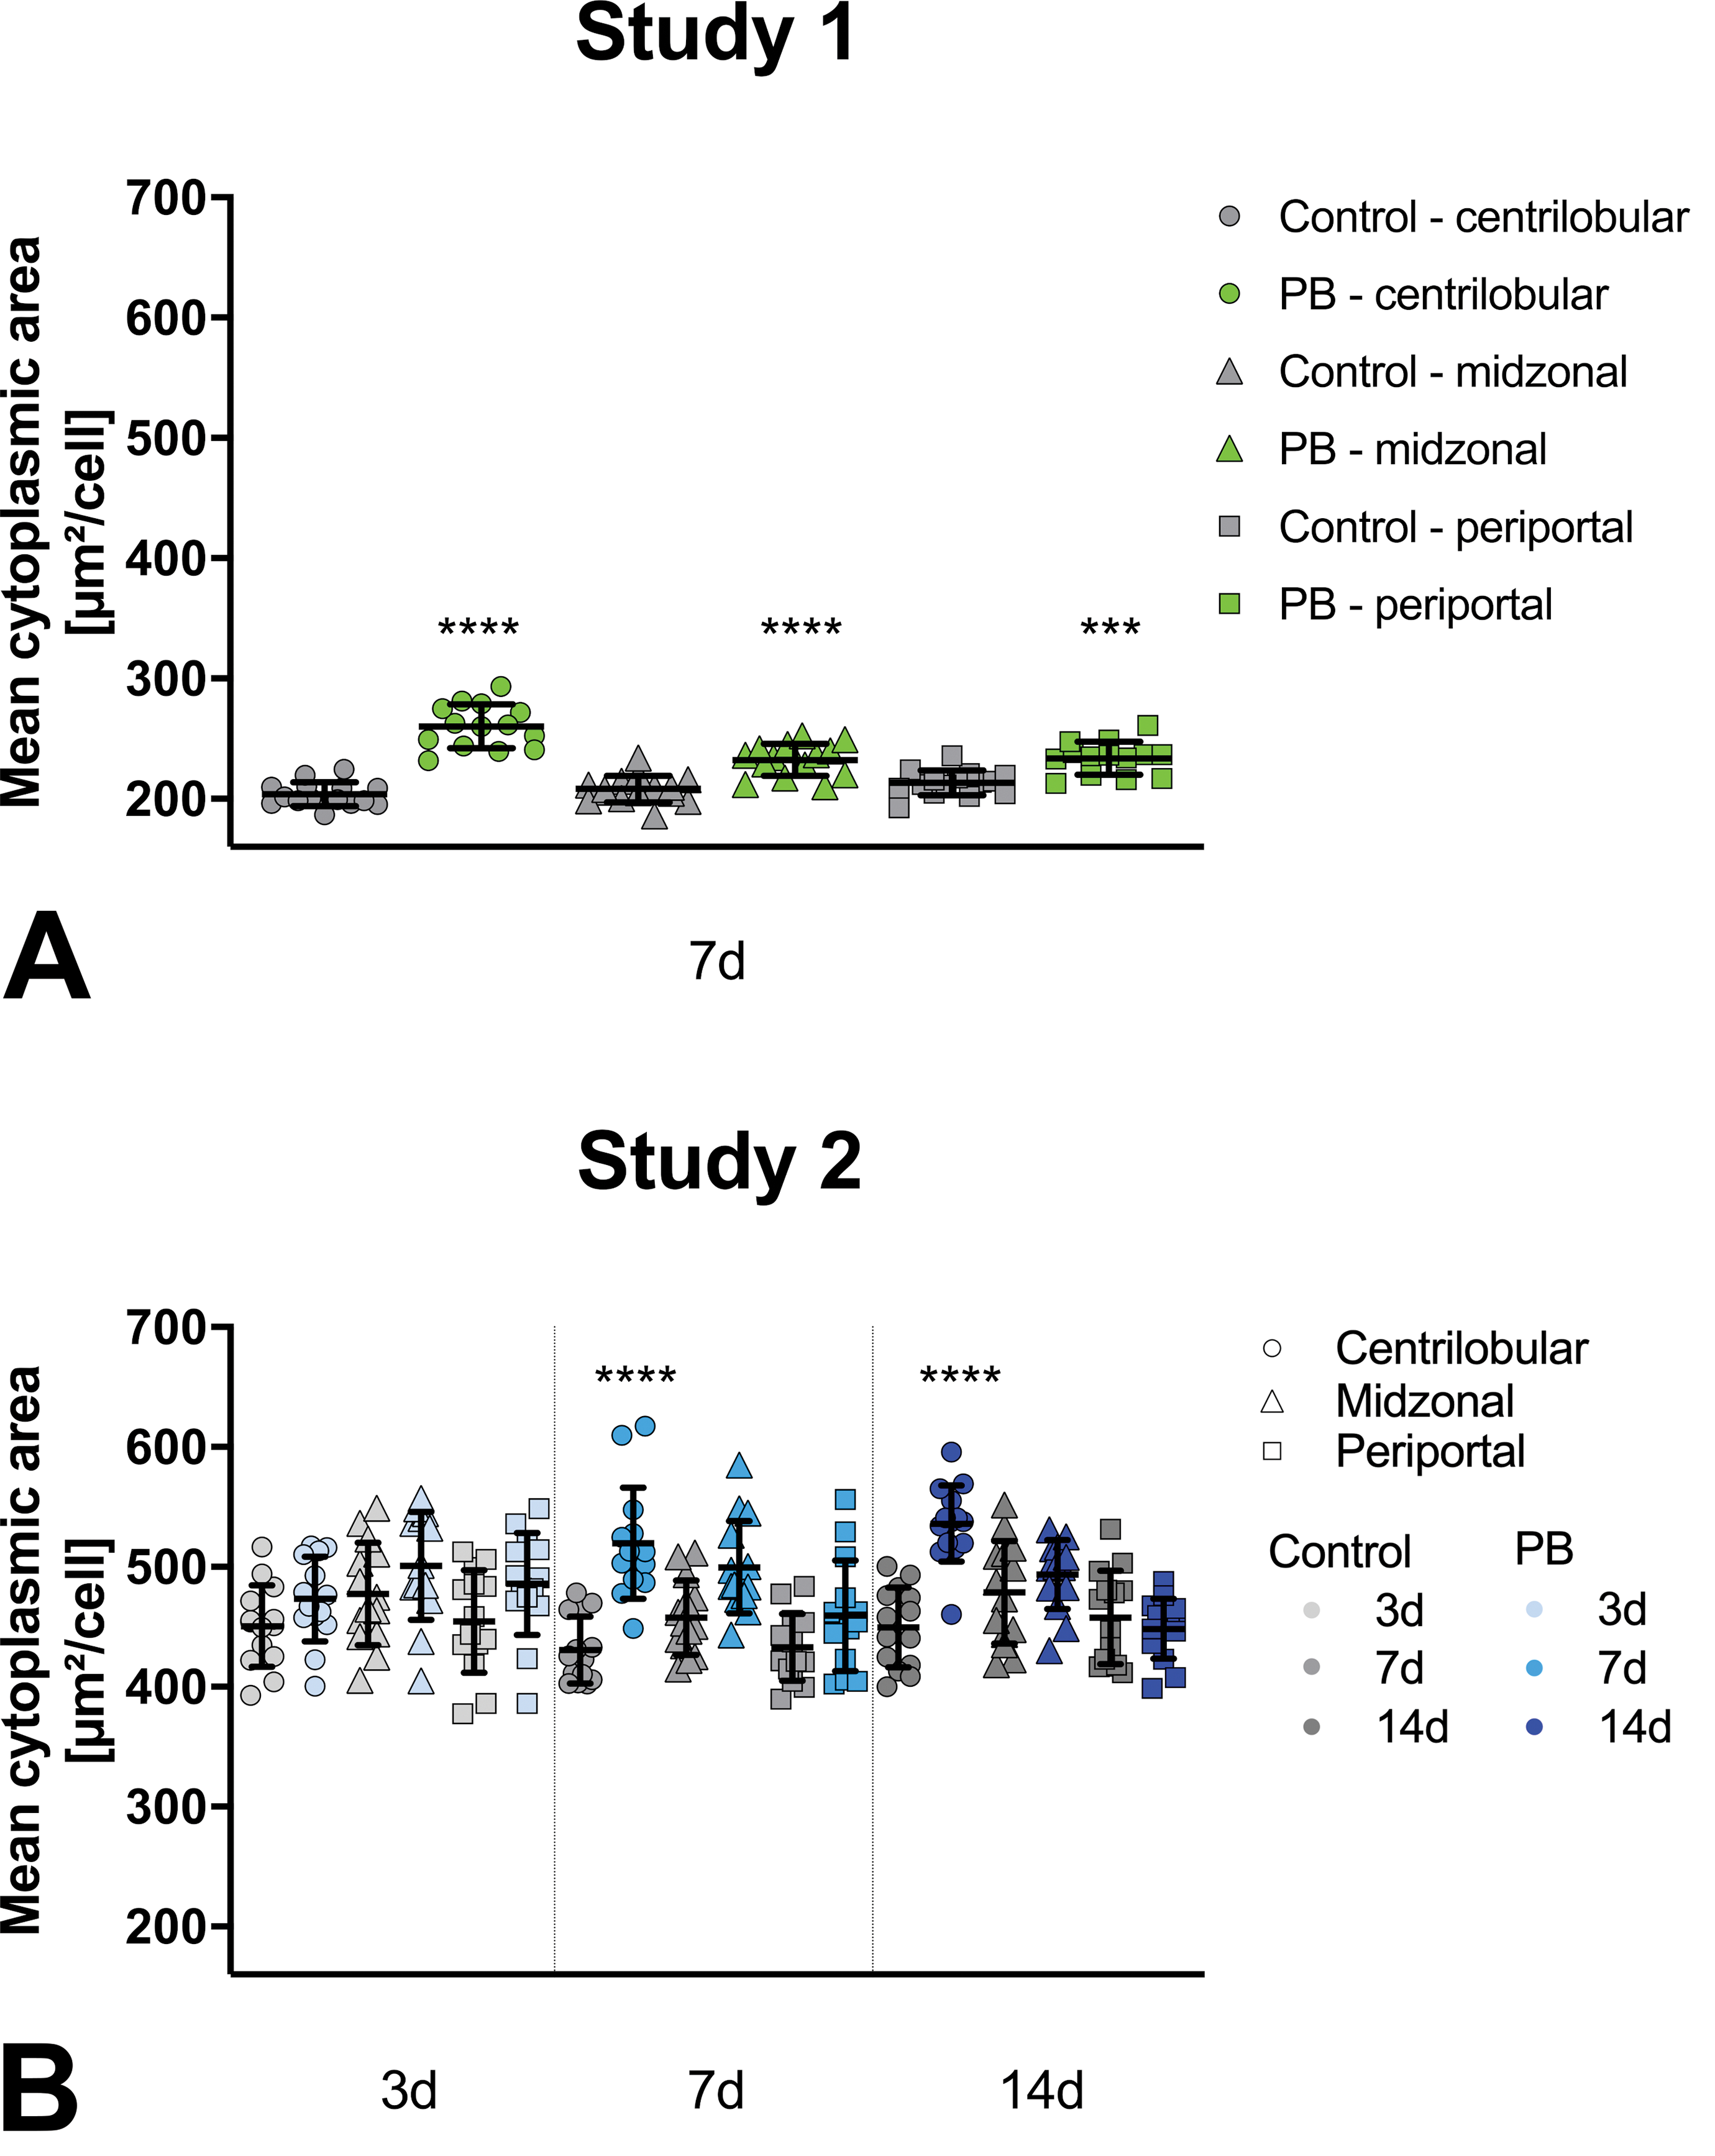
Hepatocellular mean cytoplasmic area measured by AI algorithm. Phenobarbital (PB)-treated groups (green or blue) statistically compared to control groups (gray) for respective liver zones (centrilobular sphere, midzonal triangle, periportal square). For study 2, 3 time points are available indicated by lighter (3 days), medium color (7 days), or darker color (14 days). Study 1 and 2 individual mean values per animal and group- or subgroup-means with standard deviation. AI indicates artificial intelligence.
Hepatocellular mean cytoplasmic area in zonal differentiation
In rats given PB, the mean cytoplasmic area is larger than in the vehicle controls (Figure 2). As expected, this change is most evident in the centrilobular zone. However, also in the other zones there is a trend of increase of cytoplasmic area in animals given PB in comparison to the respective vehicle control.
For study 1 for all zones, the increase in mean cytoplasmic area is highly significant. In study 2, 3 subgroups, corresponding to different durations of PB administration 3, 7, and 14 days, are available. After 3 days, the increase in cell size is not significant and only visible as a trend in all zones. After 7 and 14 days, the centrilobular hepatocytes have a highly significantly larger mean cytoplasmic area when given PB, whereas the other zones show only a trend for increase or seem not to be affected.
Correlation to histopathologic grading of hepatocellular hypertrophy
We compared the evaluated centrilobular mean cytoplasmic area with, the current gold standard, the diagnosis and grading of hepatocellular hypertrophy performed conventionally by a veterinary pathologist with a light microscope (see Figure 3).
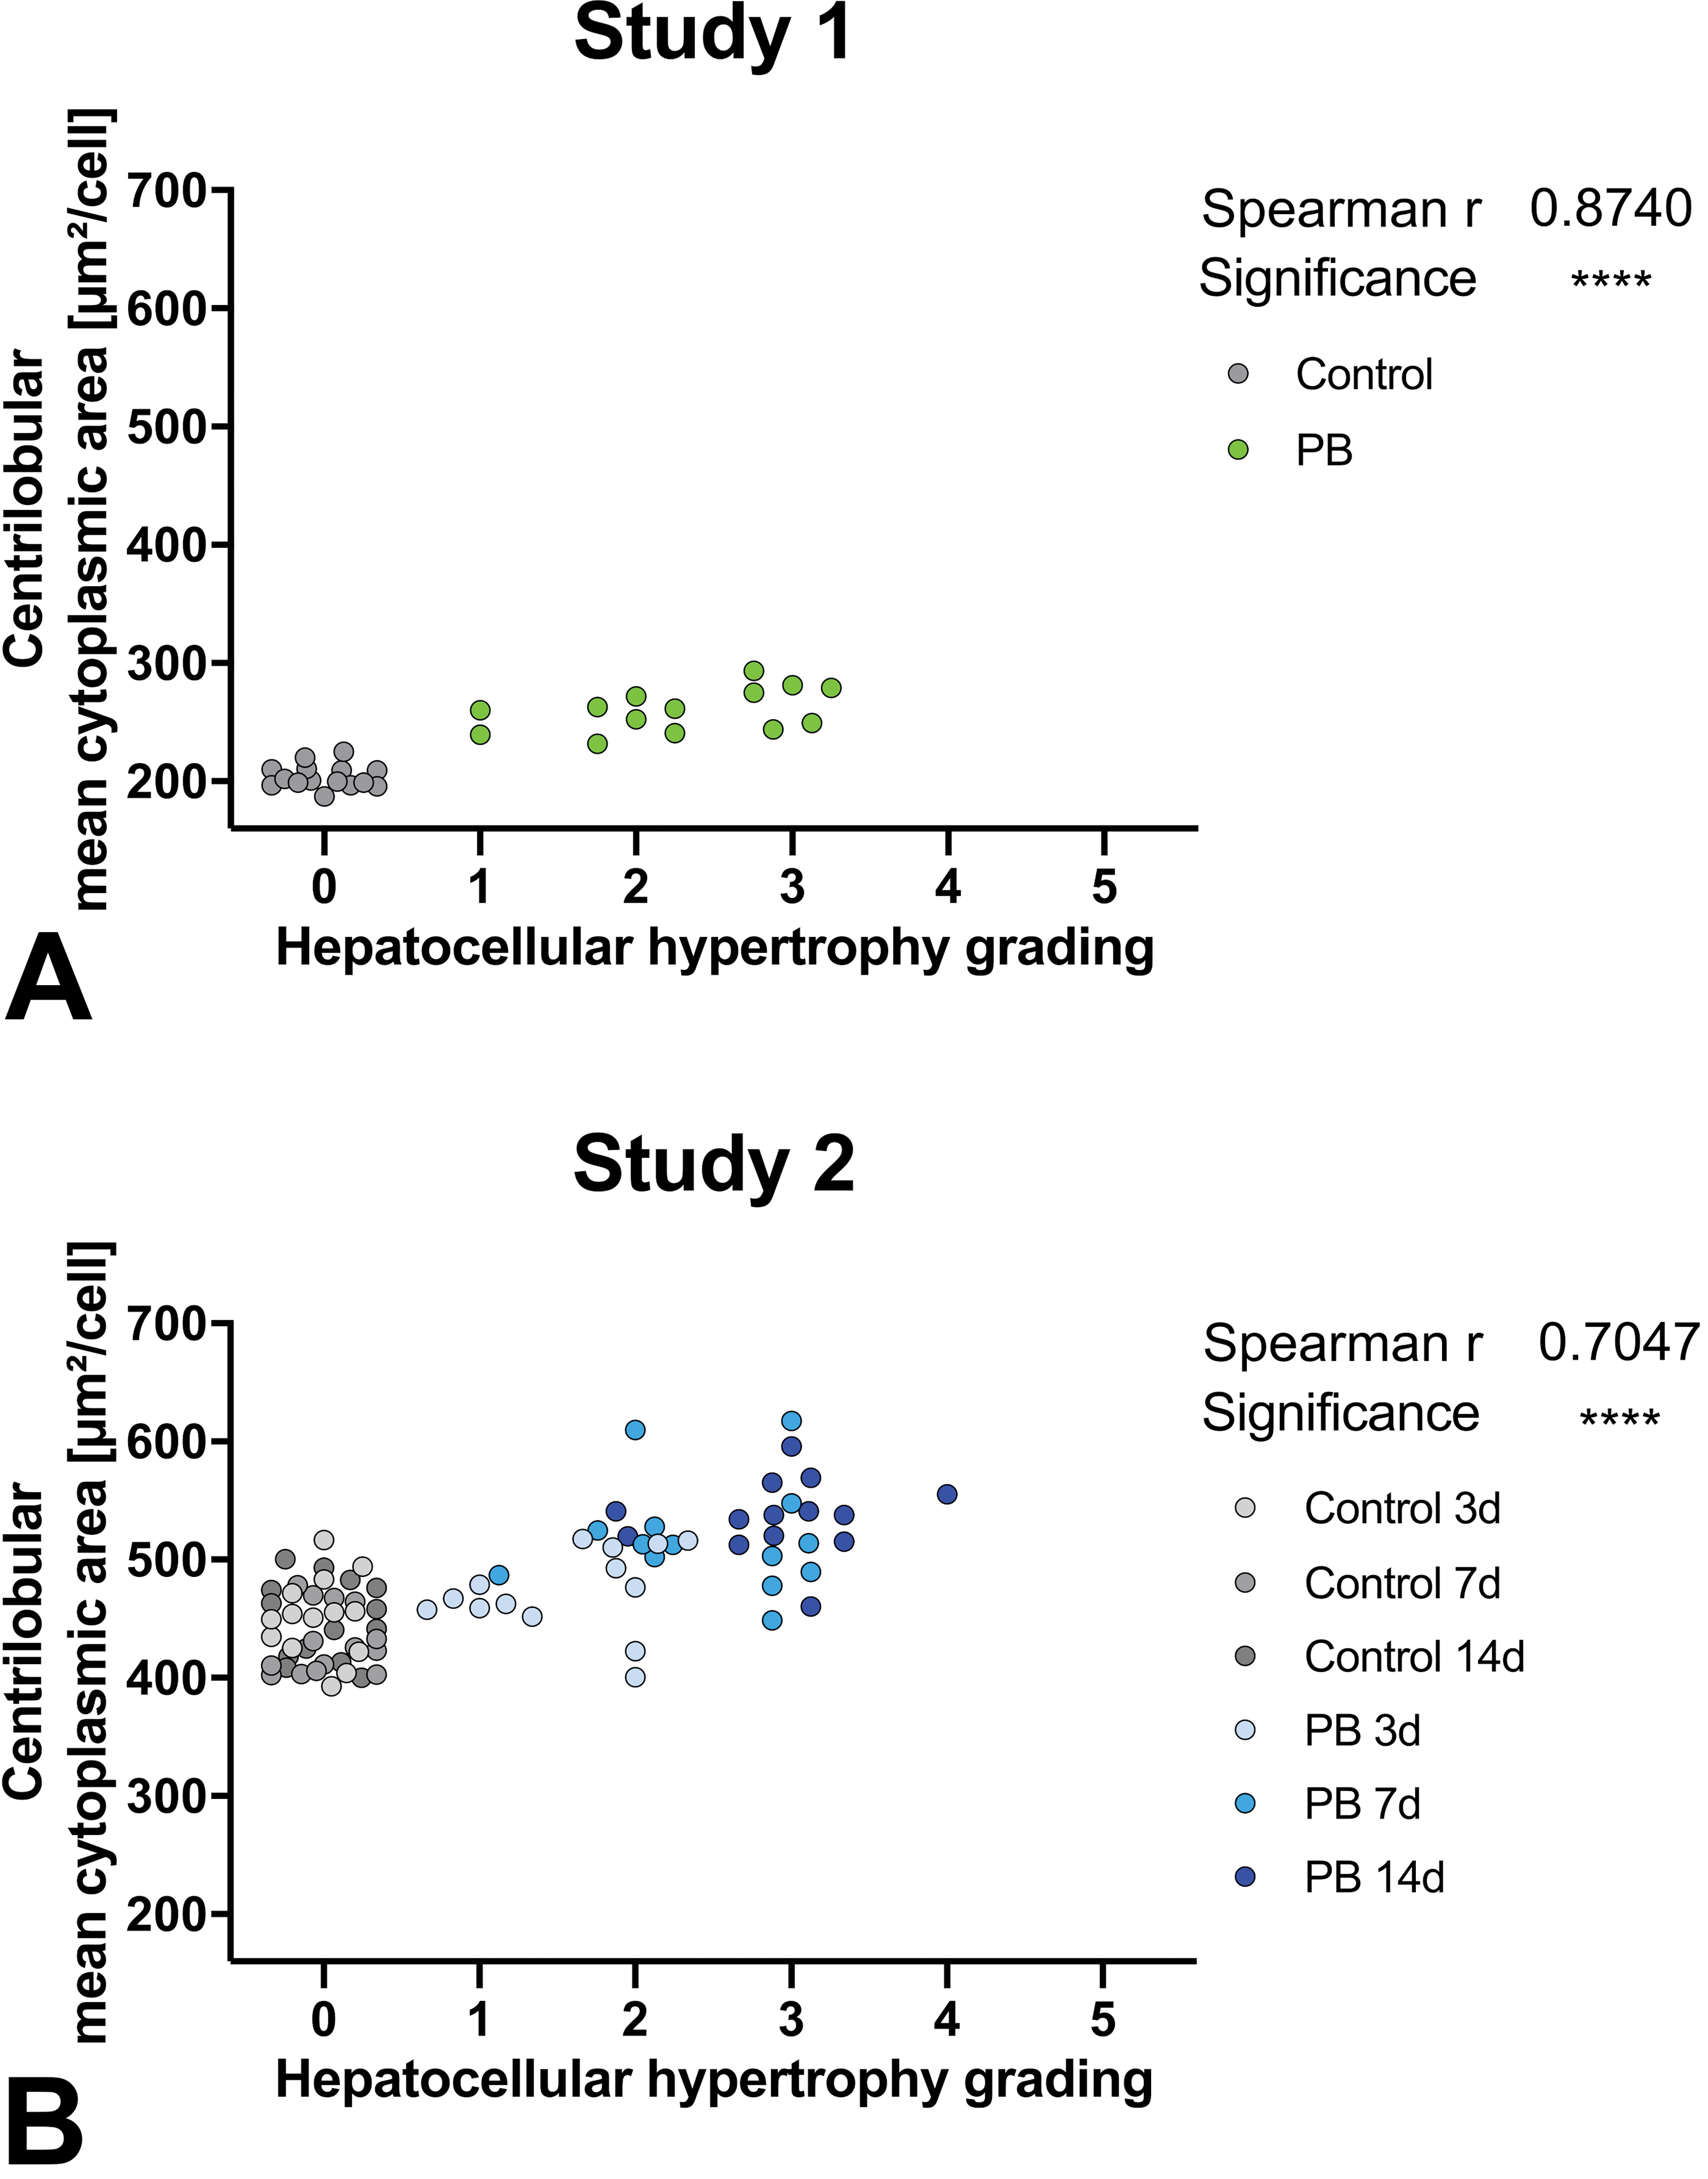
Correlation of centrilobular hepatocellular mean cytoplasmic area measured by AI algorithm to semiquantitative histopathologic observation with grading done by pathologists. Statistical correlation shown in upper right corner of respective graph. Study 1 and 2; grades: 0 (no hypertrophy detected), 1 (minimal), 2 (mild), 3 (moderate), 4 (marked), or 5 (severe). AI indicates artificial intelligence.
Overall, there is a statistically significant correlation of the centrilobular mean cytoplasmic area with the grading of the pathologist but with a large overlap of cell sizes ranging over multiple grades and differences between studies.
The largest overlap is present in study 2 with a similar centrilobular mean cytoplasmic area corresponding to grade 0 (no hypertrophy detected) to grade 3. Here the parameters are still significantly correlating. In study 1, there is no overlap in mean cytoplasmic area between control animals with grade 0 and treated animals with diagnosed hepatocellular hypertrophy. There is an overlap over all given gradings 1 to 3 with corresponding similar cell size.
Correlation to liver weights
Liver weights, relative to body weights, were significantly increased by 32% (study 1) and 16%, 24%, and 28% (study 2 after 3, 7, or 14 days) in animals given PB when compared to control animals. There is a significant correlation between the relative liver weight and centrilobular hepatocellular mean cytoplasmic area in both studies (see Supplemental Figure S2 27 ).
Correlation to gene expression
Centrilobular hepatocellular mean cytoplasmic area was also compared to gene expression data of up to 3 genes, which are known markers of hepatocellular hypertrophy (see Supplemental Figure S3 28 ). 7
Overall, mean cytoplasmic area and gene expression are correlating for all 3 marker genes. Cyp2b1 shows the highest fold changes in PB-treated animals compared to vehicle control means. Cyp3a23 and Ugt2b1 show lower fold increases.
Direct Hypertrophy Classifier
Algorithm for hepatocellular hypertrophy area fraction in zonal differentiation
In an alternative approach, we additionally developed a separate deep learning algorithm trained to directly classify/detect hypertrophy in the liver (Figure 4) for evaluation of hepatocellular hypertrophy area fraction (Figure 5A). This algorithm was trained on examples of nonhypertrophic hepatocellular cytoplasm and examples of hypertrophic hepatocellular cytoplasm (detailed information in the Hepatocellular hypertrophy area fraction determination section).
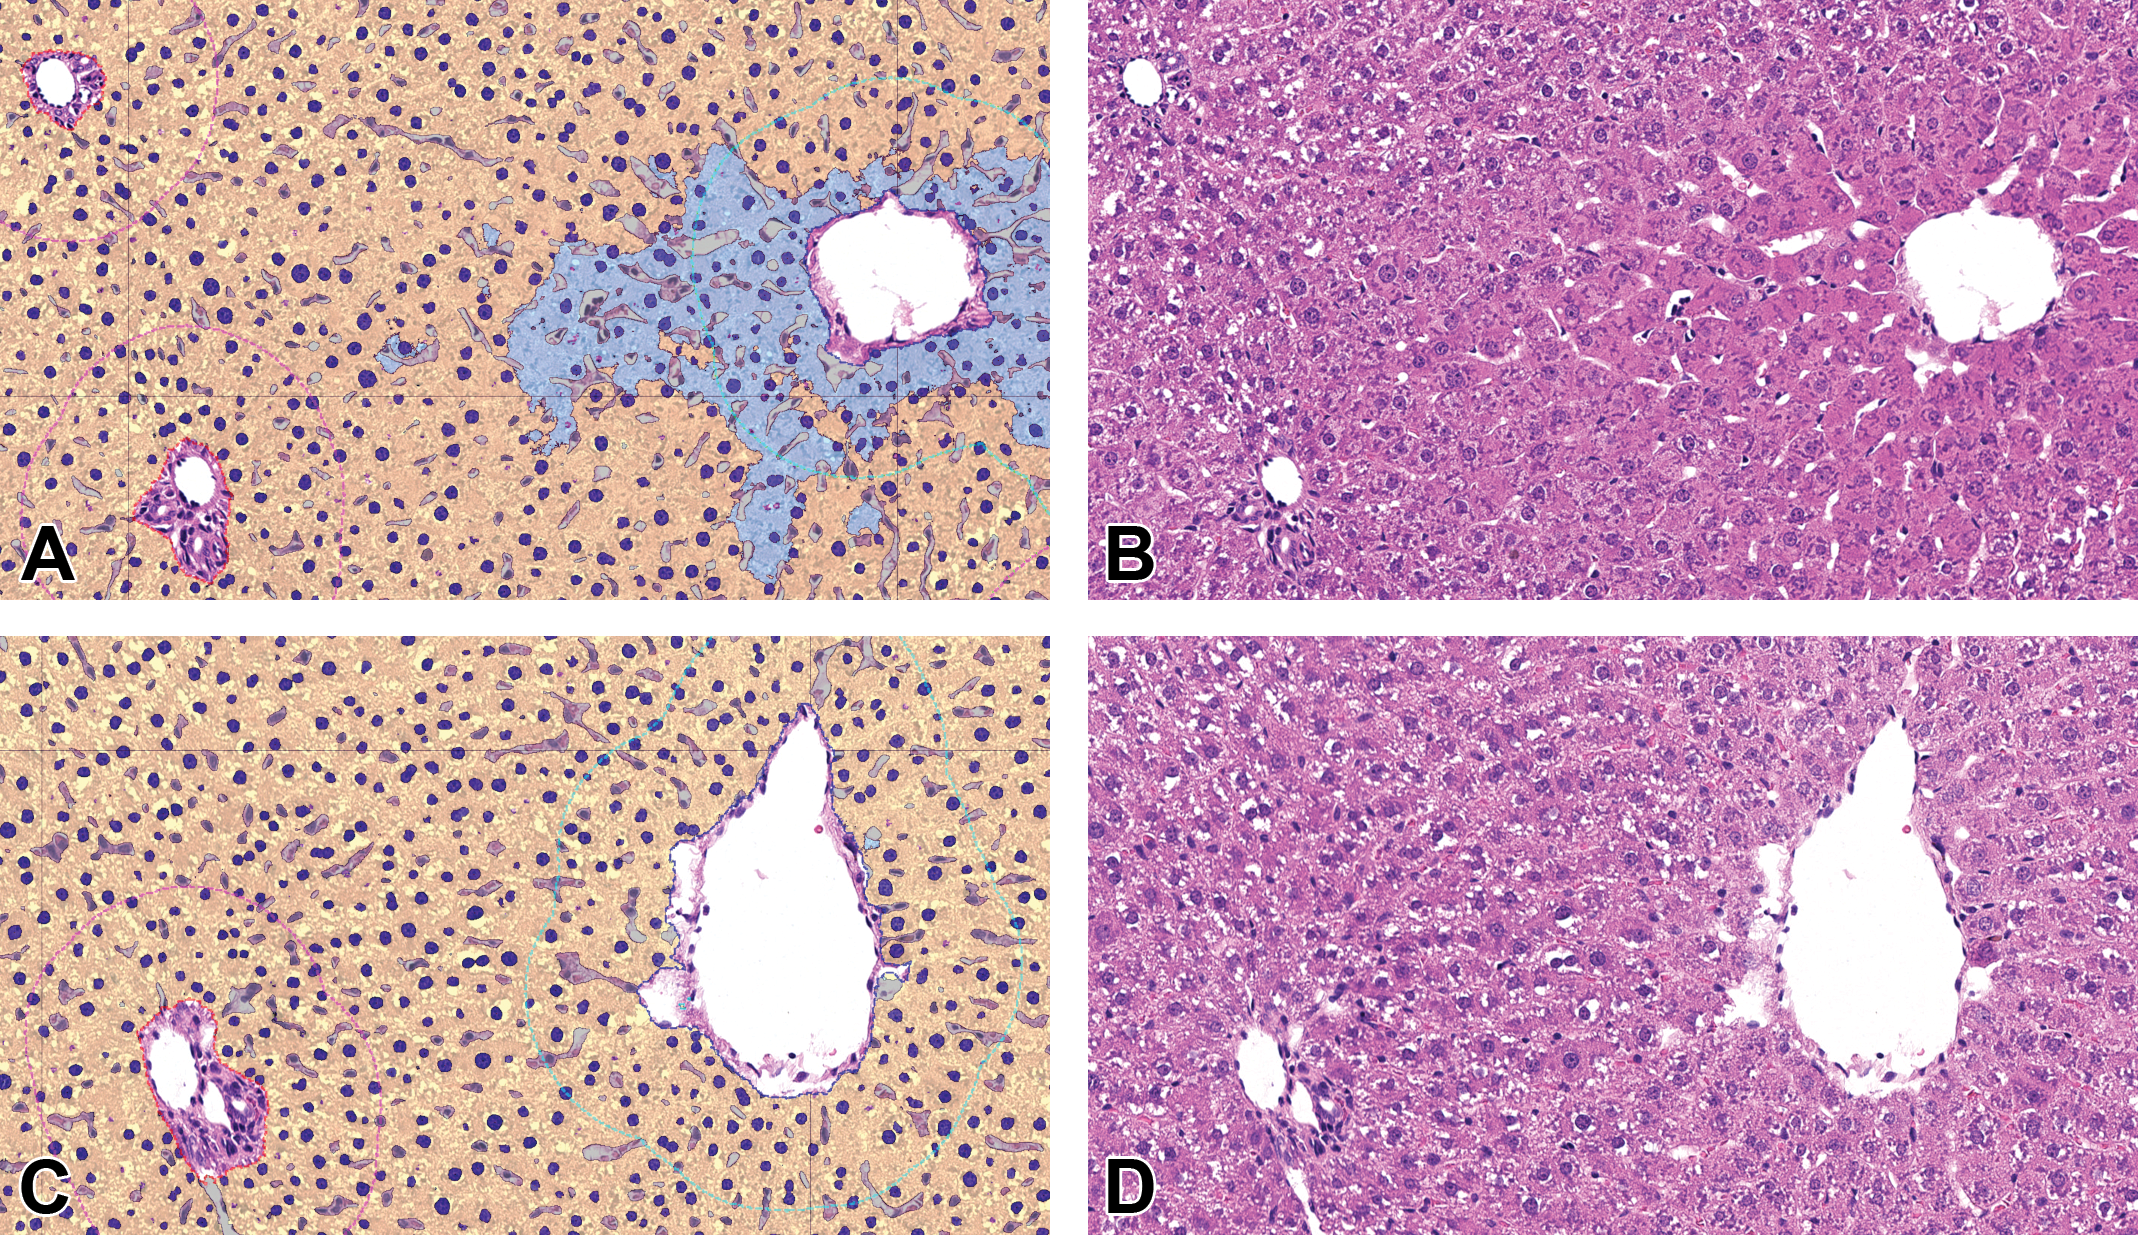
Segmentation achieved by AI algorithm resulting in hepatocellular hypertrophy area fraction measurements. Liver, H&E, original scan 20×. A and B, phenobarbital (PB)-treated; C and D, control study 2. A and C, Classification as false colored overlay: hepatocellular cytoplasm detected as hypertrophic in cyan, hepatocellular cytoplasm detected as nonhypertrophic in yellow, hepatocellular nuclei in blue according to presence of hypertrophy (lighter color in hypertrophic regions), sinusoids in gray, portal tract surrounded by red dashed line, central vein surrounded by blue dashed line, liver zones (centrilobular region surrounded by cyan dashed line, periportal region surrounded by magenta dashed line, midzonal region corresponds to rest). B and D: Original H&E images. AI indicates artificial intelligence; H&E, hematoxylin and eosin.
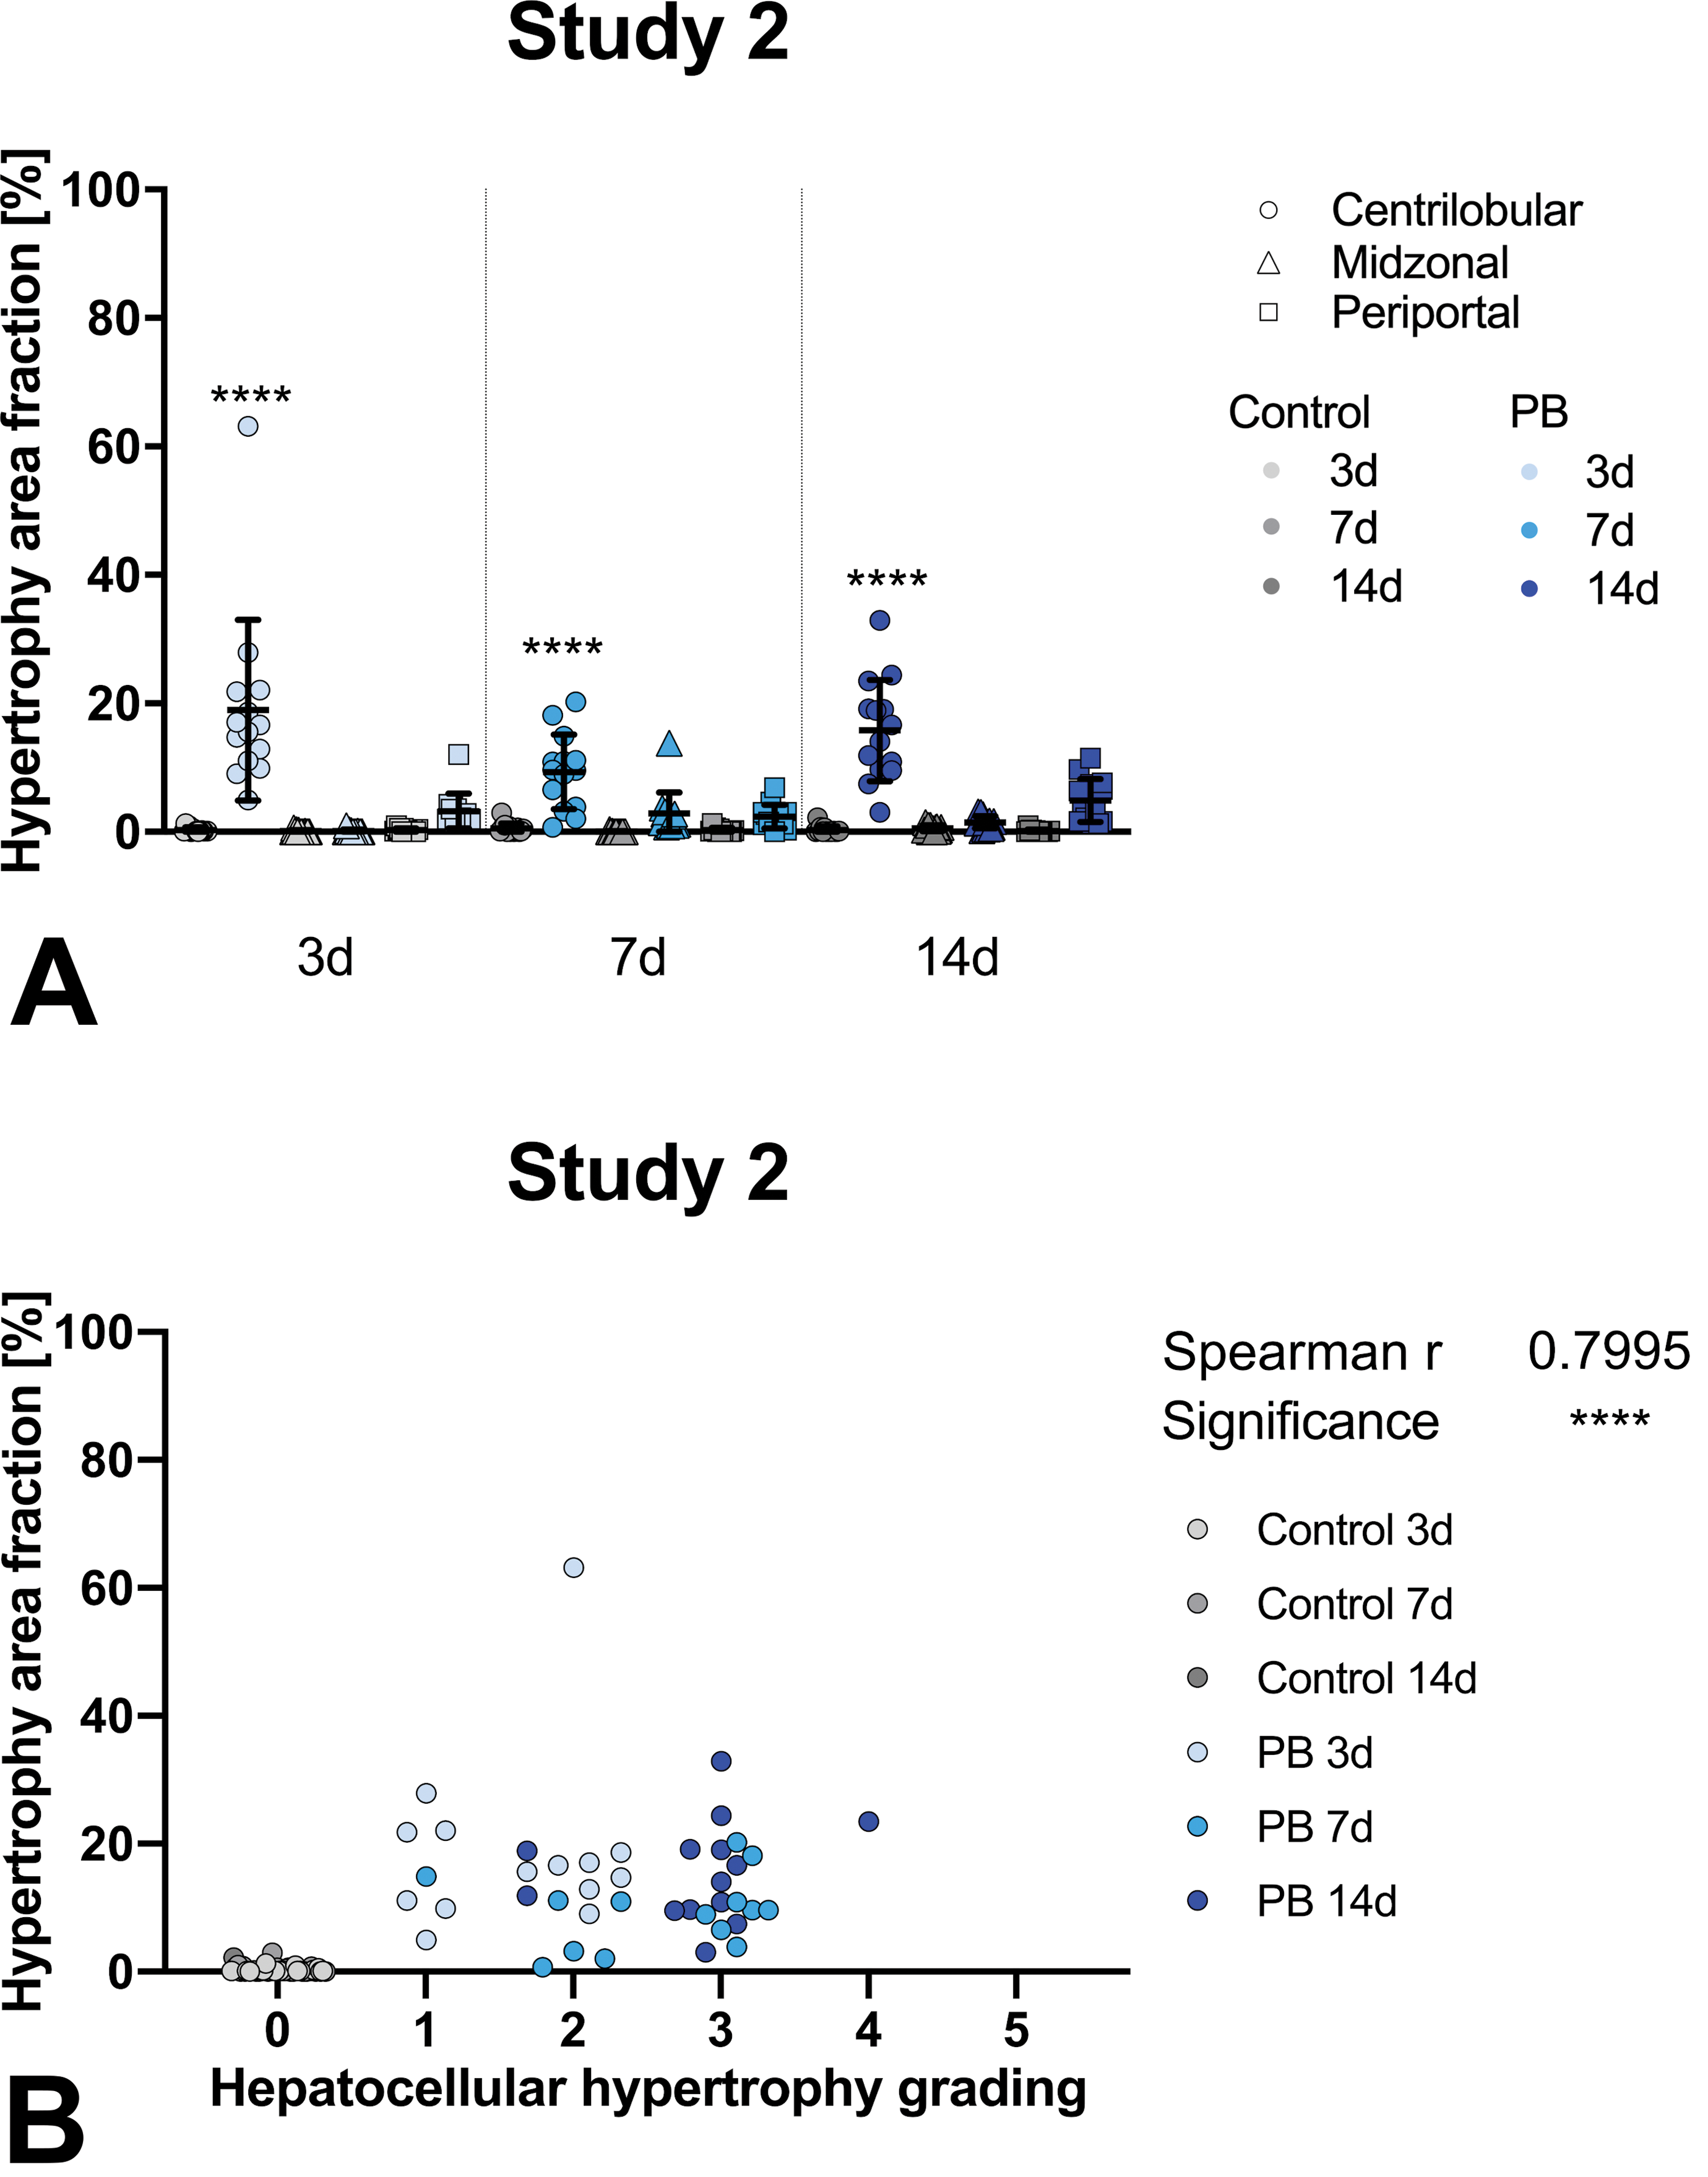
A, Hepatocellular hypertrophy area fraction measured by AI algorithm. Phenobarbital (PB)-treated groups (blue) statistically compared to control groups (gray) for respective liver zones (centrilobular sphere, midzonal triangle, periportal square). Three time points are available indicated by lighter (3 days), medium (7 days), or darker color (14 days). Study 2 individual values and subgroup-means with standard deviation. B, Correlation of centrilobular hepatocellular hypertrophy area fraction measured by AI algorithm to histopathologic observation with grading done by pathologists. Statistical correlation shown in upper right corner of graph. Study 2; grades: 0 (no hypertrophy detected), 1 (minimal), 2 (mild), 3 (moderate), 4 (marked), or 5 (severe). AI indicates artificial intelligence.
Hepatocellular hypertrophy area fraction in zonal differentiation
Surprisingly, using the direct classifier for hypertrophy detection in study 2, at all time points centrilobular hypertrophy area fraction is significantly increased compared to the respective vehicle control groups (Figure 5A). In contrast to the previous approach, where significant differences in mean cytoplasmic area were identified only after PB treatment of 7 days or longer (Figure 2B), here a significant increase in hypertrophy area fraction is already seen after 3 days of PB treatment (Figure 5A).
Correlation to histopathologic grading of hepatocellular hypertrophy
Comparison to grading done by the pathologists was also performed for centrilobular hepatocellular hypertrophy area fraction, shown in Figure 5B. Overall similar results are seen compared to the correlation to mean cytoplasmic area, where a highly significant correlation was observed in study 2 (Figure 3B). However, comparable overlapping data of similar values for hypertrophy area fraction correspond to multiple grades given by the pathologist, ranging from grade 1 to grade 4. Nevertheless, there is a better separation of grade 0 from diagnosed hypertrophy correlating to hypertrophy area fraction (Figure 5B) in comparison to mean cytoplasmic area (Figure 3B).
Discussion
Algorithm Design in Comparison With the Literature
We developed 2 different AI-based approaches to evaluate the presence and severity of hepatocellular hypertrophy in the liver. In both approaches, deep learning algorithms, as complex AI techniques for semantic segmentation, were used. In the first approach, we trained the algorithms to differentiate between tissue components, independent of the presence of hypertrophy to measure mean cytoplasmic area. In the second approach, we trained the algorithms to directly differentiate nonhypertrophic from hypertrophic cytoplasm to measure hypertrophy area fraction. Our results add to the growing body of papers on AI-based approaches connected to the field of toxicologic pathology. 11,29 –33
First approach: algorithm measuring mean cytoplasmic area compared to literature
In the literature, 4 other publications quantitatively analyzed hypertrophy in liver. All of them used measurement approaches of average cell or cytoplasm area like we do in our first approach. 1,14,17,34
Sinusoid exclusion
Horai et al 17 and Asaoka et al 1 excluded nuclei of sinusoidal cells. However, direct segmentation of sinusoidal spaces for exclusion, as proposed in our algorithms, was not performed, leading to sinusoidal spaces being added to measurements of the hepatocellular cytoplasm.
Individual hepatocytes
Only Horai et al 17 and Asaoka et al 1 measured, similar to us, cytoplasmic areas of individual hepatocytes by expanding around detected hepatocellular nuclei. In contrast to their technique, our expansions around nuclei are not limited to circular shape and do not presume spherical hepatocytes (see Figure 1).
Zonal differentiation
Our approach is the first to take the zonal affiliation of hepatocytes into account. None of the aforementioned publications included differentiation into hepatic zonation in their measurement of hepatocellular mean cytoplasmic area. Zonal distribution of hepatocellular hypertrophy is mechanistically important and most of the time not all zones are equally affected by hypertrophy, therefore zone-specific evaluation is more sensitive to small changes.
Second approach: direct hypertrophy classifier measuring hypertrophy area fraction compared to literature
To our knowledge, this is the first time a deep learning-based classification directly detecting hypertrophy in liver has been published. This approach requires a more sophisticated decision to be made by the AI. Our algorithms do not only recognize histological structures but also directly predict a pathologic diagnosis. Ultimately, the advantage of such an approach is that the prediction can be directly overlaid to the WSI, highlighting affected areas for the pathologist.
Successfully Measured, Expected Data
Measured parameters compared between treatment groups
With both AI-based approaches, we successfully achieved the results we expected. Measured mean cytoplasmic area and hypertrophy area fraction both showed hypertrophy mainly in the centrilobular zones after treatment with hypertrophy-inducing PB (see Figures 2 and 5A).
Correlation with gold standard
Artificial intelligence methods need to be validated against current quality standards to ensure effectiveness and concordance. 35 We could show overall correlation of our measured parameters with the following end points, achieved by standard techniques, which are available for the evaluation of hypertrophy (see Figures 3 and 5B as well as Supplemental Figures S2 27 and S3 28 ). Histopathological grading by the pathologists, relative liver weights, and gene expression data, from studies in our test set were in consensus with effects reported for PB in the literature 2,5,7,36,37 and were therefore considered appropriate for correlation. Our results are also in concordance with the previously published AI-based approaches of quantitative evaluation of hypertrophy. 1,14,17,34 This confirms evaluation of AI and deep learning-based measurements of mean cytoplasmic area being a feasible method for determination of hypertrophy in liver.
Unexpected Data/Limitations
Despite overall concordance of data, we encountered some more or less unexpected results discussed as follows.
Zonal involvement additional to centrilobular hypertrophy
Additional periportal and midzonal increases in measured parameters are present with significance in study 1 (Figure 2A) or trends in study 2 (Figures 2B and 5A). This is a known effect of PB, which typically causes hypertrophy in centrilobular hepatocytes, but also in midzonal and even up to 45% of periportal hepatocytes in rats. 37 Nevertheless, misclassification of vessels by the algorithm has to be taken into account to potentially cause artifactual increases in other zones beyond present centrilobular hypertrophy. For example, periportal values could be falsely increased if enough central veins are erroneously classified as portal tracts. Midzonal artifactual increase can stem from small central veins misclassified as dilated sinusoids, central veins outside of the cutting plane, or simply centrilobular hypertrophy surpassing the set border of the centrilobular zone of 400 µm around the central vein.
Study-specific magnitude
Absolute values of mean cytoplasmic area, measured by the AI algorithm, differed 2-fold between studies 1 and 2 (see Figure 2). In principle, at least the control groups of both test studies should have similar cell dimensions. Visually reviewing the WSI and the overlaid predicted segmentation into the different tissue component classes and division into individual cells, artifacts in study 2 were visible. In this study, the algorithm misclassified sinusoidal spaces as hepatocellular cytoplasm more often and detected less nuclei than in study 1. The additional area of those misclassified sinusoids and nuclei directly increased the area classified as cytoplasm. Less detected nuclei further mean subdivision into fewer individual hepatocytes, which further artifactually increases the mean cytoplasmic area. Slide review revealed why the AI likely struggled more with study 2: The morphology of the sinusoids in this study was visually hard to differentiate from the hepatocellular cytoplasm, even for the pathologist, and the staining contrast between cytoplasm and nuclei was decreased. Detection of the entire cell margins of hepatocytes is generally difficult 1,20 both by eye and using image analysis techniques, and it was further complicated in study 2 by the similar morphology of cytoplasm and sinusoidal space. Such study-specific differences in tissue morphology can have multiple causes including deviation in age, stress, and time between last feeding and death of the animal, tissue preparation, fixation, and staining of slides. These differences can hamper correct segmentation impacting the final output results. Increasing the variability in the training set (here limited with 4 WSIs each from 7 studies) will very likely improve the stability of the algorithm across studies. However, data measured within 1 study are more stable. Therefore, comparison of absolute values for cytoplasm size, measured with such algorithms, especially across different studies, should be avoided since algorithms are limited to the variability available in the used training data and thus can perform with different accuracies in different studies.
Overlapping correlation
Correlations, especially to grading by the pathologist, revealed overlapping data besides overall significant correlation (see Figures 3 and 5B). For animals with nearly the same measured mean cytoplasmic area varying gradings of hypertrophy were given by the pathologist with a maximal range from grade 0 (no hypertrophy detected) to grade 3 (Figure 3B). In the literature, correlation of AI measured cytoplasmic area to histologic grading was either not performed 1,17,34 or several histopathological grades (5-tier scale) were combined in a new 3-tier scale. 14 The later correlation does not allow a complete assessment of trends and disguises overlapping, nevertheless overlap of their parameter over multiple grades seemed similar to our data. Subjective histopathologic scores, assigned by an experienced pathologist, as the gold standard, establish the ground truth to assess image analysis classifier or method performance. The paradox is that this validation strategy is often used for methods to assist pathologists to score complex tasks, based on image analysis to improve objectivity and reproducibility, by generating outputs that cannot be achieved by a human observer, meanwhile avoiding biases of human evaluation. 38 If the pathologist’s grading is considered being more correct, since it is the accepted gold standard, this overlap of different grades corresponding to similar measured values would question the sensitivity and specificity of the algorithm. But it could also be that the measured parameter is more accurate than the pathologists grading. In fact, it is agreed that severity grading of hypertrophy is less precise than quantitative measurements like liver weight or enzyme induction. 2 There could be a bias leading to overestimation in grade and more likely diagnose of hypertrophy of at least grade 1 for treated animals and on the other hand an underestimation and more likely given grade 0 for vehicle control animals even with similar histologic morphology.
However, groupwise evaluation of a whole study with AI-based parameters is in concordance with grading done by the pathologist, despite certain discordance of the parameters for some individual animals.
Phenobarbital treatment: duration needed to measure differences
Study 2 provides 3 time points, enabling evaluation of early changes after only 3 days of PB treatment to gain insight on sensitivity of the different parameters. Mean cytoplasmic area measured in the first approach did not yet show significant centrilobular increase after 3 days of treatment compared to the vehicle control group (Figure 2B). In contrast, hypertrophy area fraction showed highly significant increase after 3 days already (Figure 5A). The pathologist did diagnose minimal to mild hepatocellular hypertrophy in this group (see Figure 3B). Therefore, hypertrophy area fraction and pathologists’ grading seem more sensitive for early change.
However, note it cannot be excluded that the increased sensitivity of the pathologist may be influenced by a bias. Intentionally pathologists are not blinded, knowing which animals have been treated with a hypertrophy-inducing compound. This possibility is tentatively supported by the increase in liver weight by PB treatment of only 16% after 3 days in study 2. However, there is evidence that diffuse and even zonal hypertrophy are only visually detectable by pathologists when the liver weight of treated animals is increased above 20% compared to controls. 2,39
In addition, the 16% liver weight increase after 3 days could be partially due to hyperplasia without or with less hypertrophy of liver cells. It is known that PB induces initial transient hyperplasia of hepatocytes contributing to liver enlargement as an early change. 1,37 It was also reported in rats treated with PB that the number of hepatocytes positive for the proliferation marker bromodeoxyuridine peaked on day 3 but returned to control levels on day 5. 40 Our data support the presence of an initial hyperplasia by a significantly increased percentage of binucleated centrilobular hepatocytes after 3 days of PB treatment but not after longer treatments counted by the AI algorithm (see Supplemental Figure S1 23 ). So, it is not unlikely a bias of the pathologist contributed to the clear distinction in grade between the control group with no hypertrophy and low grade hypertrophy in the 3 days treated group.
Whether there is a bias or not, the hypertrophy area fraction seems the most sensitive parameter in this data set at least compared to mean cytoplasmic area.
In conclusion, our 2 novel deep learning-based approaches are considered very useful in supporting the pathologist with quantitative values, additionally to the conventional histopathological observations using a light microscope, to evaluate xenobiotic-induced hepatocellular hypertrophy in the context of a study. The first approach has the ability to recognize individual hepatocytes, excludes sinusoids, and differentiates between centrilobular, mid, and periportal zones for the measurement of hepatocellular mean cytoplasmic area to quantitatively evaluate hypertrophy. The second approach allowed for direct detection and quantification of hepatocellular hypertrophy by the deep learning-based algorithm, also differentiating in liver zones and excluding the same microanatomical structures. Both approaches possibly lead to tools helping pathologists to support their diagnoses by potentially improving sensitivity, comparability between different studies or pathologists, accuracy, and/or efficiency.
Supplemental Material
Supplemental Material, sj-docx-1-tpx-10.1177_0192623320983244 - Artificial Intelligence in Toxicologic Pathology: Quantitative Evaluation of Compound-Induced Hepatocellular Hypertrophy in Rats
Supplemental Material, sj-docx-1-tpx-10.1177_0192623320983244 for Artificial Intelligence in Toxicologic Pathology: Quantitative Evaluation of Compound-Induced Hepatocellular Hypertrophy in Rats by Hannah Pischon, David Mason, Bettina Lawrenz, Olivier Blanck, Anna-Lena Frisk, Frederic Schorsch and Valeria Bertani in Toxicologic Pathology
Supplemental Material
Supplemental Material, sj-docx-2-tpx-10.1177_0192623320983244 - Artificial Intelligence in Toxicologic Pathology: Quantitative Evaluation of Compound-Induced Hepatocellular Hypertrophy in Rats
Supplemental Material, sj-docx-2-tpx-10.1177_0192623320983244 for Artificial Intelligence in Toxicologic Pathology: Quantitative Evaluation of Compound-Induced Hepatocellular Hypertrophy in Rats by Hannah Pischon, David Mason, Bettina Lawrenz, Olivier Blanck, Anna-Lena Frisk, Frederic Schorsch and Valeria Bertani in Toxicologic Pathology
Supplemental Material
Supplemental Material, sj-docx-3-tpx-10.1177_0192623320983244 - Artificial Intelligence in Toxicologic Pathology: Quantitative Evaluation of Compound-Induced Hepatocellular Hypertrophy in Rats
Supplemental Material, sj-docx-3-tpx-10.1177_0192623320983244 for Artificial Intelligence in Toxicologic Pathology: Quantitative Evaluation of Compound-Induced Hepatocellular Hypertrophy in Rats by Hannah Pischon, David Mason, Bettina Lawrenz, Olivier Blanck, Anna-Lena Frisk, Frederic Schorsch and Valeria Bertani in Toxicologic Pathology
Supplemental Material
Supplemental Material, sj-tif-1-tpx-10.1177_0192623320983244 - Artificial Intelligence in Toxicologic Pathology: Quantitative Evaluation of Compound-Induced Hepatocellular Hypertrophy in Rats
Supplemental Material, sj-tif-1-tpx-10.1177_0192623320983244 for Artificial Intelligence in Toxicologic Pathology: Quantitative Evaluation of Compound-Induced Hepatocellular Hypertrophy in Rats by Hannah Pischon, David Mason, Bettina Lawrenz, Olivier Blanck, Anna-Lena Frisk, Frederic Schorsch and Valeria Bertani in Toxicologic Pathology
Supplemental Material
Supplemental Material, sj-tif-2-tpx-10.1177_0192623320983244 - Artificial Intelligence in Toxicologic Pathology: Quantitative Evaluation of Compound-Induced Hepatocellular Hypertrophy in Rats
Supplemental Material, sj-tif-2-tpx-10.1177_0192623320983244 for Artificial Intelligence in Toxicologic Pathology: Quantitative Evaluation of Compound-Induced Hepatocellular Hypertrophy in Rats by Hannah Pischon, David Mason, Bettina Lawrenz, Olivier Blanck, Anna-Lena Frisk, Frederic Schorsch and Valeria Bertani in Toxicologic Pathology
Supplemental Material
Supplemental Material, sj-tif-3-tpx-10.1177_0192623320983244 - Artificial Intelligence in Toxicologic Pathology: Quantitative Evaluation of Compound-Induced Hepatocellular Hypertrophy in Rats
Supplemental Material, sj-tif-3-tpx-10.1177_0192623320983244 for Artificial Intelligence in Toxicologic Pathology: Quantitative Evaluation of Compound-Induced Hepatocellular Hypertrophy in Rats by Hannah Pischon, David Mason, Bettina Lawrenz, Olivier Blanck, Anna-Lena Frisk, Frederic Schorsch and Valeria Bertani in Toxicologic Pathology
Footnotes
Acknowledgments
We thank the technical team of the Mechanistic Toxicology & Pathology group of Bayer CropScience SAS for their support in retrieval and digitalization of histopathological glass slides and gene expression analysis. We thank Alime Sema Teksen for technical support regarding Visiopharm software.
Declaration of Conflicting Interests
The author(s) declared the following potential conflicts of interest with respect to the research, authorship, and/or publication of this article: David Mason is an employee of Visiopharm UK LTD. Visiopharm software, bought by Bayer, was used to build and run the AI algorithms. David Mason contributed to the algorithm design conceptionally and technically, but he was not involved in the conception and design of the research study leading to this publication or the interpretation of any results. Furthermore, he did not receive any payment or other compensation for his contribution to this publication. Anna-Lena Frisk, Bettina Lawrenz, and Hannah Pischon currently work or previously worked for Bayer AG, while working on this publication. Frederic Schorsch, Olivier Blanck, and Valeria Bertani are employees of Bayer CropScience SAS. None of the authors received additional compensation for this publication. This research study was a feasibility study/proof of concept with no current intention to commercialize the method used. Results are published to make data available for the public and do not promote a product commercially exploited by Bayer. Thus, we declare no conflict of interest.
Funding
The author(s) received no financial support for the research, authorship, and/or publication of this article.
Supplemental Material
Supplemental material for this article is available online.
References
Supplementary Material
Please find the following supplemental material available below.
For Open Access articles published under a Creative Commons License, all supplemental material carries the same license as the article it is associated with.
For non-Open Access articles published, all supplemental material carries a non-exclusive license, and permission requests for re-use of supplemental material or any part of supplemental material shall be sent directly to the copyright owner as specified in the copyright notice associated with the article.