
Abstract
Enhanced histopathology of the immune system uses a precise, compartment-specific, and semi-quantitative evaluation of lymphoid organs in toxicology studies. The assessment of lymphocyte populations in tissues is subject to sampling variability and limited distinctive cytologic features of lymphocyte subpopulations as seen with hematoxylin and eosin (H&E) staining. Although immunohistochemistry is necessary for definitive characterization of T- and B-cell compartments, routine toxicologic assessments are based solely on H&E slides. Here, a deep learning (DL) model was developed using normal rats to quantify relevant compartments of the spleen, including periarteriolar lymphoid sheaths, follicles, germinal centers, and marginal zones from H&E slides. Slides were scanned, destained, dual labeled with CD3 and CD79a chromogenic immunohistochemistry, and rescanned to generate exact co-registered images that served as the ground truth for training and validation. The DL model identified individual splenic compartments with high accuracy (97.8% Dice similarity coefficient) directly from H&E-stained tissue. The DL model was utilized to study the normal range of lymphoid compartment area and cellularity. Future implementation of our DL model and expanding this approach to other lymphoid tissues have the potential to improve accuracy and precision in enhanced histopathology evaluation of the immune system with concurrent gains in time efficiency for the pathologist.
Keywords
Introduction
The immune system is a complex multicellular network that interacts with all cells in the body to distinguish self from non-self using cell-to-cell plasma membrane interactions and broadcast chemical messages acting regionally or systemically. Flow cytometric analysis pioneered the classification of immune cells, and the technology continues to expand its capabilities 20 ; meanwhile, single-cell RNA sequencing using unsupervised clustering has identified more than 30 distinct cell populations of CD45+ cells within human spleen, liver, and blood. 20 Despite these many differences in the functional activity and specificity of immune cells, histomorphology has distinguished far fewer cell types, and the specific functional characteristics of these cells cannot be reliably predicted from their histologic appearance alone. 13 Nonetheless, histopathologic examination of immune tissues remains a fundamental data set for characterizing the immune system effects of candidate new drugs, and standardized nomenclature is key to consistent interpretation of findings. 19 Within the spleen, there is characteristic localization of cell types within the tissue in the normal case, and this localization is largely preserved even under pathologic conditions. Therefore, cell morphology, coupled with its histological context, provides a view into the abundance of particular cell types within the immune system at a particular point in time. Given that the generation of naive T and B lymphocytes occurs by random receptor DNA rearrangement and reactive cells must be clonally amplified to form an effector force, quantities of these cell populations are relevant to their receptor diversity and effector function capacity within the body. Stereological studies of splenic anatomy have been conducted in the human 15 and the rat, 14 and treatment effects on lymphoid tissue volumes are documented in the rat. For this reason, carefully defined procedures for semi-quantitative evaluation of lymphoid populations within immune tissues have been created to guide the toxicological pathologist’s evaluation. 4
The spleen harbors cellular compartments broadly parsed into white pulp (periarterial lymphatic sheath [PALS], follicles, marginal zone) and red pulp. 2 Typically, a single transverse section from the largest width through the spleen is taken as representative. 16 This is intended to maximize white pulp available for evaluation, as it courses along vasculature arising from the splenic hilus and diminishes in density toward the periphery of the tissue. Distinguishing white pulp subregions into T- and B-cell areas based on hematoxylin and eosin (H&E) alone is challenging. Lymphocyte populations within the white pulp are contiguous, posing difficulties in defining clear boundaries, particularly between PALS and small or obliquely sectioned follicles, even in control animals. Although immunohistochemistry for T- and B-cells is conclusive, it is only conducted under certain circumstances.
Since pathologists are often expected to conduct descriptive or semi-quantitative assessments of the area and cellularity of white and red pulp regions in the spleen, 5 among other lymphoid tissues, there is an opportunity to improve both rigor and consistency of immune organ analysis by leveraging deep learning (DL)-based quantitative assessment. Limited attempts have been made to apply machine learning-based classifiers in the spleen, 10 but the model was not validated and lacked the necessary output detail to give useful information on the compartment(s) affected and any change in cellularity. Other DL efforts in nonclinical species point to the challenges of differentiating lymphocyte-rich tissues such as spleen and lymph node from each other. 9 Still, there is keen interest in increasing the precision, accuracy, and efficiency of hematolymphoid tissue quantifications and phenotyping by advancing DL models. 17
Our investigation aims to address two primary objectives. The first objective was to develop DL-based, immunohistochemistry (IHC)-free immunophenotyping in rat spleen. To achieve this, we used an H&E-to-IHC destain/restain process to obtain H&E and IHC-stained whole slide images (WSIs) from the same tissue. The co-registered images were then used to annotate white pulp compartments based on CD3+ T-cell and CD79a+ B-cell populations in IHC. The annotations were overlaid onto the same slide stained with H&E, allowing the DL model to learn the features of those compartments and accurately predict T- and B-cell regions in an H&E test set. We validated the DL model predictions on H&E against the corresponding IHC ground truth.
The second objective was to use DL to quantify the area and cellularity of white pulp subregions (PALS, follicles, germinal centers, and marginal zone) in the normal rat spleen. Measuring normal variability could give insights on what degree of inter-animal and intra-animal variability could be observed based on a single section of the spleen (ie, challenge the assumption that a single section is adequately representative). In addition, quantitatively defining the normal variability in control animals with red and white pulp area and cellularity measurements can reduce the impacts of biological variability and diagnostic drift between studies. In addition, the variability seen between controls is assessed across different durations of study as a biological function of advancing age.
The character of novel test articles is ever-broadening, and therapies acting on or through immune cells are an increasing proportion of drug development. Having more complete information about induced effects on immune organs could aid in candidate screening and dose selection. Ultimately, this DL model aims to provide quantitative information rapidly and accurately to the pathologist to enhance the identification and overall characterization of a test article-related finding based on the routine H&E section of the spleen. Testing the model in slides with microscopic abnormalities in red and/or white pulp compartments will determine its limits and usefulness in the pathology workflow. If the model performs well when challenged with various abnormalities, it can be used in general toxicity studies to understand toxicity profiles and effects on immune cells.
Materials and Methods
Slide Preparation and Whole Slide Image Acquisition
Animal welfare for this study adhered to the United States Department of Agriculture (USDA) Animal Welfare Act, and the procedures followed the Guide for the Care and Use of Laboratory Animals, Institute of Laboratory Animal Resources, National Academy Press, Washington, DC. All protocols were approved by AbbVie’s Institutional Animal Care and Use Committee and executed in facilities accredited by the American Association for Accreditation of Laboratory Animal Care.
For acquiring co-registered H&E and IHC WSIs from the same tissue, the following steps have been performed.
Step 1. Tissue collection, slide preparation, hematoxylin and eosin staining, and scanning
For toxicology studies, grossly unremarkable spleens were obtained from Sprague-Dawley rats, fixed in 10% neutral buffered formalin, routinely processed, embedded in paraffin, and sectioned at 5 µm.
For assessing inter-animal and intra-animal variations, a pilot study was performed. Spleens from four naïve male Sprague-Dawley rats were collected and uniformly sectioned into eight serial transverse portions. These portions were placed into numbered cassettes and fixed in 10% neutral buffered formalin. The block containing the widest middle portion from each spleen was selected, 6 and a single 5-µm transverse section was picked up at 150-µm intervals, resulting in 10 step sections per spleen (n = 40 total).
After preparing tissue sections, all slides were baked in an oven at 60°C for 1 hour, stained with H&E, and coverslipped. They were scanned to MIRAX virtual slide format at 40× magnification on the PANNORAMIC 250 Flash III slide scanner (3DHISTECH, Budapest, Hungary).
Step 2. Destaining procedures
After scanning the H&E-stained slides, the sections were de-coverslipped and destained as follows. Destaining procedures were conducted in a fume hood using manual wash stations containing the reagent solvents. Slides were placed into baskets and manually soaked in xylene to loosen the coverslip. Coverslips were removed with forceps slowly to avoid tissue damage. Slides were rinsed (at least 30 dips) three times in a xylene bath to remove any remaining adhesive and allowed to sit in the bath to remove all sealant (approximately 1 minute between rinses). Slides were rinsed 5 to 6 times with 3-minute hold intervals between rinses in 95% EtOH for approximately 30 minutes to remove eosin stain. Slides were rinsed in distilled water and lightly tapped on Kimwipes to remove excess. During the subsequent IHC staining (step 3), the hematoxylin was automatically removed by the buffer utilized in the IHC stainer.
Step 3. Immunohistochemistry restaining and scanning
Immediately after destaining, the slides were placed in the IHC stainer to avoid damage to the tissue due to excessive drying. Dual IHC staining for T-cells (CD3) and B-cells (CD79a) was conducted. All primary antibodies and pertinent details of the immunohistochemical methods were summarized in Supplementary Table 1. The IHC was performed using the Ventana Discovery Ultra IHC Stainer (Roche Diagnostics, Indianapolis, IN) with primary antibodies against the following: CD3 (catalog ab16669, dilution 2.33 µg/ml, Abcam, Waltham, MA), CD79a (catalog Boster/A01047, dilution 1.25 µg/ml, Boster Biological Technology, Pleasanton, CA). Signals were visualized with DAB (CD3) or purple (CD79a) chromogen. Slides were dehydrated in graded alcohol, cleared with xylene, and coverslipped. The IHC-stained slides were scanned to MIRAX virtual slide format at 40× magnification on the PANNORAMIC 250 Flash III slide scanner (3DHISTECH, Budapest, Hungary).
In a pilot study, we examined unstained rat spleen slides that underwent direct CD3/CD79a IHC compared with those that were first stained and destained with H&E and had subsequent IHC. The results were qualitatively similar (data not shown), indicating that under these staining conditions, the epitopes were stable enough to enable confident differentiation of T- and B-cell regions when creating ground truth annotations using a destaining/restaining approach.
The image data sets, used in the development or deployment phases, comprised multiple studies (Table 1). All spleens were microscopically within normal limits irrespective of treatment condition, reviewed by LH. The details of each phase and the corresponding data sets were outlined in the following sections.
Data set split.
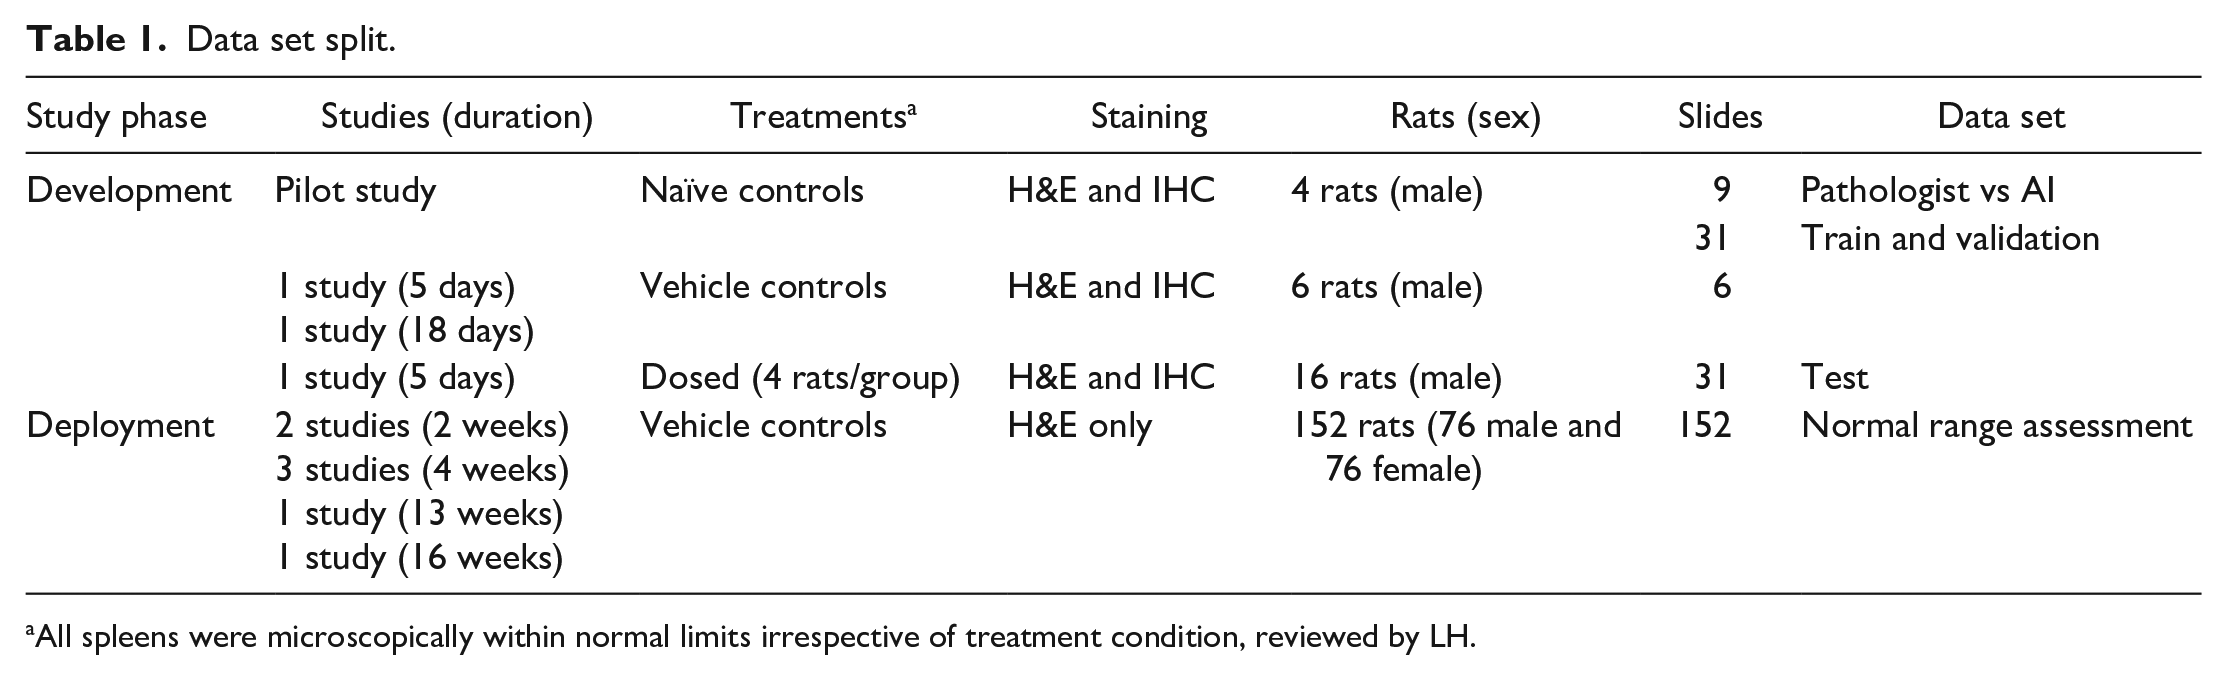
All spleens were microscopically within normal limits irrespective of treatment condition, reviewed by LH.
Development phase image data set
During the development phase, the DL model underwent training, validation, and testing to achieve our first objective: segmentation of white pulp subregions. The model development involved a total of 77 H&E-stained spleen WSIs along with the dual channel IHC for ground truth annotation, 37 of which were used for training and validation and 31 slides from an independent study were used as test. Nine additional slides, randomly held out from the pilot study (2-3 slides per rat) and not used during training or validation, were used to compare pathologists’ (BB, WB, and LH) annotation without IHC assistance to DL segmentation. The details of each data set were provided in Table 1. For detail on data set splitting to train, validation, and test, see our previous publication. 12
Deployment phase image data set
The vehicle control spleens from seven retrospective studies were utilized in the deployment phase to analyze the normal range of lymphoid compartment area and cellularity for our second objective. These H&E-stained slides, totaling 152 slides from seven toxicology studies sourced from three different histology laboratories, did not undergo any IHC staining.
Segmentation and Quantification
The first task involved establishing a precise method for annotating ground truth. The IHC-stained slides, co-registered with the H&E-stained slides, served as the guide for this purpose. Subsequently, the workflow advanced to the development of a DL model dedicated to spleen compartment segmentation. The DL model’s input consisted of H&E slides, trained using ground truth annotations derived from the co-registered IHC slides. The detection of nuclei was executed within each region by utilizing a general DL-based nuclei segmentation model. The final stage encompassed the quantification of area and cellularity for each compartment. The entire process, involving image co-registration, DL model development, and postprocessing calculations, was conducted using Visiopharm (version 2023.09, Hoersholm, Denmark). A drawing tablet (Cintiq Pro 24” by Wacom, Tokyo, Japan) served as the peripheral device for annotations.
Co-registration of hematoxylin and eosin and immunohistochemistry slides
Generating a reliable ground truth annotation necessitated the precise alignment of H&E and IHC-stained images, as illustrated in Figure 1A and B, respectively. To achieve a distinct demarcation between PALS and follicles, pathologists used co-registered IHC images as a guiding reference (Figure 1C and D). In pursuit of this alignment, a destaining/restaining protocol was strategically employed. This protocol allowed for the acquisition of both IHC and H&E-stained images from the identical tissue section. Subsequently, the alignment of these images was executed with precision, enabling seamless toggling between the two staining modalities. The tissue align module in Visiopharm played a pivotal role in co-registering the H&E and IHC images.
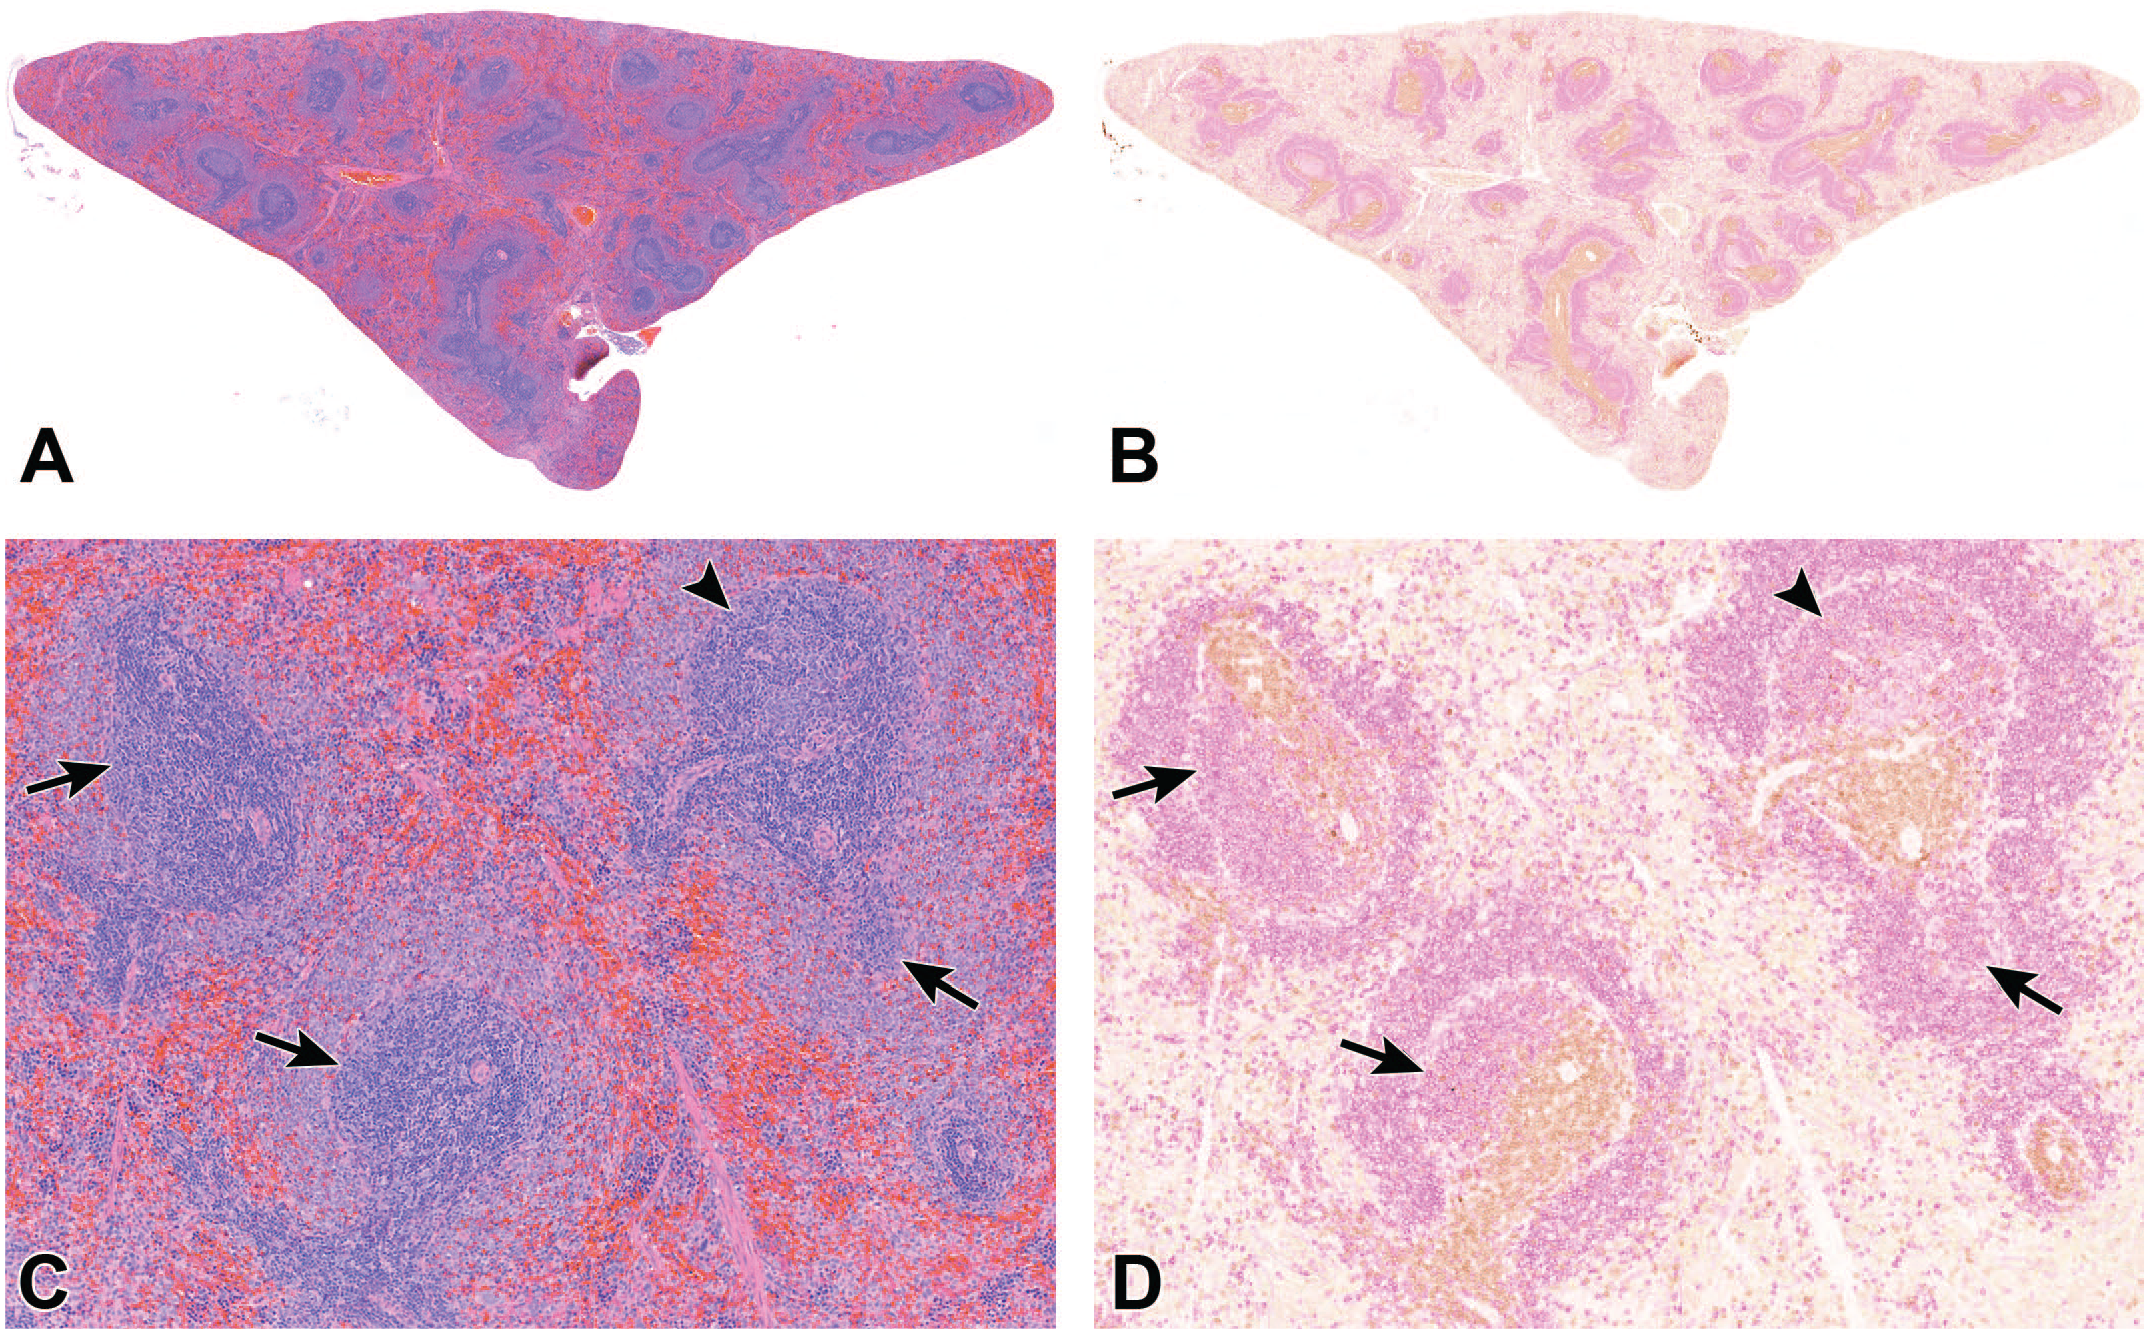
Representative H&E-stained image of a spleen (A and C) and its IHC-stained image (B and D). Follicles without a germinal center in the plane of section (arrows) are more difficult to distinguish from adjacent PALS in the H&E-stained slide, compared to follicles with germinal centers (arrowhead). Therefore, IHC is needed for definite assessment of the boundaries (DAB: CD3+, purple: CD79a+).
At 40× magnification, nonlinear deformations were observed in the re-stained tissue likely due to the chemical reactions during the restaining process. The deformations may cause some co-registration error on cell-to-cell co-registration, but at 20× magnification (DL model’s input magnification), the error was not tangible for pathologists while annotating.
Criteria of ground truth annotation
The ground truth for compartmentalization of the spleen identified seven distinct regions crucial for this study, defined for our purposes by the following:
Exclusion: white space, folds, and perisplenic fat.
PALS: dense and uniformly arranged, small CD3+ lymphocytes encircling arterioles and occupying an area of approximately 6000 µm2 or greater; round when cut in cross-section and branching when cut in the longitudinal plane of arterioles. If a small white pulp region lacked a marginal zone and exceeded 6000 µm2, it was assigned as PALS. These regions contained both CD3+ and CD79a+ lymphocytes. The lower area limit of these small white pulp areas was set based on H&E that the pathologist would consider consistent with white pulp/lymphocytes, and if one compartment was assigned based on morphology alone, it would most likely be judged as PALS.
Blood vessels (BVs): the arterioles that were located within the PALS and were greater than 200 µm2. This class served as an exclusion to limit quantifications of the PALS area to that which was defined by lymphocytes.
Germinal center of follicles (GC): less densely packed, weakly CD79a+, immature lymphocytes surrounded by a corona of mantle zone lymphocytes; round to ovoid and occasionally bilobed, not always present within a given follicle section.
Mantle zone of follicles (M): dense and uniformly arranged, small, CD79a+ lymphocytes arranged in a circle or semicircle, budding off of PALS and bounded by the marginal sinus.
Red pulp (RP): all splenic parenchyma that was not classified as white pulp and still contained many scattered CD3+ and CD79a+ cells.
Marginal zone (MZ): less dense population of slightly larger CD79a+ lymphocytes between the marginal sinus and red pulp, occupying an area of approximately 8000 µm2 or greater.
Marking follicles without germinal center in the plane of section and PALS accurately proved challenging without IHC guidance (Figure 1C and D). Thus, utilizing IHC as a guide for pathologists ensured a more precise ground truth annotation.
Deep learning models
Deep learning models were employed with a segmentation scheme involving seven classes: exclusion, RP, MZ, PALS, M, GC, and BV. The combination of mantle zone and germinal center measurements constituted the follicle. The specifications of the developed DL model were outlined in Supplementary Table 2, encompassing various parameters critical to its development and performance. The validation data set played a crucial role in selecting the optimal architecture and refining the parameters of the DL model, including training magnification, learning rate, and input size. Once the DL model parameters were finalized, the validation data set was merged with the training data set, and the final model was further fine-tuned using this expanded training data set. Parameters not explicitly detailed in this table were set to default Visiopharm settings. For nuclear detection, the DL-based Visiopharm brightfield nuclei detection module was used. Postprocessing steps were added to assign the detected nuclei within each compartment to the corresponding class and provide the calculations. The area of follicles was calculated as M+GC area, whereas the follicle count was the count of mantle zone objects because a follicle may not have a GC.
Model Performance Assessment
The evaluation of the segmentation model’s performance utilized sensitivity, precision, and the Dice Similarity Coefficient (DSC). These metrics were calculated by comparing DL model’s segmentation with ground truth (IHC-guided pathologists’ annotation) on test data set as follows:
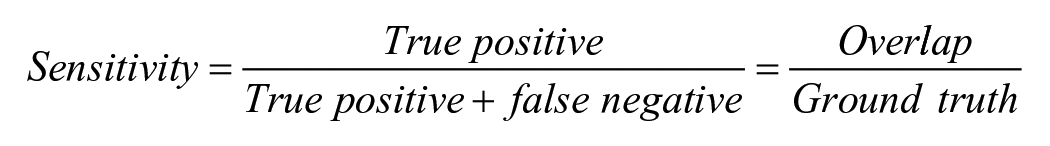
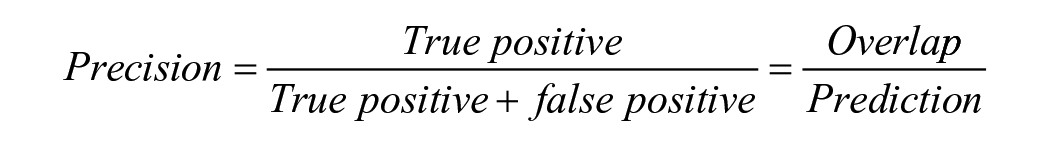
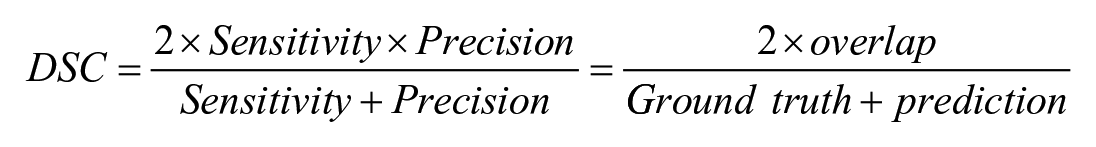
The ground truth represented the area of pathologist-generated annotations (true positive + false negative), whereas the prediction denoted the area of model-generated annotations (true positive + false positive). True positive indicated the overlap between ground truth and prediction. Sensitivity measures the proportion of actual positive instances correctly identified by the model. Precision refers to the ability of the model to make positive predictions. The DSC measures the proportion of the spatial overlap between the model’s predictions and the ground truth.
For assessment of the degree of error in segmentation and its impact on downstream quantifications, measurements, such as area measurements and nuclei count from the DL model, were compared with those from the ground truth. The correlation and Bland-Altman analyses were employed for this purpose. The correlation analysis was conducted to examine the strength and direction of a linear relationship between the measurements obtained from the DL model and the ground truth. The Bland-Altman analysis gauged the agreement and bias between measurements from the DL model and ground truth. The Bland-Altman plots displayed the average value of the two methods vs the difference between them, with the limit of agreement determined at a 95% confidence level (mean bias ± 1.96 standard deviations).
Furthermore, the model’s performance on H&E images was compared with the pathologists’ performance on the same slides without the IHC assistance. Three pathologists (BB, WB, and LH), experienced in general toxicology studies, independently annotated three unique H&E spleen WSIs at 20×. White pulp and red pulp were pre-segmented, and pathologists delineated the follicle and PALS regions. The DL model and pathologist results were compared using sensitivity, precision, and DSC in follicles and PALS. The performance metrics were calculated using the ground truth (annotations utilizing IHC as the guide).
By evaluating DSC, correlation, and agreement using the Bland-Altman method, the performance of the DL model was assessed and compared with the ground truth (IHC-guided pathologist annotation) measurements.
Statistical Analysis
To identify statistical significance in measurements, an analysis of variance (ANOVA) with multiple comparisons of means was employed. The Tukey Honestly Significant Difference (HSD) post hoc test was applied to assess pairwise differences between groups. Statistical analysis was performed on the pilot study to analyze inter-animal and intra-animal variability, as well as on the deployment data set to assess the normal variability across different study durations. A P-value below .05 was considered to indicate the significant differences between groups.
Results
Tissue Staining and Co-Registration Efficacy
The destaining and restaining procedure helped to generate co-registered images of H&E and IHC from the same slide without loss of signal in relation to CD3 and CD79a epitope antigenicity. The co-registration performance was evaluated qualitatively. Although pixel-perfect alignment was not pursued, the co-registration demonstrated accuracy at 20× magnification, which proved sufficient for compartment annotation. The success of the destaining/restaining and co-registration procedures was crucial for ensuring the accuracy and reliability of the generation of ground truth annotations for model development.
Evaluation of Deep Learning Model Performance
Segmentation performance
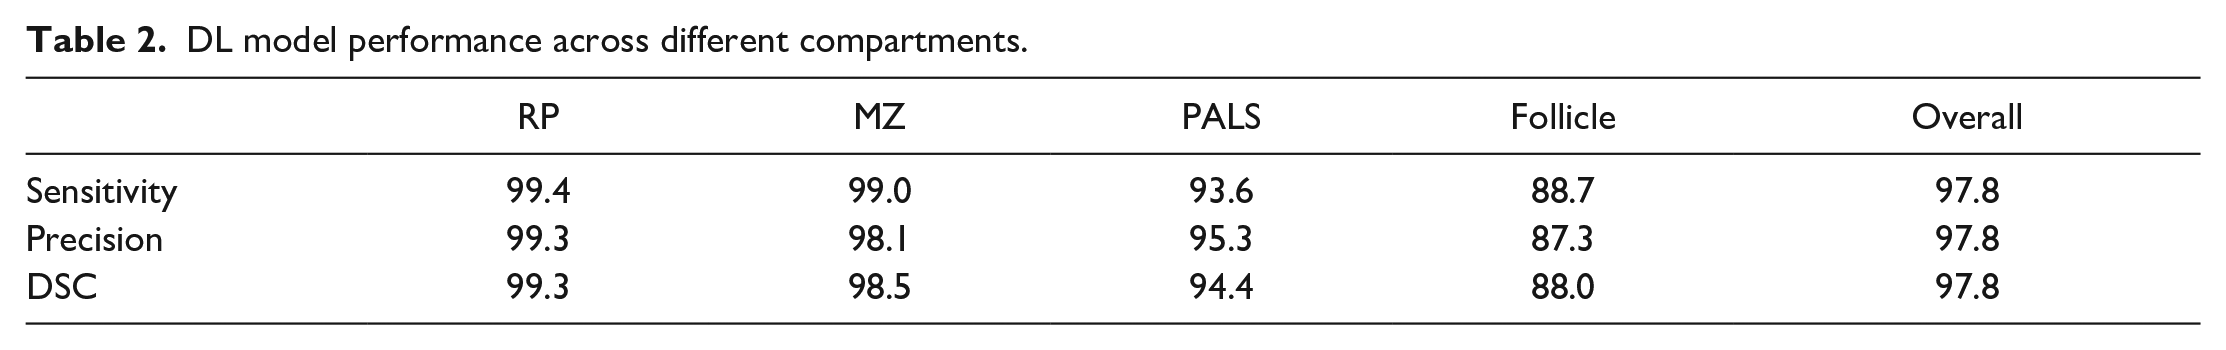
The IHC slides were used by the pathologist for the ground truth annotations on H&E-stained slides (Figure 2A). The developed DL model from H&E-stained images successfully segmented different compartments of the rat spleen (Figure 2B) with an overall DSC of 97.8% (Table 2). The confusion matrix (Table 3) showed that the distinction between follicle (germinal center + mantle zone) and PALS by the DL model has a low error (10.0% and 4.1%, respectively), indicating reliable segmentation of B- and T-cell compartments, respectively. Differentiating marginal zone and PALS was also done seamlessly (error of 0.4% and 0.5%, respectively). A DL model was utilized to detect and count nuclei in different compartments (Figure 2C).
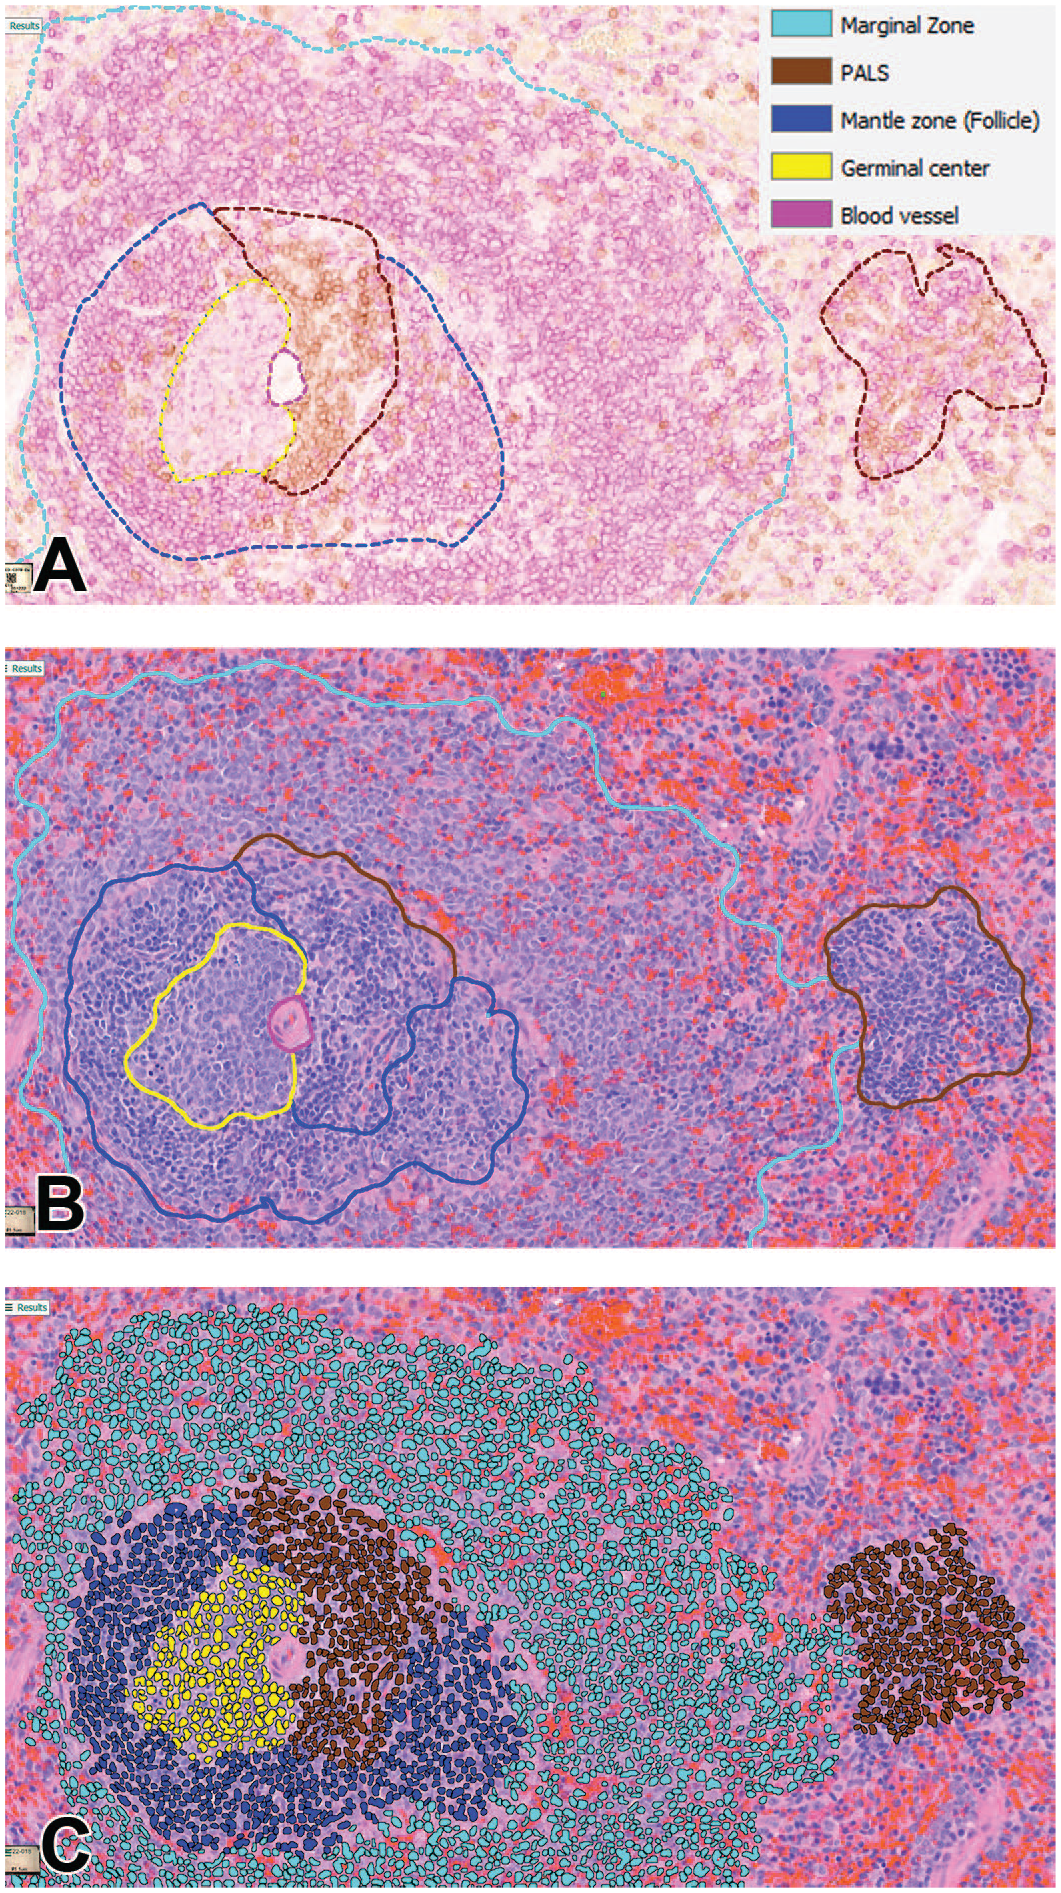
Photomicrographs of (A) IHC-stained rat spleen (DAB: CD3+, purple: CD79a+) with a ground truth overlay, (B) H&E-stained slide with the overlay of DL model prediction, and (C) H&E-stained slide with the overlay of nuclei detection in different compartments.
DL model performance across different compartments.
Confusion matrix for model performance evaluation in different compartments.
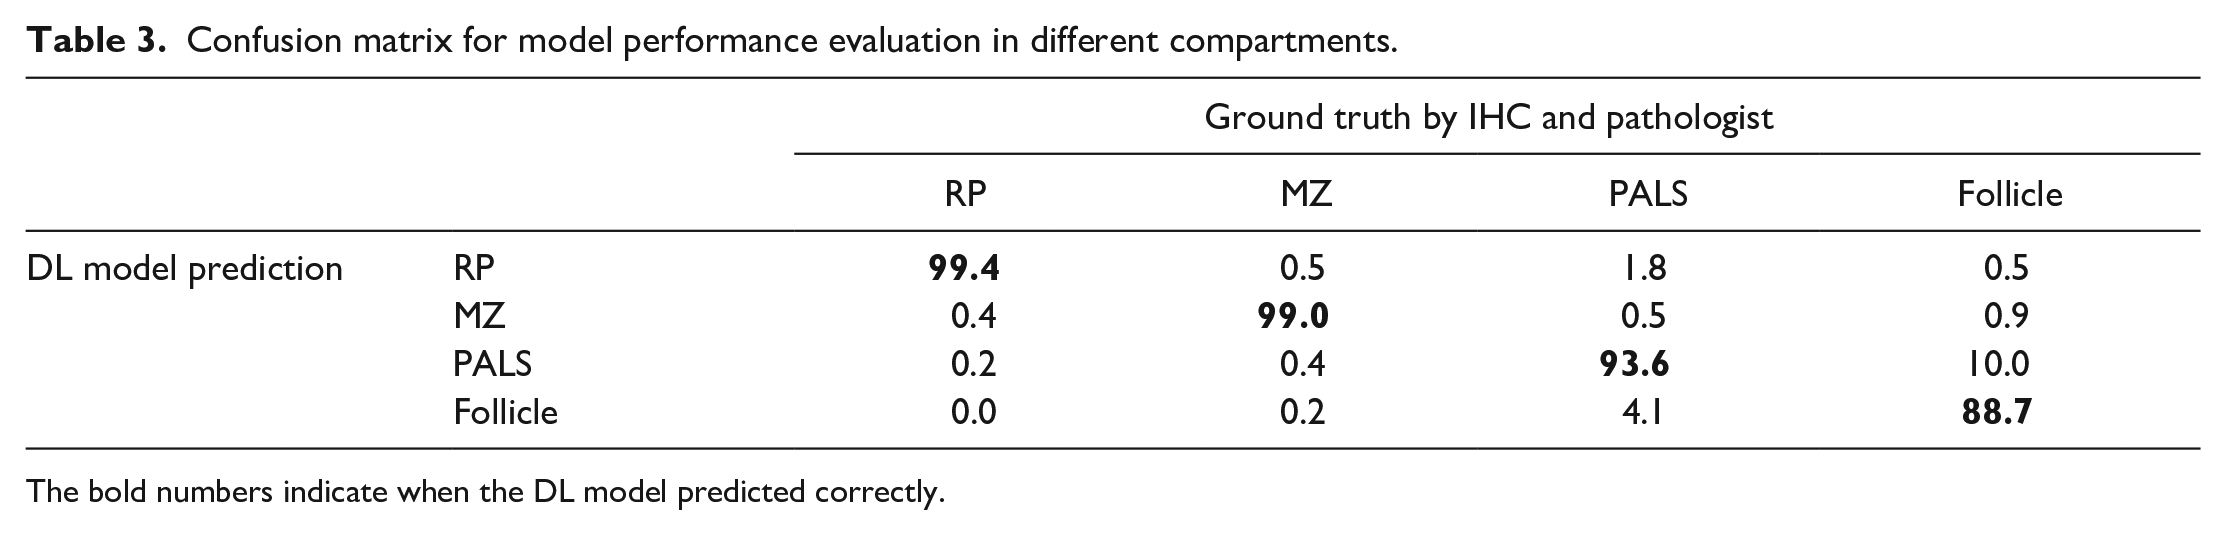
The bold numbers indicate when the DL model predicted correctly.
Correlation and Bland-Altman analyses
Correlation analysis revealed strong positive correlations between the DL model measurements and those obtained from the ground truth in all assessed readouts (Supplementary Figure 1). The coefficient of determination (R2) values, ranging from 0.6963 for GC count to 0.9967 for MZ area, indicated a strong relationship between the measurements obtained from the DL model and the ground truth. The Bland-Altman analysis showed a strong agreement between the DL model and the ground truth measurements with minimal bias, ranging from 0.0005 for follicle area to 0.0993 for follicle count, and the measurements falling within the upper and lower levels of agreement (Supplementary Figure 2).
Pathologists vs deep learning model
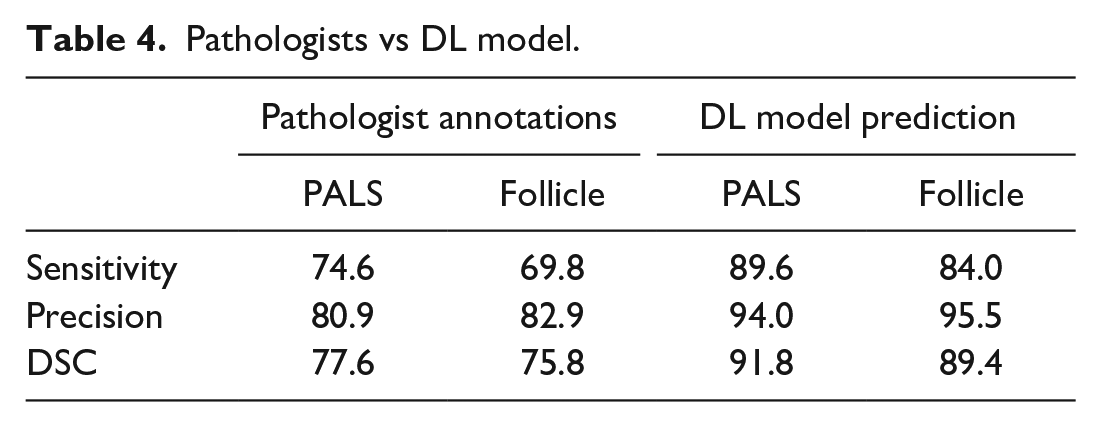
We also compared the performance of the DL model with that of pathologists not benefiting from IHC as the guide. Three experienced toxicologic pathologists were tasked with identifying follicles and PALS in the H&E slides, and on average, they were outperformed by the DL model. When manually annotating these regions on H&E slides without the benefit of viewing the co-registered IHC images, DSC for follicles was 75.8% and for PALS was 77.6%, compared with model performance of 89.4% and 91.8%, respectively (Table 4).
Pathologists vs DL model.
Inter-Animal and Intra-Animal Variability
The data from serial sections of 4 rats was used to analyze inter-animal and intra-animal variability (Figure 3). For PALS, the overall mean area ratio was 0.11, and cellularity was approximately 18 per 1000 µm2. In follicles, the overall mean area ratio was 0.07, and cellularity was approximately 18 per 1000 µm2. In the marginal zone, the overall mean area ratio was 0.26 with a cellularity of approximately 15 per 1000 µm2. Rat #3 had a significant higher MZ area compared with other rats, with a mean ratio of 0.32, approximately 23% higher than the group mean, although cellularity remained similar. Inversely proportionate to the increase in MZ area in rat #3, the red pulp area was on average 14% significantly lower than all rats. Although the overall density of follicles did not vary greatly, there was noteworthy inter-animal and intra-animal variability in the density of germinal centers. The overall mean count of germinal centers per mm2 of spleen was 0.29; however, in rat #2, it was 0.05 (essentially no germinal centers, significantly lower than all rats). This was likely reflective of both biological and sampling variation. Significant differences were mentioned when P-value was below .05.
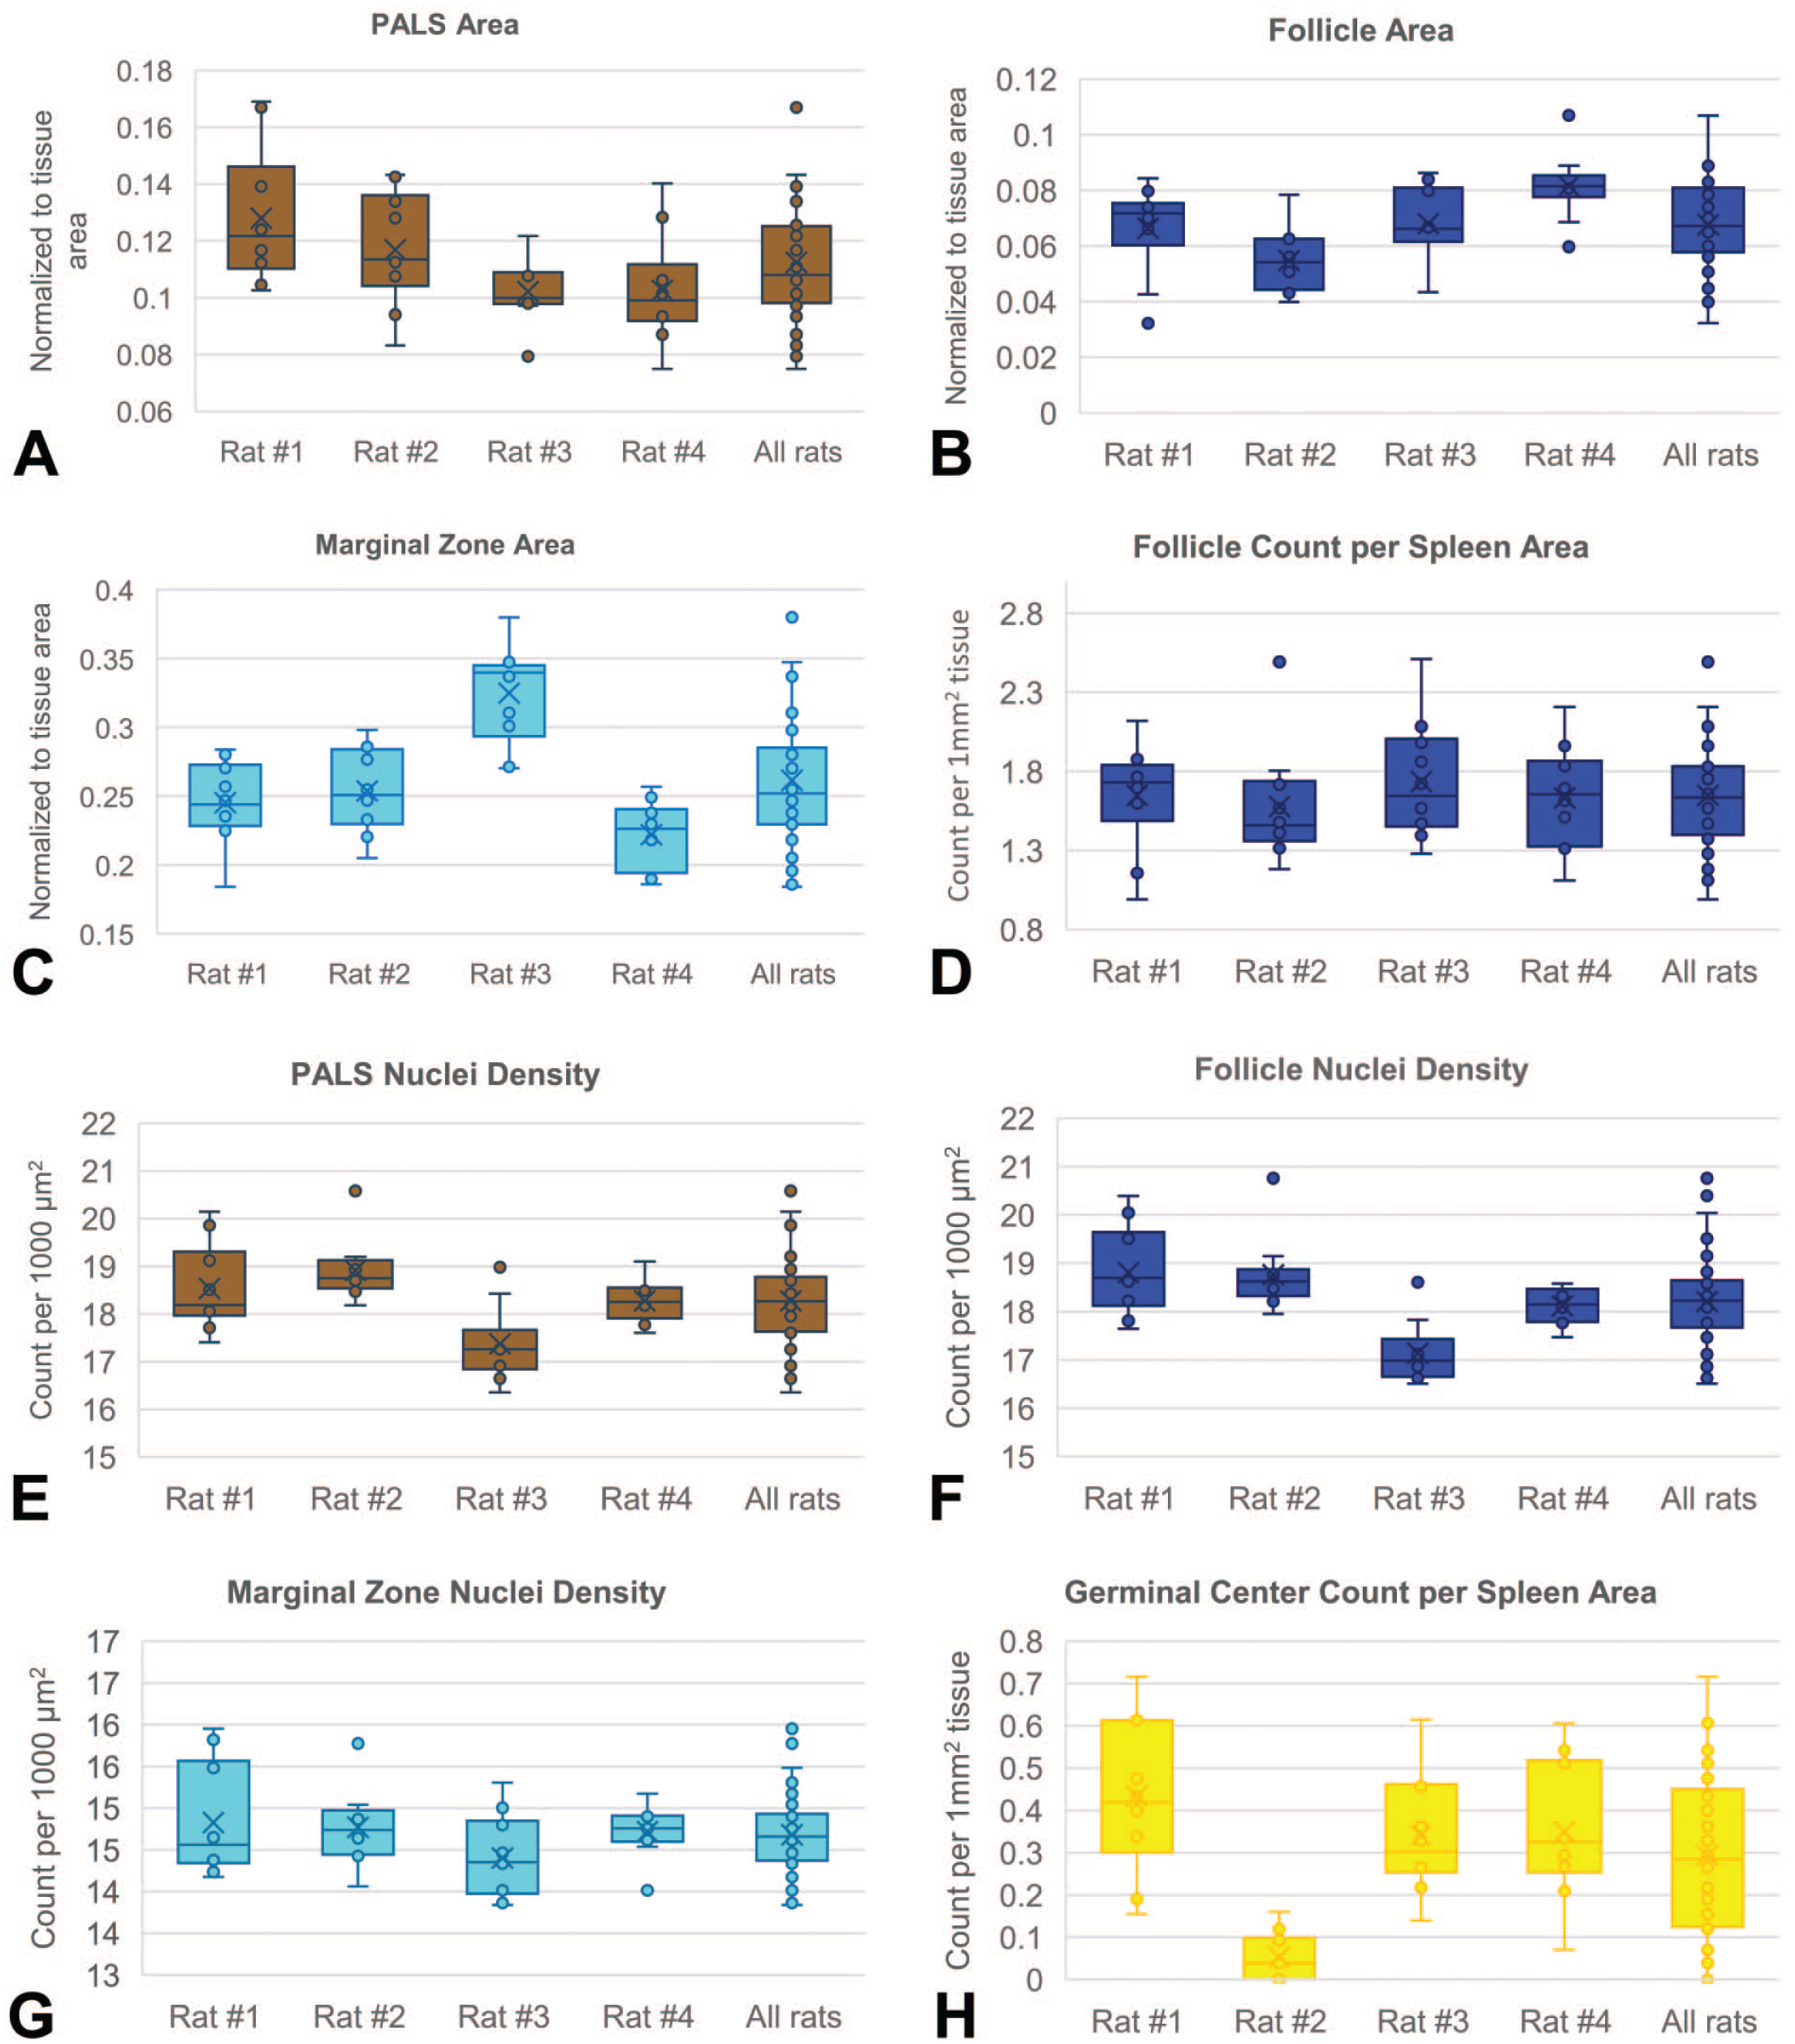
Box plots of measurements showing inter-animal and intra-animal variability for the area of PALS (A), follicle (B), and marginal zone (C); the nuclei density of PALS (E), follicle (F), and marginal zone (G); and the density of follicle (D) and germinal centers (H).
Normal Range Variability
The analysis of normal range variability based on the duration of studies revealed notable trends (Figure 4). Comparing cohorts of animals across 2-week (n = 40 rats), 4-week (n = 60 rats), or subchronic (13-week or 16-week) studies (n = 52 rats), there was a significant decrease in the area of follicles and marginal zone observed in spleens from longer-duration studies, as depicted in Figure 4B and C, respectively. In addition, a significant increase in the density of nuclei was observed in all subregions of white pulp with longer-duration studies, as shown in Figure 4E-G. Moreover, significantly lower follicle and germinal center counts were observed in longer-duration studies, as shown in Figure 4D and H.
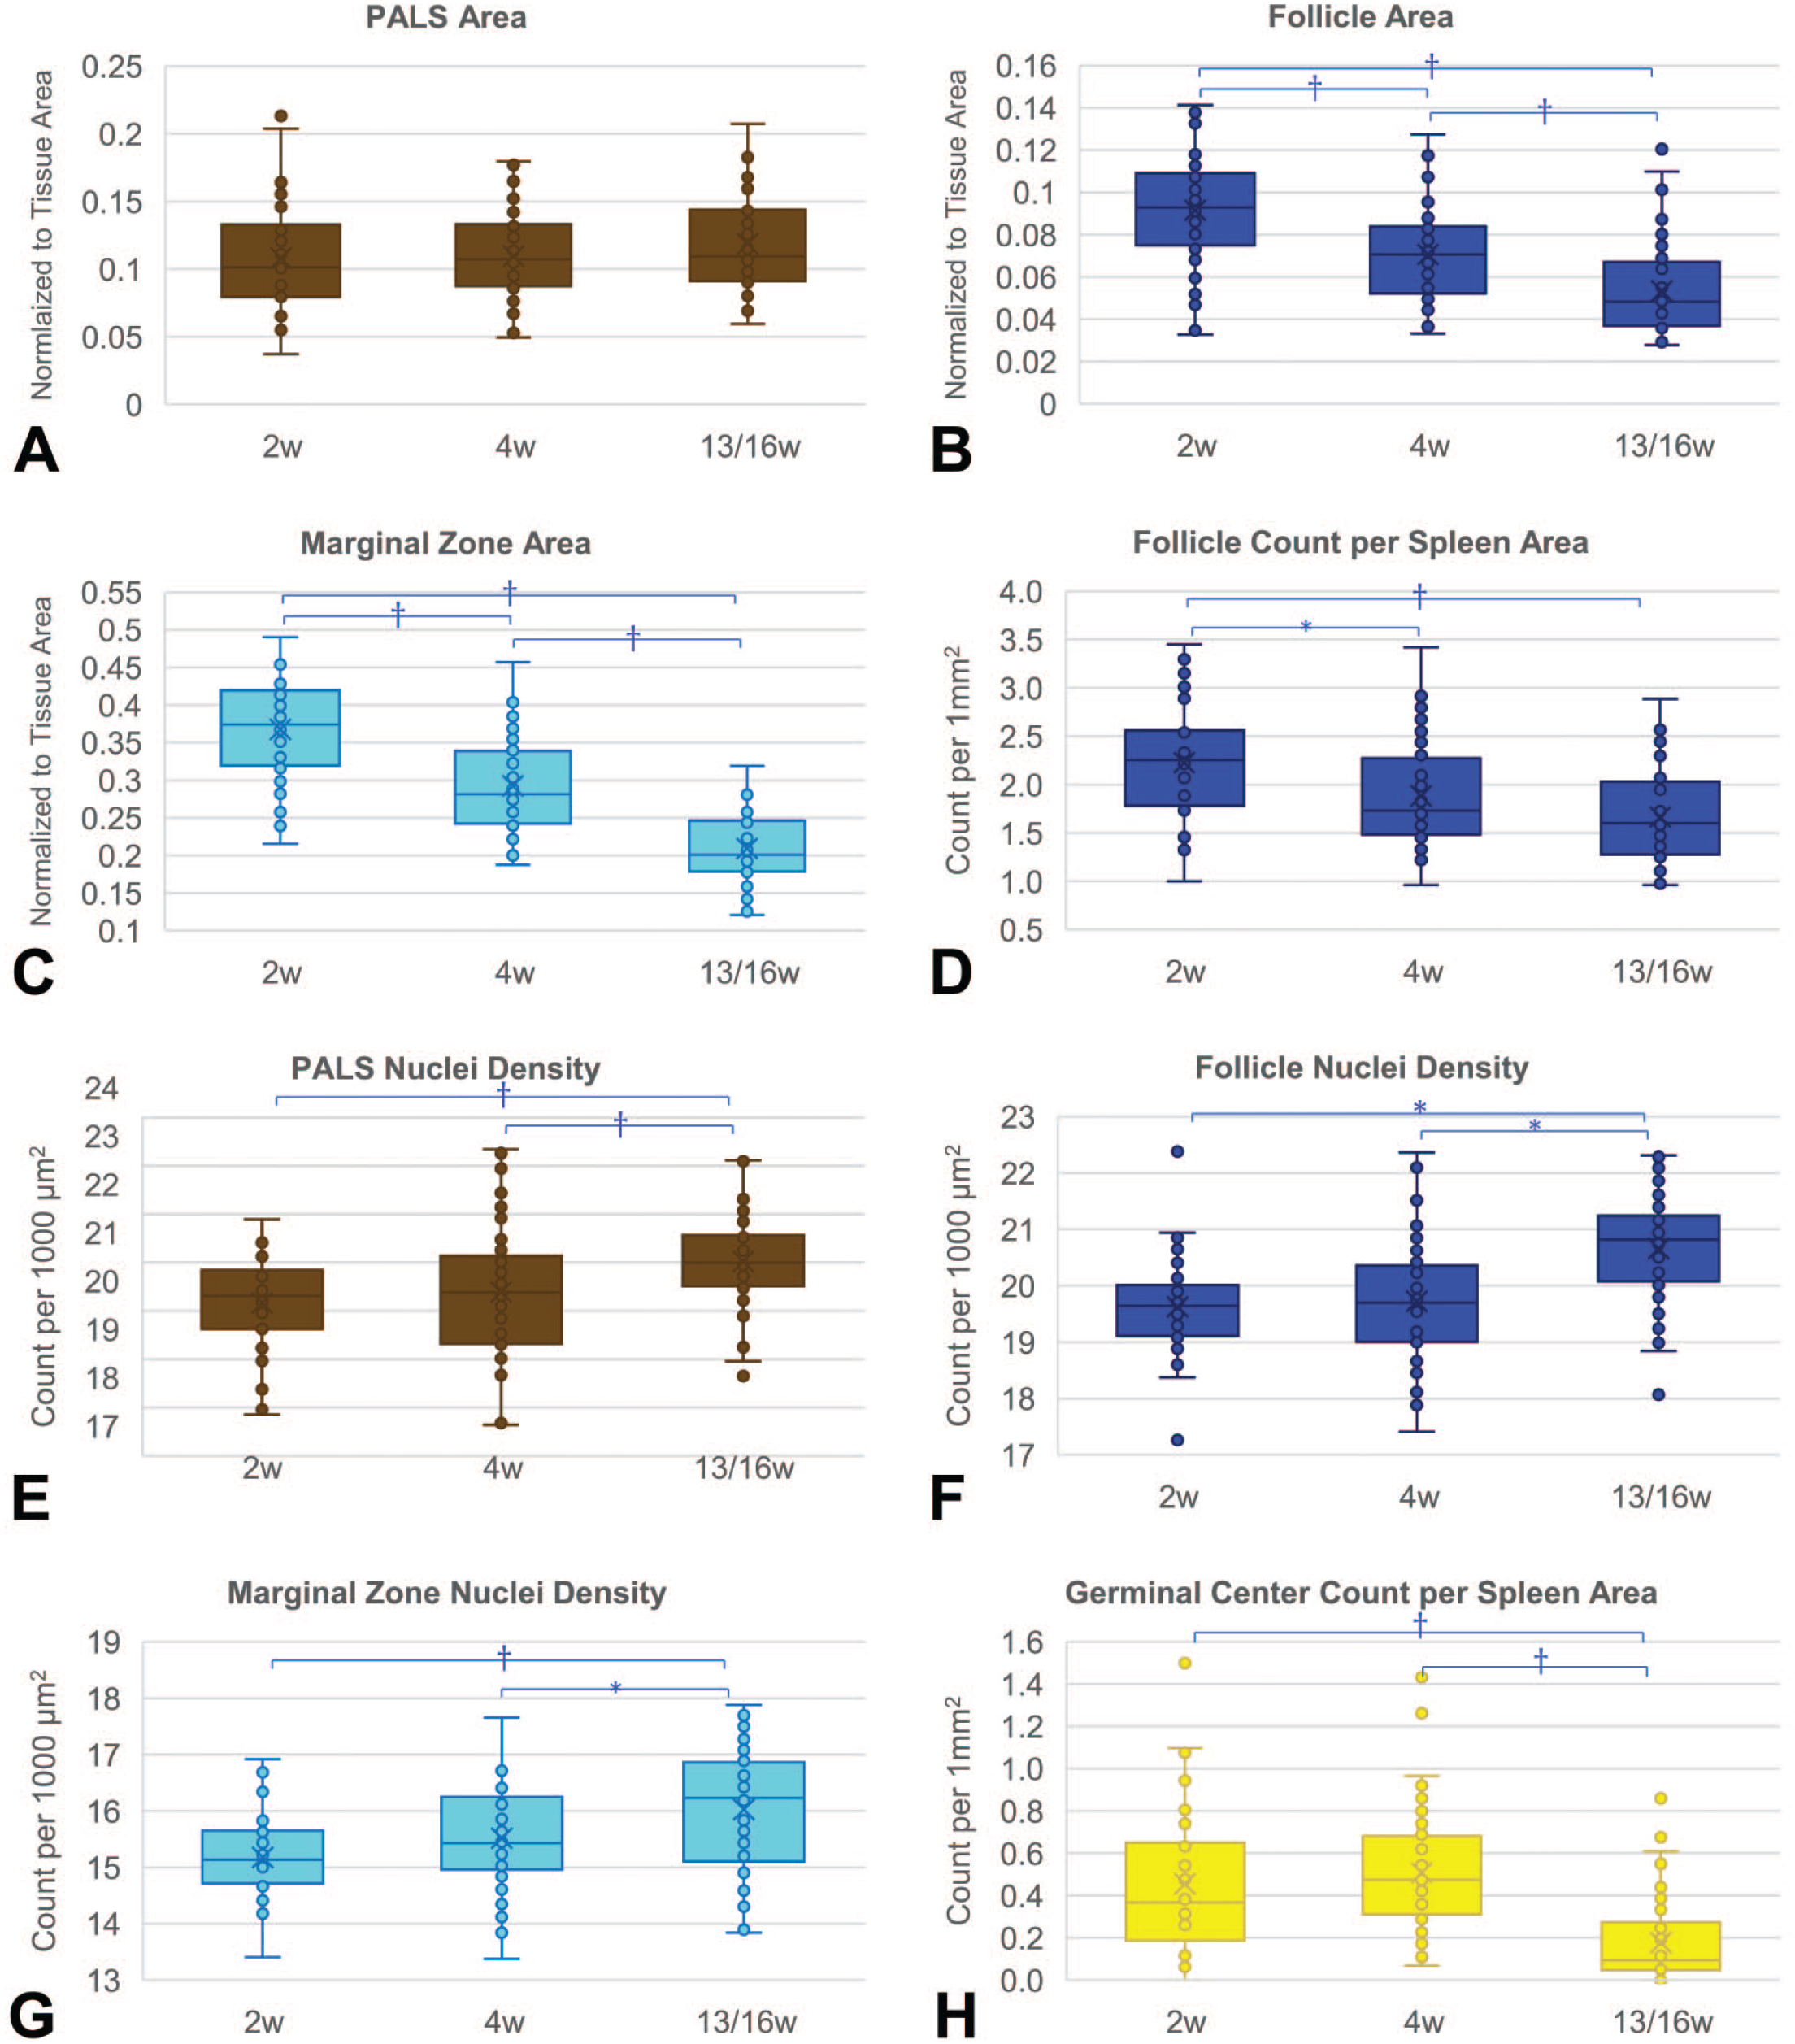
Box plots of measurements showing normal variability in studies with different durations of 2 weeks (2w, 2 studies, n = 40), 4 weeks (4w, 3 studies, n = 60), and 13 or 16 weeks (13/16w, 2 studies, n = 52). Asterisk (*) marks a significant difference with P-values below .05, and dagger (††) marks a significant difference with P-values below .001.
Discussion
Immunohistochemistry-Free Compartment Segmentation in Spleens (Objective 1)
The development and validation of a DL model for IHC-free compartment segmentation in rat spleens provides significant assistance for enhanced histopathology assessment. The IHC has traditionally been the gold standard for identifying and characterizing T- and B-cell compartments within lymphoid tissues. However, the DL model presented in this study demonstrates an innovative approach by accurately quantifying relevant spleen compartments directly from H&E slides. The ground truth annotations for training and validation were obtained through a meticulous process involving pathologist-guided annotations of H&E-stained slides with co-registered IHC-stained slides, providing a robust foundation for the DL model development. The sample-sparing restaining procedure (destaining tissue section, then restaining with second staining application) is frequently used in human pathology when biopsies are too small to re-cut for the necessary staining required for diagnosis. In human pathology, tissue restaining has also been used for DL model development for ground truth annotation 11 or virtual staining. 8 Utilization of the IHC as a reference for ground truth annotation allowed us to mitigate subjectivity and develop a reliable DL model.
The results indicate high DSC in the segmentation of individual splenic compartments, including PALS, follicles, germinal centers, and marginal zones. However, the lower limit for small white pulp areas designated as PALS in our ground truth criteria may cause incorrect identification of these small areas as RP (1.8% error, Table 3). The low error rates in distinguishing between follicles and PALS highlight the reliability of the DL model in segmenting B- and T-cell compartments. Furthermore, the comparison to pathologist annotations without IHC assistance emphasizes the superior performance of the DL model, showcasing its potential as an efficient and accurate tool for routine histopathologic assessments of lymphoid tissues. It was tedious for pathologists to annotate and contemplate the precise boundaries from H&E alone. Considering that these slides were within normal limits, the challenge is greater in abnormal slides when the pathologists must accurately define subtle or complex compartment changes. Often, pathologists score these subregions independently on H&E sections when evaluating for immunotoxicity, and the difficulties in doing this correctly support the utility of our DL model. Qualitatively studying images of the pathologist annotations compared with model segmentation outputs indicated that pathologist errors on H&E mainly occurred due to failure to appropriately categorize a small/oblique section through a follicle (ie, assignment to PALS or MZ class instead) or due to the natural tendency of humans to draw boundaries with smooth, regular contours rather than precise carving between small groups of cells.
The downstream effect of DL model segmentation error on the quantifications has been minimal (Supplementary Figures 1 and 2). Correlation analysis showed a high degree of association between DL model and ground truth (IHC-guided pathologist annotation) outputs. However, the reason for the lower correlation coefficient in follicle and germinal center counts is an important aspect to consider (Supplementary Figure 1). This discrepancy can be attributed to the fact that false detections or false negatives in small follicles/germinal centers exert a disproportionately larger influence on their counts compared with the calculation of total follicle areas. Count estimates can be highly biased in 2-dimensions, which could contribute to some of the variability seen. 1 , 7 This emphasizes the importance of carefully selecting quantitative metrics, where even minor errors can cascade into a more substantial impact on the overall assessment.
In addition, the Bland-Altman analysis indicated that there was high agreement and low bias between the DL model and ground truth measurements. All the performance evaluation steps taken provided further validation of DL model and its utility in histopathological evaluations.
Assessment of Normal Range Variability in Spleens (Objective 2)
The second objective of this study aimed at leveraging DL to quantify the area and cellularity of lymphoid compartments in normal rat spleens and assess inter-animal and intra-animal variability (Figure 3). The results underscore the significance of challenging the assumption that a single section adequately represents the spleen complexity. Serial sections showed the modest inter-animal and intra-animal variability in control rats, particularly in marginal zone area and number of germinal centers, the likes of which could potentially be misinterpreted as test article-related effects, especially in studies with smaller group sizes. The analysis sheds light on both biological and sampling variation, providing a more nuanced understanding of the spleen’s structural variability.
Notably, the evaluation of normal range variability based on the duration of studies (Figure 4) uncovered trends such as a decrease in the area of follicles and marginal zones in spleens from longer-duration studies. This insight, coupled with an increase in the density of nuclei in lymphoid compartments, contributes to a comprehensive understanding of how spleen morphology and cellular composition may change with the age of the rat. The increased nuclei density in lymphoid compartments may indicate a greater proportion of small, mature lymphocytes, potentially influenced by the age of the rat; similarly, lower follicle and germinal center counts in longer studies could imply dynamic changes in these regions with increasing age that has been reported previously.2,3,5,18 These observations in longer-duration studies add valuable context to interpreting histopathological findings, highlighting the importance of considering study duration (the biological function of age) in the assessment of immune system dynamics.
Limitations
Our approach in providing cellularity assessments (density) of splenic subregions yields information about the cell type predominating in those areas but does not directly convey the identity of the cells. Our intent was to recapitulate the area and cellularity assessments typically performed by a pathologist conducting enhanced histopathologic evaluations. General T- and B-cell immunohistochemical markers were considered sufficient to demarcate the ground truth compartments. Training the model at a higher magnification to segment individual T- and B-cells or including multiple lineage markers to encompass other leukocyte or stromal populations was beyond the scope of our objectives but could be pursued if that level of detail is of interest for a particular program and is practical given the level of time and computing power required.
The use of CD3/CD79a dual IHC stain necessitated some level of subjectivity in generating ground truth annotations. This was partially controlled by defining the set ground truth criteria (eg, defining lower limit threshold areas to fit the criteria for PALS, marginal zones, or BVs) and using postprocessing steps to enforce them. In the future, further development of multiplex IHC to include a broader range of B-cell markers (eg, MHC II, IgM) would enable clearer differentiation of follicles and marginal zones. Similarly, CD4 and CD8 markers could be applied to better delineate inner/outer PALS regions from follicles. Any impact of training the model with more refined ground truth annotations could be assessed by comparing the performance of the two different models.
The study acknowledges the need for a more extensive representation of spontaneous findings in control rats for the most robust model. We found it helpful to supplement our training set with examples of rat spleens containing a range of qualitatively normal amounts of extramedullary hematopoiesis in the red pulp.
Future Directions
Testing the generalizability of this DL model in slides with microscopic abnormalities in red and/or white pulp compartments will be needed to determine its limits and demonstrate utility in the pathology workflow. If the performance remains high when challenged with various spontaneous or test article-related abnormalities, our IHC-free model may be applied prospectively in general toxicity studies to gain an early understanding of the toxicity profile and immune cells affected. Lesions to be interrogated would span increases and decreases in cellularity (ie, immunostimulatory or immunosuppressive effects, respectively) of both red and white pulp compartments. One practical application of such a model would be a first-pass readout of any potential lymphoid tissue alterations to highlight slides/groups with findings of interest for pathologist review, preceding and potentially obviating or justifying the initiation of IHC. We anticipate that another, more impactful benefit would be in decision support for consistently discerning normal from lower magnitude (grade 1-2) findings, which are more difficult for pathologists to reliably discriminate, consume much time in deliberating between pathologists whether there is an effect and to what degree, and ultimately are important for identifying the No Observed Effect Level (NOEL) or “clean” dose The sensitivity of our model to detect such changes will be determined in the future. Given the observed age-related effects on the normal variability of compartment quantifications, it becomes important to distinguish between the influence of increasing age and potential test article-related effects. Aspirationally, we aim to leverage transfer learning across other species and tissues to generate artificial intelligence (AI)-assisted collective assessment of the major lymphoid organs. Multidimensional data analysis (evaluating the relationship between these DL outputs and other parameters, like organ weight, circulating cell counts, and peripheral blood immunophenotyping) may enable us to define specific immune-related signatures and phenotypes that inform on the mechanism and significance, correlate with morbidity/mortality, and potentially even assist in adversity determinations. As more control animals are analyzed, we will be able to quantitatively define phenotypes associated with spontaneous effects of age, strain, and stress. The degree of intra-animal variability we observed across step sections of the spleen may argue for the evaluation of an increased number of sections when effects in the lymphoid tissues are anticipated.
Conclusion
We have developed a DL model that accurately segments and quantifies key compartments of the rat spleen from H&E slides, enabling rapid objective morphological assessment of the PALS, follicles, germinal centers, marginal zone, and red pulp. Novel to our approach, the ground truth for training and validation was obtained from pathologist-guided annotations of H&E-stained slides with co-registered, dually CD3/CD79a IHC-stained slides, whereas the DL model training input was limited to H&E-stained slides. The findings from normal range variability assessments contribute to a nuanced understanding of spleen compartments and cellularity in older age groups or inter-animal and intra-animal variability in the same age group. The study provides insights into potential applications for future refinement in abnormal spleens, setting the stage for continued advancements in AI-assisted pathology assessments.
Supplemental Material
sj-docx-5-tpx-10.1177_01926233241303907 – Supplemental material for Immunohistochemistry-Free Enhanced Histopathology of the Rat Spleen Using Deep Learning
Supplemental material, sj-docx-5-tpx-10.1177_01926233241303907 for Immunohistochemistry-Free Enhanced Histopathology of the Rat Spleen Using Deep Learning by Shima Mehrvar, Kevin Maisonave, Wayne Buck, Magali Guffroy, Bhupinder Bawa and Lauren Himmel in Toxicologic Pathology
Supplemental Material
sj-tif-1-tpx-10.1177_01926233241303907 – Supplemental material for Immunohistochemistry-Free Enhanced Histopathology of the Rat Spleen Using Deep Learning
Supplemental material, sj-tif-1-tpx-10.1177_01926233241303907 for Immunohistochemistry-Free Enhanced Histopathology of the Rat Spleen Using Deep Learning by Shima Mehrvar, Kevin Maisonave, Wayne Buck, Magali Guffroy, Bhupinder Bawa and Lauren Himmel in Toxicologic Pathology
Supplemental Material
sj-tif-2-tpx-10.1177_01926233241303907 – Supplemental material for Immunohistochemistry-Free Enhanced Histopathology of the Rat Spleen Using Deep Learning
Supplemental material, sj-tif-2-tpx-10.1177_01926233241303907 for Immunohistochemistry-Free Enhanced Histopathology of the Rat Spleen Using Deep Learning by Shima Mehrvar, Kevin Maisonave, Wayne Buck, Magali Guffroy, Bhupinder Bawa and Lauren Himmel in Toxicologic Pathology
Supplemental Material
sj-tif-3-tpx-10.1177_01926233241303907 – Supplemental material for Immunohistochemistry-Free Enhanced Histopathology of the Rat Spleen Using Deep Learning
Supplemental material, sj-tif-3-tpx-10.1177_01926233241303907 for Immunohistochemistry-Free Enhanced Histopathology of the Rat Spleen Using Deep Learning by Shima Mehrvar, Kevin Maisonave, Wayne Buck, Magali Guffroy, Bhupinder Bawa and Lauren Himmel in Toxicologic Pathology
Supplemental Material
sj-tif-4-tpx-10.1177_01926233241303907 – Supplemental material for Immunohistochemistry-Free Enhanced Histopathology of the Rat Spleen Using Deep Learning
Supplemental material, sj-tif-4-tpx-10.1177_01926233241303907 for Immunohistochemistry-Free Enhanced Histopathology of the Rat Spleen Using Deep Learning by Shima Mehrvar, Kevin Maisonave, Wayne Buck, Magali Guffroy, Bhupinder Bawa and Lauren Himmel in Toxicologic Pathology
Footnotes
Author Contributions
Authors contributed to study concept or design (SM, KM, WB, MG, BB, LH); sample preparation and method development (KM, LH); data acquisition, analysis, or interpretation (SM, WB, MG, BB, LH); drafting the manuscript (SM, WB, MG, BB, LH); and critically revising the manuscript (SM, WB, MG, BB, LH). All authors gave final approval of the work.
Declaration of Conflicting Interests
The author(s) declared no potential conflicts of interest with respect to the research, authorship, and/or publication of this article.
Funding
The author(s) disclosed receipt of the following financial support for the research, authorship, and/or publication of this article: The authors are employees of AbbVie and may own AbbVie stocks. AbbVie sponsored and funded the study; contributed to the design; participated in the collection of data, analysis, and interpretation of data; and in writing, reviewing, and approval of the final publication.
Supplemental Material
Supplemental material for this article is available online.
References
Supplementary Material
Please find the following supplemental material available below.
For Open Access articles published under a Creative Commons License, all supplemental material carries the same license as the article it is associated with.
For non-Open Access articles published, all supplemental material carries a non-exclusive license, and permission requests for re-use of supplemental material or any part of supplemental material shall be sent directly to the copyright owner as specified in the copyright notice associated with the article.