
Abstract
Inflammatory bowel disease (IBD) is a complex disease which leads to life-threatening complications and decreased quality of life. The dextran sulfate sodium (DSS) colitis model in mice is known for rapid screening of candidate compounds. Efficacy assessment in this model relies partly on microscopic semiquantitative scoring, which is time-consuming and subjective. We hypothesized that deep learning artificial intelligence (AI) could be used to identify acute inflammation in H&E-stained sections in a consistent and quantitative manner. Training sets were established using ×20 whole slide images of the entire colon. Supervised training of a Convolutional Neural Network (CNN) was performed using a commercial AI platform to detect the entire colon tissue, the muscle and mucosa layers, and 2 categories within the mucosa (normal and acute inflammation E1). The training sets included slides of naive, vehicle-DSS and cyclosporine A-DSS mice. The trained CNN was able to segment, with a high level of concordance, the different tissue compartments in the 3 groups of mice. The segmented areas were used to determine the ratio of E1-affected mucosa to total mucosa. This proof-of-concept work shows promise to increase efficiency and decrease variability of microscopic scoring of DSS colitis when screening candidate compounds for IBD.
Keywords
Introduction
Inflammatory bowel disease (IBD), which encompasses Crohn disease and ulcerative colitis, is a complex multifactorial disease. It leads to life-threatening complications and decreased quality of life due to weight loss, chronic diarrhea and pain, malnutrition, colon cancer, colon perforation, and ulceration, as well as the need for repeated surgery in some patients. The precise cause of IBD remains unknown. It is thought to be a combination of genetic and environmental factors, both external and internal to the digestive tract. The conventional treatment of IBD consists of immunosuppressants, tumor necrosis factor inhibitors, and corticosteroids, all of which are associated with significant side effects and are not curative. 1 –3 Hence, the research of alternative therapies is moving at a rapid pace. To screen candidate compounds, rodent models are common because of their ease of use and the rapid and reliable induction of colitis. The dextran sulfate sodium (DSS) colitis model in mice is well known and widely used for rapid screening of candidate compounds. When administered in drinking water, DSS administration results clinically in body weight loss, loose stools, and hematochezia. Microscopically, colon ulceration and inflammation are noted, both of which recapitulate key features of IBD. To assess the efficacy of candidate compounds, microscopic evaluation of the colon is generally performed by a veterinary pathologist using semiquantitative scoring of ulceration and inflammation. 4,5 This scoring is time-consuming and subject to intraobserver and interpathologist variability. In addition, colitis induction in DSS-induced colitis is segmental in nature, rendering semiquantitative scoring even more difficult. The proximal, middle, and distal colon show a variable severity of inflammation and ulceration that are characteristic of the model. In order to reduce the time veterinary pathologists spend on scoring these models, to decrease the scoring variability, and to provide more robust and quantitative data, we developed a deep learning-based artificial intelligence (AI) model for digital tissue image analysis. Deep learning is a subset of machine learning methods within the domain of AI. In deep learning, image analysis applications derive the features of tissue compartments from the image data itself. In the case of supervised deep learning methods, user-generated examples (annotations) are provided to the system for “feature extraction” and classification. This is a significant advantage over classical image analysis approaches where the features of interest need to be predefined by the user. This is especially challenging in complex scoring systems, such as the scoring of DSS colitis. The deep learning model architecture resembles the architecture of neural connections of the brain; hence, the models are referred to as artificial neural networks (ANNs). Convolutional Neural Networks (CNNs) are a type of ANN that performs especially well in computer vision tasks, including digital tissue image analysis. 6
We hypothesized that a deep learning CNN–based AI model could be successfully used to identify acute inflammation in hematoxylin and eosin (H&E)-stained sections. Our goal was to focus on H&E-stained slides only and to include in the analysis our current positive control, cyclosporine A (CsA), which consistently reduces the severity of the disease model. 7 This article describes the development of the supervised training of a proof-of-concept CNN–based AI model to assess acute inflammation/disease (E1) in H&E colon sections using a commercial AI platform in order to perfect and accelerate the screening of candidate IBD compounds.
Materials and Methods
Animal Studies, Digital Slide Acquisition, and Institutional Animal Care and Use Committee Review
For the CNN, 3 training sets were established using whole slide images (WSIs) of the entire colon. The colon was cut in segments using the stretched colon technique and stained with H&E. The stretched colon technique is routinely used at Charles River Senneville for any IBD studies and provides a good visualization of the entire length of the mice colon. To obtain the samples, the entire bowel is removed from the abdominal cavity and the colon is separated. The fecal pellets are removed by flushing with cold phosphate-buffered saline, then the colon is flushed with 10% neutral-buffered formalin (NBF). It is then stretched and cut in segments of up to 30 mm in length, starting at the cecocolic junction, resulting in usually 3 segments per animal. The segments are placed in a cassette between foam pads to flatten them. Following fixation by immersion in 10% NBF, segments are embedded upright in paraffin, cut at 4 µm, and stained with H&E to provide longitudinal sections (Figure 1). The H&E staining was performed using Charles River Senneville standard operating procedures. A visual quality check (qc) was performed on all slides to ensure that the entire length of each segment was present. Slides were then scanned at ×20 using an Aperio AT2 scanner (Leica Biosystems) and uploaded into Aiforia Cloud (Aiforia Inc).
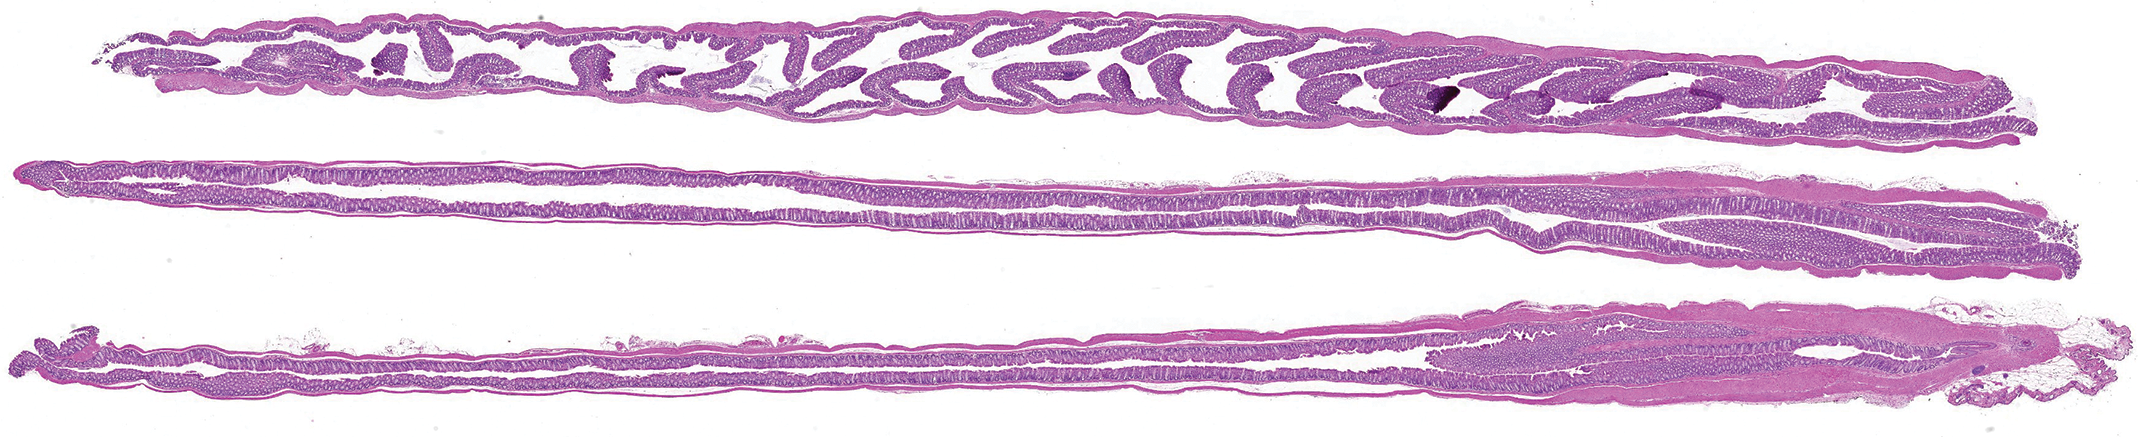
Entire colon of a naive mouse, cut in segments using the stretched colon technique; hematoxylin and eosin stain. Anorectal junction is located in the lower right corner.
The training slides were obtained retrospectively from 2 different DSS colitis studies, studies A and B. In both studies, animals were group-housed in a climate-controlled facility with a 12-hour light/dark cycle. Food and water were provided ad libitum. All the mice were identified with their number marked with an indelible marker on their tail and were randomly subdivided into different groups. In both studies, 3% DSS was administered in drinking water to C57BL/6 female mice for 7 days, with termination on day 8. On days 1, 3, 5, and 7, the DSS solution was freshly prepared by dissolving DSS (MP BioMedicals-02160110-90) in sterile water each day. Water was provided in bottles of approximately 110 mL, in which the DSS (when applicable) was mixed. The sippers from the bottles were verified twice daily to ensure that no obstruction to the flow was present. The vehicles administered were 0.5% methyl cellulose and 0.5% Tween80 for study A and 0.5% methyl cellulose and 0.025% Tween20 for study B. Both were mixed in ultrapure water and administered by oral gavage twice daily at 10 mL/kg. Cyclosporine A, which was used as a positive control, was administered by daily oral gavage at a dose of 80 mg/kg. The vehicle for CsA was 0.5% methyl cellulose in ultrapure water.
All animal procedures were conducted in accordance with the policies, guidelines, and recommendations of the Canadian Council for Animal Care and of the American Association of Laboratory Animal Care Guide for the Care and Use of Laboratory Animals and under approval from the Institutional Animal Care and Use Committee of Charles River Senneville.
Image Analysis Software and CNN Training
For CNN training and subsequent analysis, 29 slides were available from study A (6 naive, 13 vehicle-DSS, and 10 CsA-DSS) and 36 were available from study B (7 naive, 20 vehicle-DSS, and 9 CsA-DSS). The supervised training of the CNN was performed using the commercial Aiforia AI platform (version 4.7) deployed in a Microsoft Azure cloud environment using a browser-based user interface.
An initial CNN was trained on a subset of H&E slides (3 naive, 3 vehicle-DSS, and 1 DSS-CsA) from study A (initial training set). The CNN AI model design consisted of 3 nested individual AI models. The first (parent) AI model has 2 classes, colon tissue, and background capturing the entire colon tissue and excluding serosa, lumen, and rectoanal junction. The second AI model (child 1), operating on areas identified as colon tissue by the parent AI model, has 3 classes muscle, mucosa, and background. The muscle layer was comprised of the lamina muscularis mucosae and the tunica muscularis. For edema and inflammation between the submucosa and tunica muscularis, examples were included as background annotations to train the AI model to recognize E1 only in the appropriate compartment. The third AI model (child 2), operating on areas identified as mucosa by the preceding AI model, has 4 classes, normal mucosa, E1 acute inflammation/diseased mucosa, nonmucosa tissue, and background (Supplemental Figure 1C). The E1-identified areas were characterized by acute inflammation, crypt loss, and dilatation sometimes with mucosal ulceration and necrosis. The “nonmucosa tissue” class was created to identify gut-associated lymphoid tissue (GALT) for automatic exclusion from the analysis. The training procedure enabled the initiation of training on the entire model simultaneously; however, the component AI models were not dependent on each other until when used for analysis.
Manual training annotations were drawn, representing less than 5% of the colon surface (Supplemental Figure 1A), and AI models were trained iteratively. In addition, AI generated annotations were generated and adjusted by subsequent manual curation (Supplemental Figure 1B). Any analysis follows the AI model structure where the nested layers run in sequence (Supplemental Figure 1C).
After each training, an automatic comparison of the provided annotations with the AI model prediction in Aiforia as well as a visual qc by a veterinary pathologist (A.B./A.Z.) was performed. For the CNN segmentation to be deemed adequate upon visual qc, the region of interest (ROI) for each class had to be within the boundaries of the class and not overdrawn, and the pixels representative of a class had to be identified as such and be consistent with the training annotations.
Training annotations were incrementally improved by rank-ordering selected training regions according to decreasing verification error rates and correcting faulty annotations or by adding more training material. To add training material, a second training set from study A, composed of 2 naive, 4 vehicle-DSS, and 2 CsA-DSS, was added (Supplemental Figure 2). In addition, independent areas of the training slides were used to test the performance of the algorithm, and parts of nonconforming areas were chosen as new training regions to improve the algorithm generalization to new material. These additional annotations and training regions were used to improve the segmentation and the identification of each class. Different learning behavior and program parameter settings were also tested to find conditions that would visually seem to identify the correct histological patterns in the training data set (Summary of parameters changed from default values are listed in Supplementary Tables 1, 2, 3).
To test the AI model generated by this initial process, 8 randomly selected slides from study B (2 naive, 4 vehicle-DSS, and 2 CsA-DSS) processed at a different time were analyzed using the first version of the AI model. Clearly nonconcordant areas were then used to continue the development of the algorithm as above. To that end, slides from study B were divided into 2 sets, B1 and B2, in which a representative number of slides from each group was present. Set B1 was composed of 4 naive, 7 vehicle-DSS, and 3 CsA-DSS. Set B2 was selected to remain a separate test set. The test set B2 was comprised of 22 slides (3 naive, 13 vehicle-DSS, and 6 CsA-DSS), and no material from it was used at any stage of CNN training.
For additional CNN training, similarly to what was done with slides from study A, a portion of the available slides from set B1 was used for additional training and annotations in a third training set (2 naive, 4 vehicle-DSS, and 2 CsA-DSS). In total, 23 slides were used for training and annotations from both studies A and set B1 (Supplemental Figure 2). The number of training regions and annotations and the total area of annotations for each class are summarized in Supplementary Table 1. A similar visual qc was performed on the training sets, as well as the test set. Finally, the AI model used to produce the data within this article was frozen for version control and called “Bedard et al 2020a Colitis DSS v4.”
Statistical Analysis
To evaluate statistical significance, within each set (A, B1 and B2), E1 to mucosa ratios were compared between naive, vehicle-DSS, and CsA-DSS mice using SRS (CR MTL in house application built with SAS, version 1.4.12). Naive were compared to both vehicle-DSS and CsA-DSS, and vehicle-DSS were compared to CsA-DSS. Levene test was used to assess the homogeneity of group variances. Data sets were compared using an overall 1-way analysis of variance F test if Levene test was not significant or the Kruskal-Wallis test if it was. If the overall F test or Kruskal-Wallis test was found to be significant, then the above pairwise comparisons were conducted using a 2-sided t test or Wilcoxon rank sum test, respectively. Adjustments for multiplicity of tests were made based on the square root of the number of pairwise comparisons.
Data Set
Slides and complete WSI inference results of the final released AI model (CSS colitis v4) from study A and studies B1 and B2 are available for review at the following link: https://cloud.aiforia.com/usermanagement/addviewertogroup?urlguid=0883ade3-d0f6-4001-a381-3ad83c425e36. Self-registration password is “CSS_ColitisV4.” In order to view the results, follow the instructions for registration, then log in, select any slide available in the left hand side slide tray, click “Analyze,” and select the “Bedard et al 2020a Colitis DSS v4” analysis thumbnail.
Results
Once the initial training was performed on slides from study A, an automated and visual qc was performed. The trained CNN was generally able to segment, with a high level of concordance, the different tissue layers in all 3 groups of mice, and only few areas required improvement. For the colon layer, 2 types of errors were predominant. The overestimation of the ROI beyond the boundaries of the annotation and the training regions and the identification of the colon lumen as colon tissue were noted. In the mucosa and muscle layers, the segmentation was adequate, except for the lamina muscularis mucosae and the anus skin, which were often recognized as mucosa. The segmentation of the normal mucosa and GALT (nonmucosa tissue) was satisfactory. The E1 segmentation was adequate, except in areas with low density of cellular infiltrate, in which the algorithm didn’t properly identify these areas as part of colon tissue, and thus automatically excluded these from downstream muscle/mucosa and mucosa classes analysis. To improve segmentation quality, additional training annotations and areas of E1 and background areas were added to already existing slides from study A (second training set). Refinement of training algorithm parameters was performed, and light image augmentation was added. Image augmentation generally is used to improve generalization. Importantly, parameter refinement of the field of view and feature complexity was performed in order to find an acceptable compromise between pattern recognition context search area, computational burden, and level of detail. Following these additional steps, upon visual qc, the segmentation was deemed adequate for the training sets from study A.
A subsequent analysis was performed using 8 randomly selected slides from study B to check which types of histological findings or patterns possible were underrepresented in the limited training sets from study A and to determine the robustness of the algorithm and the potential generalization when transferring from one study set to another. As expected, the initial segmentation results were suboptimal, as there was overlap between different classes in areas previously well delineated in the initial training sets from study A and an incomplete identification of pixels in the muscle layer and in the colon tissue.
As described, to increase the performance of the algorithm in study B, the slides available were separated into 2 sets, B1 and B2. Additional training annotations and areas were added to a B1 training set and refinement of algorithm parameters was performed using the same strategy as above for study A training sets. Following these steps, the trained CNN was able to segment, with a high level of concordance, the different layers in all 3 groups of mice (Figures 2A and B, 3A and B, 4A and B) in set B1, upon visual quality assessment. Thus, the segmentation was deemed adequate for the training set B1 and the AI model version was frozen. The AI model was then considered completed based on the results from both study A and B1 training sets and suitable for analysis.
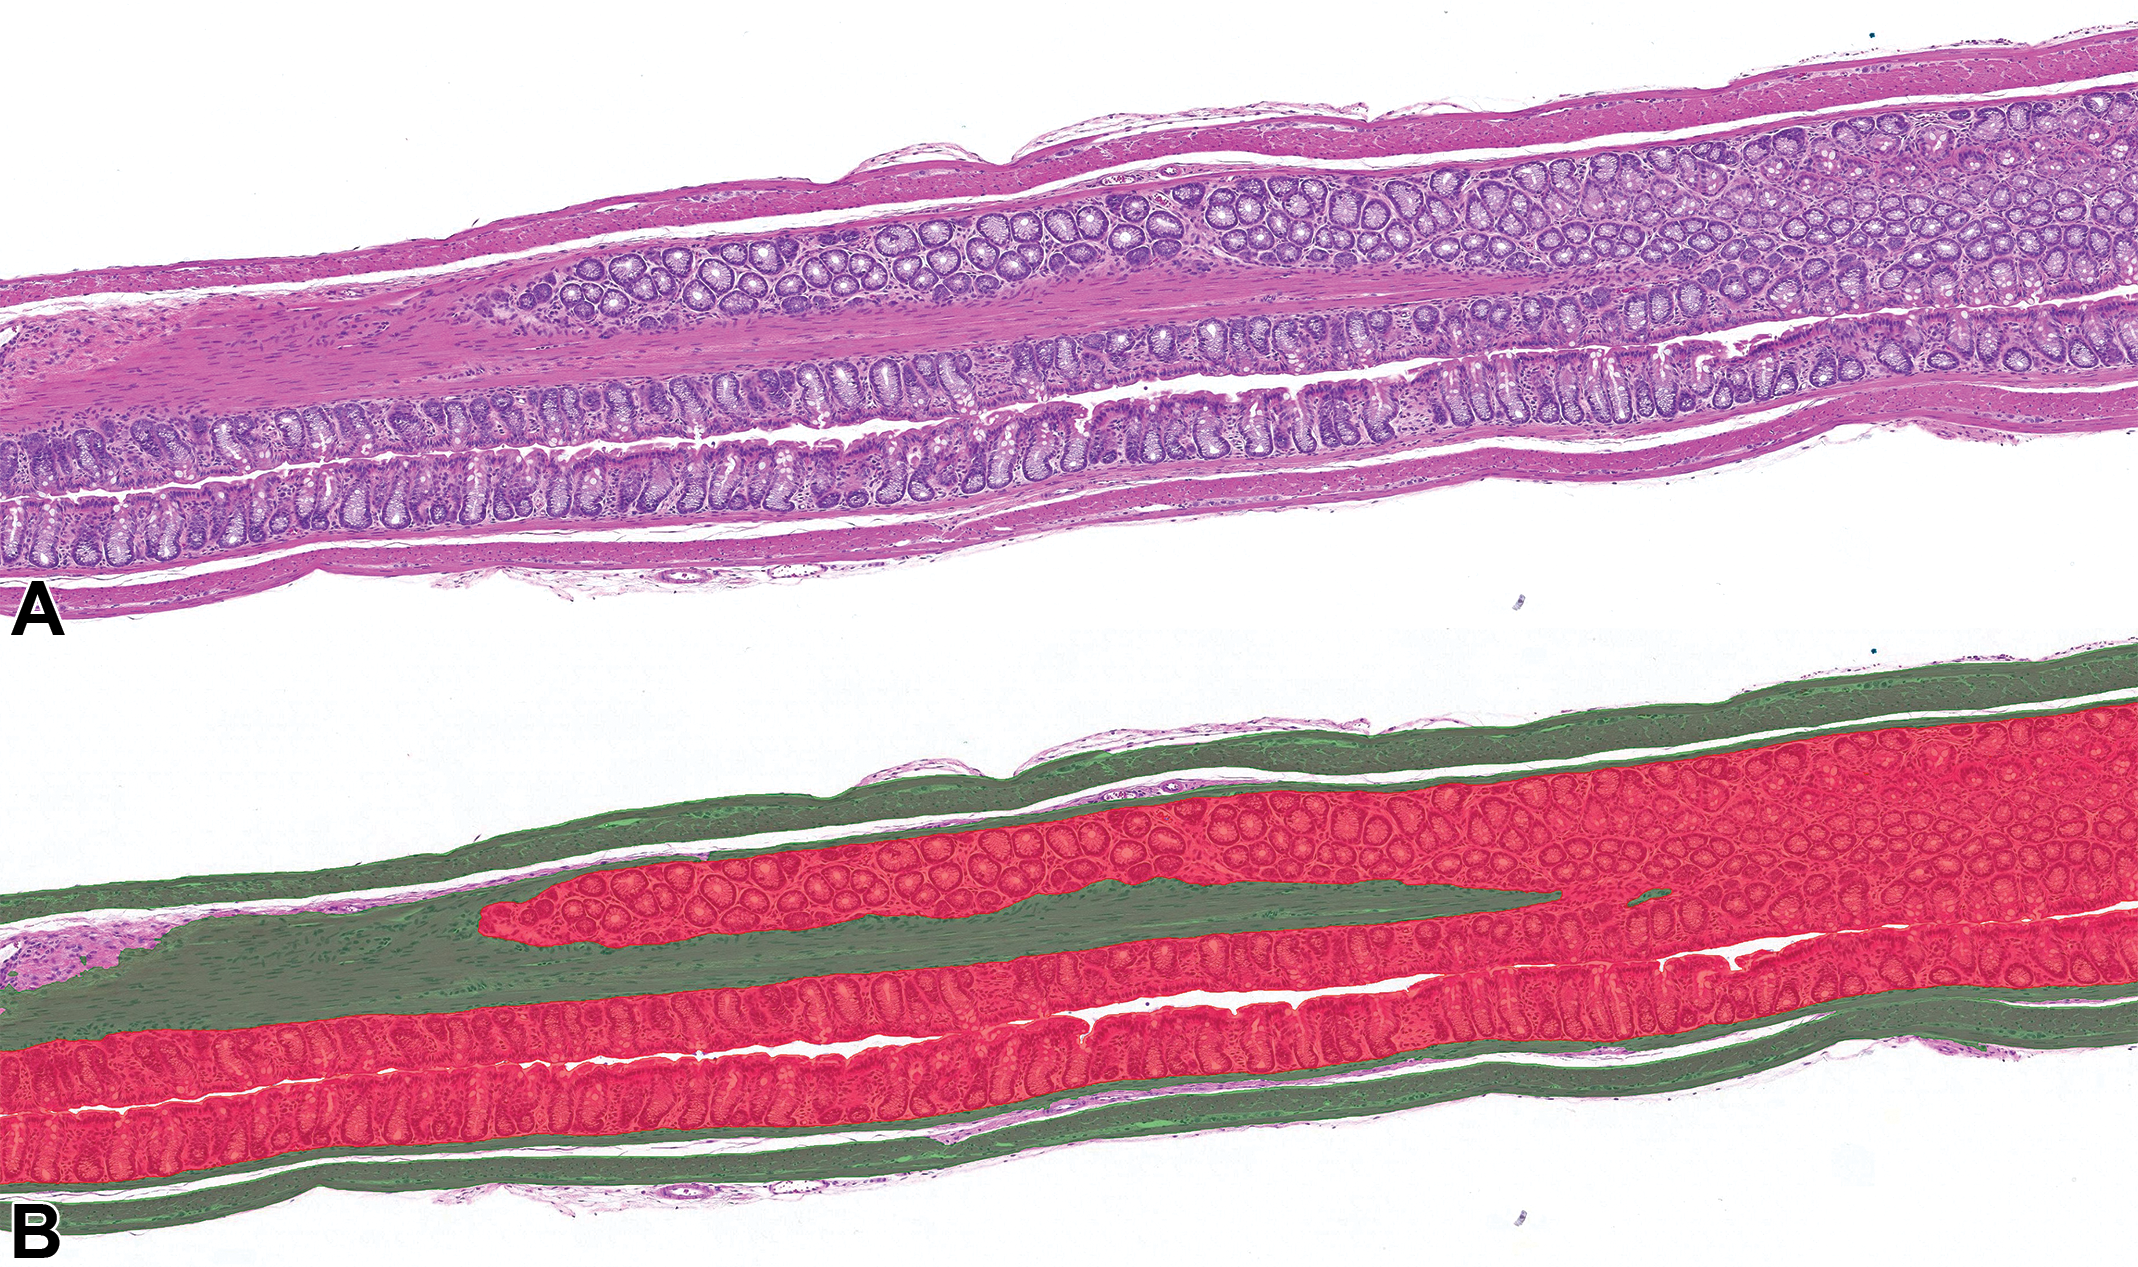
Mouse colon from a naive animal with normal muscle and mucosa layers. A, Original hematoxylin and eosin stain. B, Hematoxylin and eosin stain with digital overlay of AI model classification of muscle (green) and mucosa (red).
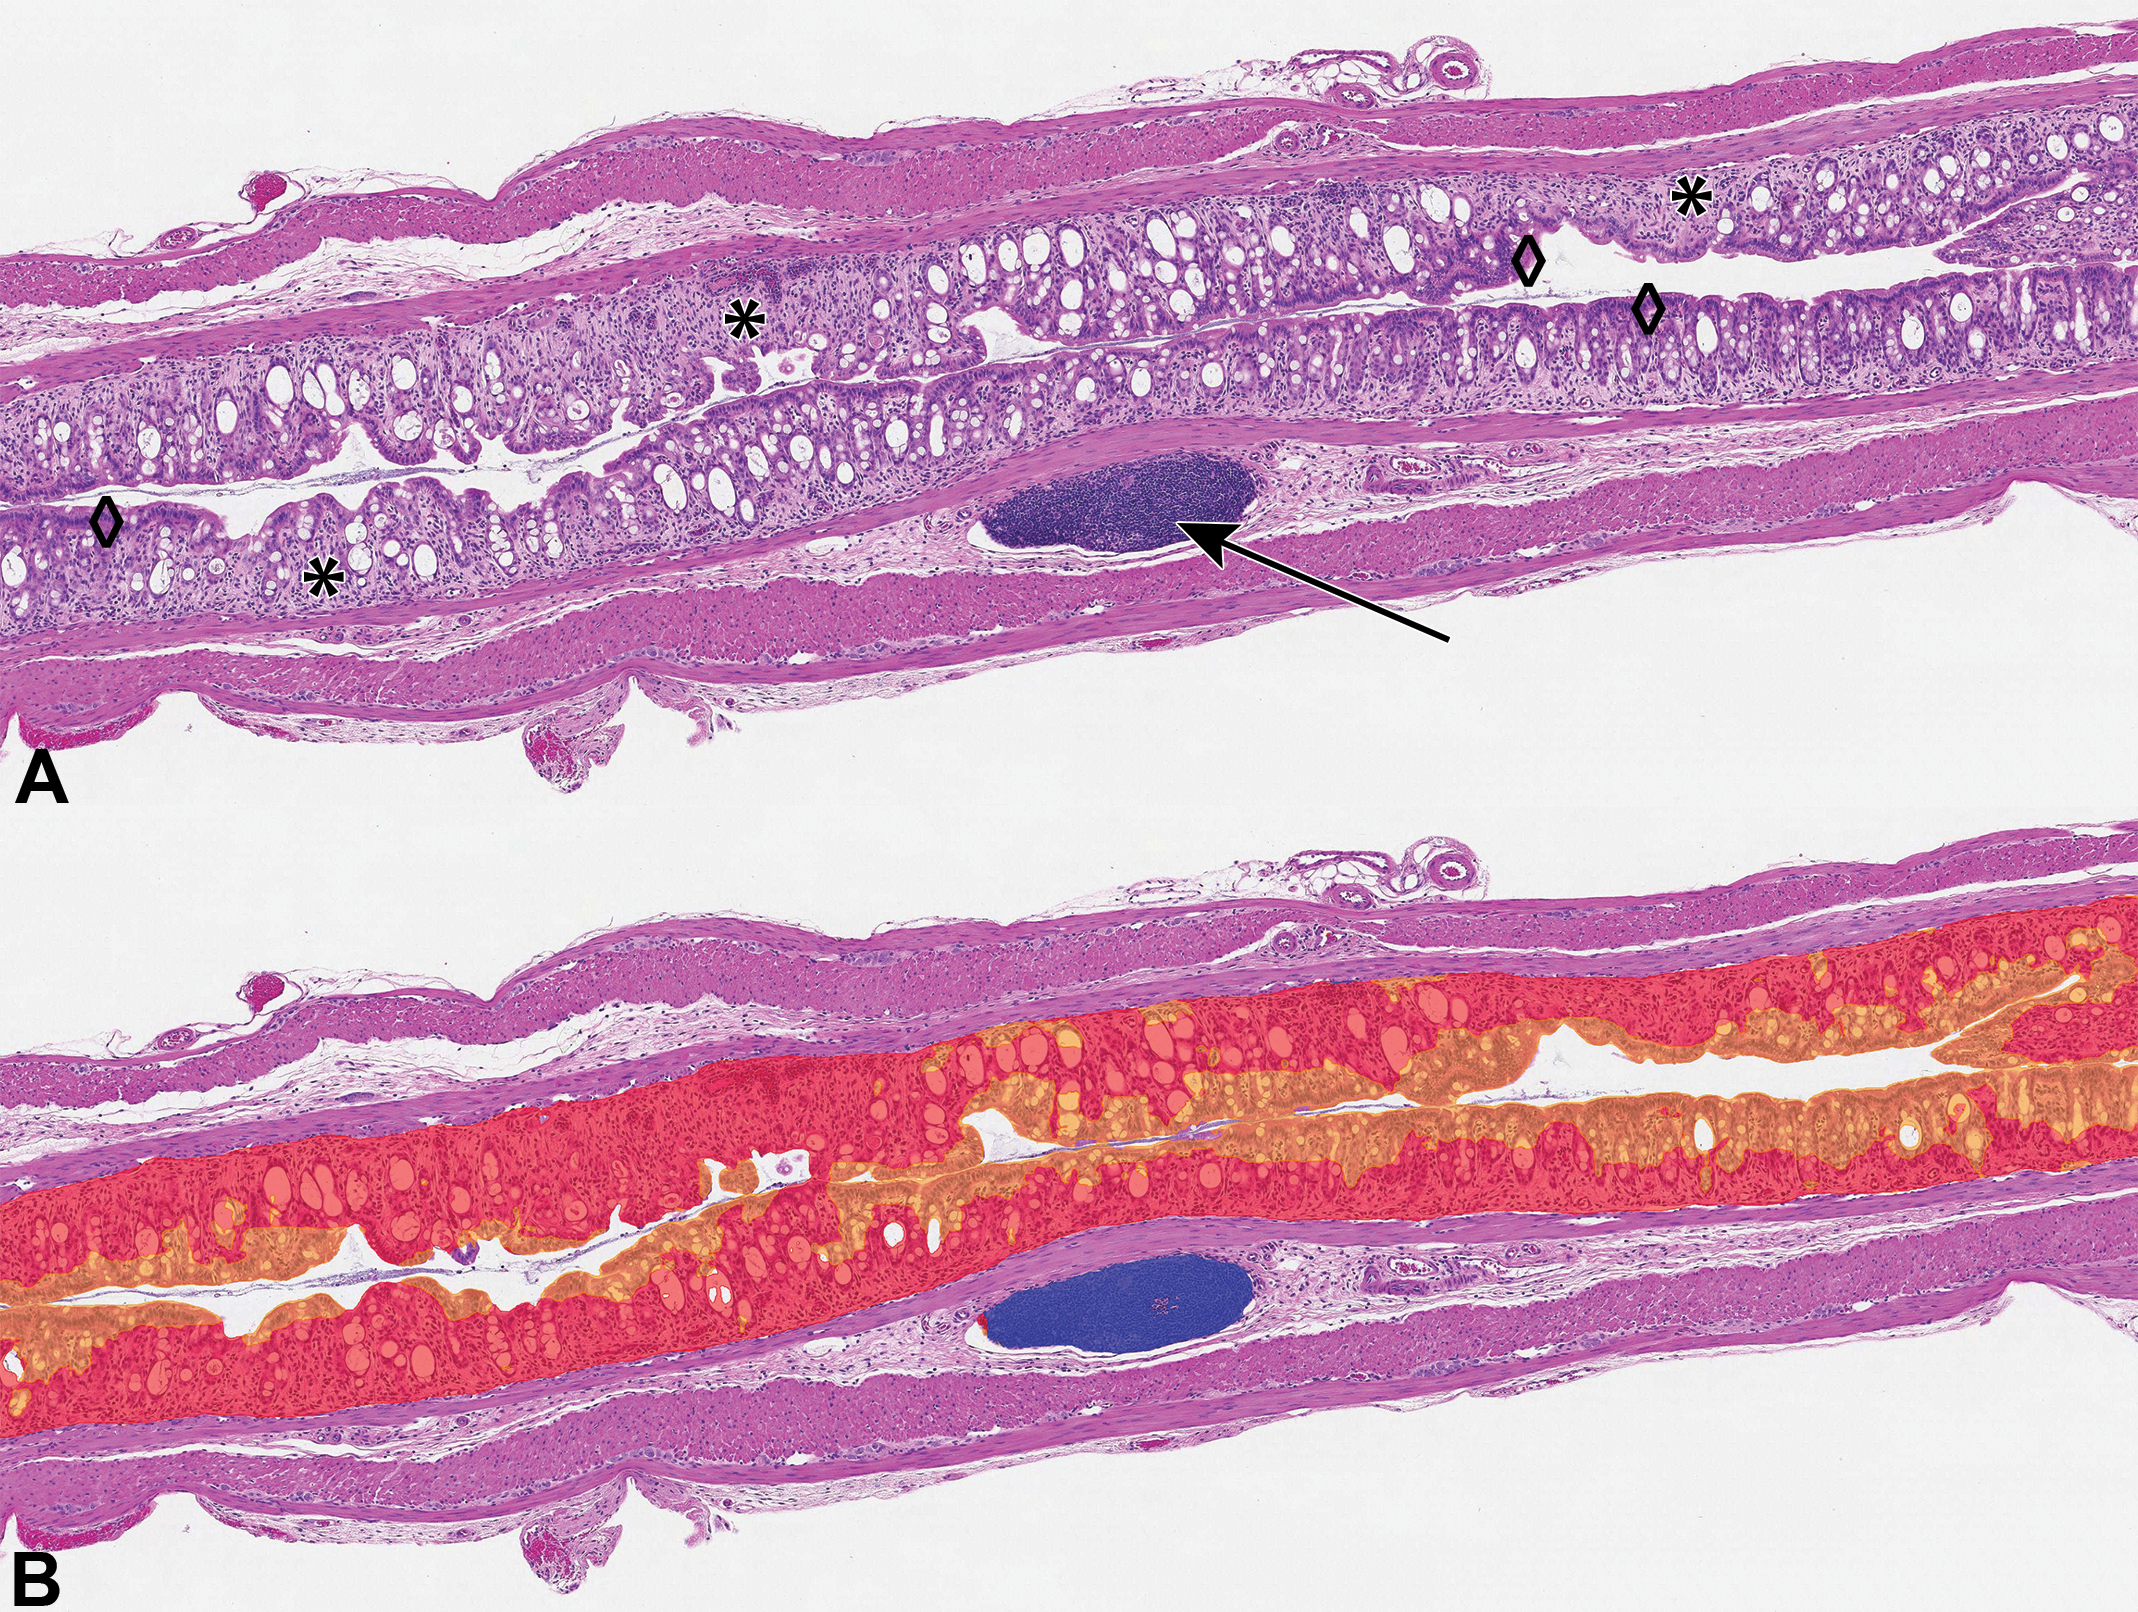
Mouse colon from a vehicle-dextran sulfate sodium animal with mucosal inflammation and crypt loss; hematoxylin and eosin (H&E) stain. A, Original H&E stain showing examples of gut-associated lymphoid tissue (GALT; arrow), E1 acute inflammation (asterisks), and normal mucosa (diamonds). B, Hematoxylin and eosin stain with digital overlay of AI model classification of E1 (acute inflammation, red), normal (orange) mucosa, and nonmucosa (GALT, blue).
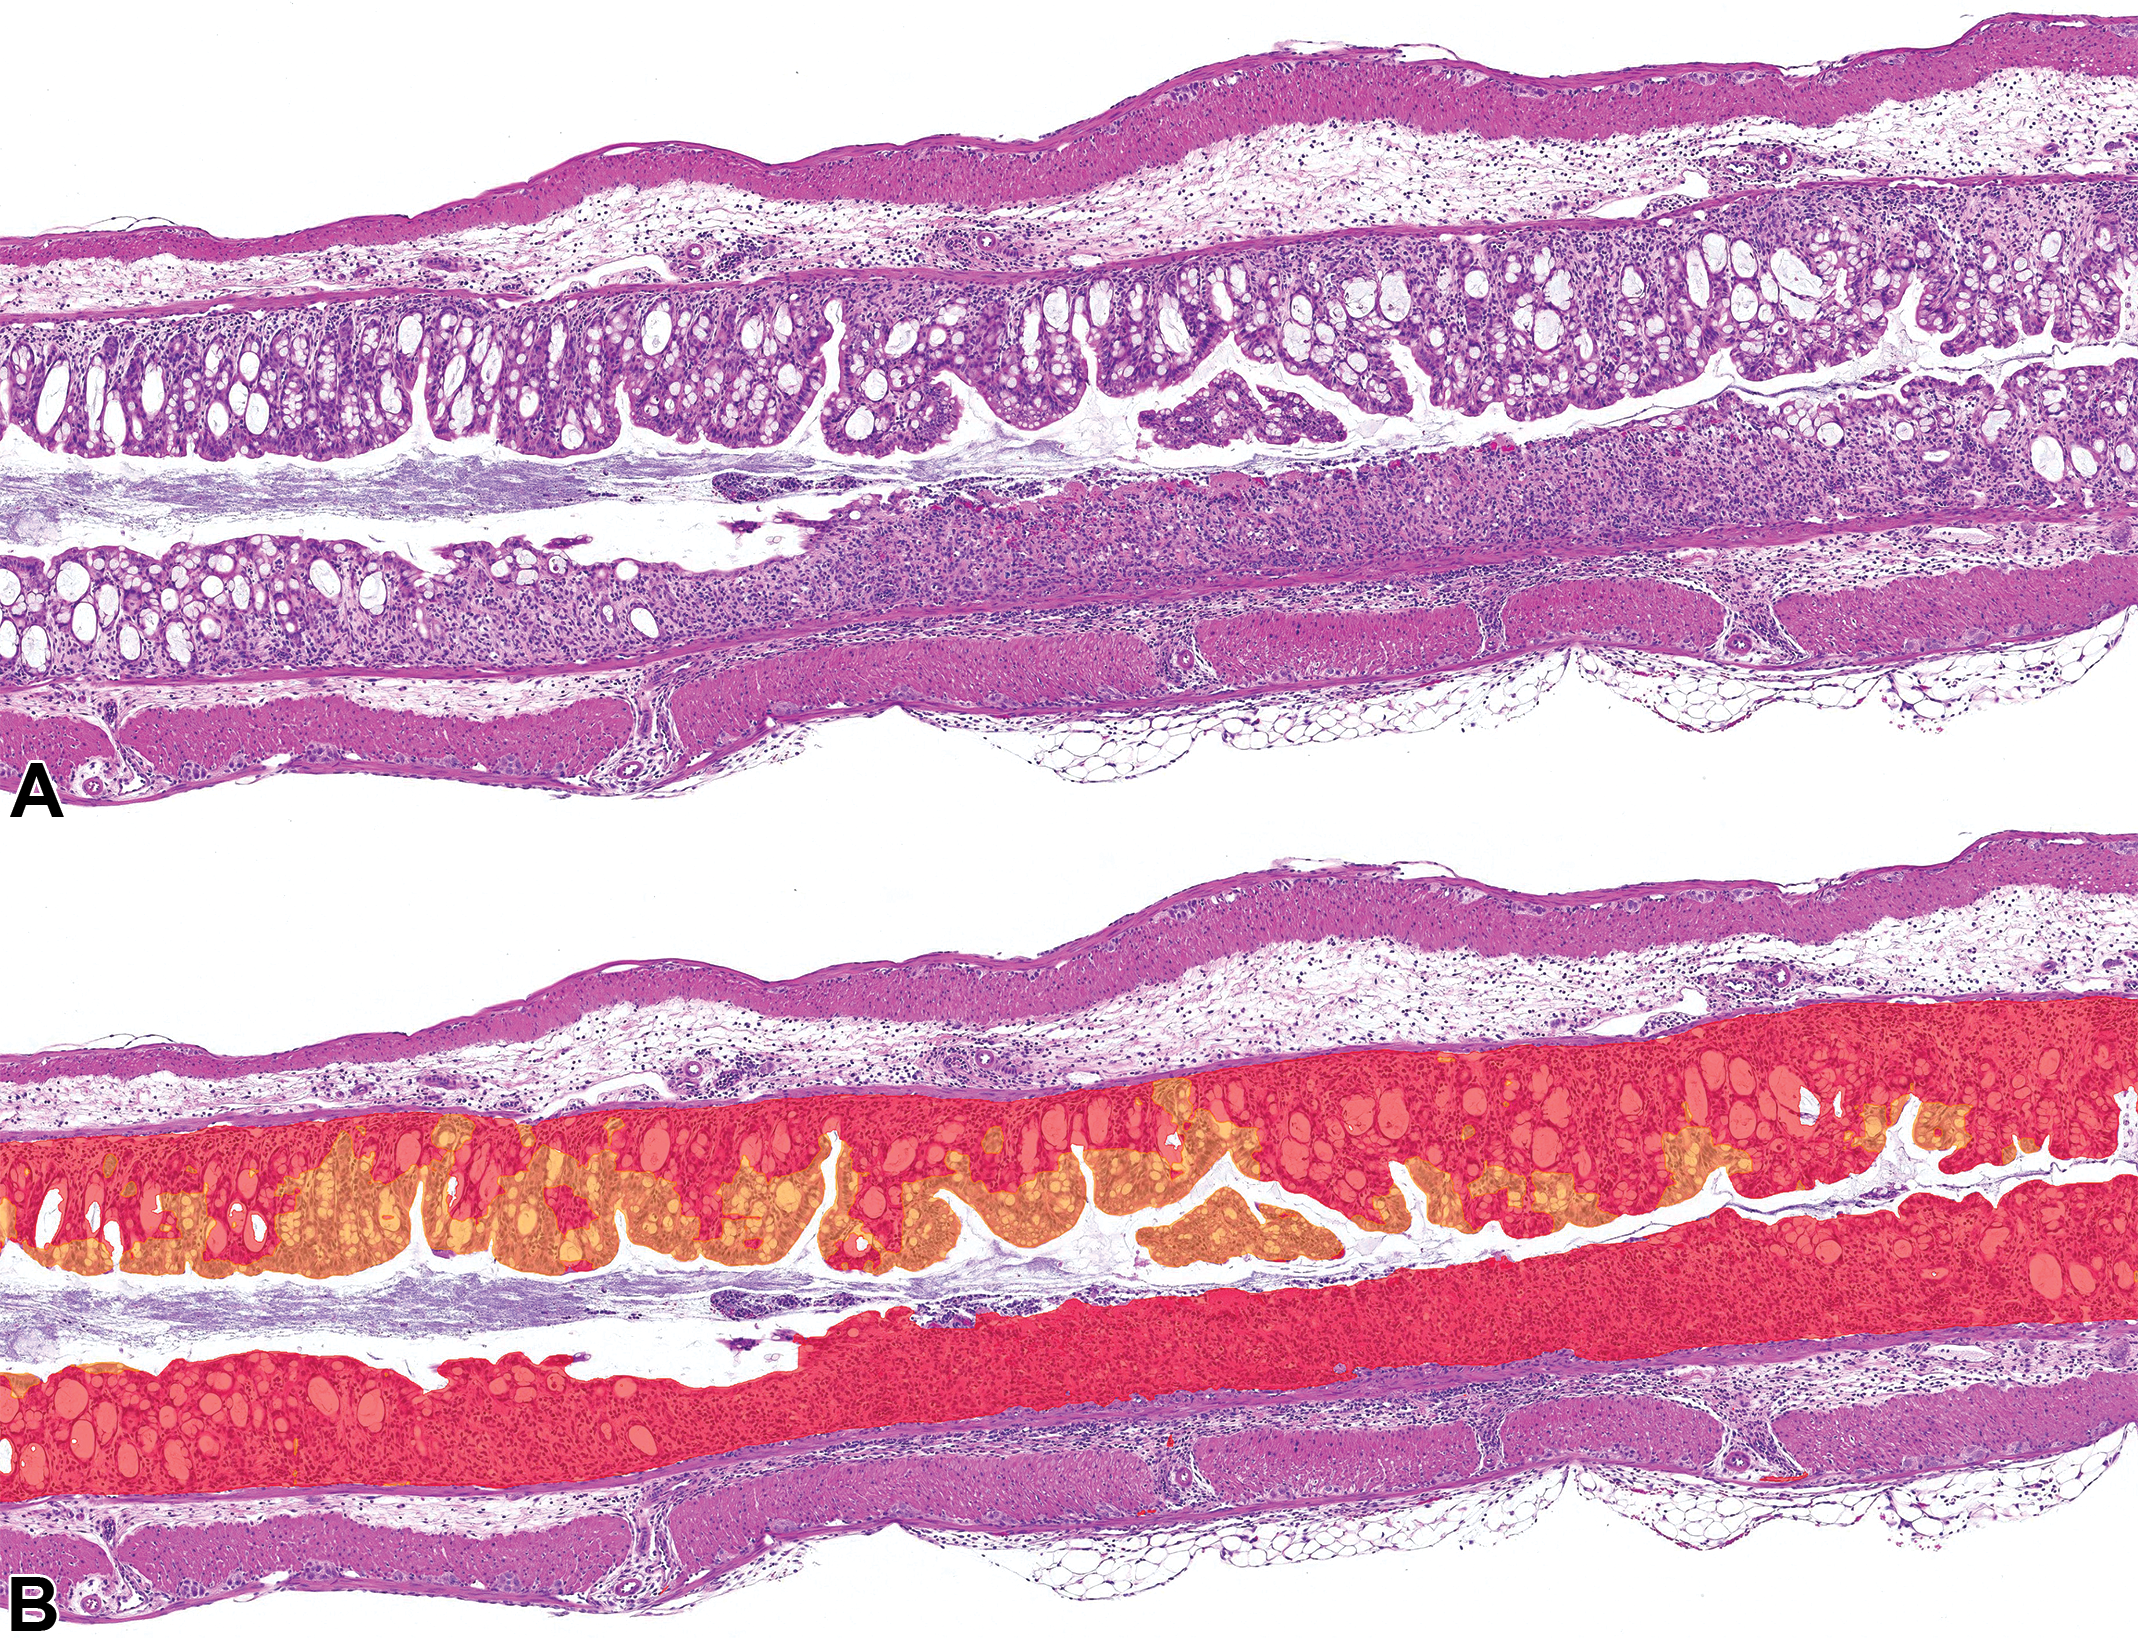
Mouse colon from a vehicle-dextran sulfate sodium animal with mucosal inflammation, crypt loss, and ulceration; hematoxylin and eosin (H&E) stain. A, Original H&E stain. B, Hematoxylin and eosin stain with digital overlay of AI model classification of E1 (acute inflammation, red) and normal (orange) mucosa layers.
The resulting AI model was then used to analyze all slides available from studies A, B1, and B2. In studies A and B1, slides analyzed were comprised of both the training slides, as previously described, and the remaining slides from each set, which were not used in any CNN training. In Study A, these remaining slides were comprised of 1 naive, 6 vehicle-DSS, and 7 CsA-DSS slides and in set B1 of 2 naive, 3 vehicle-DSS, and 1 CsA-DSS slides.
The results from study A showed a mean E1 to mucosa ratio of 28% in vehicle-DSS, a low E1 to mucosa ratio in naive (<1%), and a statistically significant reduction in the E1 to mucosa ratio in CsA-DSS in comparison to the vehicle-DSS (13% vs 28%). The results from set B1 showed a mean E1 to mucosa ratio of 33% in vehicle-DSS, a low E1 to mucosa ratio in naive (<1%) and a statistically significant reduction in the E1 to mucosa ratio in CsA-DSS in comparison to the vehicle-DSS (13% vs 33%). The results from set B2 showed a mean E1 to mucosa ratio of 32% in vehicle-DSS, a low E1 to mucosa ratio in naive (4%), and a statistically significant reduction in the E1 to mucosa ratio in CsA-DSS in comparison to the vehicle-DSS (5% vs 32%). In study A, and both B1 and B2 sets, E1 to mucosa ratio was statistically significantly higher in vehicle-DSS versus naive. The E1 to mucosa ratio between naive and CsA-DSS was only statistically different in study A. All results are presented in Table 1. For set B2, upon visual qc, the algorithm was found to adequately segment the various layers, thus suggestion generalization from the study sets to this one. For all slides’ sets, the results were consistent with the published data on 7 this model. In addition, the mean mucosa percentage in the entire section was comparable between the various groups and study sets. Last, mean analysis time for each slide from all 3 sets (A, B1, and B2) was of 42 seconds (range: 27-68 seconds, n = 63). All WSIs were analyzed as uploaded to the Aiforia platform without image adjustments or other manual interventions, for example, without excluding areas or drawing ROIs.
Summary of E1 and Mucosa Area Means in All Groups From Study A, and Sets B1 and B2.
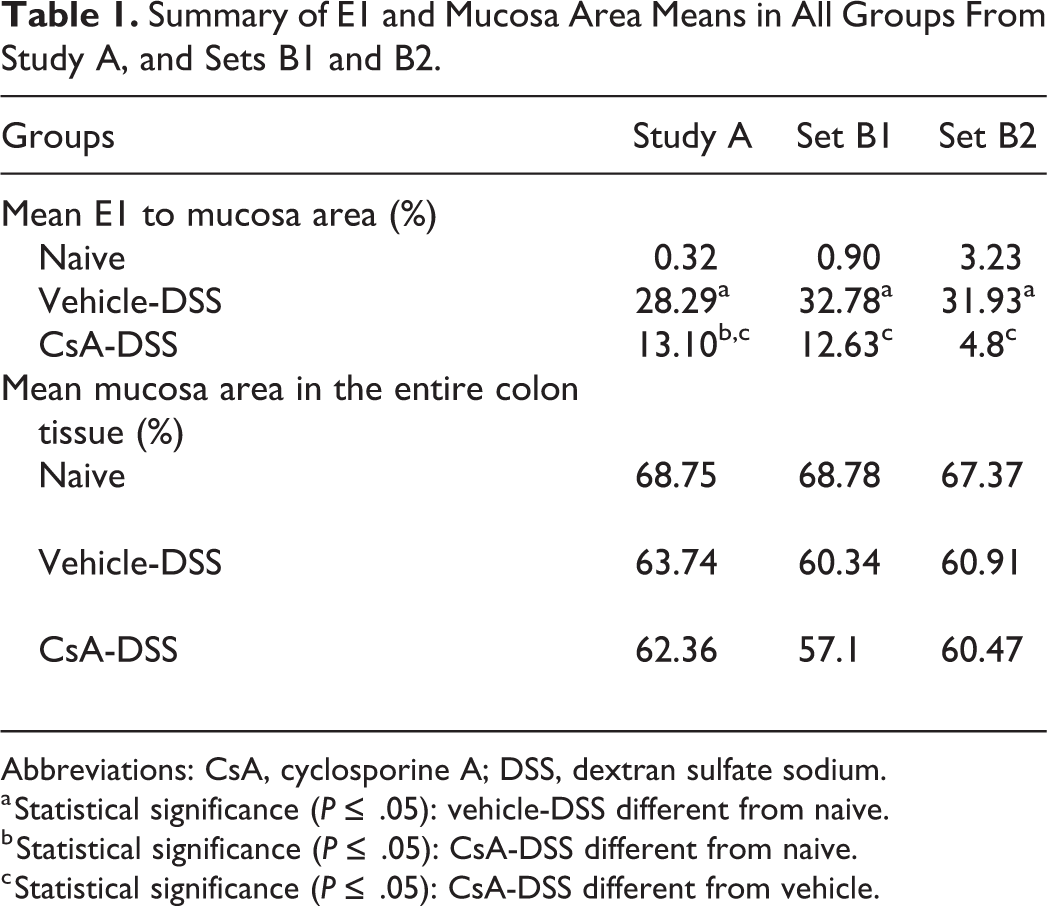
Abbreviations: CsA, cyclosporine A; DSS, dextran sulfate sodium.
a Statistical significance (P ≤ .05): vehicle-DSS different from naive.
b Statistical significance (P ≤ .05): CsA-DSS different from naive.
c Statistical significance (P ≤ .05): CsA-DSS different from vehicle.
Discussion
In the assessment of drug candidate efficacy in colitis models, including DSS-induced colitis, semiquantitative scoring of the colon by a veterinary pathologist is a primary end point. However, this scoring is highly subjective, intellectually tedious, and time-consuming. 8,9 The difficulty in scoring these studies is due to a variety of factors, including the segmental nature of the DSS-induced microscopic findings. Microscopic findings, ulceration, and inflammation have different regional severities. Ulceration and inflammation are most prominent in the middle portion of the colon. In the distal portion, ulceration is not as prominent, but inflammation is severe. Last, in the proximal portion, the inflammation and ulceration are generally very minimal. This report describes the training of a CNN to detect key microscopic features in specific colon layers in order to increase the efficiency and decrease the variability of microscopic scoring of DSS colitis, as part of screening of candidate compounds for IBD treatment.
Automated approaches to score colitis models, including DSS-induced colitis, have been previously reported using either immunohistochemical or H&E stains. 8,9 In our case, we wanted to rely solely on H&E-stained slides to be able to qualitatively compare to reported microscopic features and to aim to integrate the AI model in the preexistent workflow to assessing this model. The AI model was designed to detect diseased areas in the mucosa comprised of a variety of features such as loss of crypts, ulceration, and inflammation, but not only in severely affected areas. One of the challenges when semiquantitatively scoring slides from this model is scoring minimally to mildly diseased areas, when there are remaining crypts and in which the architecture is partially maintained. These areas are particularly prominent in CsA-treated mice, which are instrumental to assess efficacy of any candidate compound. With this algorithm, it was possible to correctly identify these areas and demonstrate statistically significant differences in CsA-treated mice in study A and independent test set B2. In addition, to accurately describe the disease process in the entire colon section, there was no exclusion of any tissue layers performed a priori, except for the lumen, rectoanal junction, and the edema/inflammation separating the submucosa and tunica muscularis in DSS-treated animals, which were trained as background to decrease confusion in the identification of the parent colon tissue layer by the algorithm. In this preliminary work, the trained CNN was able to successfully apply semantic segmentation and isolate the colon tissue, the muscle and mucosa layers, and the layers within the mucosa, which were E1 (acute inflammation/disease), normal, and nonmucosa tissue (GALT). The segmentation was performed with a high confidence level in all 3 groups of mice. When considering the mean time required to analyze the slides (42 seconds), which is significantly less than the reported time required by a pathologist, 7 the algorithm developed offers an alternative tool to semiquantitative scoring. This tool is not only faster but generates results that are better suited to statistical analysis in the context of small animal populations. The algorithm results also reflected the variability noted in the various groups, especially in the CsA-DSS. In the B2 study set, mean E1 to mucosa ratio in CsA-DSS was lower compared to studies A and B1, resulting in no statistical difference between naive and CsA-DSS. This was likely due to individual animals that had almost a complete resolution of DSS-induced microscopic findings upon visual qc. In set B1, the lack of difference between naive and CsA-DSS was likely attributable to variability and possibly the low number of CsA-DSS in this set, underlying the necessity for proper powering for statistical analysis. To be able to obtain the best parameters for the training of the CNN, choice of how to identify equivocal microscopic features was part of the training. The most important were areas in which the crypt density was decreased, and a slight infiltrate was present, which was often identified as E1 in naive mice. Biologically, the naive can’t present any E1 features, as they’re not exposed to DSS. However, it was recognized that in some areas, either due a slightly oblique sectioning plane and/or simply due to microscopic variation, the naive would present these equivocal areas. Since the affected percentage was low (<1%-3%) and qualitatively distinct from the other groups except for the B2-CsA which were previously discussed, this level of false-positive results would not significantly affect study outcomes and was judged acceptable. This approach was preferred, instead of trying to train the algorithm not to recognize them in naive, which could lead to confusion in segmentation criteria. In addition, crypt morphology was also deemed an equivocal feature. In the DSS model, when crypts are not lost entirely, dilatation is prominent. However, there is no consensus on a threshold to identify low-grade severity DSS-induced dilatation from biological variation, leading to possible overlap. Upon visual qc, it was noted that there were dilated crypt areas that were classified as normal that should have been preferably identified as E1. Since the E1 to mucosa ratios were statistically different between naive and vehicle-DSS in study A and sets B1 and B2, despite this overlap, it was decided not to do additional work at this time to try and correct the algorithm to avoid confusion in segmentation. In future work with this approach, refinement of both equivocal areas would be an improvement necessary to reflect more faithfully the expected results in these mice. Future improvements would also include additional training to completely exclude the rectoanal junction from being identified in one of the classes and training specifically for mucosa necrosis, which remains a rare feature and as such is not a strong differentiating feature.
The weakness of any automated image analysis method is the difficulty in generating methods that work in any situation and with variable data sets. This is especially true for deep learning CNN methods that depend on presented examples. Thus, the iterative approach adopted where additional study sets are introduced and the AI model is improved as needed provides a flexible protocol for AI model development, as incremental value can be derived while introducing continuous training. Our approach, starting with a minimal training set (8 slides only), and extending it to additional training sets, has the benefit of reducing the amount of work needed, as only features that are not of sufficient quality undergo additional training. Image analysis methods and histopathology CNNs can be very sensitive to discreet slide preparation and histological changes which are usually not considered important by a veterinary pathologist. Traditionally, this has been mitigated by extensive normalization of slides prior to analysis. Here, we have chosen to use the unique pattern recognition characteristics of CNNs to circumvent this preanalytical step and instead we trained the CNN to perform regardless of the differences. When comparing slides from studies A and B, the slides in study B (irrespective of B1 or B2 assignment) were slightly more basophilic and presented more sectioning, cutting, and staining artifacts than study A. In addition, necrosis of the superficial mucosa and submucosal edema was evident in this study set. This could explain the initial failure to generalize the algorithm from study A to study B without additional annotations. These changes would not be considered of importance to veterinary pathologists. Veterinary pathologists evaluate slides from a tissue perspective and can recognize and integrate artifacts and interstudy variation in their evaluation. However, it’s important to understand that CNNs can only recognize the tissue appearances they are trained for. In cases like this one, since the CNN was not exposed to these areas, it was unable at first to generalize adequately due to slight appearance variation, yielding suboptimal results. With the addition of specific training annotations integrated into set B1 and with extensive work to adapt the training parameters to better represent this slide set, the segmentation was improved and was considered adequate. As discussed above, when using CNNs, 2 approaches can be used. In the present case, the choice for the initial approach to use a limited number of slides from one study only, with the expectation to add additional variability in the form of additional training sets, resulted in additional annotations and retraining to obtain an adequate generalization. The other approach would be a start with a large data set covering a wide variety of preanalytical conditions, in the hope of generating a fully generalizable model. The poor ability to predict the amount of training data required makes this approach challenging, as well as more laborious as the effort would necessarily include a large amount of redundant material that does not contribute to accuracy or generalizability of the AI model. Rather the incremental approach seems to be efficient when used as a pathologist support tool. In addition, at the stage when sufficient training material has been amassed through practical usage, the result would be indistinguishable from the large training set approach.
We recognize that the work presented in the report is an initial approach in using this CNN to assess efficacy in the DSS colitis model using the stretched colon technique and will require optimization. Further steps such as additional independent slides sets and an increased number of slides, establishment of a workflow, statistical correlation between semiquantitative scoring and algorithm-generated data, validation using external validators, and correlation testing with semiquantitative scoring will be required to optimize the model. These additional steps will help determine whether the algorithm can be transferred to slides from different studies with a limited amount of work, suggesting the robustness of the algorithm or whether reoptimization will be required.
In conclusion, a CNN was developed and trained to identify key microscopic features in the mouse model of DSS colitis using H&E slides only as a proof-of-concept method. The results obtained using the CNN were consistent with the expected response with the model, suggesting it could segment and identify correctly key microscopic features of the DSS colitis model. With further optimization, this image analysis approach could be used as a tool to increase efficiency, provide quantitative data, and decrease variability, subjectivity, and time, as part of screening of candidate compounds for IBD treatment candidates.
Supplemental Material
Supplemental Material, sj-docx-1-tpx-10.1177_0192623320987804 - Proof of Concept for a Deep Learning Algorithm for Identification and Quantification of Key Microscopic Features in the Murine Model of DSS-Induced Colitis
Supplemental Material, sj-docx-1-tpx-10.1177_0192623320987804 for Proof of Concept for a Deep Learning Algorithm for Identification and Quantification of Key Microscopic Features in the Murine Model of DSS-Induced Colitis by Agathe Bédard, Thomas Westerling-Bui and Aleksandra Zuraw in Toxicologic Pathology
Supplemental Material
Supplemental Material, sj-docx-2-tpx-10.1177_0192623320987804 - Proof of Concept for a Deep Learning Algorithm for Identification and Quantification of Key Microscopic Features in the Murine Model of DSS-Induced Colitis
Supplemental Material, sj-docx-2-tpx-10.1177_0192623320987804 for Proof of Concept for a Deep Learning Algorithm for Identification and Quantification of Key Microscopic Features in the Murine Model of DSS-Induced Colitis by Agathe Bédard, Thomas Westerling-Bui and Aleksandra Zuraw in Toxicologic Pathology
Supplemental Material
Supplemental Material, sj-tif-1-tpx-10.1177_0192623320987804 - Proof of Concept for a Deep Learning Algorithm for Identification and Quantification of Key Microscopic Features in the Murine Model of DSS-Induced Colitis
Supplemental Material, sj-tif-1-tpx-10.1177_0192623320987804 for Proof of Concept for a Deep Learning Algorithm for Identification and Quantification of Key Microscopic Features in the Murine Model of DSS-Induced Colitis by Agathe Bédard, Thomas Westerling-Bui and Aleksandra Zuraw in Toxicologic Pathology
Supplemental Material
Supplemental Material, sj-tif-2-tpx-10.1177_0192623320987804 - Proof of Concept for a Deep Learning Algorithm for Identification and Quantification of Key Microscopic Features in the Murine Model of DSS-Induced Colitis
Supplemental Material, sj-tif-2-tpx-10.1177_0192623320987804 for Proof of Concept for a Deep Learning Algorithm for Identification and Quantification of Key Microscopic Features in the Murine Model of DSS-Induced Colitis by Agathe Bédard, Thomas Westerling-Bui and Aleksandra Zuraw in Toxicologic Pathology
Footnotes
Acknowledgments
The authors would like to thank the histology and necropsy staff in Montreal and Mary Kam for their help, as well as Martin Guillot and Marie-Ève Limoges for statistical support.
Declaration of Conflicting Interests
The author(s) declared the following potential conflicts of interest with respect to the research, authorship, and/or publication of this article: Thomas Westerling-Bui is an employee of Aiforia Inc and holds equity interest in Aiforia Technologies LTD.
Funding
The author(s) received no financial support for the research, authorship, and/or publication of this article.
Supplemental Material
Supplemental material for this article is available online.
References
Supplementary Material
Please find the following supplemental material available below.
For Open Access articles published under a Creative Commons License, all supplemental material carries the same license as the article it is associated with.
For non-Open Access articles published, all supplemental material carries a non-exclusive license, and permission requests for re-use of supplemental material or any part of supplemental material shall be sent directly to the copyright owner as specified in the copyright notice associated with the article.