
Abstract
Digital tissue image analysis is a computational method for analyzing whole-slide images and extracting large, complex, and quantitative data sets. However, as with any analysis method, the quality of generated results is dependent on a well-designed quality control system for the entire digital pathology workflow. Such system requires clear procedural controls, appropriate user training, and involvement of specialists to oversee key steps of the workflow. The toxicologic pathologist is responsible for reporting data obtained by digital image analysis and therefore needs to ensure that it is correct. To accomplish that, they must understand the main parameters of the quality control system and should play an integral part in its conception and implementation. This manuscript describes the most common digital tissue image analysis end points and potential sources of analysis errors. In addition, it outlines recommended approaches for ensuring quality and correctness of results for both classical and machine-learning based image analysis solutions, as adapted from a recently proposed Food and Drug Administration regulatory framework for modifications to artificial intelligence/machine learning-based software as a medical device. These approaches are beneficial for any type of toxicopathologic study which uses the described end points and can be adjusted based on the intended use of the image analysis solution.
Keywords
Introduction
Digital tissue image analysis is a powerful computational method for extracting quantitative data from whole-slide images (WSIs) of tissue by means of computer algorithms. These algorithms can be generalizable and potentially applied to multiple images at the same time, enabling high-throughput analysis.
A number of commercial and open source image analysis software systems using classical hardcoded parameters have been available for several decades 1,2 and have proven to be very useful for routine image analysis. Alternatively, some service providers and end users are generating in-house analysis software to fit their specific needs. Due to the recent advent of increased computational power through dedicated graphics processing units and their ability to handle large amounts of image data, artificial intelligence (AI) including machine learning (ML) approaches have seen a renaissance. Either approach (hard-coded algorithms or ML-based approaches) can yield high-throughput analysis workflows. To ensure high-quality data, the pathologist should be involved not only in the study and algorithm design but also in the quality control (QC) of image analysis results. To this end, it is important that the pathologist is aware of the capabilities and limitations of the image analysis strategy used and the potential impact of every step of the workflow on the result quality. This includes the influence of preanalytical variables on the quality of tissue and its WSIs, as well as the potentiation of quality issues when multiple parameters of the tissue are assessed simultaneously, resulting in complex image analysis solutions.
As each task along the digital analysis workflow may introduce bias and analysis errors, the close collaboration of image analysis team members, that is, pathology technical staff, pathologists, and other key scientists, is critical in generating high-quality results. However, regardless of the image analysis method used, pathologists remain the key content experts responsible for the reliability of the generated tissue-based data and should therefore oversee the QC process as an integral part of the digital pathology workflow. 3,4 This manuscript describes factors that can affect image analysis performance and presents a compilation of different approaches that, based on the intended use, can be applied to QC of image analysis results for both classical and ML-based image analysis solutions used in toxicologic pathology.
Factors Impacting Digital Tissue Image Analysis and Mitigation Strategies
Digital tissue image analysis requires training a computer software system to detect certain tissue objects based on color, size, shape, and/or other characteristics. Its performance can be handicapped by various slide based preanalytical variables (tissue or staining artifacts), scanner performance issues (poor WSI quality or inaccurate WSI metadata), and erroneous analysis design (bias introduced during the analysis or inadequate image data sets).
Preanalytical Slide and WSI Variables
An important prerequisite for accurate interpretation of WSIs is an accurate focal plane. Lack of focus may result from the focal plane of the scanner being displaced by just a few micrometers. Other preanalytical variables, such as inconsistent staining and low color contrast, tissue folds and tears, air bubbles and particles, and inconsistent WSI illumination and scanning lines, even when produced by changes greater in magnitude than the focal plane, can be compensated by the pathologist’s ability to “read through” them during their qualitative assessment. Therefore, while these variables are deemed less important for a WSI evaluation by a human observer, to provide fully quantitative, automated measurements, tissue trimming, processing, sectioning, staining, and mounting must all be held to a higher standard. 5
Tissue cracks and folds can be inaccurately assessed as an abnormality by the computer software (Figure 1). Either the algorithm needs to be trained to ignore these artifacts or they should be manually excluded from the analysis. Consistent and high-quality tissue staining is particularly important when color is the main criterion for object classification, which is often the case in classical image analysis approaches. The variability in immunohistochemical (IHC) staining between slides can lead to inaccurate classification of cells depending on the intensity threshold setting for analysis. This becomes especially apparent when slides stained at different laboratories are included in the analysis. To ensure that the impact of staining variability is taken into consideration for a project, it is recommended to perform staining QC prior to algorithm development and to choose an image analysis method which is designed optimally for the given staining distribution. However, if the staining variability is too high and the sample size is too small to adequately absorb the variability, the data set may not be suitable for either classical or ML-based image analysis approaches. Samples that fail staining QC should be excluded from the study. Scanning artifacts caused by improperly calibrated whole slide scanner can confuse image analysis algorithms (Figure 2) and the inadequately illuminated slides should be rescanned before the analysis is performed.
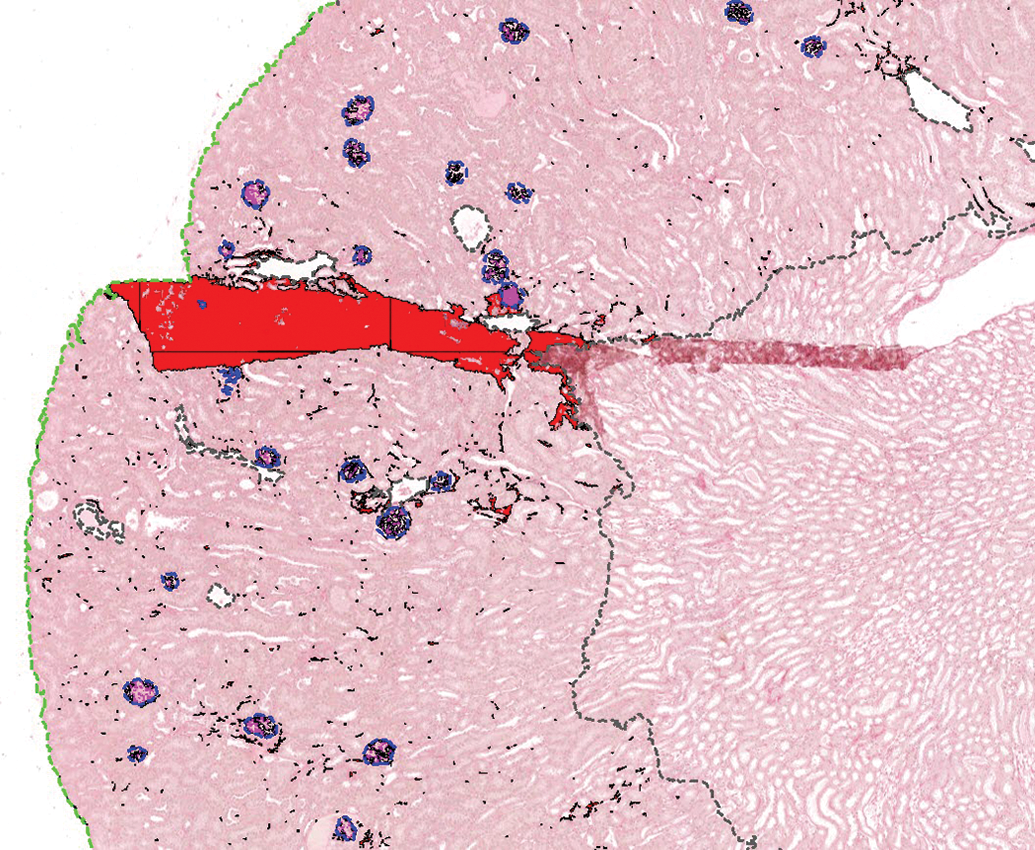
Mouse kidney stained with picrosirius red. The fold in the ROI was incorrectly classified by a custom color deconvolution algorithm as tubulointerstitial fibrosis (red). The cortex (in between green dotted lines) and the glomeruli (blue outline with glomerular sclerosis marked in pink) were segmented using a convolutional neural network. ROI indicates regions of interest.
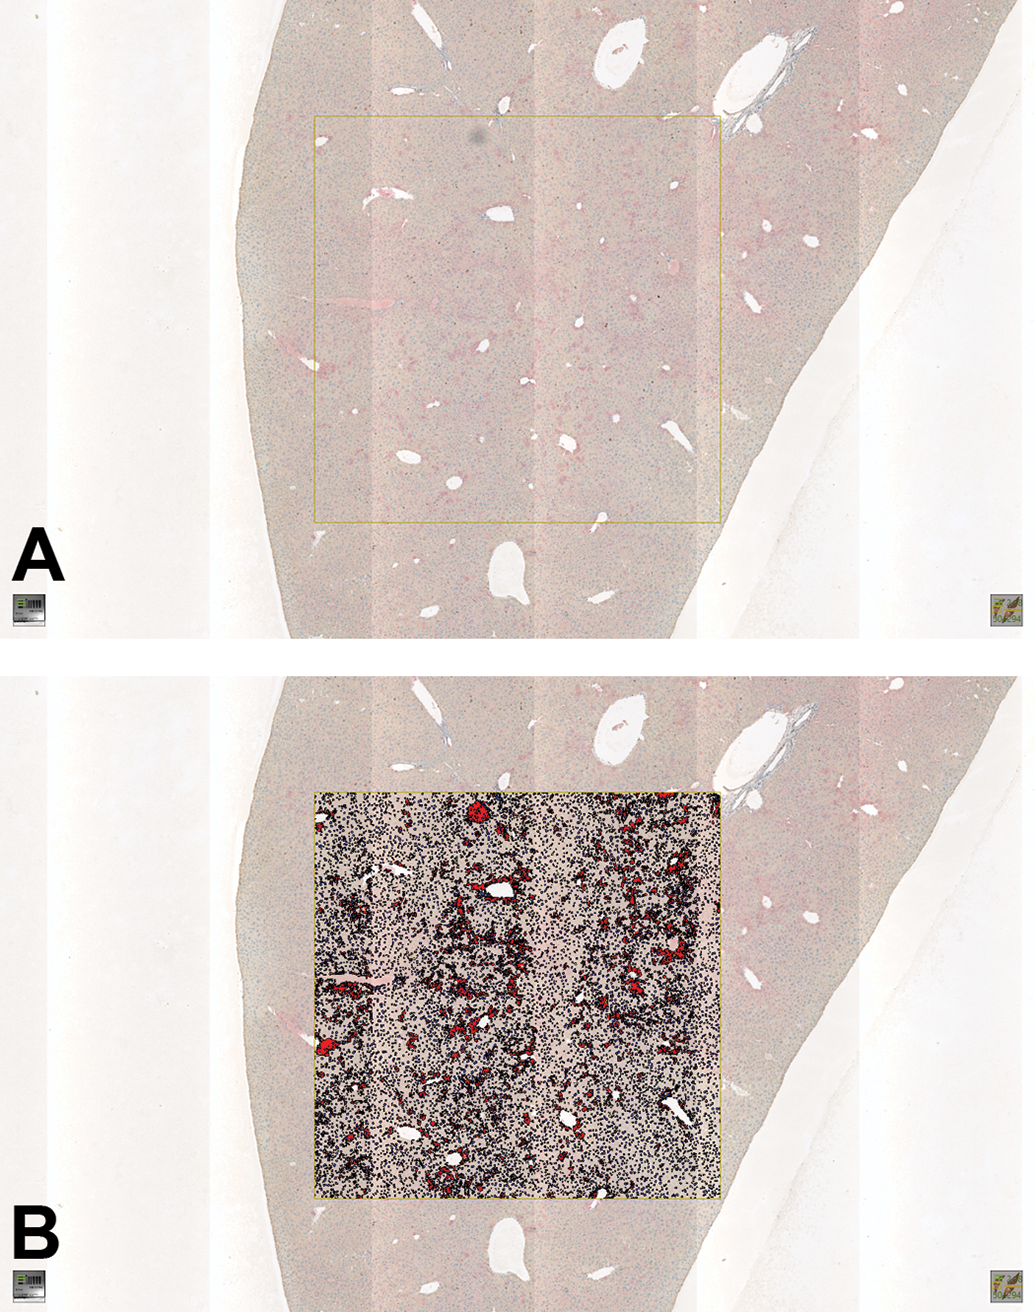
A, WSI of a mouse liver IHC stained with Ki67 with scanning line artifact caused by improperly calibrated whole slide scanner and a dust particle (upper edge of the yellow rectangle). B, Image analysis-based Ki67 detection underestimating the Ki67 positive cells (red) within the analyzed tissue area (yellow rectangle) due to the strongly illuminated scanning lines causing increased intensity of the Ki67 positive cells in these areas and overestimating the number of Ki67 positive cells in the localization of the dust particle (upper edge of the yellow rectangle). IHC indicates immunohistochemical; WSI, whole-slide image.
Quality control of image analysis overlays (also known as “markups”) can aid in detecting and addressing some of the effects of preanalytical variables. However, the human eye is limited in its ability to detect quantitative changes and is subject to various visual and cognitive traps that may impact the pathologist’s ability to effectively visually perform the image analysis results of QC. 6 It is important to be aware of them before starting any image analysis work. Nevertheless, despite these challenges, through their training and specialty expertise pathologists are uniquely qualified to gauge the impact of these factors on image analysis results.
Bias
The quality of image analysis data is also affected by the level of bias introduced during the analysis. Bias can influence many stages of the study. Some of the most common types of bias that affect image analysis are sampling bias and geometric bias. 7 Sampling bias can be introduced at several stages of the image analysis process. For example, the way tissues are sampled at necropsy and subsampled at trimming can introduce bias by selecting for certain areas over others within the tissue. This is most important for tissues that are heterogenous not homogeneous, such as the brain. This bias can be minimized by evaluating several sections of the tissue or area of interest. Sampling bias can also be introduced when selecting regions of interest (ROIs) for analysis, as the user may subconsciously choose areas with a higher density of the object of interest. This user bias can be prevented by eliminating the need to select ROIs in the first place and evaluating the entire WSI, or by allowing the computer to randomly choose ROIs for analysis.
Geometrical bias occurs in all 2-dimensional (2D) samples, as the size, shape, and orientation of the original objects are not preserved. This is a particular issue for total cell counts, as counting 2D profiles is not an accurate estimate of cell number. 8 This bias can be partially controlled by step sectioning procedures; however, it cannot be completely overcome without performing stereology. 9 The intended use of the data is important in determining if a 2D or 3-dimensional (3D) evaluation is necessary.
Image Data Set Composition
The importance of the quality of the image data set and its annotations for algorithm development cannot be overstated, especially in the ML-based approaches. Although pathologist-independent ground truth generation (eg, by destaining hematoxylin and eosin (H&E) sections and later restaining them with IHC specific for the structures of interest
10,11
) is possible and would be preferable for algorithm training and testing, great number of image analysis projects still rely on manual annotations for ML-solution development. Several parameters should be considered when a WSI/annotation data bank for algorithms training is developed: The experts diagnosing the samples or annotating the tissue should be highly qualified and adequately trained to be able to annotate the ground truth. Each diagnosis or label should ideally be based on standardized criteria (International Harmonization of Nomenclature and Diagnostic Criteria [INHAND]) and/or a consensus of several qualified pathologists to reduce individual bias and capture interobserver variability.
12
–15
Images should ideally include the full range of potential staining variations anticipated for the project/tissue/stain. If additional variation is later encountered (eg, staining performed by a different laboratory shows more variability), the final algorithm may require additional training to accommodate for this. If possible, a “look-alike” category of annotations/labels (explained below) should be a part of the algorithm development to increase the accuracy of the final algorithm.
The integration of look-alikes or algorithm-aided data set augmentation approaches increases the quality of the data set. 16 –18 Look-alikes or hard-negative structures are structures that are highly similar to the structures of interest but should not be detected as such. Their annotation and integration in the algorithm training significantly increase the robustness of the final algorithm.
Aspects to Consider Before Starting Digital Tissue Image Analysis
Digital tissue image analysis can be a powerful tool when utilized appropriately. But as with any methodology, it may not always be the right choice to answer every scientific question. Aside from considerations around its ability to generate meaningful data to answer the specific question, other factors should be considered prior to launching a project. These include, but are not limited to, the availability of the appropriate test materials (eg, a specific tissue type or stain, sufficient number of samples, appropriate sampling strategy); the right analytical tools (ie, can the software that is available analyze the samples in the way necessary for this project); trained personnel to perform analysis tasks; and sufficient time to undertake the project (ie, some timelines may not allow for algorithm development and some questions may be answered more quickly via a manual slide evaluation).
Once these basic considerations have been met, it is important to tailor the image analysis approach to the scientific question or intended use, both in terms of choosing software, algorithms, and end points, as well as in designing an appropriate QC strategy. As a general concept, a high-level question can usually be answered with a rather simple algorithm approach in a short period of time. More detailed tissue interrogations may require more specialized tools, in-depth algorithm development, rigorous QC, and a significant amount of time. However, just because an algorithm approach is deemed, “straight forward” does not mean it should not undergo a rigorous QC as well. While the details of algorithm QC are discussed in the following section, it is important to consider how much weight will be given to the generated data and what types of decisions will be made based on image analysis results. If a project is aimed at being a screening approach to identify specific samples for further in-depth analysis, then one may consider a less sophisticated algorithm as well as a QC process that may not require the review of every individual sample (be that a tissue slide or a tissue microarray core). 19 However, if these screening data are expected to impact, for example, a multimillion dollar investment of a pharmaceutical company into a drug target or disease indication, then a QC strategy that involves a thorough review of every sample and algorithm markup is warranted. All work that directly impacts human patient enrollment or treatment decisions is to be held to the highest standard of analysis, and review of every sample by a pathologist is required by regulators. 20
As part of the QC strategy, it should not only be determined which portion of the analyzed samples needs to be reviewed (eg, 100%, 75% of sample set), but also what the expected performance criteria are in order for an algorithm to pass its review. 21 It is recommended that these pass/fail criteria be defined a priori to ensure that expectations do not gradually shift throughout the review process. Should too many samples fail a predefined performance criterion and an algorithm performance improvement is not possible, the team should collectively discuss if expectations can be reasonably lowered to still meet the project’s end goal while generating appropriate quality data or if different end points should be chosen for the project. These new standards should then be uniformly applied to the entire data set, including samples previously reviewed.
When deciding upon an overall QC strategy, in addition to the final analysis markup review, one should also consider if reviews at other key aspects of the workflow are helpful to increase the efficiency of the workflow as well as the quality of the overall data. For example, review of the factors impacting image analysis described previously, including tissue quality, section quality, stain quality, and scan quality prior to analysis, ensures that only specimens fit for algorithm development are introduced into the workstream. At times, this may be as simple as checking that, for example, all slides contain tumor, before one attempts to interrogate the neoplastic cell population. Similarly, if the project workflow includes manual annotation (also called manual image masking) steps, the project plan should include an annotation strategy indicating what tissue aspect should be included in the annotation, what is to be excluded, what size area of interest may be too small to annotate for analysis, and what the QC criteria for annotation review are. 22 Furthermore, it is important to consider if annotation review should be conducted prior to algorithm tuning, or if it can be performed together with algorithm review, and if so, should all samples or only a subset be reviewed. Overall, the goal is to try to balance the amount of effort and time spent on QC with the amount of effort and time that may be wasted if an unsuitable sample continues along the analysis workstream until failing final algorithm QC.
Tailoring the analysis approach to the scientific question involves considerations such as: What is to be quantified? What is the desired end point (eg, area measurement, total cell count, positive cell count, scoring paradigm, scoring of a specific cellular sublocation, etc.)? 22 For example, if the desired readout is cell density (number of positive cells per unit area), it is paramount that the algorithm adequately quantifies both the area of interest (denominator) and the biomarker-positive cells within the area of interest (numerator). 21 However, it is not crucial that the algorithm correctly enumerates all other (biomarker-negative) cells, the biomarker-positive cells outside the area of interest, or other areas which are not of interest. Similarly, if biomarker staining is limited to the cell membrane and a simple analysis approach is desired, quantifying the area of pixels positive for the biomarker, independent of cellular identification, may meet the project’s goal. However, if this membranous biomarker staining also extends into the cytoplasm but the project aims at only quantifying membrane expression, then the analysis approach requires appropriate identification of cells and isolating their respective membranes to allow for subsequent quantification of staining only in the correct cellular compartment. If positive nuclear staining is the objective, individual biomarker positive nuclei could be quantified or an average nuclear count could be calculated using biomarker-positive area divided by the average nuclear area. 23
One should also consider the size of the sample set and the availability of independent training and test sets when considering whether an ML-based approach may be warranted rather than a classical hard-coded image analysis approach. While classical image analysis is based on an iterative process of algorithm development, markup review, and algorithm improvement based on review feedback, it is oftentimes the more appropriate approach for smaller sample sets as scale drives the ML-based learning process (Figure 3). If, however, an ML-approach is preferred, image analysis data augmentation methods have been described. 24 If this is not sufficient, pooling samples with similar changes from different studies and laboratories can be considered.
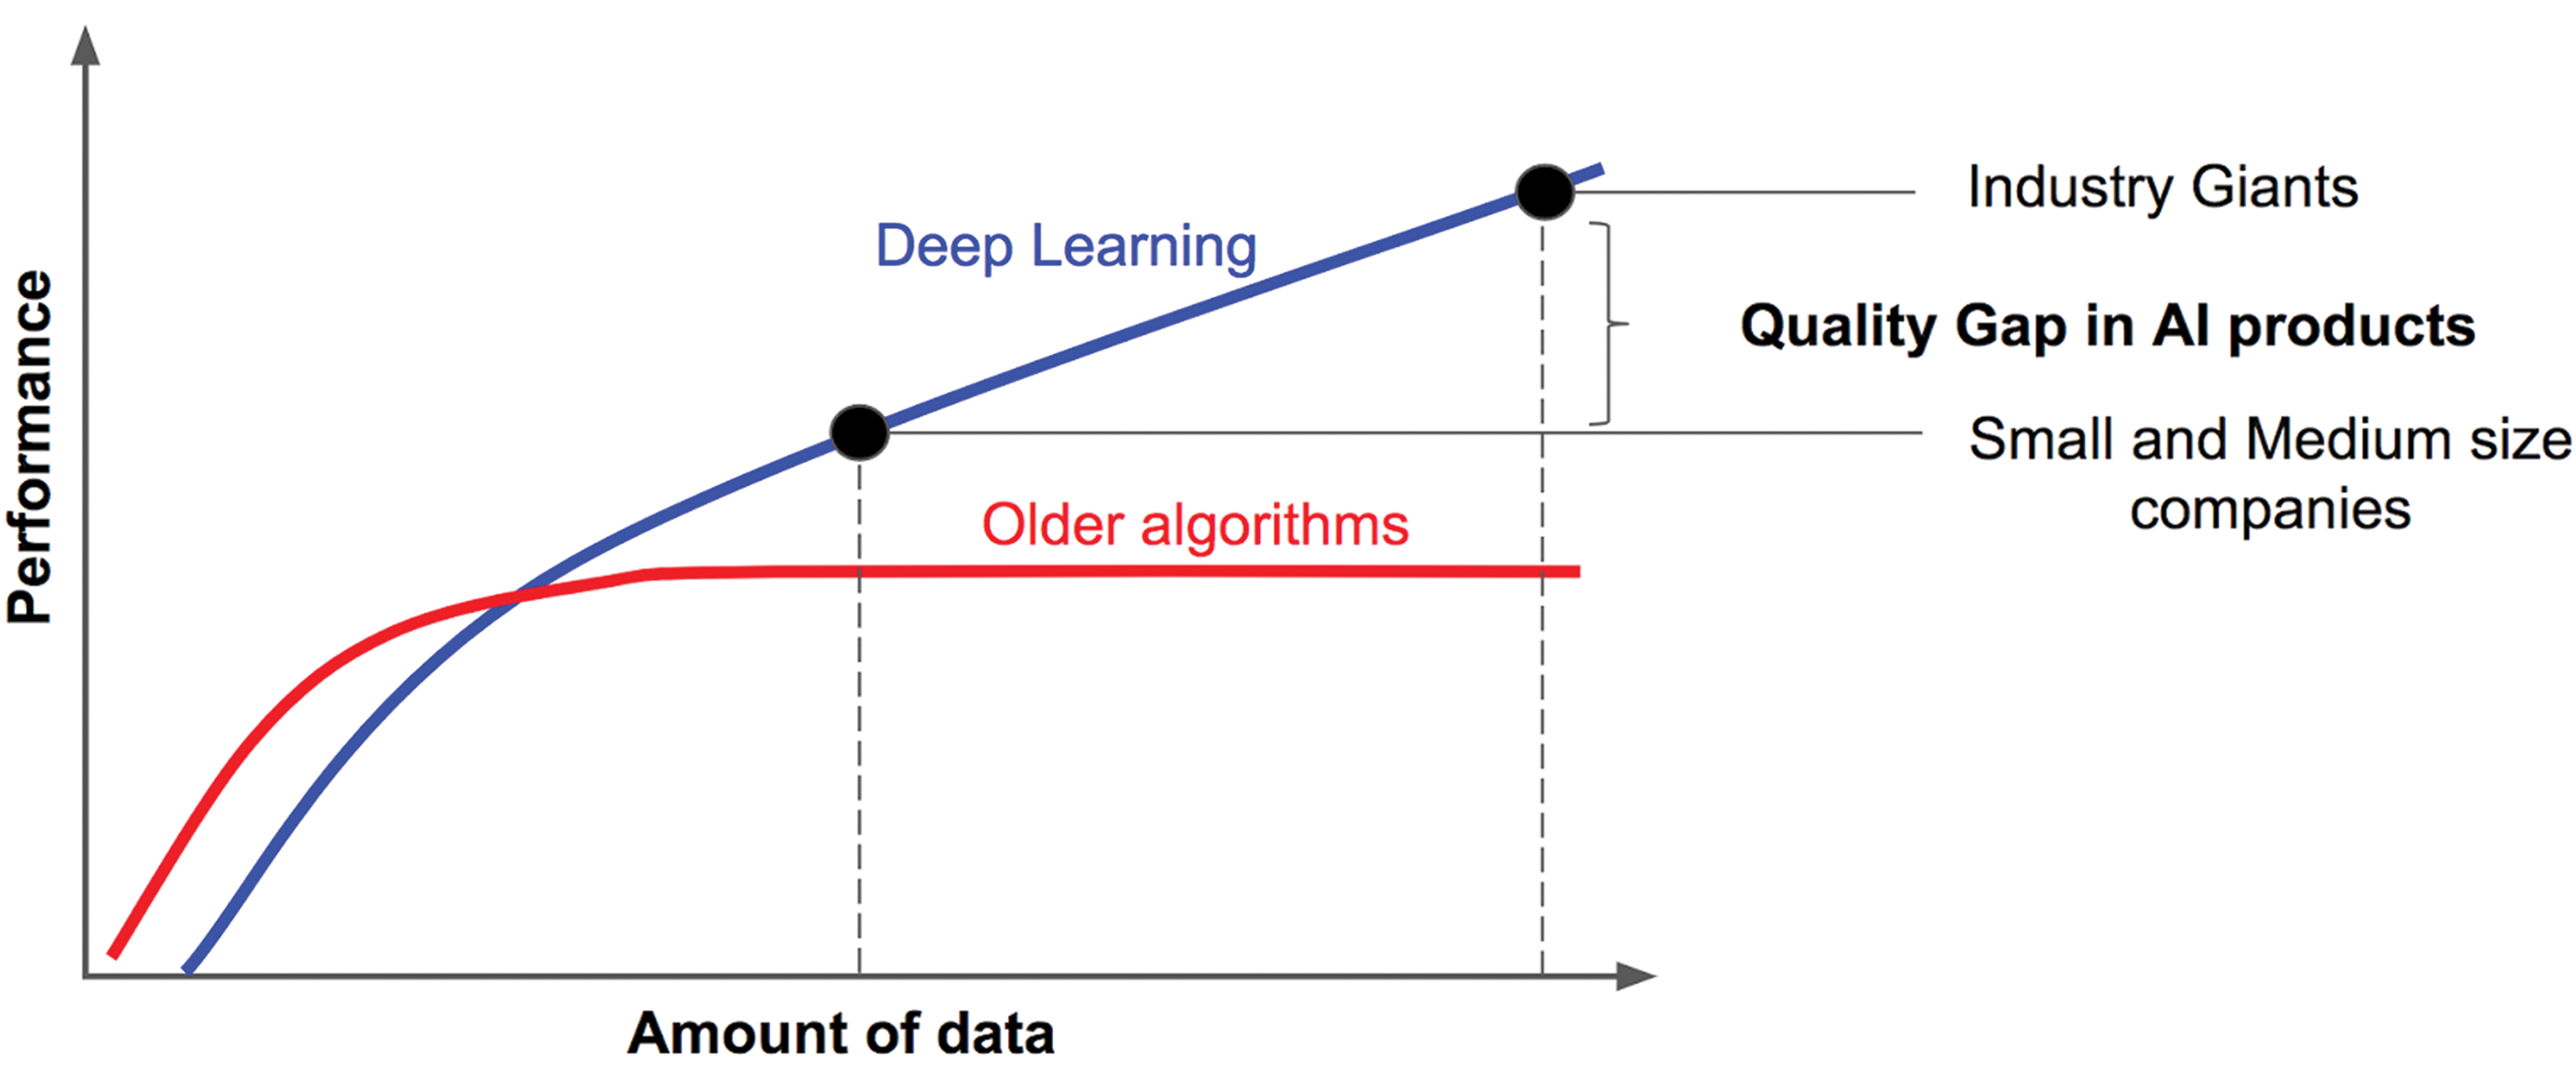
Deep learning performance keeps increasing with the amount of labeled data used for algorithm training, whereas older algorithms reach a plateau by Andrew Ng—https://towardsdatascience.com/deep-learning-specialization-by-andrew-ng-21-lessons-learned-15ffaaef627c,CCBY-SA4.0, https://commons.wikimedia.org/w/index.php?curid=85333576
Another important prestudy consideration is to assess if a 2D image analysis approach is sufficient or if a 3D approach (ie, stereology) may be more appropriate. The latter would be the case, for example, when assessing volumes (eg, quantifying the total volume of islets within the pancreas), as this estimate is 3D and the denominator cannot be accurately estimated based on a single 2D section alone, and when assessing absolute cell numbers, particularly in nonhomogeneous tissues such as the brain. 7,25 A review of stereologic approaches is beyond the scope of this manuscript, 25 –28 but it suffices to say that employing these concepts requires additional study planning considerations.
Lastly, it is important to keep in mind how closely or not the analysis data may capture the underlying ground truth. For example, unless specifically validated for such assessment, chromogenic IHC staining intensity is not an accurate reflection of target protein concentration. If intensity is an important end point to satisfy the study questions, immunofluorescence should be considered. Another ground truth poorly captured are length and area measurements. Along the sample processing workflow, starting from sample harvest until cover-slipping a stained slide, tissue goes through various steps that may alter its original shape and form, both expanding or contracting. 29 –32 These processes oftentimes do not apply consistently to all areas of the same sample, and they usually don’t impact all samples of the same study equally. Therefore, while area measurements are commonly utilized and have value in terms of data extraction and analysis, it is important to know that a specific unit area within a WSI does not necessarily correspond to the exact same unit area when the sample was in situ.
Quality Control Approaches to Digital Tissue Image Analysis
From the QC perspective, image analysis results can be divided into 4 main categories: pixel-based readouts, object-based readouts, region-based readouts, and combined readouts. 22
For pixel readouts, although the pixel quantification seems simple, it is crucial to verify that the signal comes from relevant tissue regions and no background staining or artifacts are classified as positive areas.
For both object and region readouts, the main variables determining the accuracy of object detection are their segmentation and classification accuracy and both should be accessed during the QC process. Correct segmentation means that the markup of the automatically detected object (eg, cell) or region (eg, tumor epithelium) corresponds to its shape on the WSI. The better the segmentation, the more accurate and precise the generated information about individual objects and regions will be.
Classification defines an object or a region as belonging to a certain category defined by the user (eg, positive or negative cells for a chosen IHC marker). Correct classification of cells or any other image objects or regions enables quantification of their number (expressed as a density or ratio) in the tissue section.
Combined readouts consist of any combination of the aforementioned components and may pose a significant challenge for visual QC performed by a human observer, as each component readout as well as their combination need to be assessed separately and must pass the predefined QC criteria to produce reliable data. Often this task is visually difficult and in addition to the visual review, a quantitative comparison of each component readout to the expert-generated ground truth (see below for explanation) should be considered as part of the QC strategy.
Special Considerations for QC Approaches toAI and ML—Based Tissue Image Analysis
Early attempts of digital tissue image analysis were mainly focused on the automated quantification of fluorescent or immunohistochemically stained structures in histologic sections. Due to the strong contrast of these structures and the background (fluorescent vs nonfluorescent, brown 3,3′-diaminobenzidine stain vs blue hematoxylin counterstain), development and individual adaptation of image analysis algorithms was a relatively straightforward, mainly color- and intensity-based thresholding approach using conservative “manual computing.” 33
With increasingly easier access to artificial neural network (ANN)-based AI and ML, image analysis has reached a new level of sophistication. Not only color but also more complex pattern recognition of cell shapes and tissue texture can be recognized and quantified, even in simple H&E-stained slides and gray-scale images such as electron micrographs. 34 While neural network architectures are commonly called algorithms and the product of the training (ie, the final “assay”) is called an AI model, for simplicity in this publication we refer to both as algorithms.
There are 2 possible approaches in AI-based data classification: the unsupervised and the supervised approach. The supervised approach requires labeled data sets and initial involvement of human experts for ground truth generation 34 –36 and is currently far more represented in pathology than the unsupervised approach.
During supervised algorithm development, the available data set is divided into a large training data set and smaller validation and test data sets. Using the different data sets, an ANN (often a convolutional neural network [CNN], which is used as the current most commonly used in computer vision for pathology) is trained to recognize the annotated structures and classify them automatically and robustly in unlabeled images.
Once the development of the image analysis algorithm has been finalized and the algorithm has been optimized and tested, it may be used in the local environment, since it most probably reflects the local human experts (gold standard) sufficiently. When the intention is to create an algorithm that is generalized across different (global) data sets, an additional qualification of the algorithm against an independent ground truth set, ideally from a large group of human experts, is required. For instance, currently, there are efforts underway to test mitotic figure detection CNN-based algorithm trained on an augmented image data set annotated by 2 local experts against a validation ground truth set from a group of 25 experts from various institutions (Klopfleisch et al, unpublished data). In this 2-phase approach, the validation expert group is asked to, first, annotate all mitotic figures manually and individually in the provided WSI. In the second phase, all observers are asked to evaluate the detection and classification of mitotic figures by the algorithm as correct or incorrect. Taken together, this approach allows for the validation of the algorithm against a large group of experts. The obtained consensus of false-positive and false-negative events is finally used to further increase the robustness of the algorithm. The efforts to apply type of approach on a larger scale (ie, building external validation sets composed of slides from multiple sources and annotations from multiple pathologists) are ongoing and could be used by regulatory agencies for future algorithm validation. 37
The ML-based image analysis approaches have great potential in solving complex pathology problems as they do not rely on the limited number of features a human observer can define to detect structures in the image but automatically detect them based on the provided examples. However, it is difficult to extract the exact features from the ANNs on which AI classification is based. This is often referred to as a “black box.” In unbalanced data sets, this can lead to unknowingly classifying samples based on irrelevant parameters. These approaches also require large amounts of labeled data and more computational power which, due to the cost, can be an obstacle particularly for smaller institutions. As powerful as the AI approaches are, they may not always be the optimal choice for every project and for some, classical image analysis may still be the best approach (as discussed above).
Proposed QC Methods of Image Analysis Results
This QC step of the digital pathology workflow is of utmost importance for reliability of the method, and readouts of insufficient or unknown quality should be removed from further analysis. Ensuring the quality of the results of an algorithm relies upon the agreement between trained scientists qualified to independently interpret the study material (typically board-certified pathologists or their qualified designees) regarding classification of the objects of interest. The expectations of a pathologist or designee are that they can identify the region(s) where the objects of interest are being measured, can distinguish the objects of interest from all other objects within an ROI, and can perform all measurements necessary to quantify the dependent variables. While a pathologist may not be required to perform every aspect of the QC workflow, the pathologist should oversee the general process, as they are ultimately responsible for the data. We outline here a framework for a method of qualification, verification, and improvement of algorithms for digital image analysis of biological samples in the toxicologic pathology setting, based on adaptation of a recent proposal by the Food and Drug Administration (FDA) specifically for the use of AI and ML in the clinical setting. 38
In their discussion of the use of adaptive AI/ML medical devices, the FDA has granted that these devices may pass premarket review in a nascent state. That is, after these AI-assisted devices are deployed, it is understood that their diagnostic criteria will change as they continue to learn from data acquired in the field. They have outlined good ML practices, which, if adhered to, can maintain assurance of the safety and effectiveness of the device. In “enabling the continuous (post-market) improvement” of these devices over their lifetime, the FDA has made an important concession. Namely, the precision of diagnoses made by an AI-assisted medical device can improve after it has been deployed without compromising the validity of earlier diagnoses. We argue here that the same is true of any qualified algorithm.
The critical piece of the proposed regulatory structure is the complete 360° evaluation of not only the development and qualification of the initial algorithm, but also the results of the algorithm after it has been put into use on a regulated study, and the continued improvement of that algorithm based upon those results. At this point, it should be stated clearly that the algorithms used for image analysis discussed herein are “fixed” per the definition provided by the FDA. That is, they do not change the weights of their classifiers based upon their results until those results are provided to it as new training data by a human designer. In this respect, these algorithms present a much lower risk of changing its own “heuristics” by new data than adaptive AI technology. However, because these image analysis algorithms can be updated, we have here adapted the same principles outlined by the FDA for supervision and phenomenological verification of the validity of the reversioned algorithm’s heuristics. We recommend that studies utilizing an algorithm for any kind of automated analysis should be able to demonstrate agreement between a minimum of 3 board-certified pathologists or their qualified designees, each assigned to one of the following roles: (1) design and training of the algorithm, (2) QC of the algorithm, and (3) verification of the algorithm’s output. Each of these roles may be filled by one or more members. There should be no overlap of members between reviewers assigned to roles so that each role can provide a truly independent analysis of the object of interest.
The algorithm serves as a proxy for the designer(s) of the algorithm; that is, the pathologist or designee(s) assigned the first role. Toward this end, there must be a high level of agreement between the designer(s) of the algorithm and the algorithm itself. This is measured by the loss function of the algorithm, which evaluates the agreement between the ground truth and the performance of the algorithm on the same training set the ground truth was taken from. 39 The loss function should be close to 0. The expectation is that there will be greater disagreement between the algorithm and its designer on study material they are both naive to than is reflected by the loss function on the training material. However, there will still be greater agreement between algorithm and designer on any study material than between the algorithm and pathologists filling the other roles, as the algorithm has been designed to emulate its creator’s heuristics. Thus, QC of the algorithm’s output begins with aligning the designer and the algorithm on the training material. The primary assumption regarding the training material is that it captures the full range of variability seen across the testing material. If this assumption is met, there will be fewer challenges at the succeeding quality checks. It must be noted that an algorithm can only perform as well as the pathologist or designee who serves as its architect. Adjustment of the sensitivity of most algorithms will reach a point where compensatory tuning across all defined parameters for type 1 errors will produce an increase in type 2 errors and vice versa. When this limit is met, final adjustments should exclude false positives to maintain the purity of the sample. False negatives should be characterized and qualified in the results if they may have been influenced by the independent variable(s).
Once the designer is satisfied with the level of agreement between their own judgment and that of the algorithm, another board-certified pathologist or qualified designee, versed in the method or platform used to create the algorithm, should review not only the performance of the algorithm on the study material against their own heuristics, but the design of the algorithm. This first independent reviewer should have access to all of the elements availed upon by the designer to create the algorithm to include, but not limited to, the study material, the method of feature extraction, the method of classification, the threshold or training data used to establish the algorithm’s sensitivity, postprocessing of metadata, the measurement and calculation of end points, and the algorithm’s performance on novel testing material. In short, this second pathologist must review all decisions made during the creation of the algorithm. It is of key importance that this reviewer ensures the range of variability in the study data was represented in training data, and that any feature extraction methods have not modified the object(s) of interest in any way that has changed the level of expression. This tester must apply the algorithm to novel exemplars of the object(s) of interest selected with the intent to test the sensitivity of the algorithm. It is important that this level of QC occurs before application of the algorithm to the main study materials. If the algorithm is not approved for use at this stage, its architecture must be reconsidered by the designer and/or the study material it is applied to must be reevaluated. As described earlier in this review, it cannot be understated how important high-quality tissue processing and staining is. It is critical to ensure that staining intensity is within the optimum range for the algorithm and that slide to slide staining variability is limited.
The algorithm may be considered qualified for study use upon approval by the second board-certified pathologist or designee. At this point, the algorithm should be versioned and saved to a secure location. Any modifications of the algorithm from this point will require reversioning and requalification. All data generated by a qualified algorithm should be traceable back to the version of the algorithm that produced it. After applying the algorithm to study material, the designer should review the material and perform any necessary manual editing. Once this is complete, a final reliability test should be run.
Verification of the algorithm’s output relies on a third board-certified pathologist or qualified designee that is blinded to the study material and to the performance of the algorithm. A randomly selected portion of the study material should be presented to this subject matter authority, who will annotate the samples for the object of interest. The reviewer’s blinded analysis will be compared to the automated segmentation, and a Dice similarity coefficient, κ index, or other metric of interrater reliability will be run to assess agreement between the pathologist and the algorithm. The results of this reliability testing may trigger further review of the algorithm or the data set. Additional manual editing may be required, or reversioning and requalification of a new algorithm for all or a portion of the study material. Any disagreement between the algorithm and the pathologist during the verification step should be reported with the data.
The most common ways of controlling the quality of a qualified algorithm are visual assessment of the analyzed slides by a pathologist or their qualified designee or a quantitative comparison of the image analysis solution to the provided manual annotations of the target structures and ROI. Quantitative comparison works optimally if the annotations constitute an input for automated tests, which can be repeated every time the image analysis solution changes, without constant involvement of the pathologist.
Visual QC consists of visually comparing the image analysis overlays to the corresponding structures in the tissue. The advantages of this method are that the assessment takes place on the WSI and not just on restricted regions. In addition, multiple parameters can be evaluated during the same QC session. The WSI selected for visual QC should represent the staining and tissue architecture variability of the analyzed cohort and the proper sample size 40 should ensure the reliability of the process. The disadvantage of this method is its qualitative character. The quality rating depends on the interpretation of the observer and may be subject to interobserver variability or bias. As previously discussed, clear acceptance criteria should be defined before starting the QC process and should be based on the biological characteristics of the investigated event and the statistical impact of the potential error. Usually this type of QC is not part of any automated test and the findings should be documented with detailed descriptions and example images of the observed problems (Figure 4), which can be used for further improvement of the image analysis solution. The decision how to proceed with samples which fail the visual QC should be documented in the QC strategy plan and/or procedurally controlled.
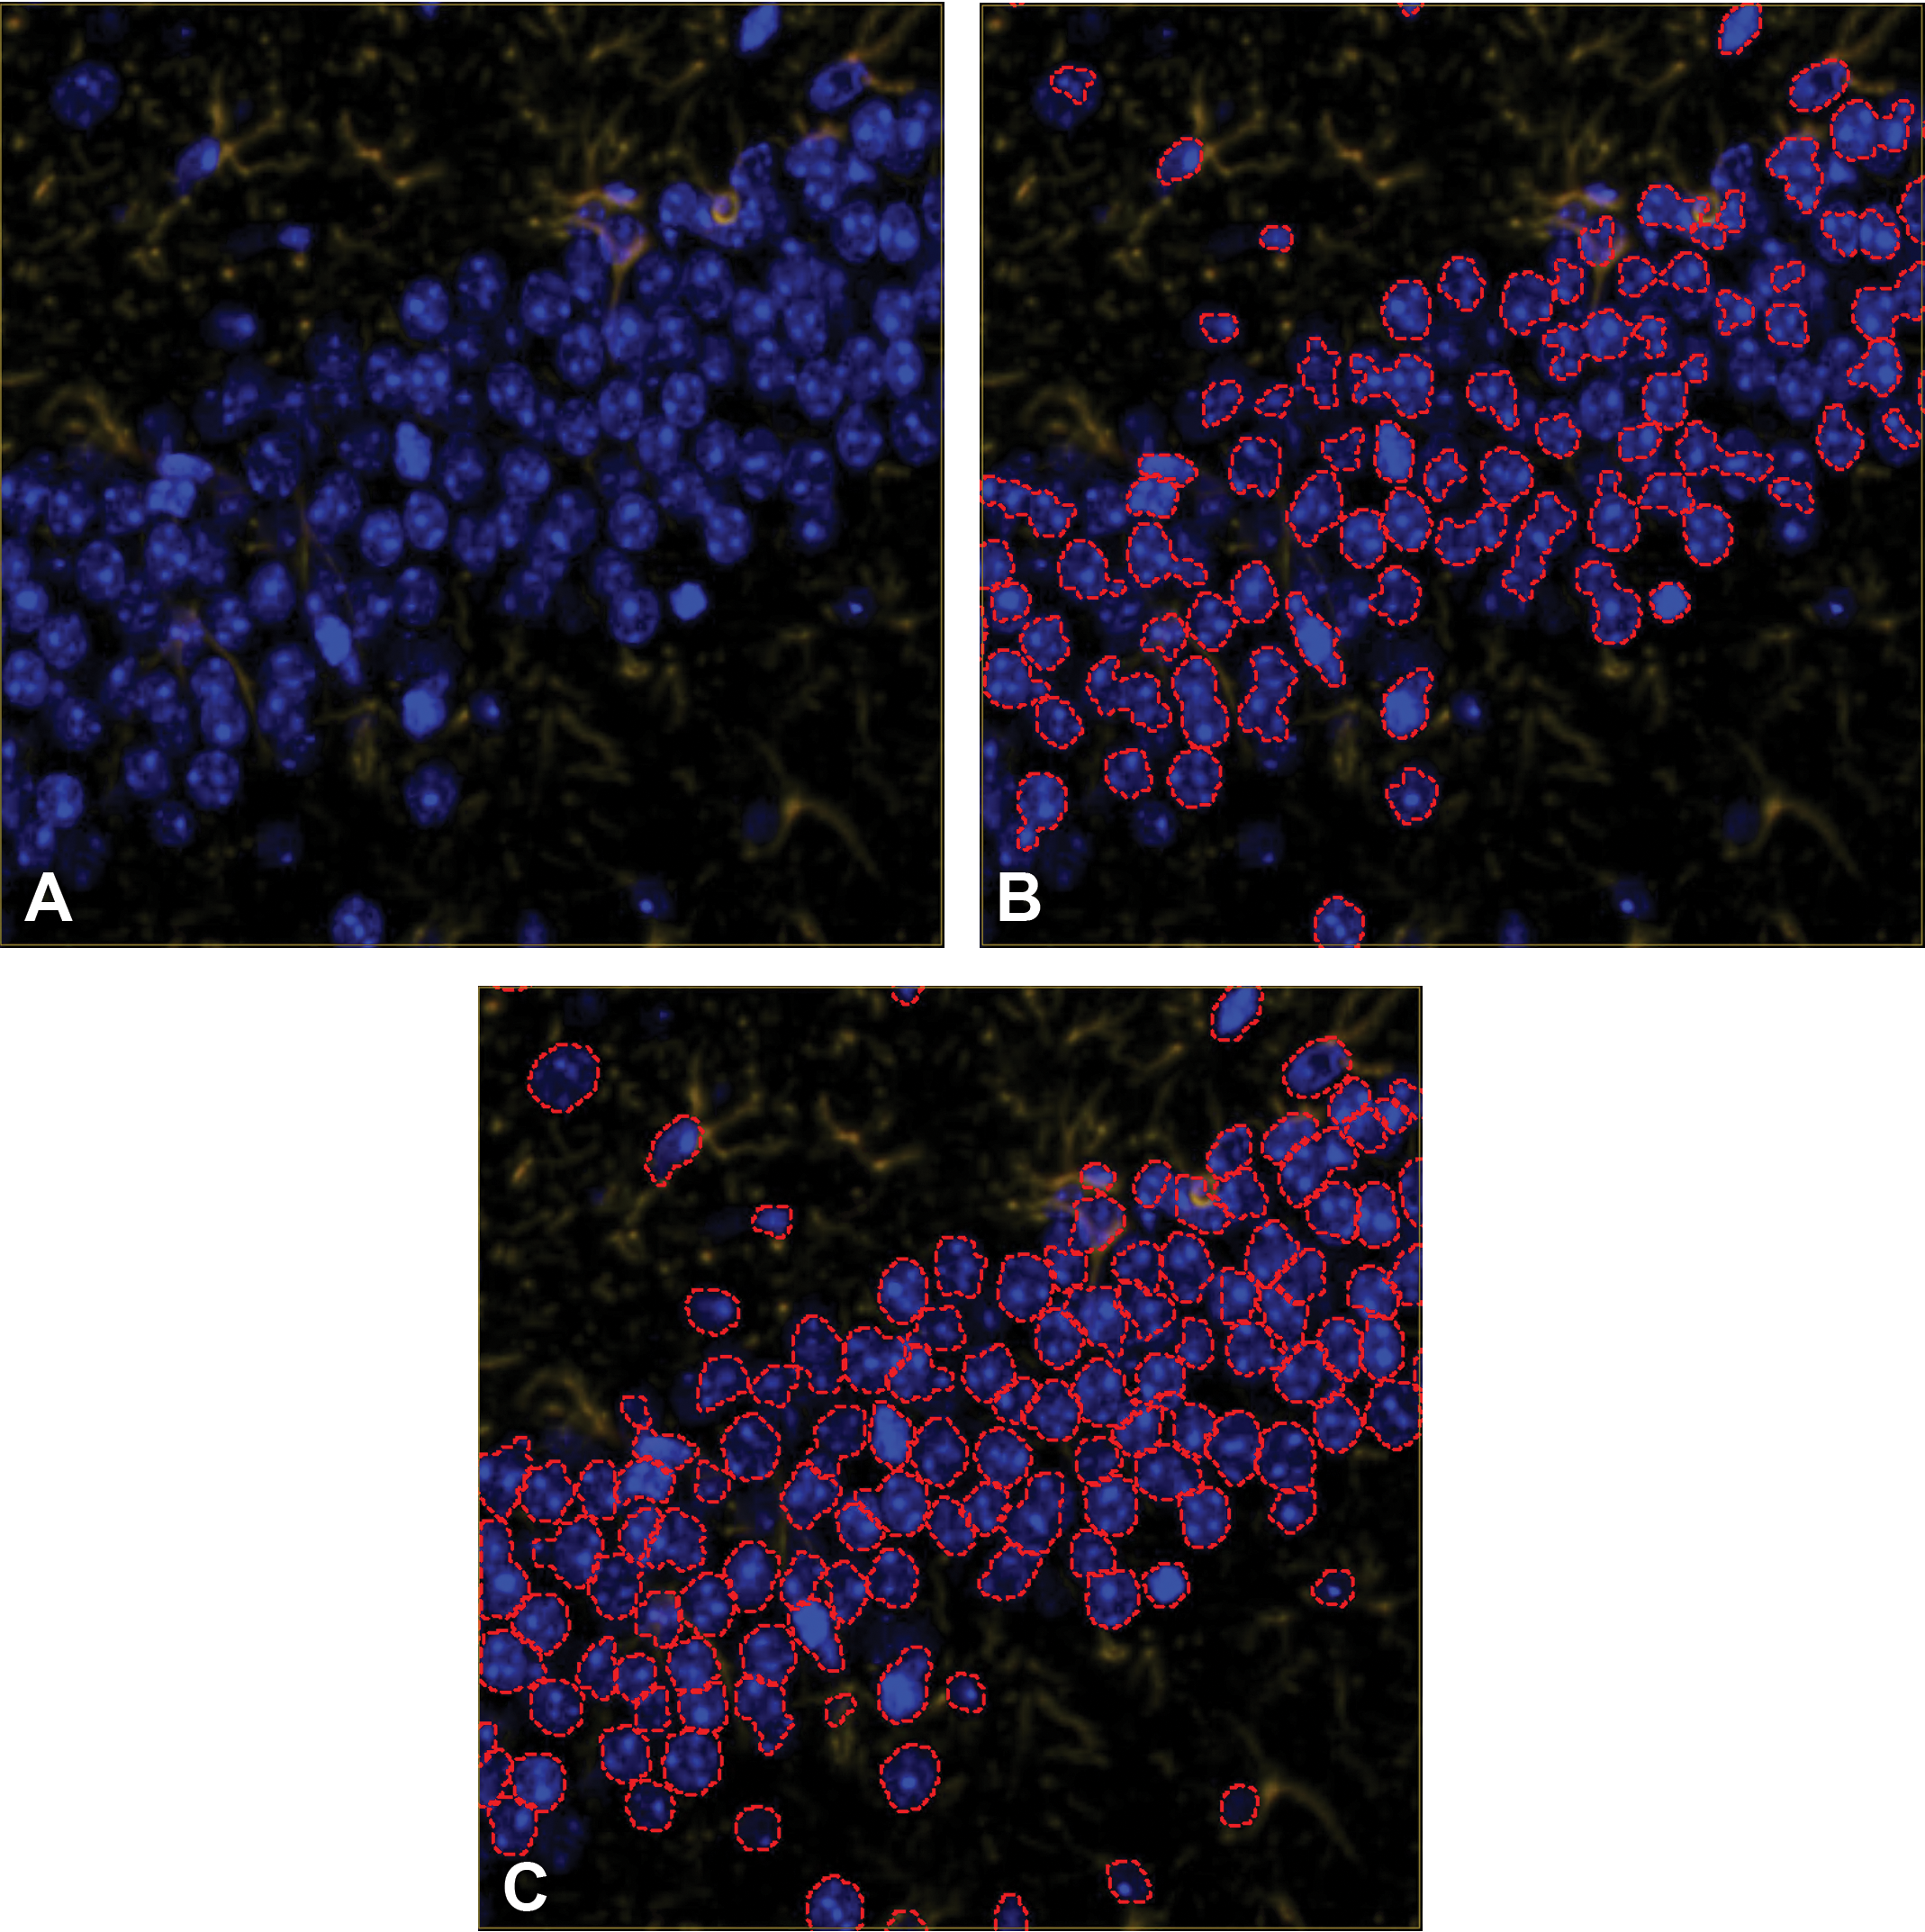
A, Immunofluorescent staining in the hippocampus of a mouse brain tissue section with GFAP in the TRITC channel and DAPI counterstain. B, Results of nucleus detection (within red dotted lines) with false negatives and poor segmentation of individual nuclei. C, Improved nuclear segmentation as a result of an iterative algorithm development process including a visual QC step. DAPI indicates 4′,6-diamidino-2-phenylindole; GFAP, glial fibrillary acid protein; TRITC, tetramethylrhodamine; QC, quality control.
As in other medical and nonmedical areas of image analysis, the quality of the algorithms and models can also be quantitatively compared to manually labeled data. In the case of digital pathology, as an input this method uses manual annotations of target structures or regions of interest provided by pathologists or qualified designee, which are then compared to the results of the analysis, quantifying the automated labels for image analysis, and comparing to those of the annotations. 41 The advantage of this approach is that the annotations provided are quantifiable and reusable. Once the annotations are created, different versions of the image analysis solutions can be qualified without the necessity of additional input, and the best version of the image analysis solution can be identified based on the result of this comparison. One of the limitations is the restricted amount of annotations that can be provided. Creating these annotations can be more time consuming than the visual QC and due to limited pathology resources, the number of annotated areas is limited. In addition, the areas for annotations should be chosen carefully to represent the variability of the whole cohort. The number of samples to be annotated and the validity of the approach for evaluating different types of readouts should be defined in advance at the project design stage. 40 As outlined previously, the acceptance criteria should be defined before the QC is performed and should be derived from the concordance between multiple annotators when given the task to annotate the same tissue area.
Data Interpretation and Reporting
After the algorithm QC has been performed, an accurate and thorough interpretation of the image analysis data is required. For documentation, a detailed description of the decisions made during development of an algorithm should include an explanation of the rationale for each feature extraction and the method of classification. If a threshold was used, an explanation of how that threshold was chosen should be reported. With regard to the training data, documentation should include identification of the training data set, its size, and how it was chosen. All automated and manual postprocessing of the metadata generated by the classification method should be documented. If multiple algorithms were employed either in parallel (on separate portions of the study material) or in series, an explanation must be provided as to why such measures were necessary. All measurements and calculations performed to generate the end points should be explained in sufficient detail to allow replication on a similar data set. Finally, any disagreement between the algorithm and a trained expert during verification of the automated output should be described and discussed.
Evaluation of the extracted analysis data set requires a thoughtful interpretation and reporting phase. The report should represent the culmination of the collaborative scientific effort. If this is not done appropriately, it may lead to misrepresentation of the data. The data set requires context as to its impact on the overall understanding and development of the test agent and the pathologist should describe it in the report as part of the data interpretation. The reporting design should be tailored to the need of the project and suggested components include methods, results, discussion, statistics, QC process, and references. 42
Pathologists, as uniquely qualified to interpret tissue data, need to stay involved in the data interpretation process throughout the project to provide the necessary expertise to other scientists, such as bioinformaticians, geneticists, and scientists involved in the different stages of the project work.
Discussion
Digital tissue image analysis is a powerful methodology that can generate continuous quantitative tissue data, increase efficiency, improve consistency, and enable assessments that are not possible or practical via manual evaluation. As any scientific method, it has its specific strengths and limitations. While the image analysis technology changes and advances, the need for method qualification and algorithm QC continues regardless of the analysis strategy.
The initial analysis method qualification defines how the method is expected to perform within its intended use, including the expected impact of specific preanalytical variables. Pathology image data can be variable due to technical complexity of the sample preparation as well as biological variation and heterogeneity. Thus, in selecting an appropriate QC strategy, it is important to be cognizant of the intended use of the results such as (1) screening versus diagnostic tool, (2) independent or supportive tool, and (3) the potential negative impact of errors (economical or health/quality of life impact). If the application is expected or proven to have negligible negative impact in case of typical errors, it may be decided to omit laborious post analysis QC; however, in the case of diagnostic use determining treatment options with potentially serious side effects for a patient, both the analysis application itself and the QC measures need to be exceptionally robust and follow established regulatory guidelines.
A QC strategy needs to address multiple project aspects including preanalytical variables, monitoring of method performance, and establishing performance metrics and acceptance criteria for the study set. It is crucial to predetermine these QC metrics, acceptance criteria, and reporting requirements prior to commencing analysis work to minimize the post hoc risk of confirmation bias and other analysis fallacies.
Prior to having a well-established image analysis assay, it can be challenging to predict how and when the method will fail. The pathologist has the expertise to aid in this assessment. The pathologist’s ability to do a full QC assessment of the results enables a feedback loop to technical staff performing tissue sampling to aid minimize the preanalytical variables, to algorithm development, as well as input into downstream data interpretation. Notably, for ANN-based methods, it is important to understand that the exact patterns recognized by the image analysis algorithm are not always clear and may be enclosed in the “black box” of network classifiers. This of course is not unlike the functioning of the human brain but does require awareness of both the qualification approach and the intended use of the data. Failure to recognize the limitations of any image analysis approach can lead to insufficient QC and analysis errors.
Conclusion
Completing an image analysis project successfully requires understanding of pathology, implemented image analysis methods, QC methods (including their limitations), as well as a robust understanding of the statistics applied to the data. Thus, it falls to the reporting pathologist to understand the methods used for study evaluation, their limitations, presence of underlying assumptions and resulting biases, and how they can be avoided or minimized. This ensures generation of high-quality results and adequate communication thereof to the audience receiving the data. In this context, pathologists also need to understand the limitations of 2D analysis as a whole and be able to counsel principal investigators and other scientists on when 3D techniques, such as stereology, are indicated. Any algorithm underperformance identified in the QC process should be characterized and addressed in further development to continuously improve the image analysis workflows. Ultimately, data should only be extracted from samples that completed the QC process and met predetermined performance criteria to ensure high-quality data generation.
Footnotes
Declaration of Conflicting Interests
The author(s) declared no potential conflicts of interest with respect to the research, authorship, and/or publication of this article.
Funding
The author(s) received no financial support for the research, authorship, and/or publication of this article.