
Abstract
Fatty liver disease is a potential risk factor for drug-induced liver injury (DILI). Despite advances in nonclinical in vitro and in vivo models to assess liver injury during drug development, the pharmaceutical industry is still plagued by idiosyncratic DILI. Here, we tested the hypothesis that certain features of asymptomatic metabolic syndrome (namely hepatic steatosis) increase the risk for DILI in certain phenotypes of the human population. Comparison of the Zucker Lean (ZL) and Zucker Fatty rats fed a high fat diet (HFD) revealed that HFD-fed ZL rats developed mild hepatic steatosis with compensatory hyperinsulinemia without increases in liver enzymes. We then challenged steatotic HFD-fed ZL rats and Sprague-Dawley (SD) rats fed normal chow, a nonclinical model widely used in the pharmaceutical industry, with acetaminophen overdose to induce liver injury. Observations in HFD-fed ZL rats included increased liver injury enzymes and greater incidence and severity of hepatic necrosis compared with similarly treated SD rats. The HFD-fed ZL rats also had disproportionately higher hepatic drug accumulation, which was linked with abnormal hepatocellular efflux transporter distribution. Here, we identify ZL rats with HFD-induced hepatic steatosis as a more sensitive nonclinical in vivo test system for modeling DILI compared with SD rats fed normal chow.
Introduction
Over 30% of adults in the United States fulfill the diagnostic criteria for metabolic syndrome, a clustering of risk factors linked with increased susceptibility to cardiovascular disease. 1 –4 These risk factors include central obesity/elevated body mass index, hyperinsulinemia and/or insulin resistance, dyslipidemia (elevated triacylglycerol and/or decreased high-density lipoprotein levels), hypertension, and, lastly, hepatic steatosis (nonalcoholic fatty liver disease [NAFLD]). Hepatic steatosis is particularly pervasive and under diagnosed, estimated to affect 50% to 90% of obese individuals 5 –7 and 34% of the US general population. 8,9
Individuals with metabolic syndrome may also be at greater risk for drug-induced liver injury (DILI), not just cardiovascular disease. 10 –15 The association is peculiar, as individuals with NAFLD do not typically present with elevated liver injury enzymes prior to treatment. 16 In this sense, hepatic fat accumulation is not considered a toxic end point but rather an asymptomatic “first hit.” 17 Additional hepatic insults resulting from an interaction of genetic and environmental factors can lead to exacerbation of effects on the liver and progression of NAFLD to nonalcoholic steatohepatitis (NASH) based on the “multiple parallel hit” hypothesis. 18 –20
It is important to note that human subjects with asymptomatic NAFLD are not routinely excluded from clinical trials, and diagnostic tools to identify and stratify these individuals such as noninvasive imaging and biomarkers are beyond current practice. Nonclinical risk assessment studies in rodents typically do not evaluate compounds for their potential to injure a steatotic liver, and risk management strategies have not been adopted.
The Zucker rat in vivo test system has been available for decades and includes the Zucker Fatty (ZF) and Zucker Lean (ZL) rats, which represent two extremes and provide unique insight into the array of metabolic syndrome phenotypes. The ZF (fa/fa) rat was first identified during breeding experiments in 1959. 21 –23 The cause of the Fatty phenotype is linked to a point mutation (adenine to cytosine at position 880) on both alleles of the leptin receptor gene (Lepr), resulting in a single amino acid substitution (proline to glutamine at position 269) on the extracellular domain of the leptin receptor. As a result, leptin receptor expression and binding affinity are affected, decreasing the ability of leptin to act as a satiety hormone in the arcuate nucleus of the hypothalamus and drive catabolic pathways in both liver and skeletal muscle. 24,25 Consequently, a dramatic decrease in leptin signaling results in hyperphagia, prominent central obesity, hyperinsulinemia, hyperlipidemia, and spontaneous severe hepatic steatosis, evident as early as 3 weeks of age. 26 –28 In contrast, ZL (Fa/−) rats do not develop hyperphagia, obesity nor hyperglycemia, 29 and do not develop hepatic steatosis when fed a normal chow diet. Owing to this unique phenotype, the ZL rat lends itself as an appropriate test system for investigating liver injury in patients with asymptomatic NAFLD.
In this work, we comprehensively characterized diverse phenotypes of the ZF and ZL rats when fed normal chow and high fat diet (HFD) to identify the ZL rat as an appropriate test system for investigating liver injury that mirrors patients with asymptomatic NAFLD. We then assessed the relative sensitivity of the HFD-fed ZL rats to DILI by daily dosing with an overdose of acetaminophen (APAP) for 7 days and compared the responses with the Sprague-Dawley (SD) rats, the most widely used nonclinical rodent model for exploratory toxicology studies in the pharmaceutical industry.
Materials and Methods
Animals and Diet
The Pfizer Institutional Animal Care and Use Committee reviewed and approved the animal use in these studies. The animal care and use program is fully accredited by the Association for Assessment and Accreditation of Laboratory Animal Care, International. Both 10-week-old male ZL rats (200-250 g) and ZF rats (550-600 g) were obtained from Harlan Laboratories (ZL rats: HsdHrl: ZUCKER [Lean] strain code 195; ZF rats: HsdHrl: ZUCKER-Leprfa strain code 194; Envigo) and Charles River Laboratories (Crl: ZUC-Leprfa ; ZL rats strain code 186 [Lean]; ZF rats strain code 186 [Obese]) and fed a HFD (60% kcal from fat/lard; #D12492, Research Diets) or normal diet (chow, 13% kcal from fat; #5002 Purina Certified Rodent Diet, LabDiet) ad libitum for either 2 weeks (Charles River rats) or 8 weeks (Harlan rats). Of importance, we observed a stronger response in Charles River rats on HFD, therefore the duration of HFD feeding was set to 2 weeks for Charles River rats and 8 weeks for Harlan rats to elicit comparable phenotypes. Male SD rats (275-350 g) were obtained from Charles River Laboratories, Crl: CD(SD); strain code 001, and fed normal chow (#5002 Purina Certified Rodent Diet). The rationale for using male rats is supported by a recent study demonstrating more severe NAFLD phenotype in men compared to premenopausal women which was linked with protective effects of estrogen. 30 To elicit the strongest diet-induced phenotype and to allow for comparisons to historical controls, male rats were used for studies in this manuscript. Animals were housed at 70 °F ± 5 °F (22 °C ± 3 °C) with humidity 30% to 70% in an approximate 12-hour light, 12-hour dark cycle with a minimum of 12 air changes per hour and air filtered through 90% to 95% efficiency prefilters and then through high-efficiency particulate air (HEPA) filters. Water from the municipal source was available ad libitum.
Drug-Induced Liver Injury
The ZL and SD rats were fed either a HFD or chow, respectively, for 2 or 8 weeks and then administered either vehicle (125 mM citric acid in deionized water) or 300, 800, or 1400 mg/kg of analgesic drug APAP (Sigma-Aldrich; lot #032K0146) by oral gavage once daily for 7 days. The APAP concentrations were 0, 30, 80, and 140 mg/mL at a dose volume of 10 mL/kg. Compared to APAP studies in mice, which typically require a single dose of 300 mg/kg APAP to elicit hepatotoxicity, rats tend to be more resistant to APAP-induced hepatotoxicity, 31,32 therefore dosing needs to be adjusted to elicit liver damage. Doses used in this study are in agreement with a previous report. 33
Clinical Chemistry
Liver injury enzyme levels were evaluated in samples collected from the lateral tail vein. Animals were fasted for approximately 20 hours prior to sampling. Serum samples were evaluated on the Siemens ADVIA 1650 Clinical Chemistry Analyzer (Siemens) for alanine aminotransferase (ALT; kit from Siemens) and glutamate dehydrogenase (GLDH; kit from Randox Laboratories).
Oral Glucose Tolerance Test
Oral glucose tolerance test (OGTT) was performed as described elsewhere, 34 with minor modifications. Briefly, animals were fasted overnight for approximately 20 hours, and then administered 2 g/kg glucose (50% dextrose, at 4 mL/kg) by oral gavage. Blood samples were collected via a nick to the distal portion of the tail prior to glucose administration (time 0) and then 30, 60, 90, and 120 minutes postdose on weeks 2 and 8 of study. Glucose levels were determined with a portable blood glucose monitoring system (Ascensia Contour) at the time of sample collection. Blood samples for insulin analysis were placed in lithium heparin collection tubes, spun down for plasma extraction; and the plasma was frozen at −80 °C until analysis. Insulin level was determined using a commercial ELISA kit (Mercodia).
Histopathology, Immunohistochemistry, and Image Analysis
For terminal sample collection, nonfasted animals were euthanized with carbon dioxide the day after the last treatment day. Sections of (10% neutral-buffered) formalin-fixed paraffin-embedded (FFPE) liver were stained using hematoxylin and eosin (H&E), and immunohistochemical (IHC) staining was separately performed for adipophilin 35 and multiple drug resistance protein 1 (MDR1). Separate IHC staining for adipophilin and MDR1 was performed using the Ventana Discovery-XT automated staining platform (Ventana Medical Systems/Roche). Liver FFPE slides were cut at 4 µm, air dried, and deparaffinization was done online, followed by antigen retrieval using the cell conditioning solution 1 (mild option). Slides were blocked for endogenous biotin binding using Ventana A/B Block (for adipophilin IHC) or for nonspecific antibody binding using Ventana S-block (for MDR1 IHC) for 4 minutes. Afterward, slides were incubated with a guinea pig polyclonal antibody against adipophilin (GP40, Progen Biotechnik) or with a mouse monoclonal anti-MDR1 (sc-13131, Santa Cruz Biotechnology) at a 1:1000 dilution for 32 minutes with heat. A biotinylated goat anti-guinea pig secondary antibody (BA-7000, 1:1000 dilution, Vector Laboratories) along with DABmap detection kit (Ventana Medical Systems) or the OmniMap anti-mouse multimer HRP secondary antibody with the ChromoMap DAB detection kit (Ventana Medical Systems) were used. Following the IHC staining for adipophilin and MDR1, slides were counterstained with hematoxylin, coverslipped, and stored in a light-proof slide box at room temperature. The slides were evaluated by a board-certified pathologist prior to further analysis and image sampling. The extent of hepatocellular necrosis in H&E images from APAP studies was evaluated according to the following severity score scale: 1 = minimal, 2 = mild, 3 = moderate, 4 = marked, and 5 = severe. Hepatic steatosis quantification was achieved following image acquisition using Vectra automated multispectral image system (Akoya Biosciences) with a Nuance camera. 36,37 Fifty 20× spectral images were acquired per section, and adipophilin IHC signal was spectrally unmixed and analyzed using inForm image analysis software (Akoya Biosciences), with the data expressed as sum of adipophilin IHC signal intensity across the entire tissue area.
Quantification of Plasma and Hepatic Levels of APAP
Toxicokinetic analysis of APAP levels in plasma and liver samples from chow-fed SD rats or HFD-fed ZL rats (for 2 or 8 weeks) that were orally gavaged with up to 1400 mg/kg APAP for 7 days was performed. Analysis was performed on both day 1 (after single APAP dose) and day 7 (after daily APAP dosing for 1 week). At both days, plasma samples were collected at 1-, 3-, 8- and 24-hour time points, and results were expressed as area under the concentration–time curve over 0- to 24-hour time interval (AUC0-24 h). Protein was precipitated from 20 µL aliquots of plasma samples and standards by the addition of 200 µL of acetonitrile containing an internal standard. Liver samples were diluted with 60:40 isopropyl: water (1 g tissue per 1 mL of diluent) and homogenized by Mini-Beadbeater (BioSpec Products). Liver samples were analyzed utilizing a mix-matrix approach, where 20 µL of unknown liver homogenate was added to 20 µL of blank plasma, and 20 µL of plasma standards were added to 20 µL of blank liver homogenate so that standards and samples had the same composition. Protein was precipitated from these mix-matrix samples by the addition of 200 µL of acetonitrile containing an internal standard. Plasma samples and mix-matrix samples were mixed by vortex, spun down, and 120 µL of the resulting supernatant was diluted with 120 µL of water prior to liquid chromatography (LC) tandem-mass spectrometry analysis. The LC analysis was conducted using Shimadzu 10ADvp Binary HPLC pumps (Shimadzu Scientific Instruments) and a CTC-PAL autosampler (Thermo Fisher Scientific). Chromatographic separations were performed on a Kinetex 2.6 µm pentafluorophenyl (PFP) 30 × 3.0 mm column (Phenomenex) using mobile phase A (0.1% formic acid in water) and mobile phase B (0.1% formic acid in acetonitrile). A linear gradient from 5% B to 90% B over 3 minutes with the flow rate of 0.4 mL per minute was used to elute APAP and the internal standard. Mass spectrometry was performed on a Sciex QTRAP5500 system equipped with a turbo ion spray source (Applied Biosystems) operated in the positive ion mode. Analyst software (version 1.5.2, Applied Biosystems) was employed to control the instrument operation and acquire data in multiple reaction monitoring mode. The ion transitions were m/z 152.0 to 110.1 for APAP and m/z 268.0 to 116.0 for the internal standard. The dynamic range of the assay was 5 ng/mL to 5000 ng/mL using a quadratic regression with a 1/x weighting.
Statistical Analysis
All data are presented as means ± standard error. Comparisons of 3 or more groups were performed using analysis of variance with Tukey post hoc test and the Brown-Forsythe test to determine the equality of group variances (analysis in GraphPad Prism 8.1.0). Data were considered significant when the P value was less than .05.
Results
Zucker Lean Rats Fed a HFD Effectively Model Asymptomatic NAFLD
To identify an appropriate nonclinical in vivo test system for recapitulating asymptomatic NAFLD observed in human populations, we performed a comprehensive comparative time course analysis of ZF and ZL rats fed either a HFD or normal chow for 2 or 8 weeks. Of note, Zucker rats were obtained from 2 different vendors to provide robustness of results, while highlighting variabilities between 2 sources which indicated differences in response severity to HFD. Consequently, to elicit comparable responses and similar phenotypes, Zucker rats from Charles River Laboratories were fed a HFD for 2 weeks, while Harlan Zucker rats were fed a HFD for 8 weeks.
First, an OGTT was performed to determine relative insulin sensitivity between both strains (Figure 1). Zucker Lean rats fed a HFD for 2 or 8 weeks were able to control serum glucose through increased serum insulin levels (compensatory hyperinsulinemia). In contrast, ZF rats, regardless of the diet or time on diet, were less able to control serum glucose up to 120 minutes post glucose challenge. Interestingly, ZF rats fed a HFD for 2 weeks showed decreased insulin production relative to chow-fed animals (Figure 1).
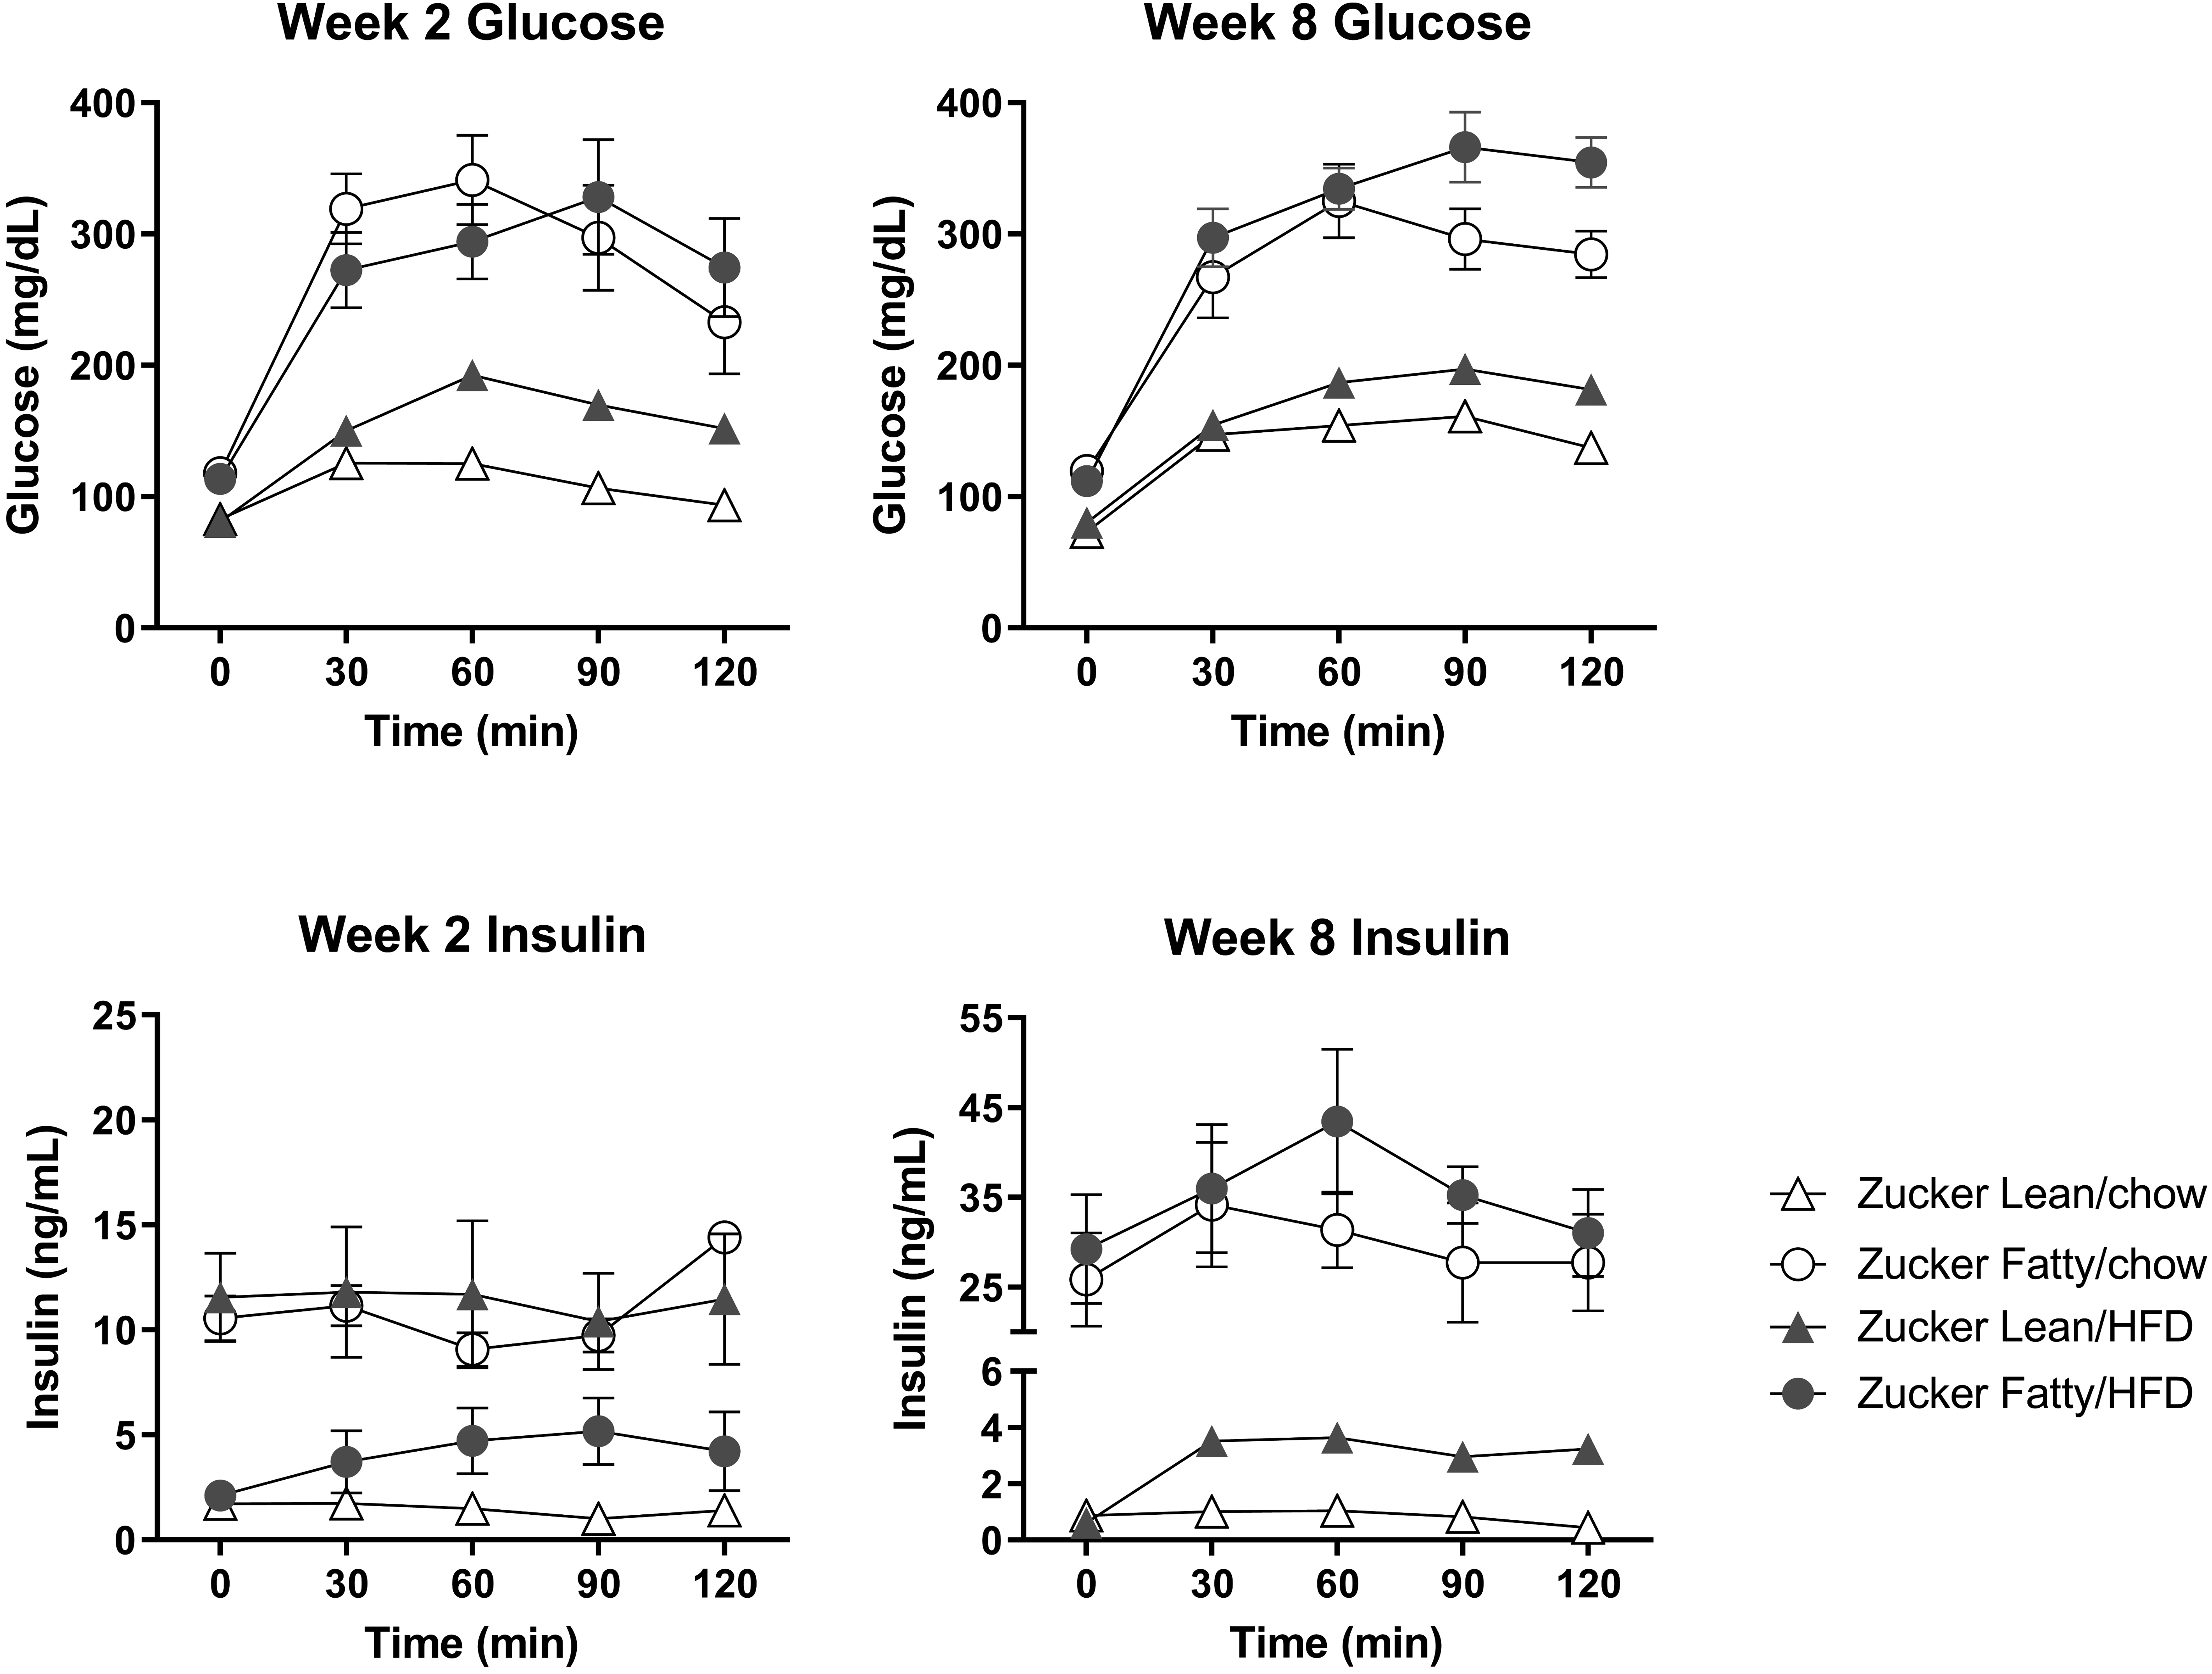
Serum glucose and insulin levels were monitored post oral glucose challenge in Zucker Lean and Zucker Fatty rats after 2 or 8 weeks on HFD or normal chow. Data are expressed as mean ± SEM (n = 5/group/time point). HFD indicates high fat diet; SEM, standard error of the mean.
Since hyperinsulinemia is likely the driver of hepatic steatosis in asymptomatic metabolic syndrome, 38,39 we next quantified the amount of hepatic steatosis using adipophilin staining (Figure 2). In chow-fed ZL rats, adipophilin staining was very low and showed a mild significant increase with HFD at 8 weeks (Figures 2 and 3A). In contrast, in ZF rats regardless of diet, adipophilin staining was very intense and overall significantly higher compared with ZL rats on either diet (Figures 2 and 3A). Representative hepatic photomicrographs (Figure 3B) indicate mild, mixed micro-, and macrovesicular hepatic steatosis localized to the periphery of hepatocytes without alterations in cell size in HFD-fed ZL rats, while moderate to severe, unilocular large vacuoles with increased cell size and occasionally displaced nuclei were evident in HFD-fed ZF rats (Figure 3A and B).
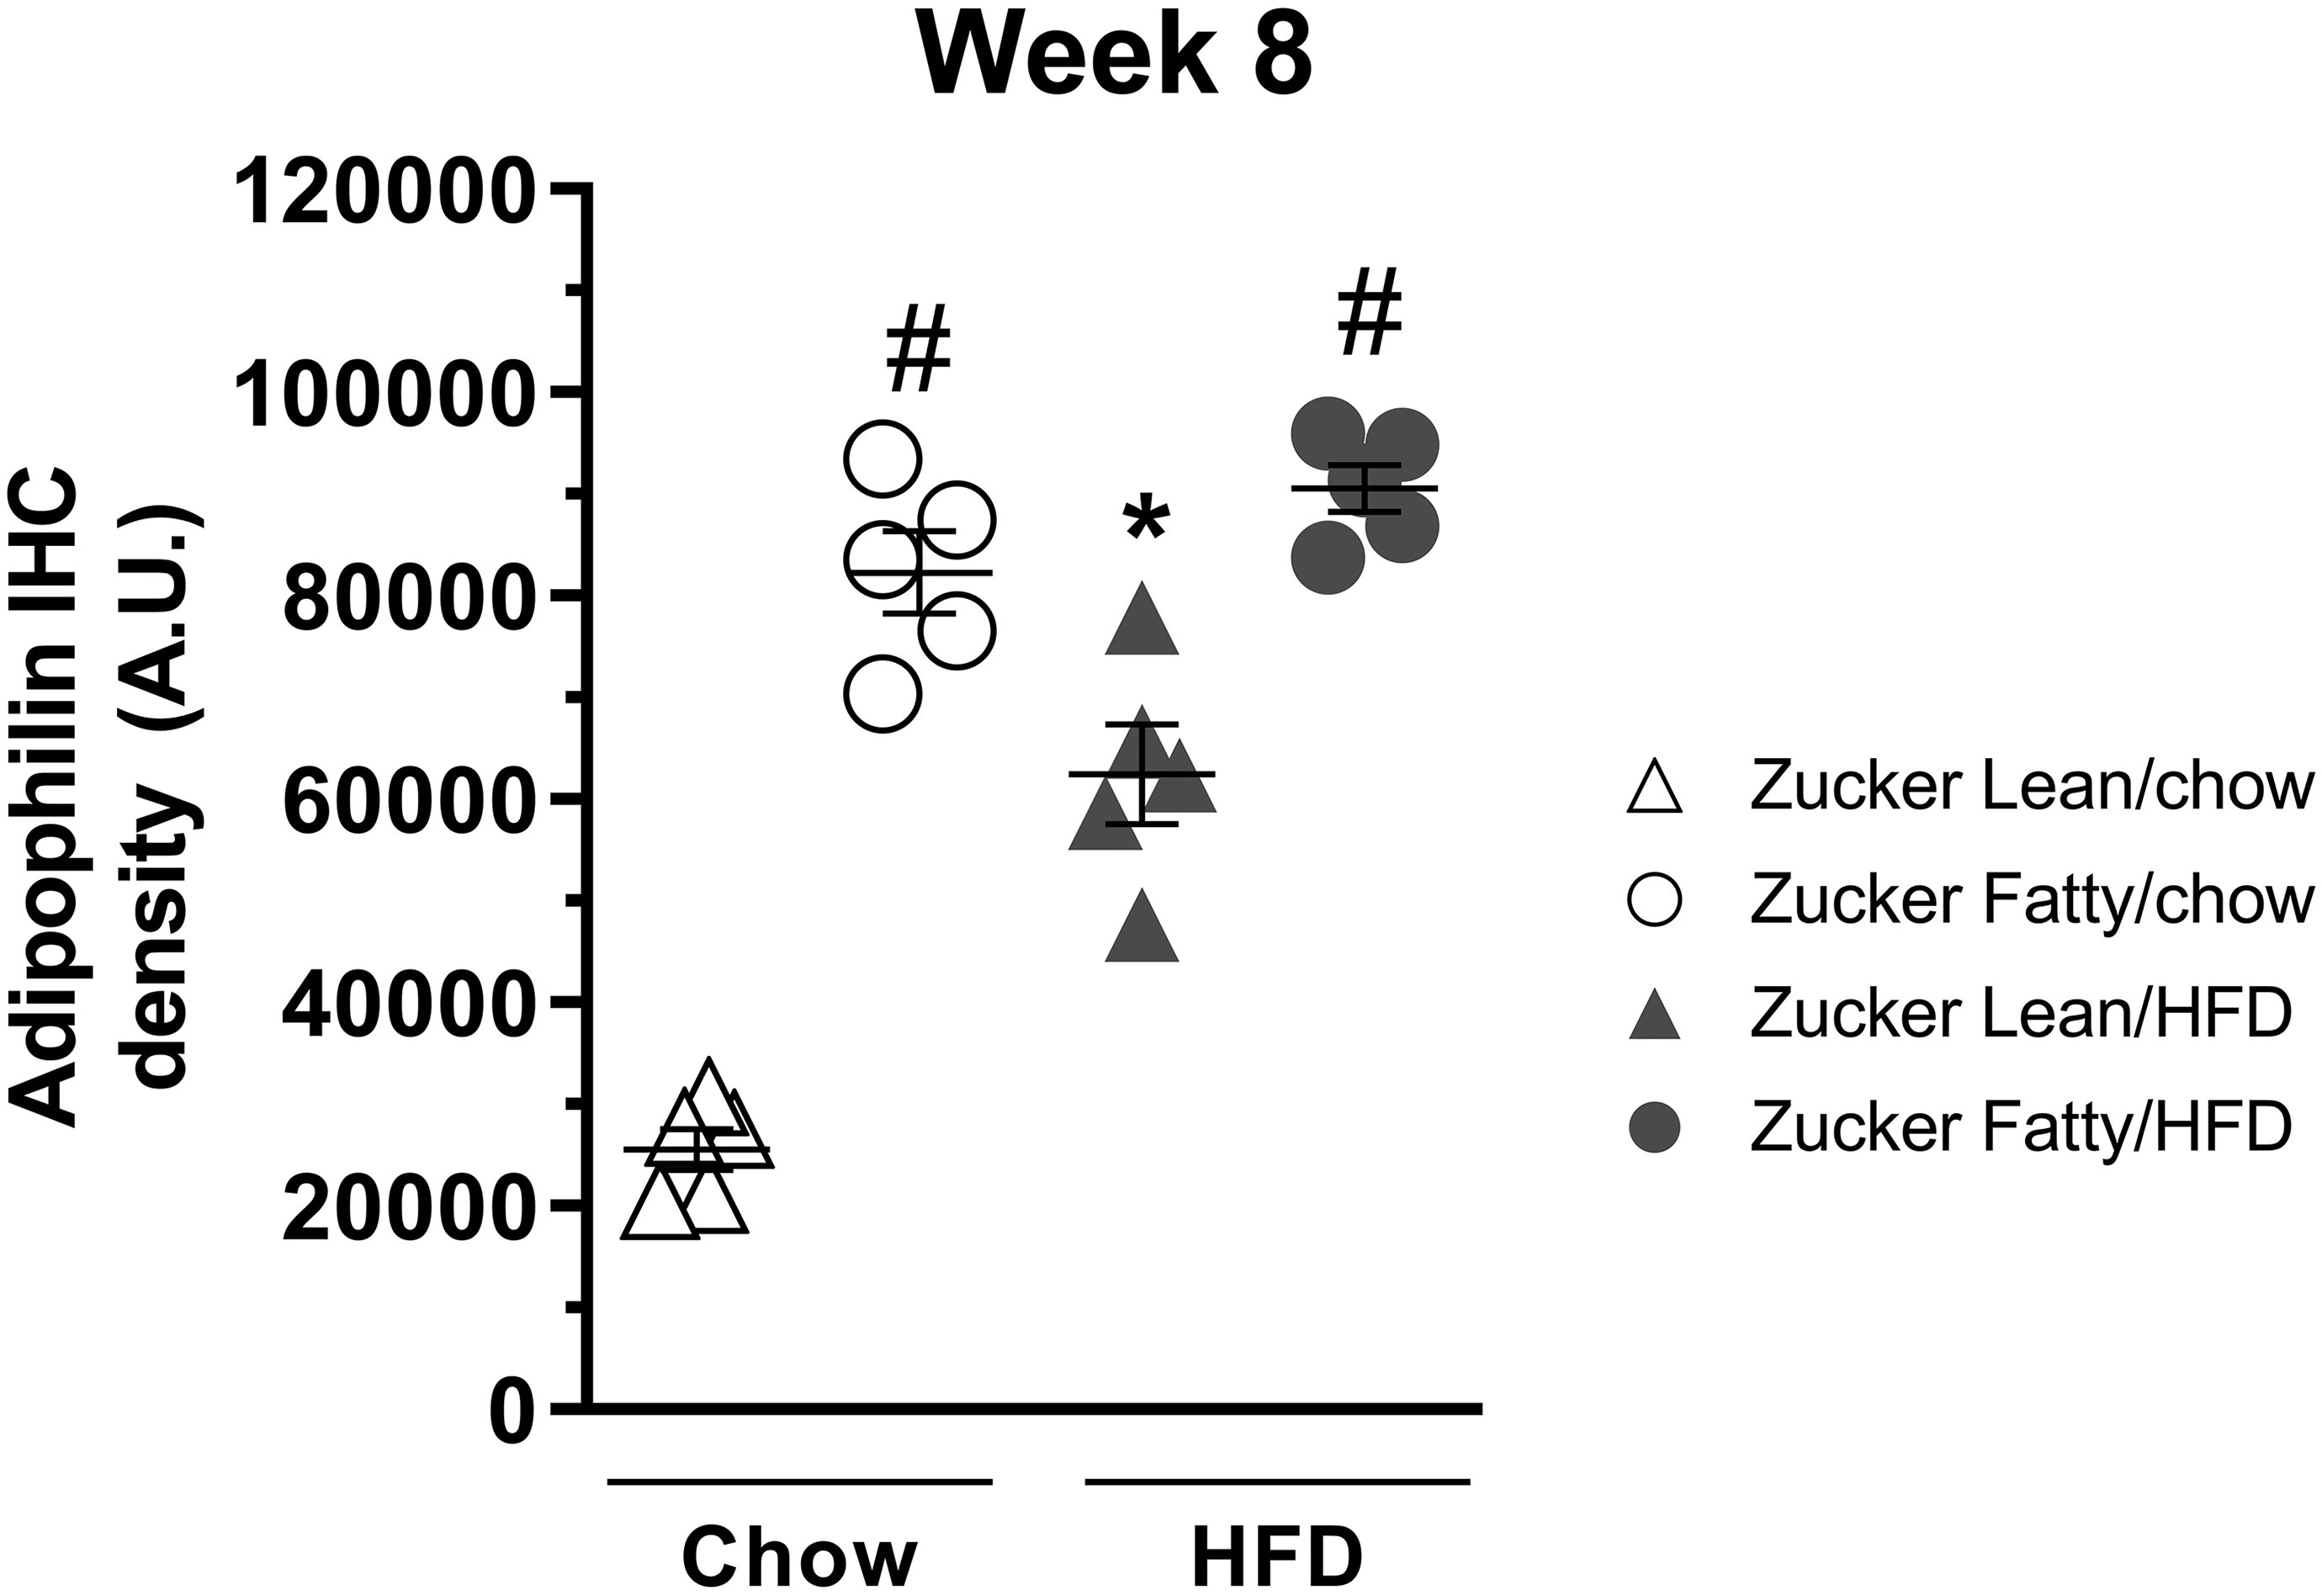
Quantitative analysis of adipophilin IHC staining at 8 weeks. The brightfield images were acquired using Vectra multispectral system with a Nuance camera, which enables imaging across the light spectrum (420-720 nm). The brightfield images were converted to OD; and IHC signal was spectrally unmixed to isolate the specific validated stain signal component (ie, 3,3′-diaminobenzidine, DAB), where the increased staining density corresponded with higher OD units (arbitrary values). The graph represents the sum of all OD units for individual spectrally unmixed pixels across the entire tissue area. Data are expressed as mean ± SEM (n = 5/group). *P < .05 versus chow-fed rats of the same strain; # P < .05 versus Zucker Lean rats on the same diet. IHC indicates immunohistochemical; OD, optical density; SEM, standard error of the mean.
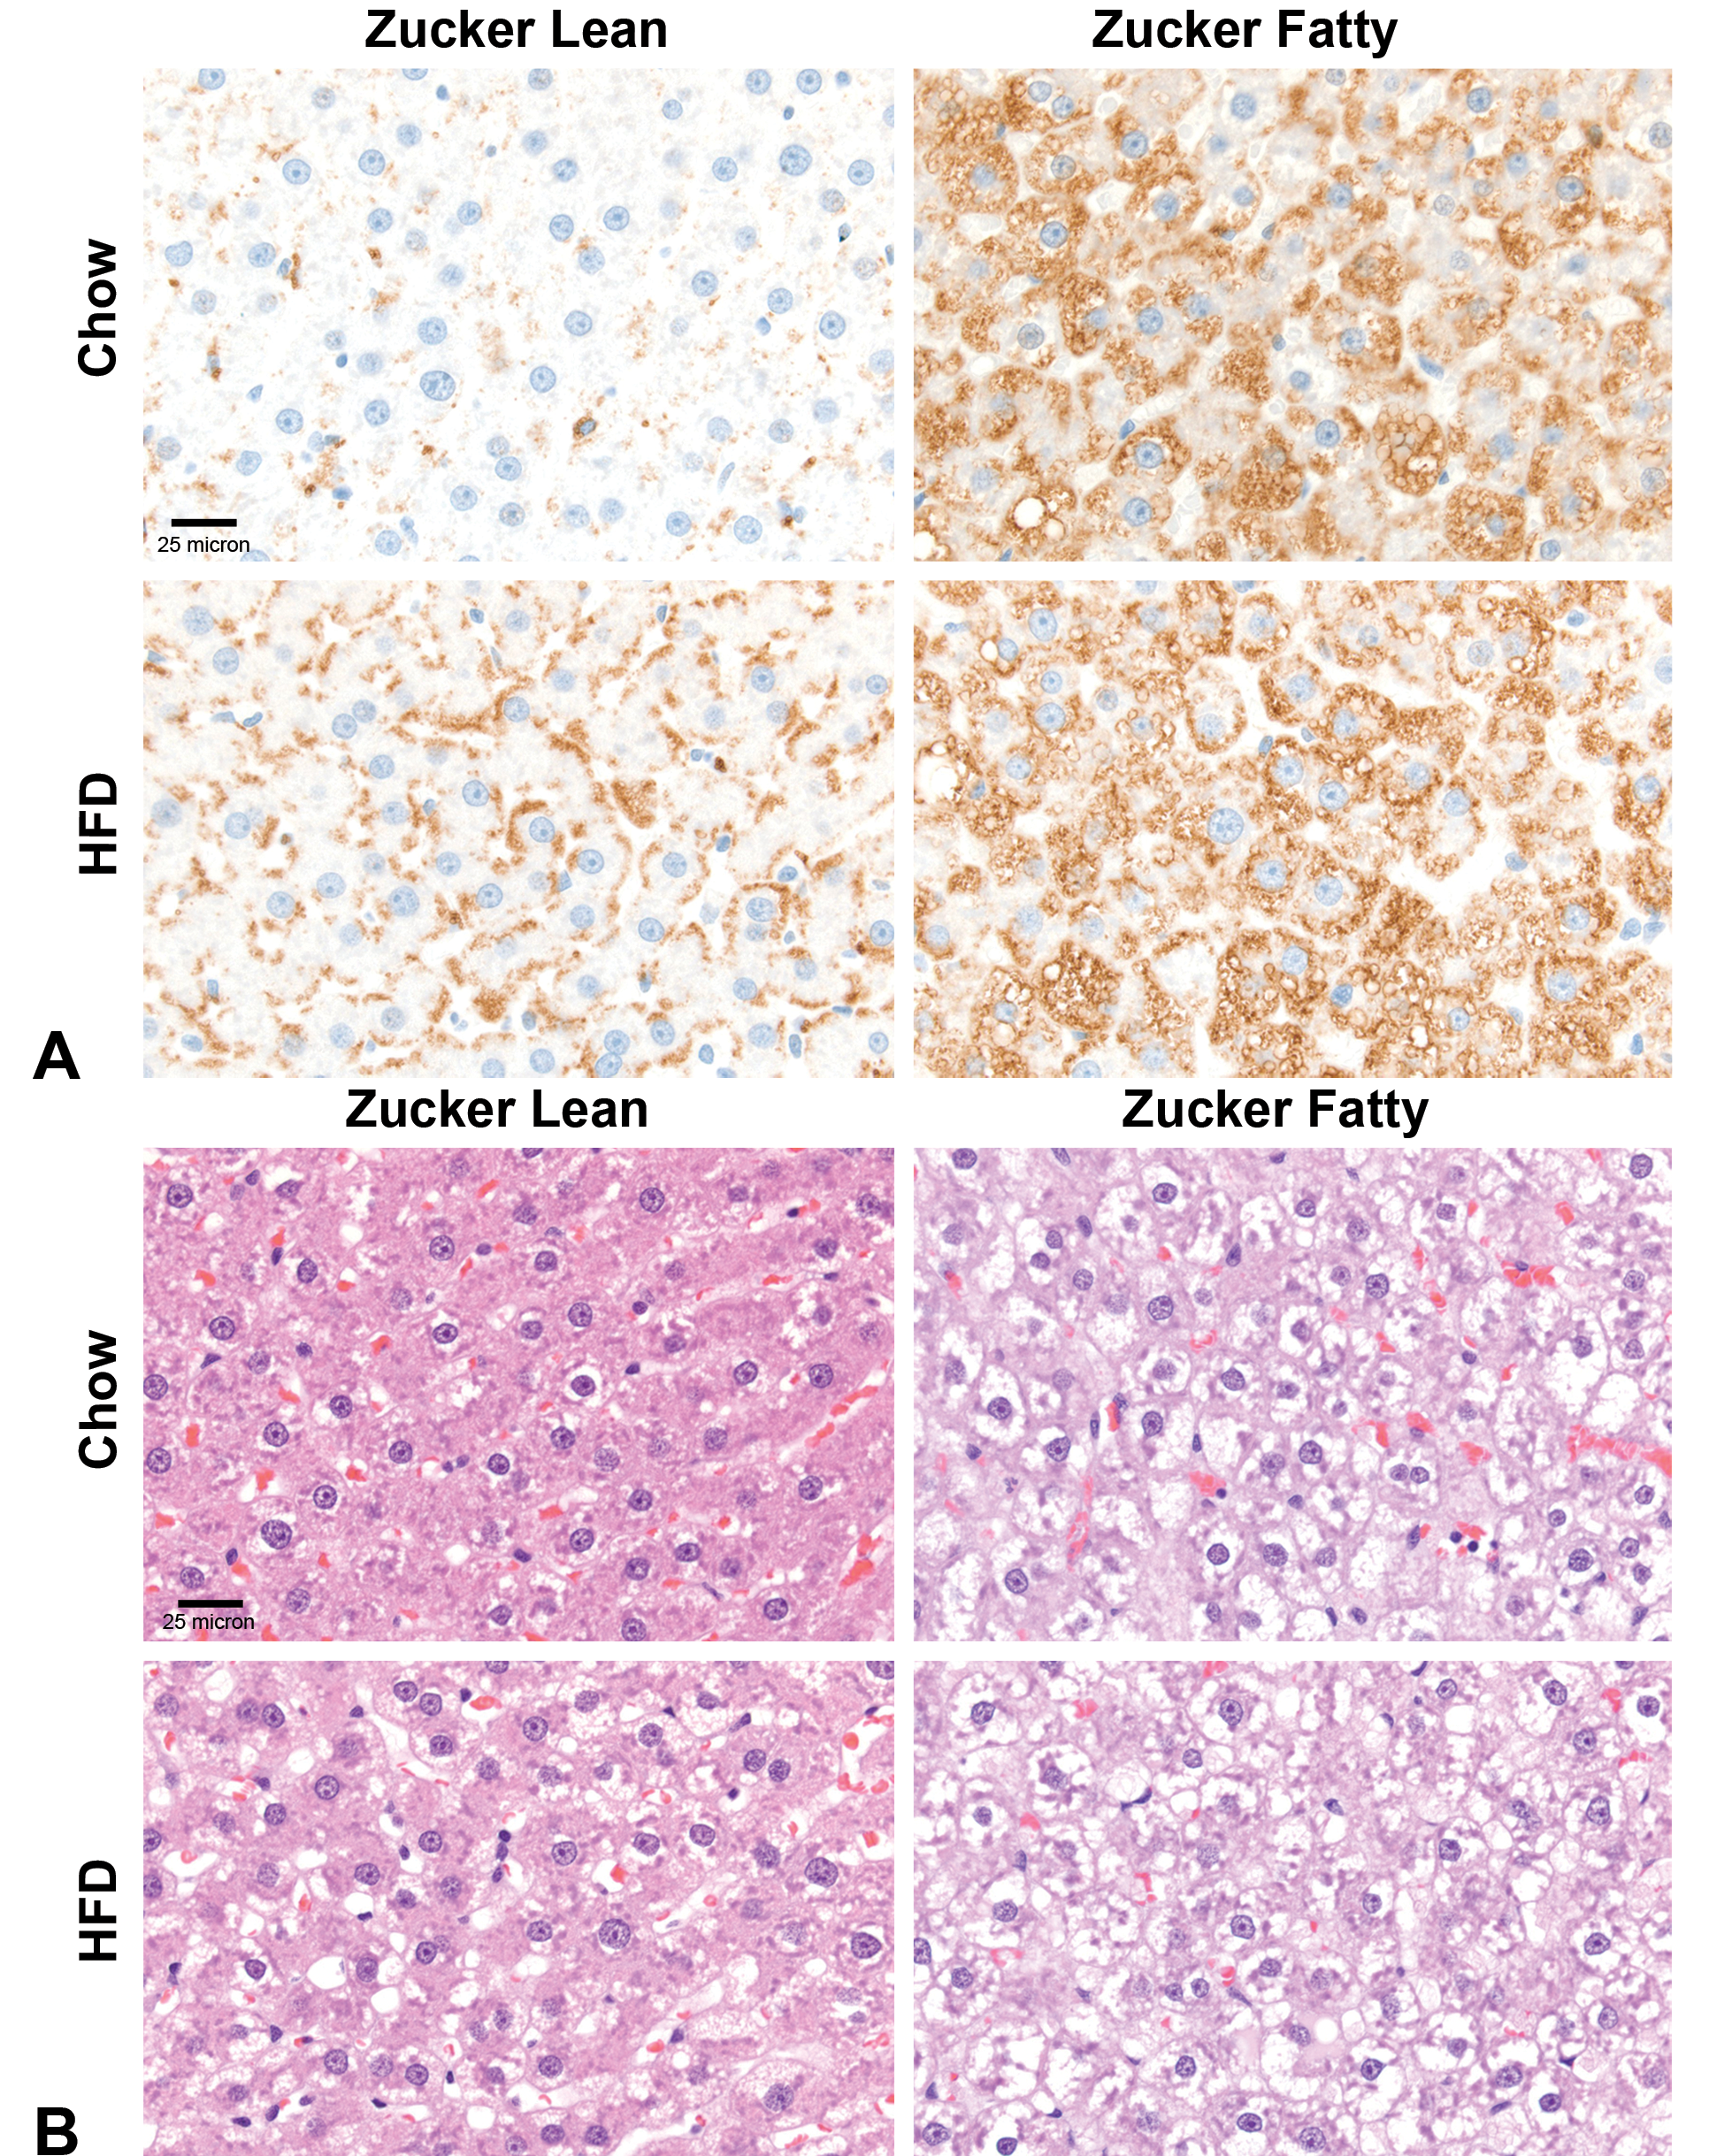
Assessment of hepatic steatosis in Zucker Lean and Zucker Fatty rats after 8 weeks on HFD or normal chow. A, Representative adipophilin immunohistochemical staining. B, Representative photomicrographs of hepatic H&E staining. H&E indicates hematoxylin and eosin; HFD, high fat diet.
Next, we compared serum lipid profile and liver injury biomarkers between both strains and diets. Zucker Lean rats fed a HFD for 2 or 8 weeks had very minimal increases in serum triglycerides and cholesterol when compared with chow-fed controls (Figure 4). In contrast, ZF rats, irrespective of time or diet, exhibited significantly higher levels of cholesterol and triglycerides compared with ZL rats on either diet. Markers of liver injury (ALT and GLDH) were not significantly changed in HFD-fed ZL rats compared to ZL rats fed normal chow (Figure 5). In contrast, ZF rats exhibited significantly higher levels of ALT compared with ZL rats on either diet at both 2 and 8 weeks as well as significantly elevated GLDH levels on HFD at 8 weeks (Figure 5).
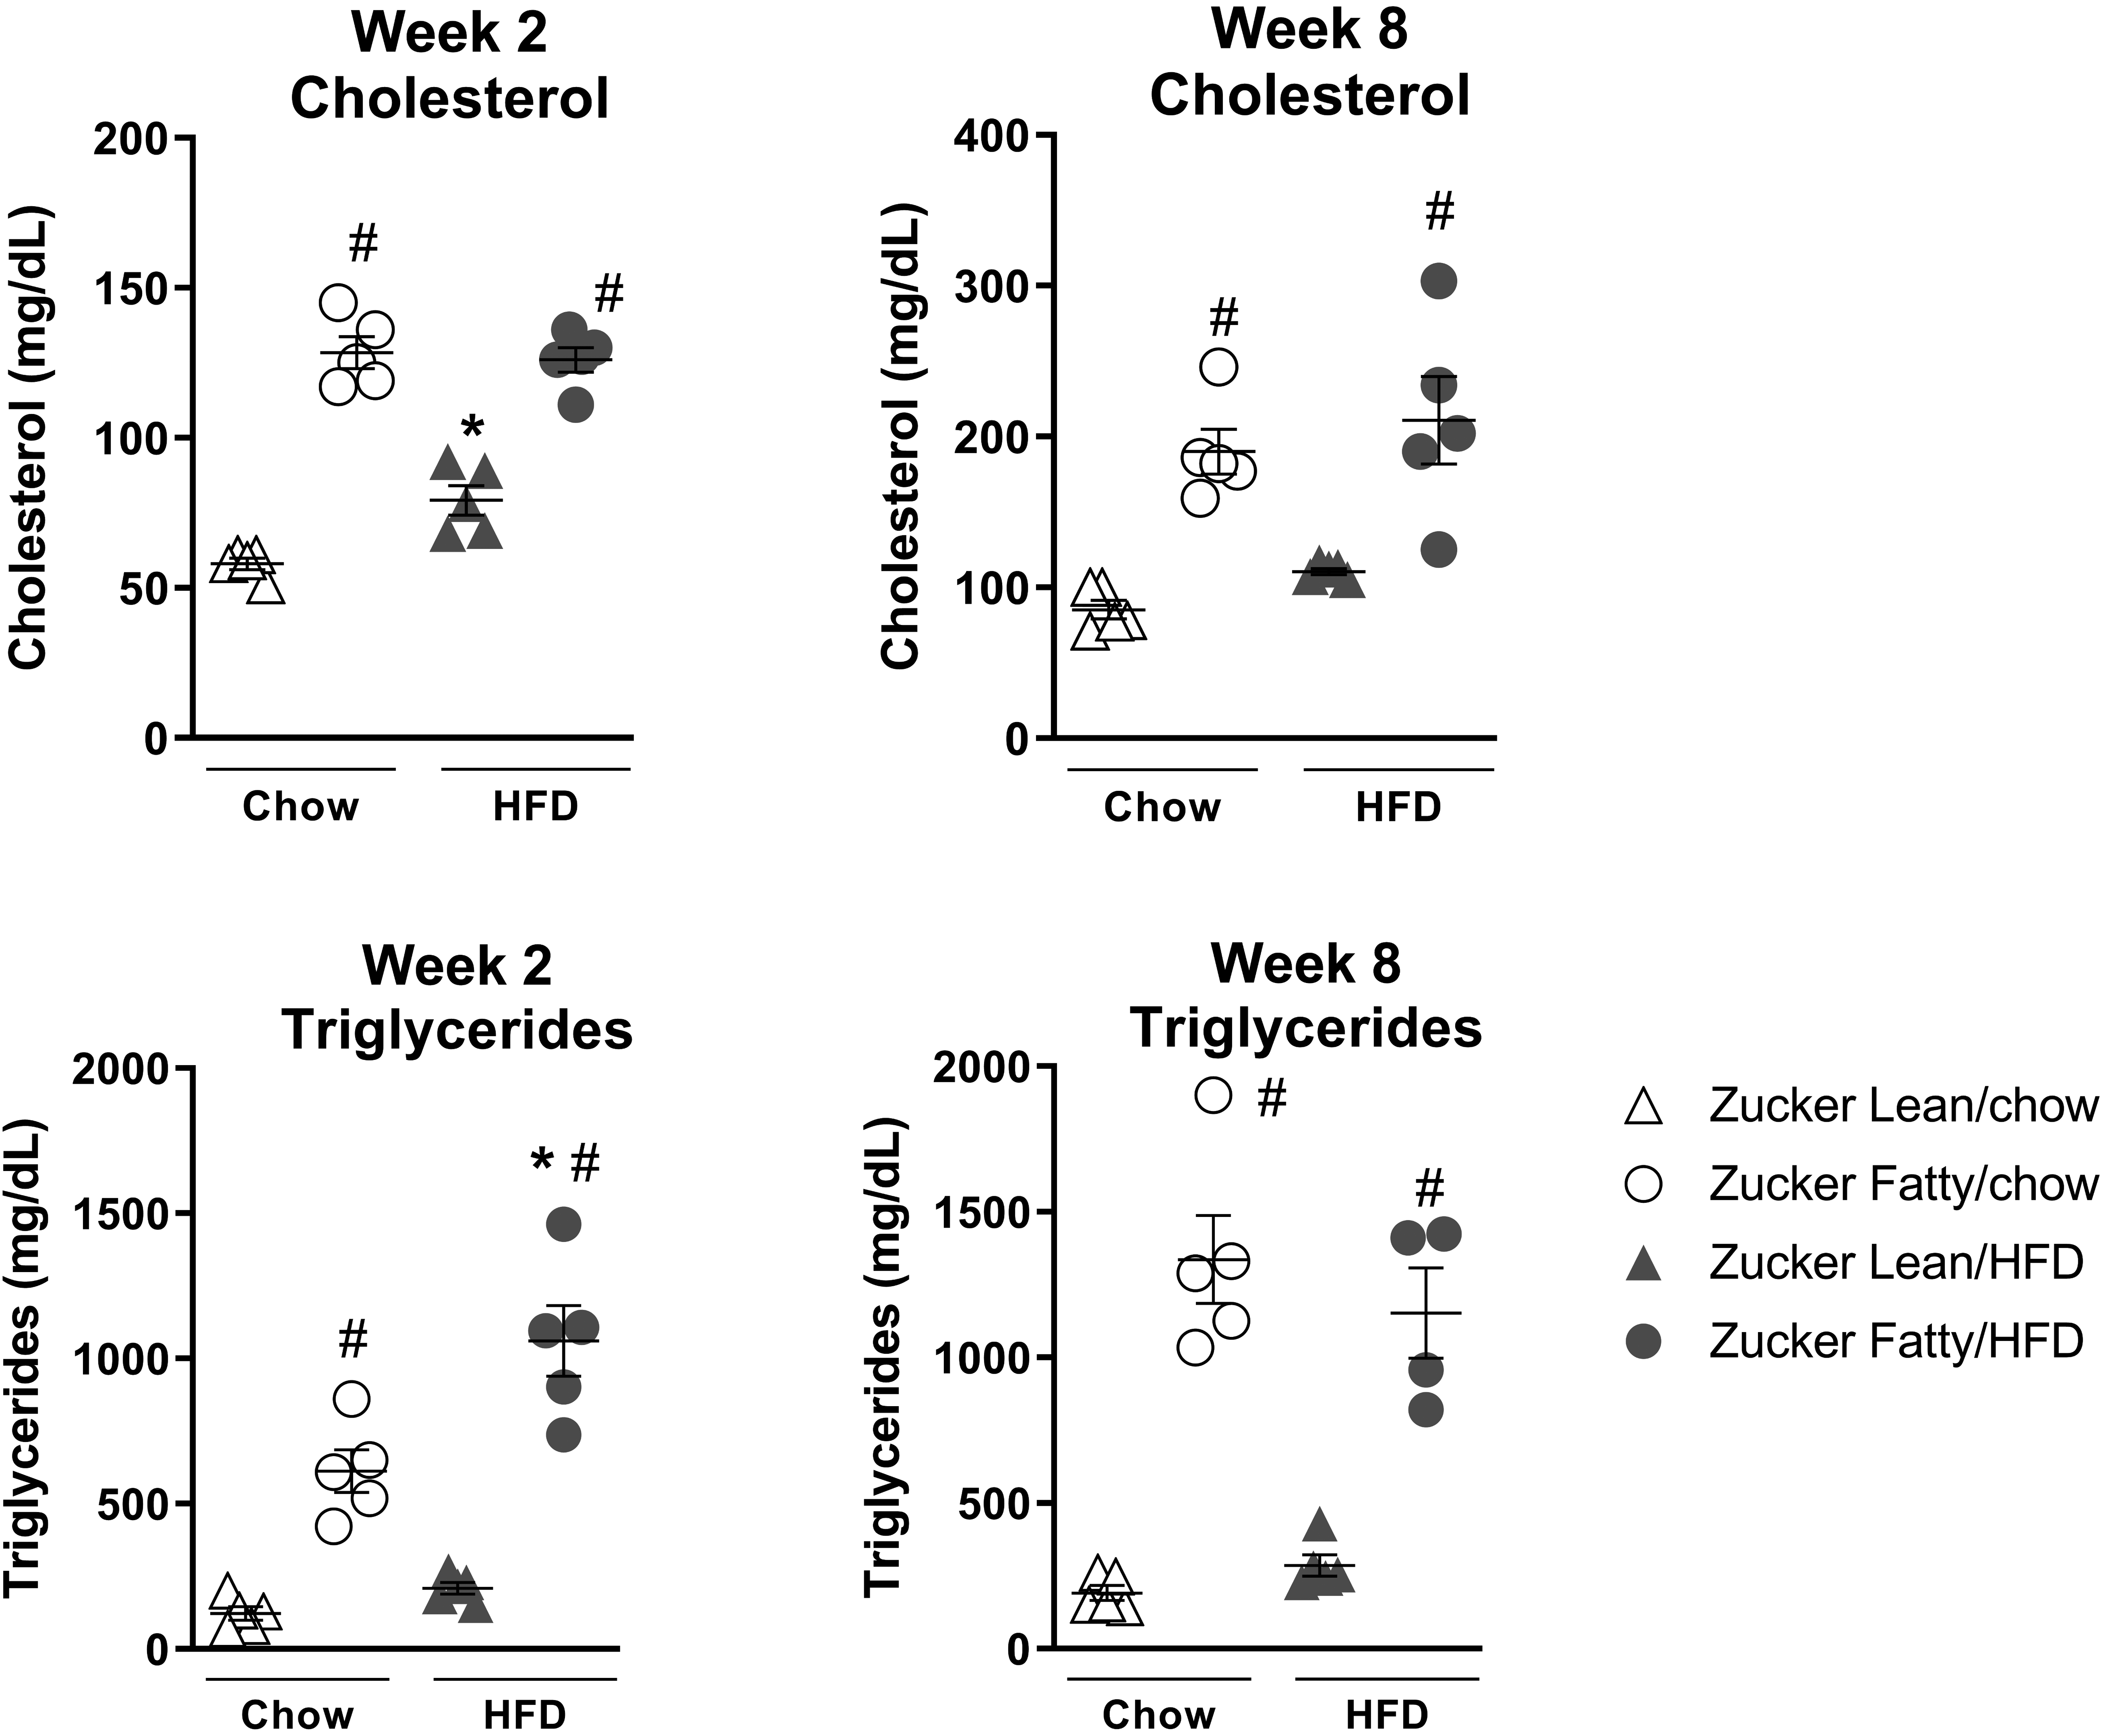
Serum cholesterol and triglyceride profile in Zucker Lean and Zucker Fatty rats after 2 or 8 weeks on HFD or normal chow. Data are expressed as mean ± SEM (n = 5/group). *P < .05 versus chow-fed rats of the same strain; # P < .05 versus Zucker Lean rats on the same diet. HFD indicates high fat diet; SEM, standard error of the mean.
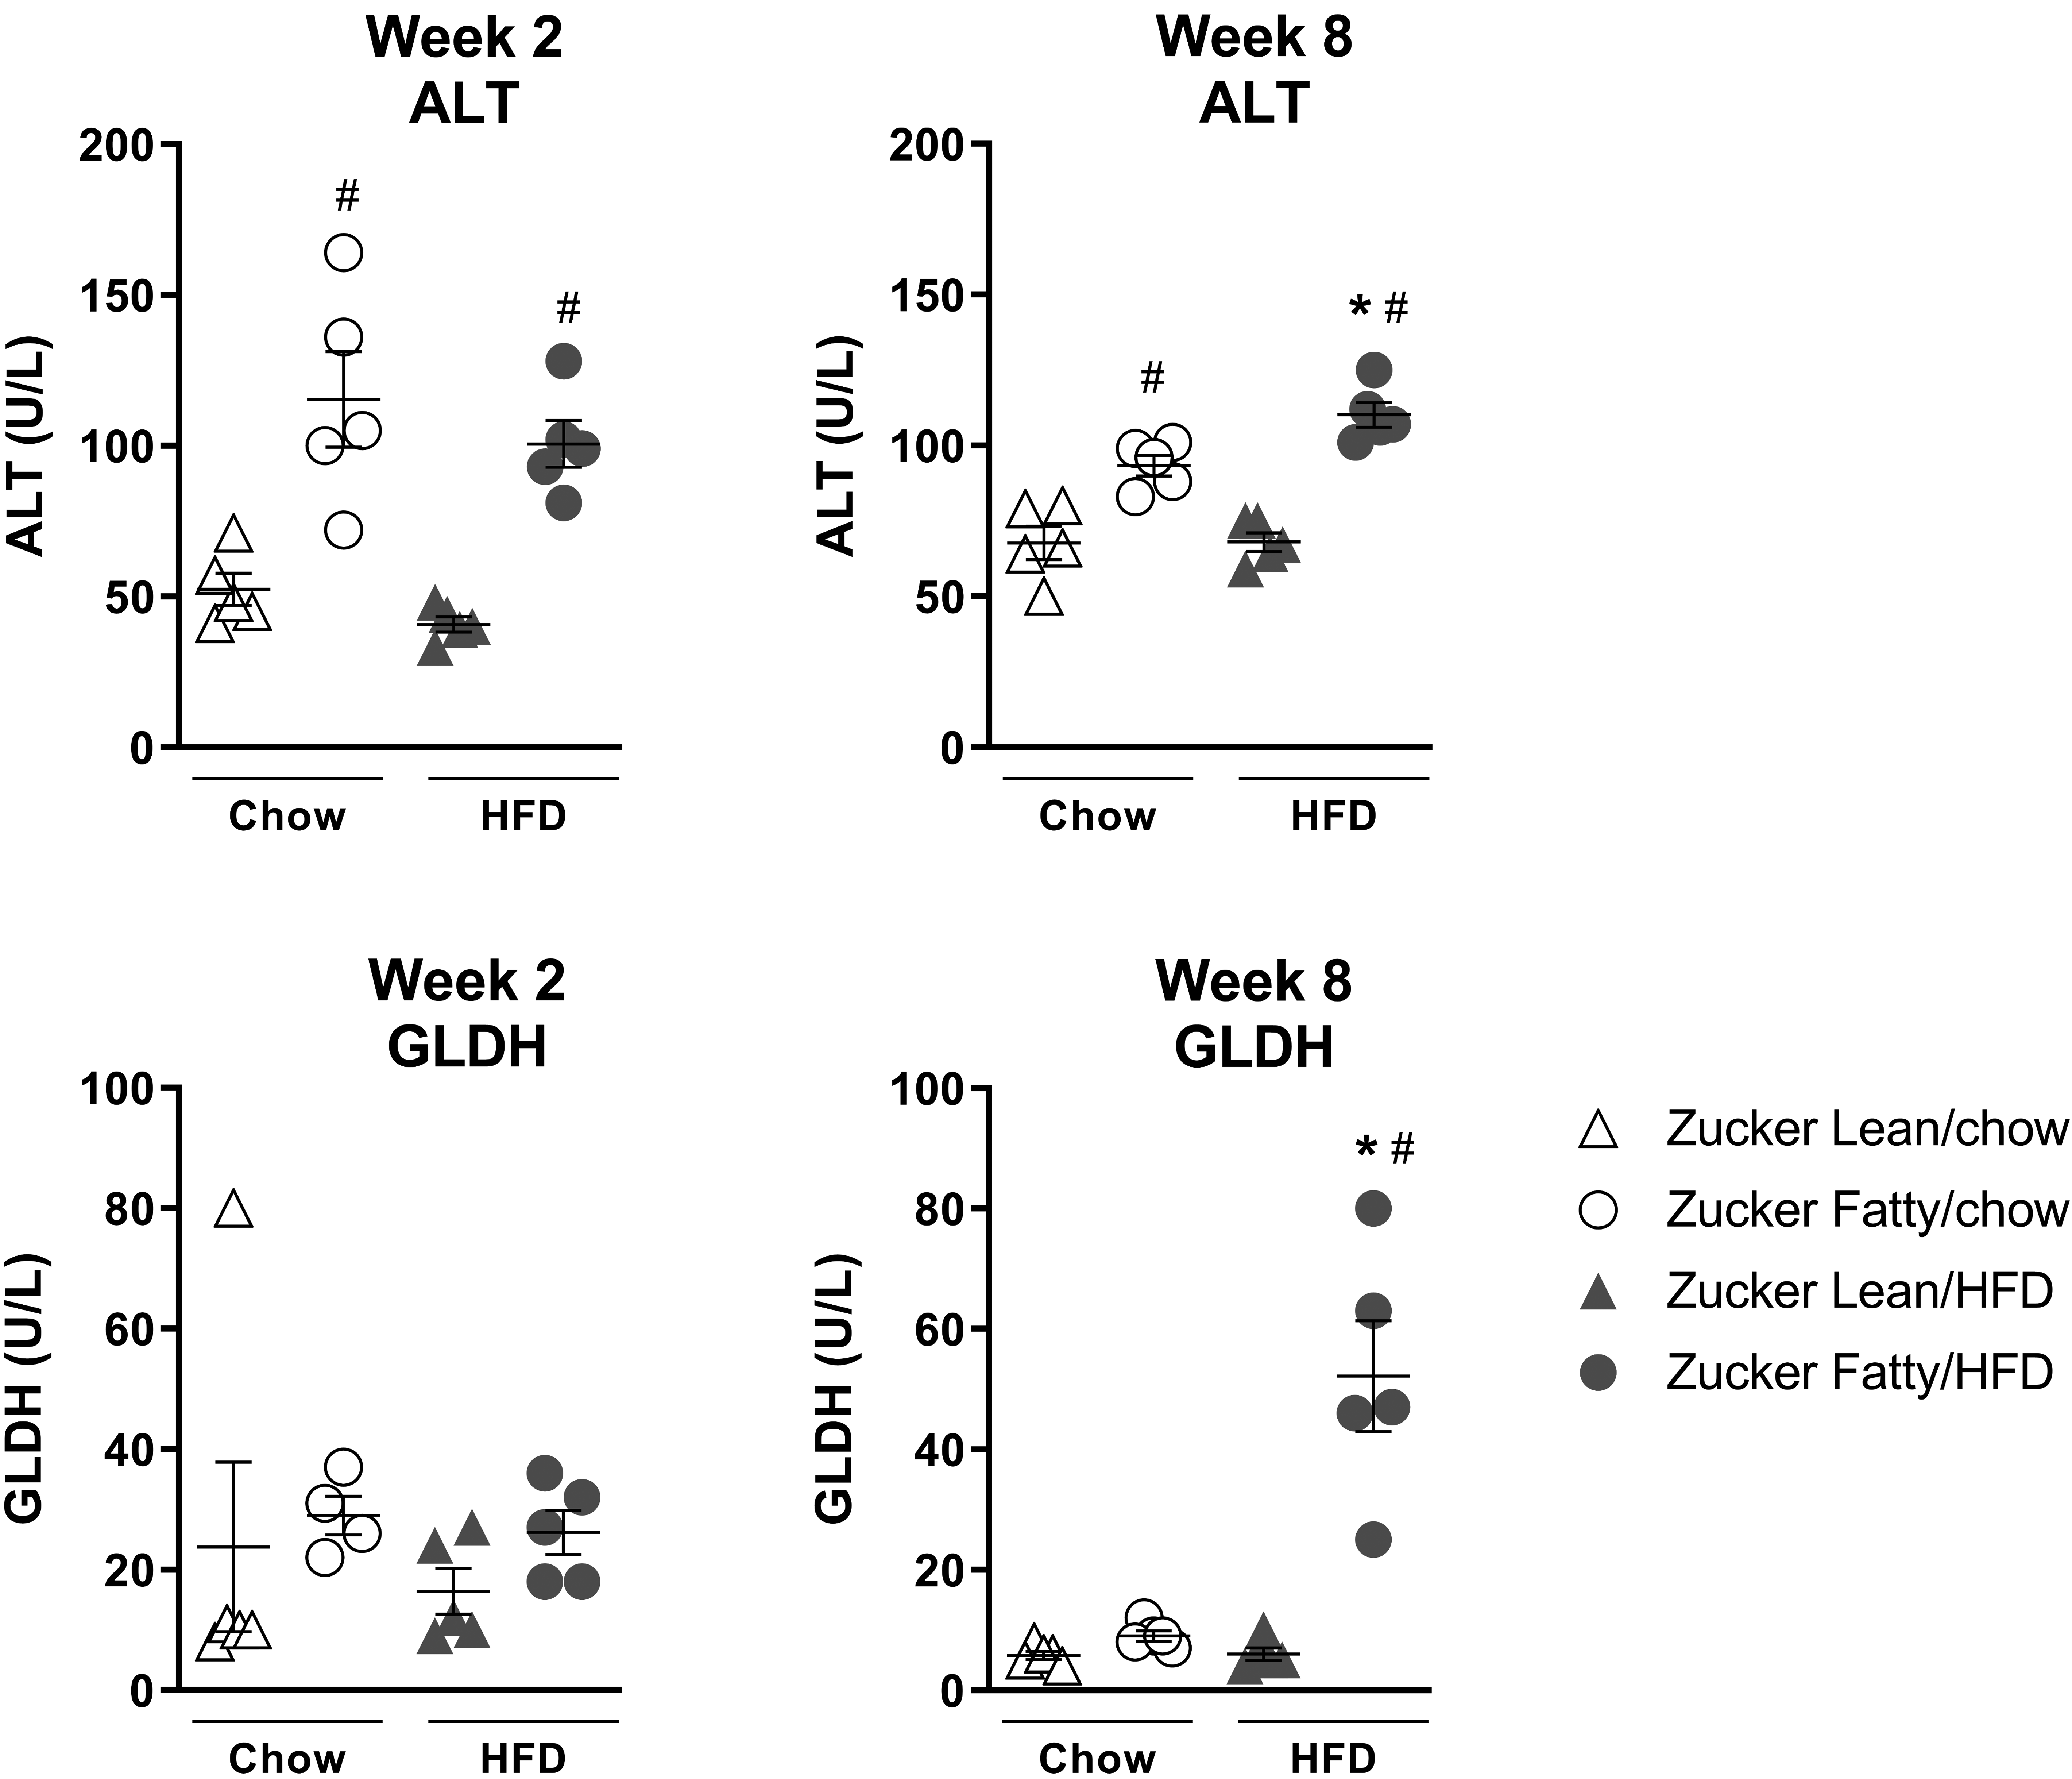
Serum liver injury enzyme profile of ALT and GLDH in Zucker Lean and Zucker Fatty rats after 2 or 8 weeks on HFD or normal chow. Data are expressed as mean ± SEM (n = 5/group). *P < .05 versus chow-fed rats of the same strain; # P < .05 versus Zucker Lean rats on the same diet. ALT indicates alanine aminotransferase; GLDH, glutamate dehydrogenase; HFD, high fat diet; SEM, standard error of the mean.
Zucker Lean Rats With Hepatic Steatosis Are More Sensitive to DILI
Zucker Lean rats fed a HFD for either 2 or 8 weeks effectively recapitulate certain components of early metabolic syndrome, that is, mild hepatic steatosis, compensatory hyperinsulinemia, and normal plasma lipid and liver injury enzyme profiles. Next, we tested the hypothesis that the presence of hepatic steatosis increases susceptibility to DILI by comparing HFD-fed ZL rats (for 2 or 8 weeks) to SD rats fed normal chow, the standard nonclinical in vivo toxicology rodent model widely used in the pharmaceutical industry. Both groups were administered up to 1400 mg/kg APAP by oral gavage for 7 days to elicit hepatic injury. At doses ≥800 mg/kg, HFD-fed ZL rats had higher ALT and GLDH levels compared with APAP-treated chow-fed SD rats (Figure 6). Importantly, bridging hepatic necrosis and sinusoidal congestion was only evident in APAP-treated HFD-fed ZL rats (Figure 7A) and was associated with higher incidence and severity of liver necrosis compared with APAP-treated chow-fed SD rats (Figure 7B).
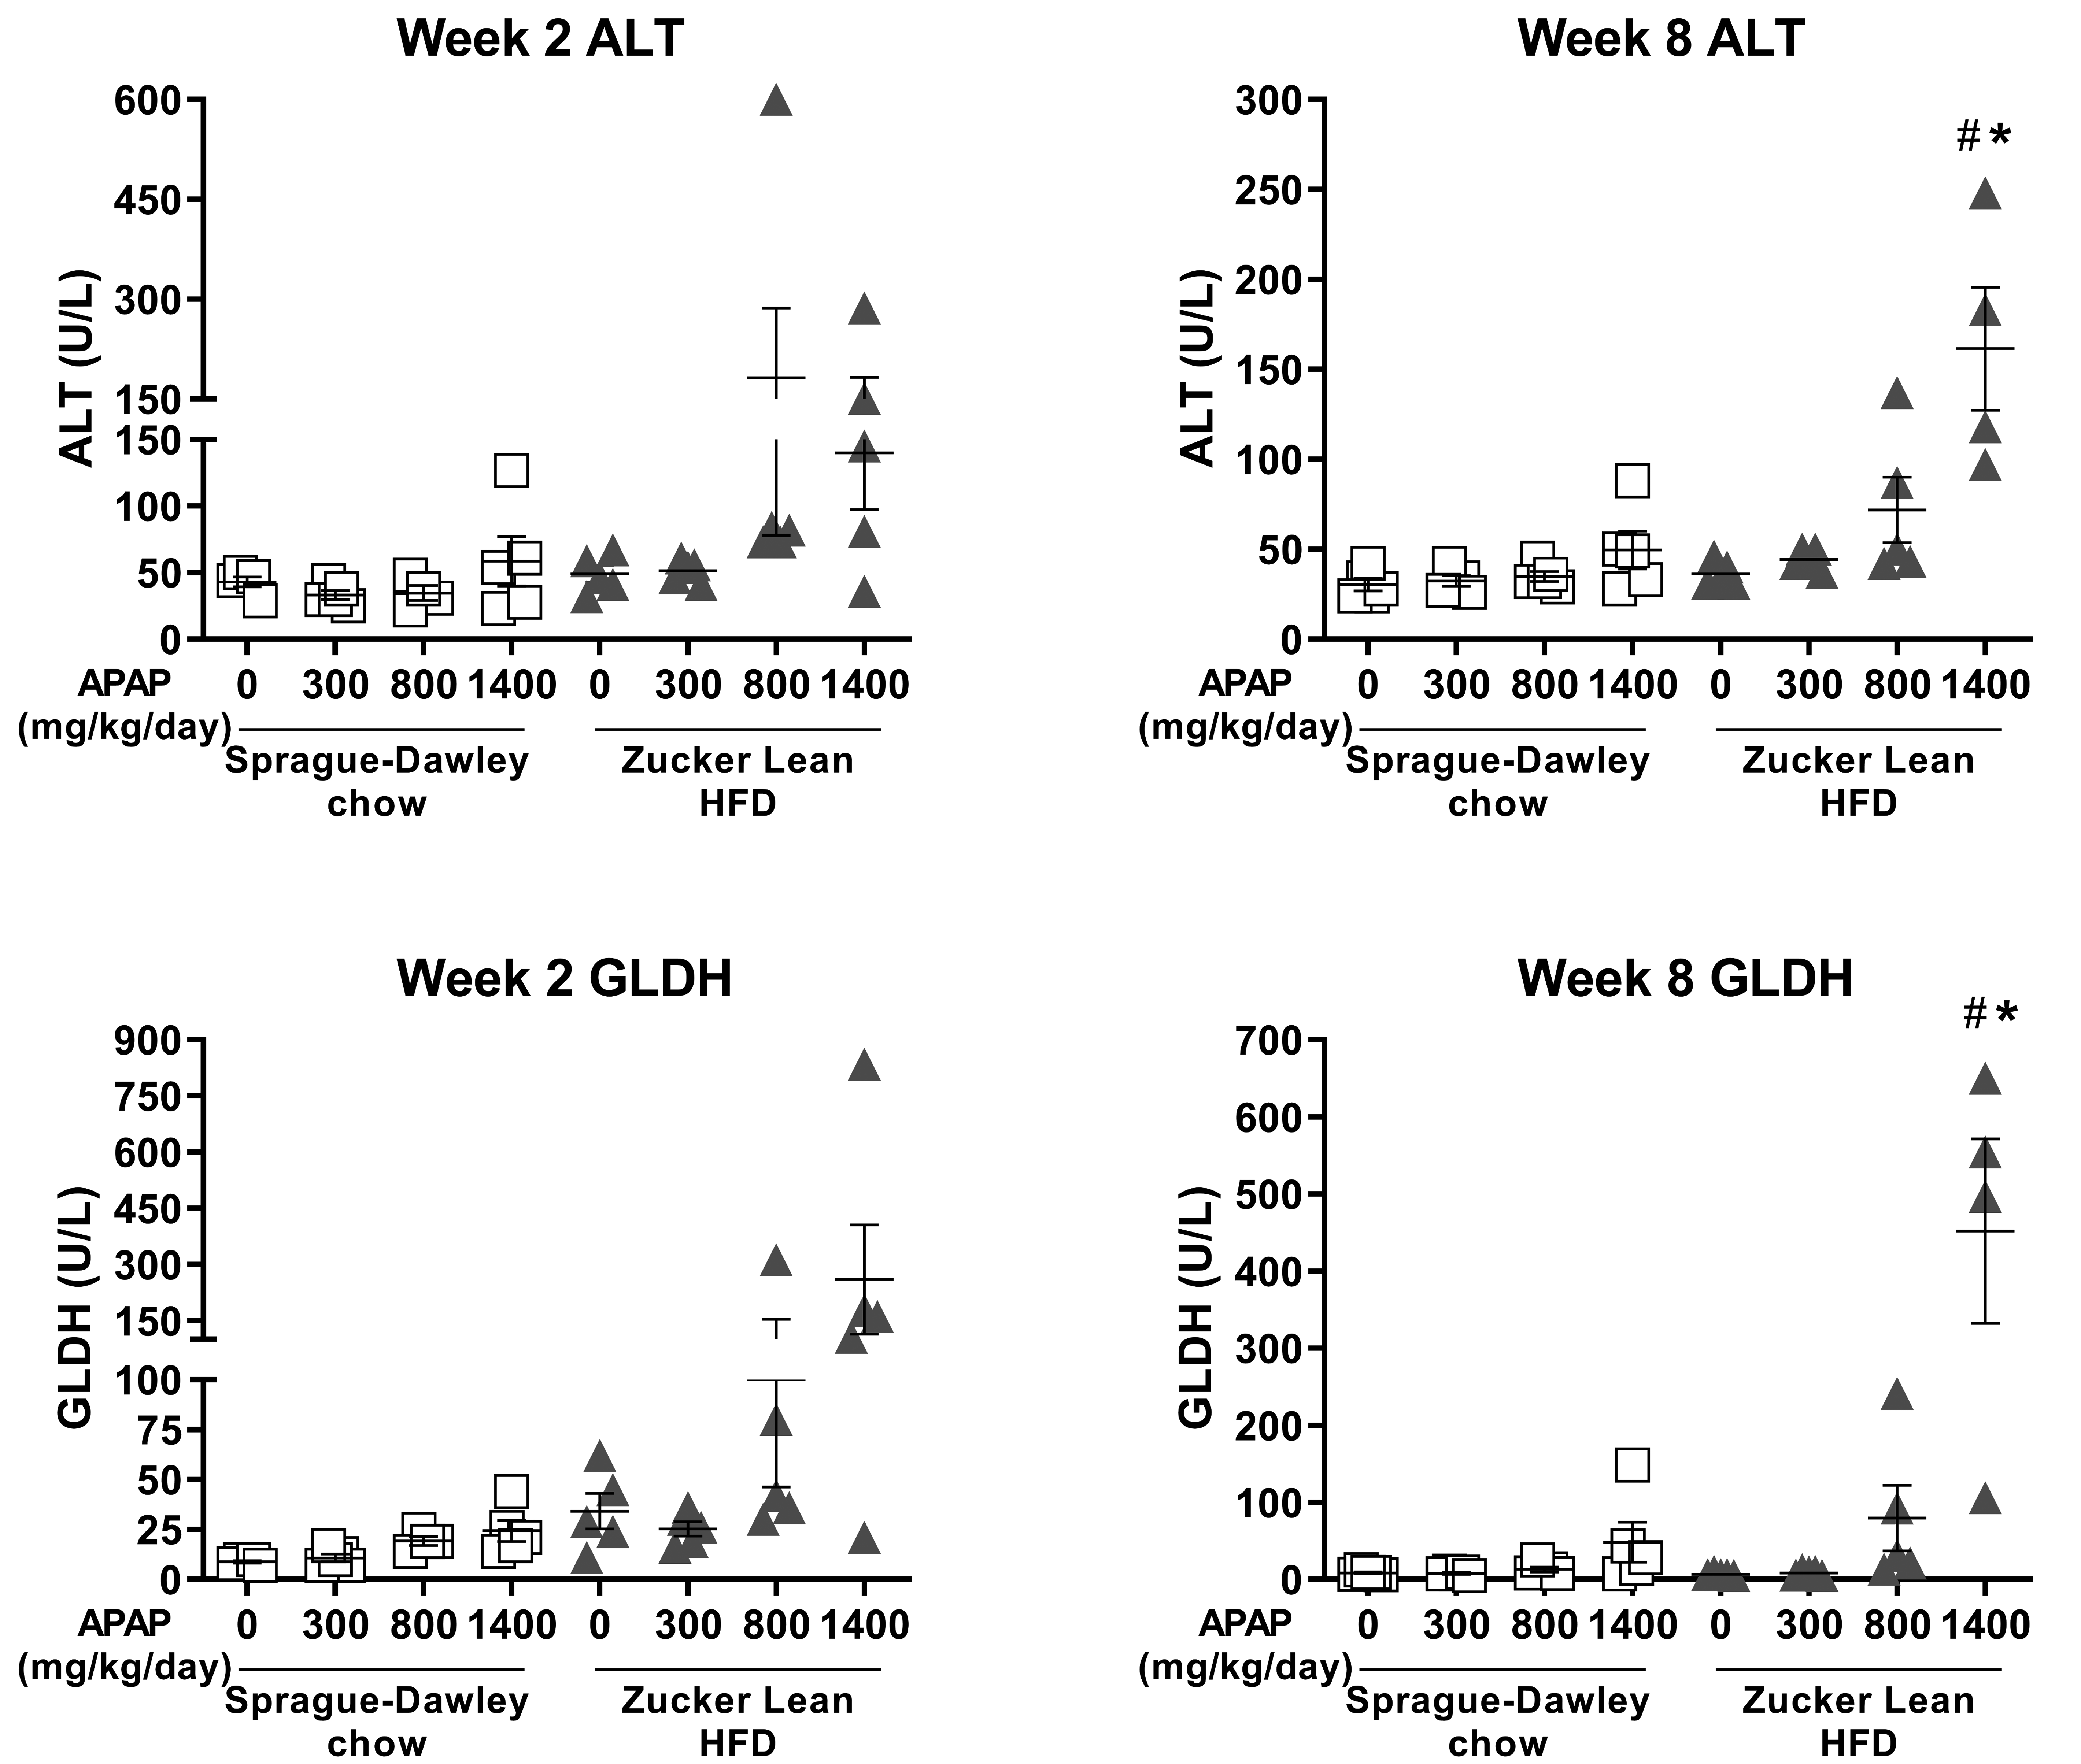
Serum liver injury enzyme profile of ALT and GLDH in Sprague-Dawley and Zucker Lean rats administered daily with vehicle (0 mg/kg) or 300, 800, or 1400 mg/kg APAP for 7 days. Prior to APAP administration, Zucker Lean rats were fed a HFD for 2 or 8 weeks. Data are expressed as mean ± SEM (n = 4-5/group). *P < .05 versus vehicle rats of the same strain; # P < .05 versus 1400 mg/kg APAP in Sprague-Dawley rats fed chow. ALT indicates alanine aminotransferase; APAP, acetaminophen; GLDH, glutamate dehydrogenase; HFD, high fat diet; SEM, standard error of the mean.
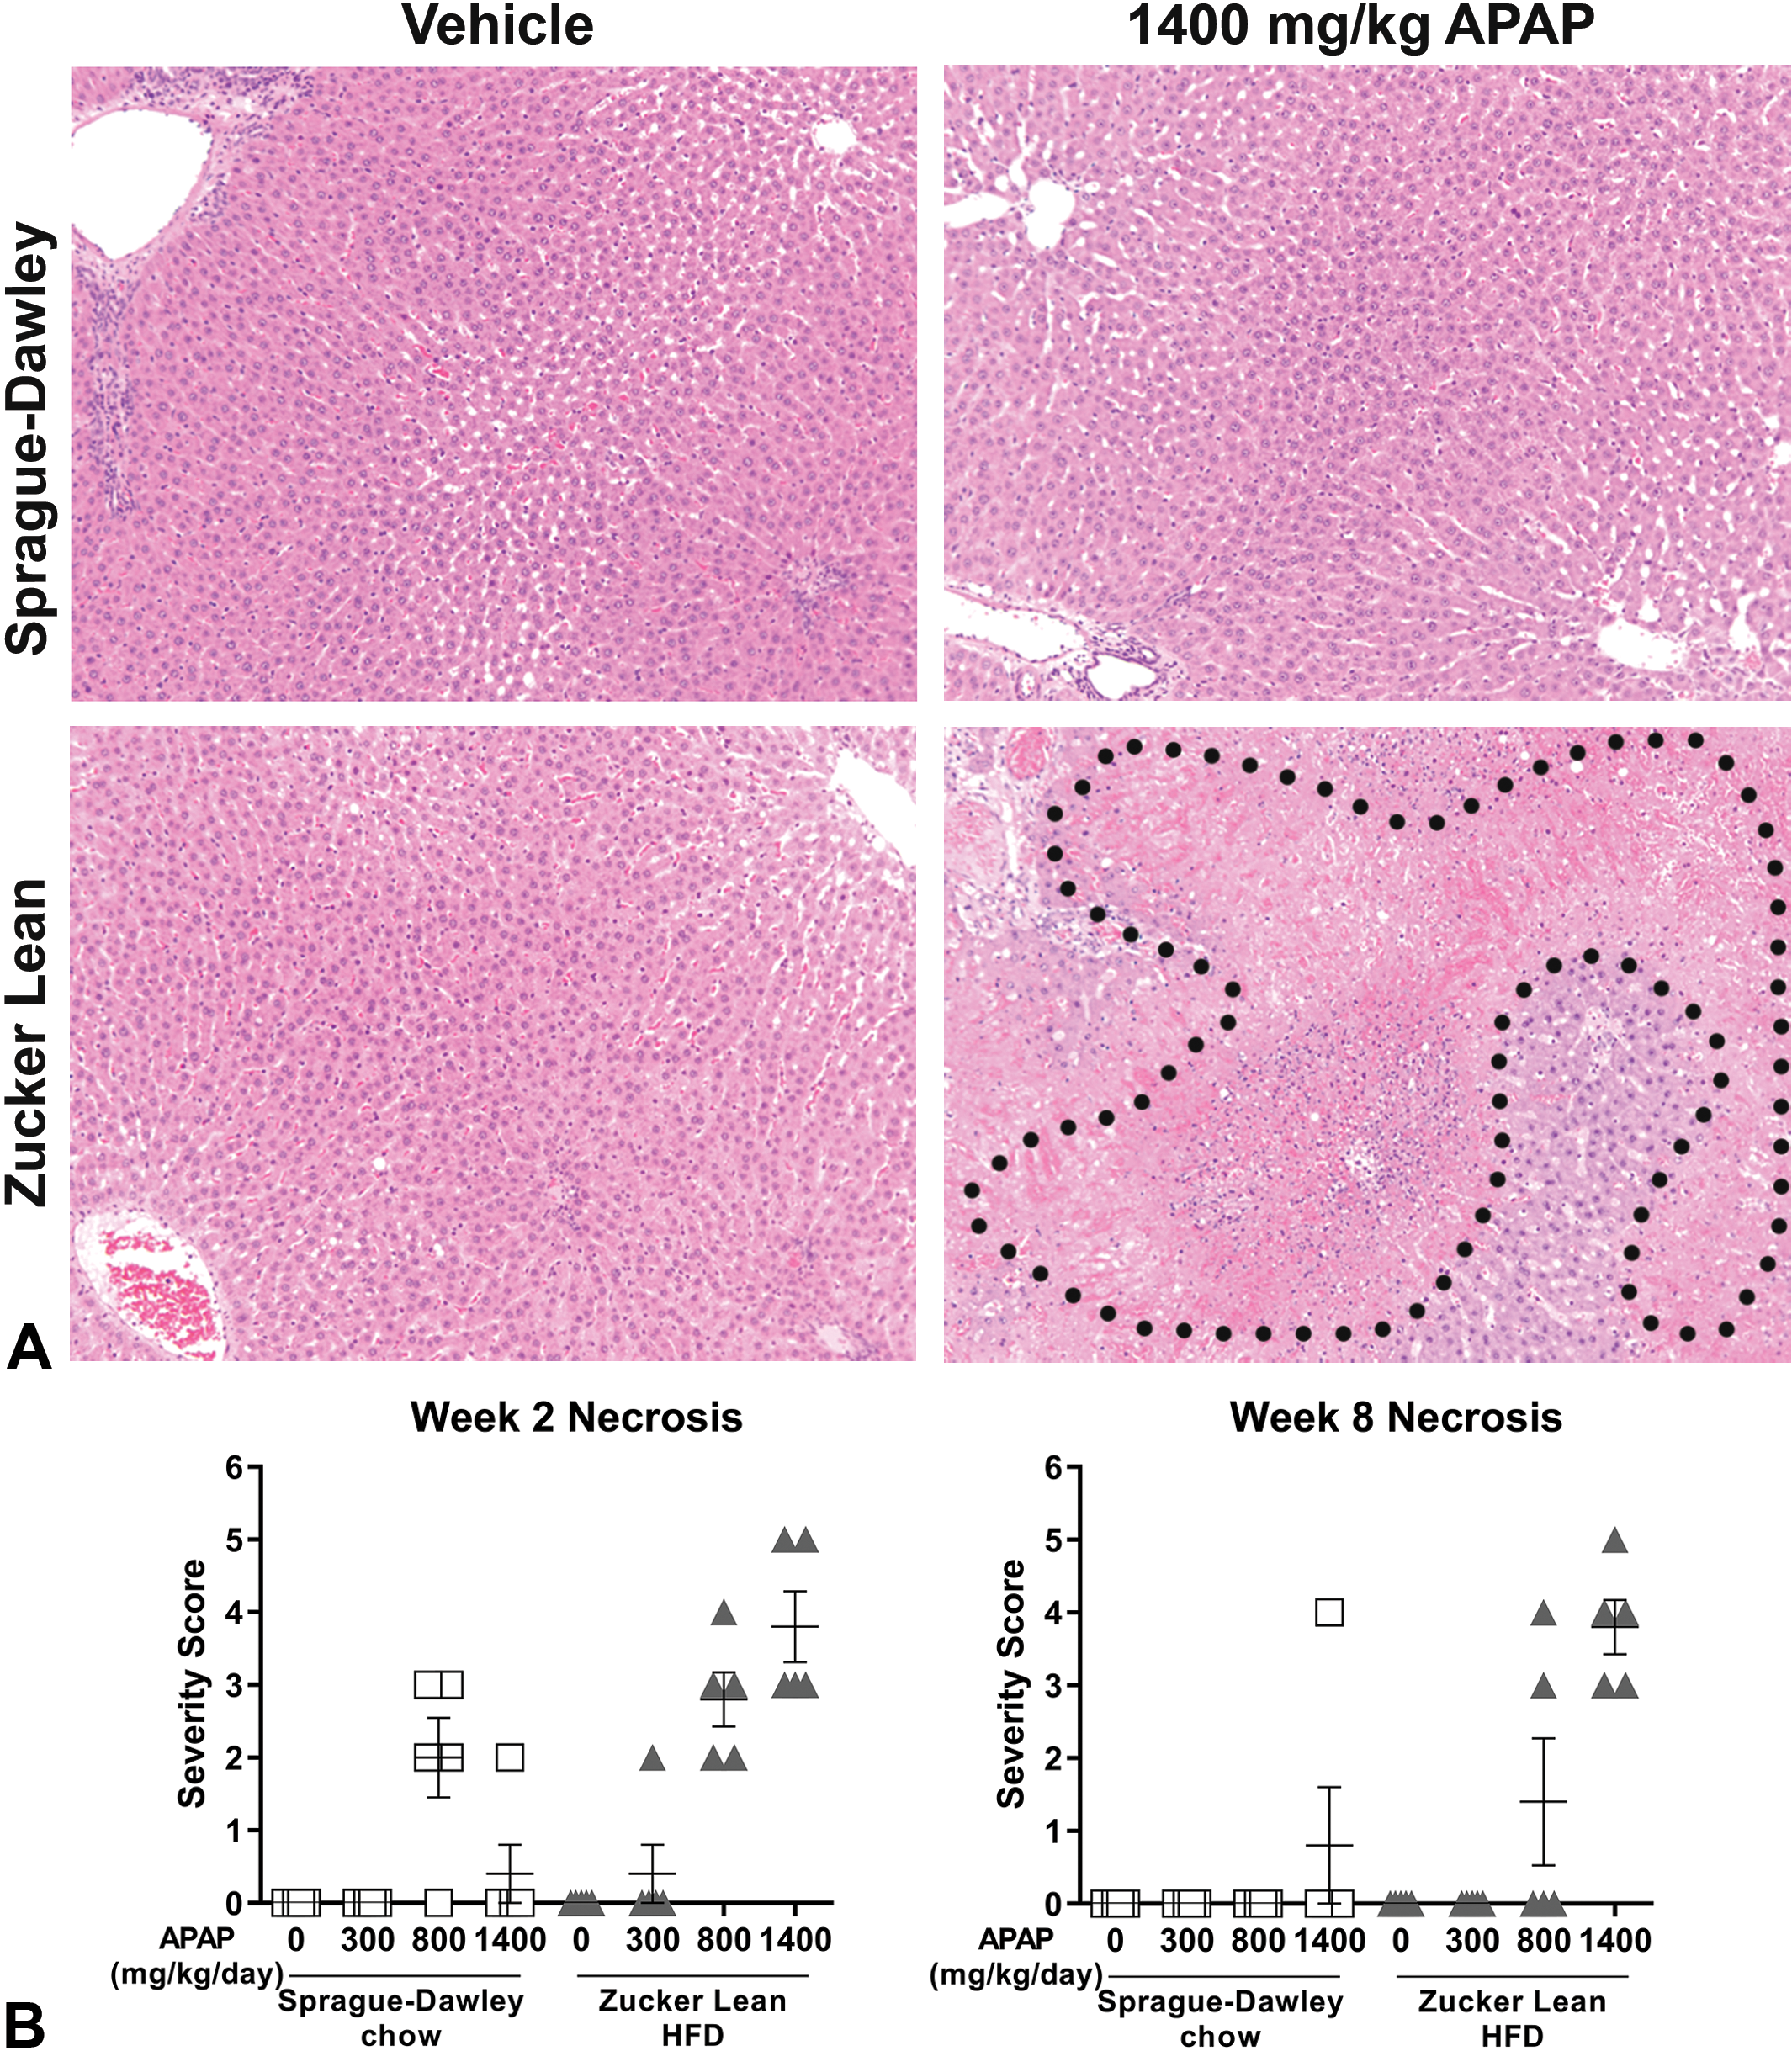
Assessment of drug-induced liver injury in Sprague-Dawley and Zucker Lean rats. A, Representative photomicrographs showing H&E-stained liver sections from chow-fed Sprague-Dawley rats and Zucker Lean rats fed a HFD for 8 weeks followed by daily administration of vehicle or 1400 mg/kg APAP for 7 days. Area of bridging necrosis and congestion is indicated by black outline. Original objective: 10×. B, Incidence and severity of liver necrosis in chow-fed Sprague-Dawley rats and Zucker Lean rats fed a HFD for 2 or 8 weeks. Severity score: 1 = minimal, 2 = mild, 3 = moderate, 4 = marked, and 5 = severe. Data are expressed as mean ± SEM (n = 4-5/group). APAP indicates acetaminophen; H&E, hematoxylin and eosin; HFD, high fat diet; SEM, standard error of the mean.
To determine whether increased liver injury was associated with greater accumulation of drug in the body, toxicokinetic analysis of APAP levels in the plasma and liver samples from APAP-treated HFD-fed ZL rats and chow-fed SD rats was performed (Figure 8). Systemic exposure, as determined by AUC(0-24) and C max generally increased with dose on both day 1 (not shown) and day 7 in both rat models (Figure 8A). The apparent T max for APAP in ZL rats was 1 hour for all doses, whereas the apparent T max for 300, 800, and 1400 mg/kg doses in SD rats was 1, 3.8, and 2.6 hours, respectively. Hepatic concentrations of APAP in SD rats dosed with 300 mg/kg and 800 mg/kg were either at or below the lower limit of quantification or lower compared with APAP-treated HFD-fed ZL rats (Figure 8B). At 1400 mg/kg, supraproportional increases in hepatic APAP concentration were observed in ZL rats (200-fold and 4-fold higher in HFD-fed ZL rats at 2 and 8 weeks, respectively) as compared with SD rats. Despite the challenges with measuring APAP concentrations in all samples, the available data overall suggest that HFD-fed ZL rats accumulate APAP in the liver at a much higher rate than chow-fed SD rats.
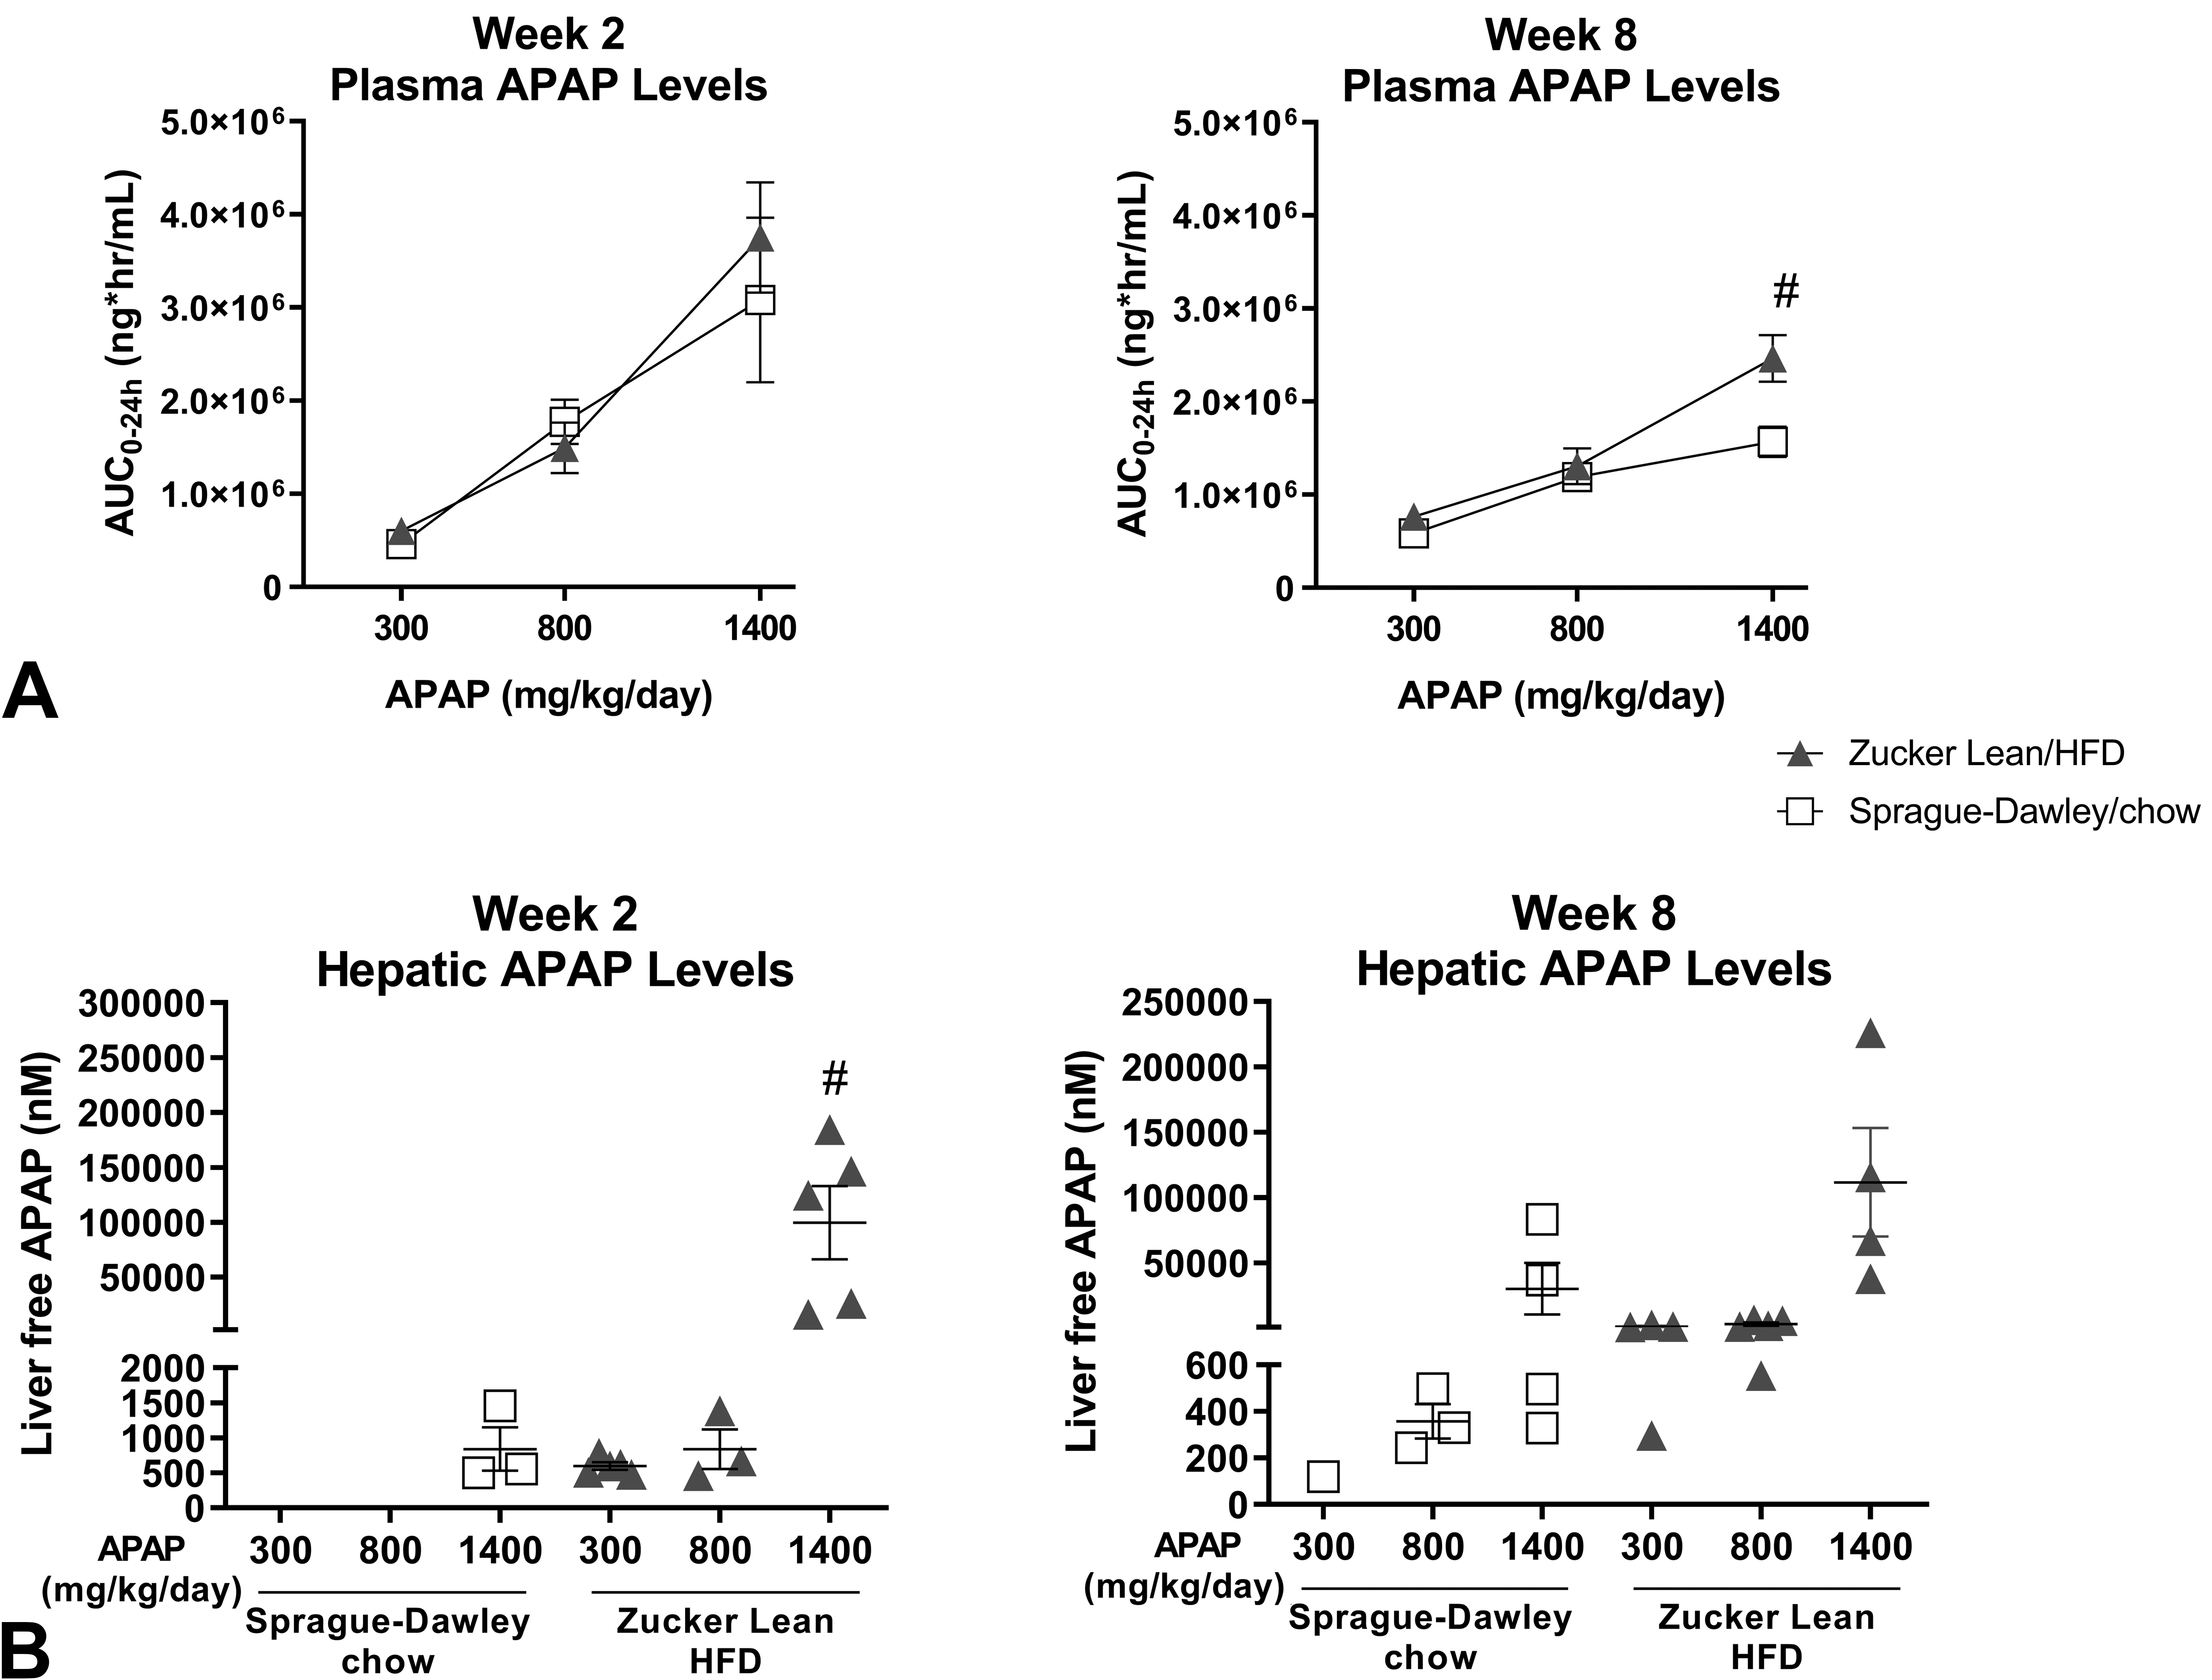
Toxicokinetic analysis of APAP levels in plasma and liver samples from chow-fed Sprague-Dawley rats and Zucker Lean rats fed a HFD diet (for either 2 or 8 weeks) and then given up to 1400 mg/kg APAP for 7 days. A, Systemic exposure plasma levels, as determined by AUC(0-24) and C max. B, Hepatic concentrations of APAP. Data are expressed as mean ± SEM (n = 3-5/group). # P < .05 versus 1400 mg/kg APAP in Sprague-Dawley rats fed chow. APAP indicates acetaminophen; AUC(0-24), area under the concentration–time curve over 0- to 24-hour time interval; HFD, high fat diet; SEM, standard error of the mean.
Next, we examined whether changes in hepatic transporters could explain increased APAP accumulation in the livers of HFD-fed ZL rats. Importantly, APAP overdose in rodents is linked with increased expression of hepatic efflux transporter MDR1 which is generally thought of as a critical response to hepatic damage resulting in increased efflux of xenobiotics and cell injury byproducts into bile. 40,41 We examined the localization of MDR1 within IHC-stained liver sections from untreated HFD-fed ZL rats and chow-fed SD rats. Representative images from SD rats illustrate appropriate MDR1 staining along the basolateral surface of hepatocytes, directly adjacent to bile canaliculi (Figure 9). In contrast, in HFD-fed ZL rats, there was reduced staining adjacent to bile canaliculi and shorter, more intense aggregates of stain were observed, possibly within early or late endosomes (Figure 9). Overall, the reduced baseline MDR1 staining could likely explain increased hepatic APAP accumulation in HFD-fed ZL compared with chow-fed SD rats.
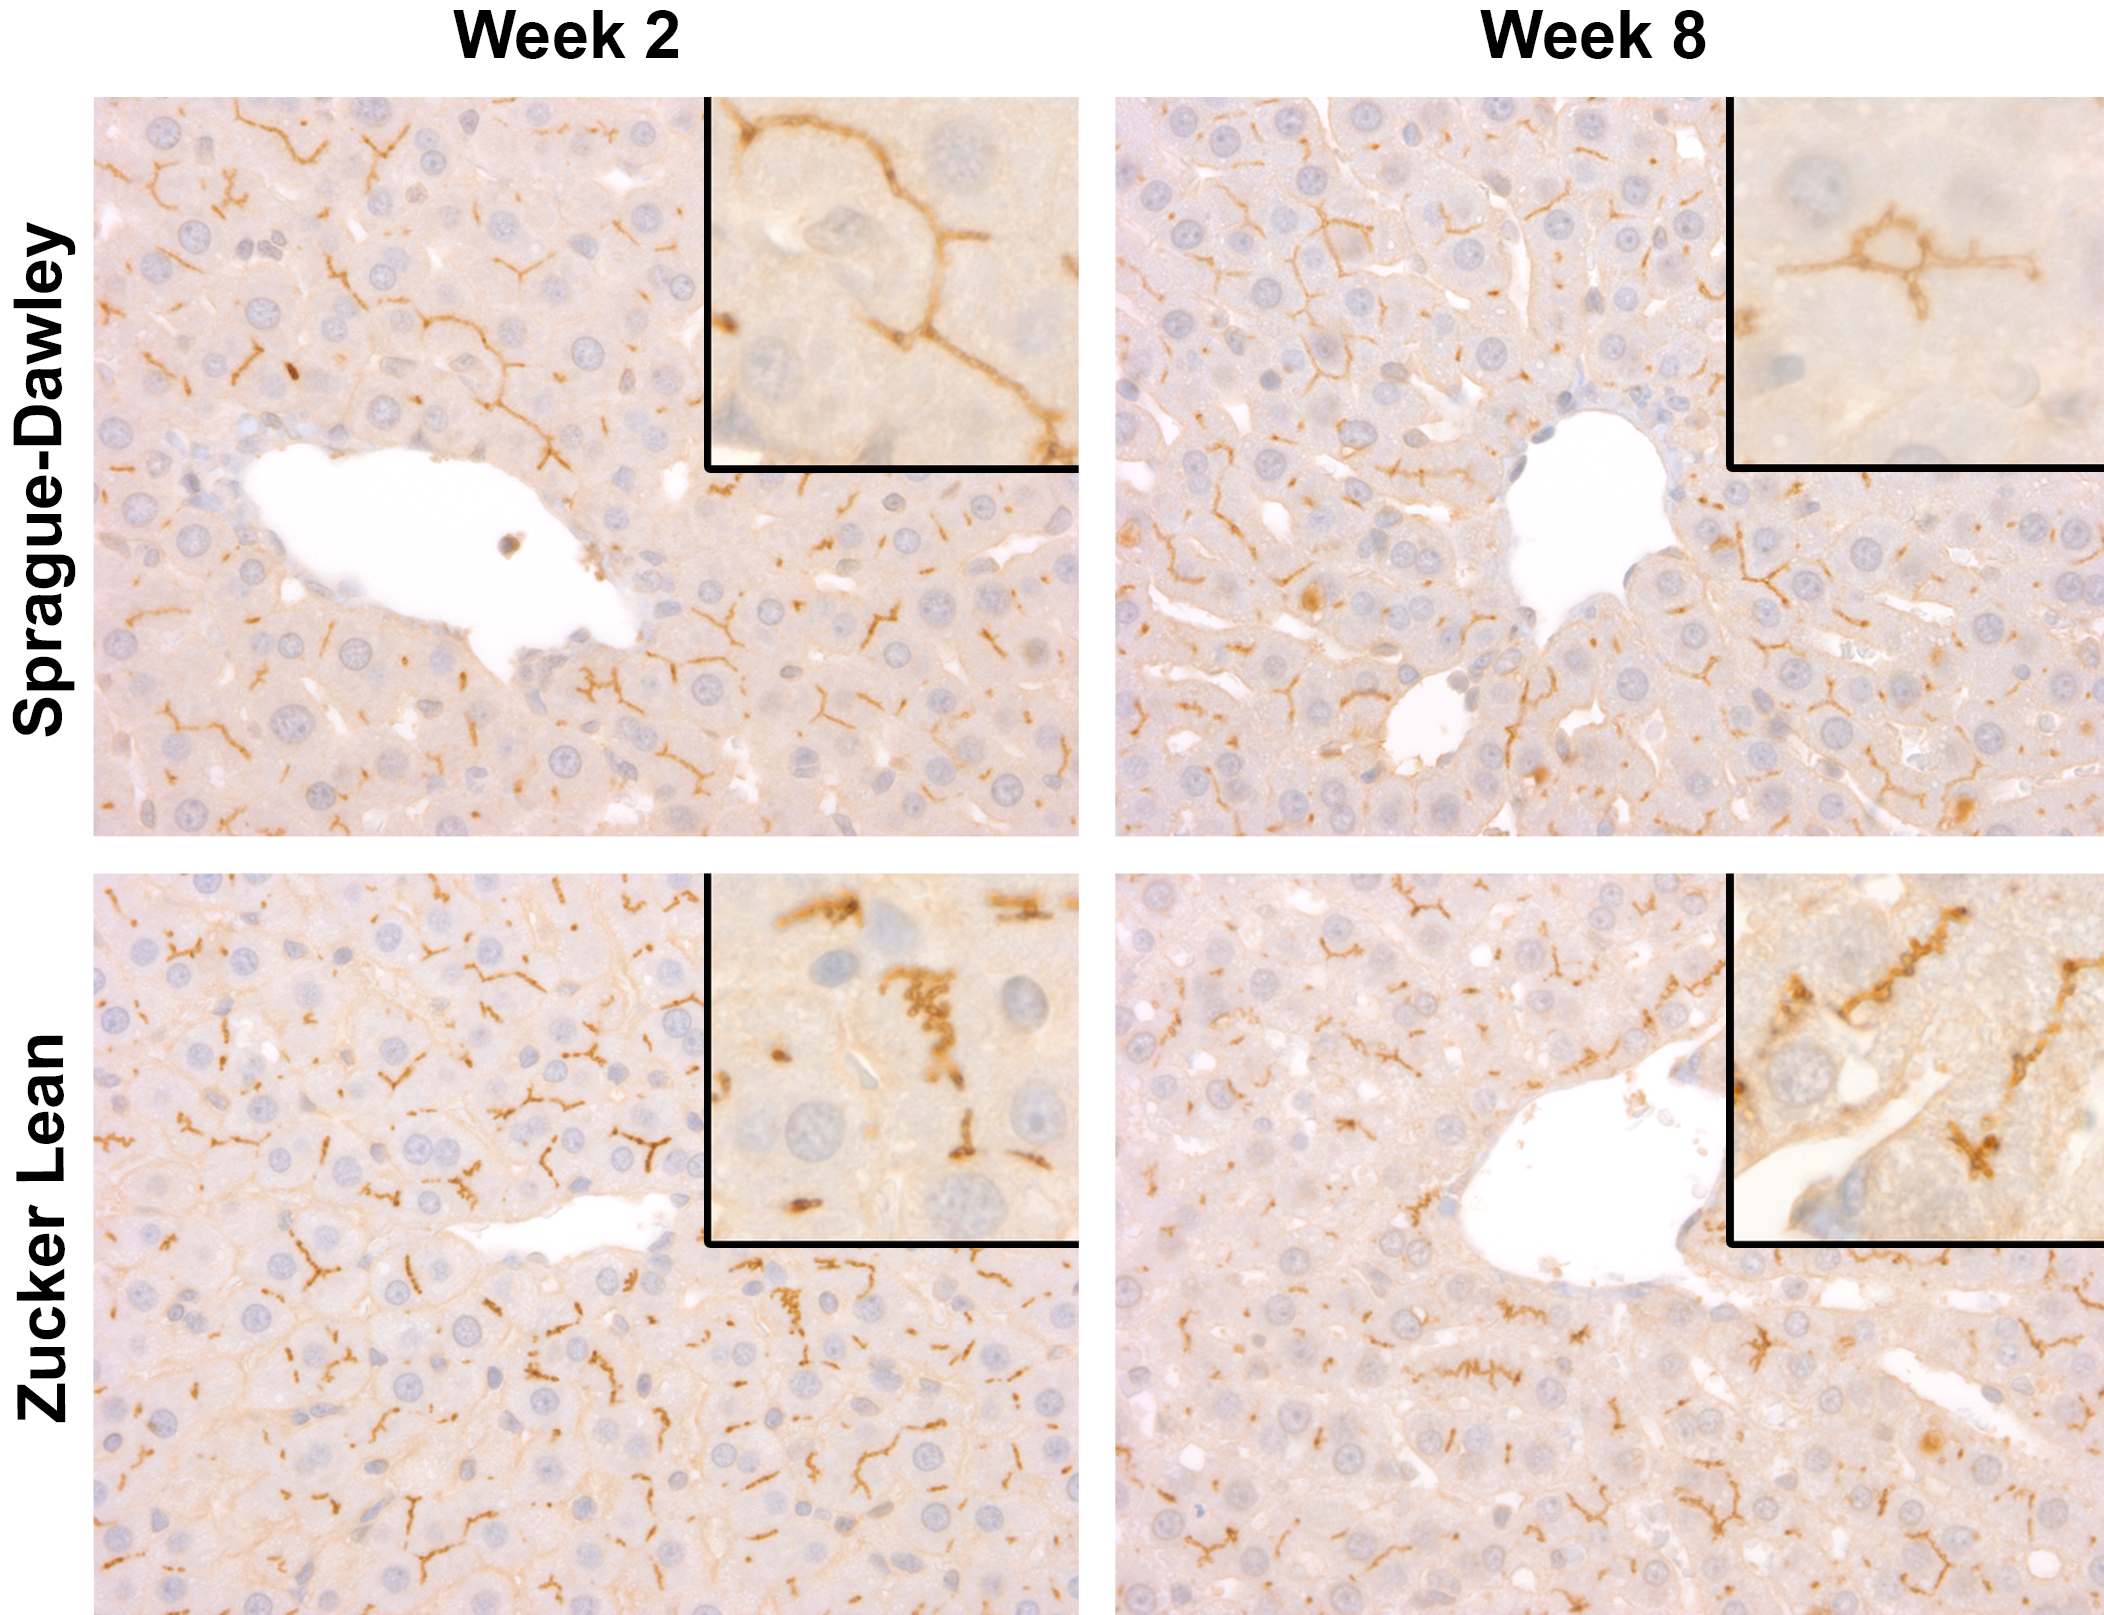
Immunohistochemical staining of MDR1 within liver sections of chow-fed Sprague-Dawley rats and Zucker Lean rats fed a HFD for 2 or 8 weeks. Original objective 4× (inset original objective 10×). HFD indicates high fat diet; MDR1, multiple drug resistance protein 1.
Discussion
The results of the present study reveal that ZL rats fed a HFD for as little as 2 weeks develop mild hepatic steatosis and compensatory hyperinsulinemia, with no elevations in serum liver injury enzymes. Yet, when challenged with APAP, these rats are more prone to hepatocellular damage as indicated by higher serum levels of injury enzymes as well as a greater incidence and severity of hepatic necrosis compared with similarly treated chow-fed SD rats. These findings were associated with increased APAP accumulation in the liver and altered localization of the hepatocellular efflux transporter protein MDR1 within hepatocytes.
Multiple literature reports indicate that patients with NAFLD have approximately 4-fold greater risk of developing DILI, 13,42 but interestingly, most have normal serum liver enzyme levels. 43 As a result, we sought to identify an appropriate model for studying the impact of asymptomatic metabolic syndrome (mild hepatic steatosis and/or compensatory hyperinsulinemia) on subsequent liver injury. A variety of animal models of NAFLD/metabolic syndrome have been described; however, the majority are either overt disease models, require extensive prestudy work, or are mouse-based. Overt disease models offer little value when evaluating asymptomatic at-risk populations. For instance, rats fed methionine and choline-deficient diets for up to 8 weeks have significant elevations in ALT and microscopic changes consistent with NASH. 44,45 Also, ZF rats, which are used extensively in diabetes efficacy studies, have moderate to severe hepatic steatosis, insulin insensitivity, and elevated liver injury enzymes when fed a HFD. 28,34 Sprague Dawley rats require extensive prestudy work (HFD challenge of up to 24 weeks) before NAFLD can be appreciated. 46 Mouse models, due to significant differences in metabolism and resultant dose/exposure modeling compared with rats and humans, may offer little platform compatibility. 47 Moreover, previous liver injury studies demonstrated that chow-fed ZF rats were protected from acute APAP-hepatoxicity compared with chow-fed ZL rats which was attributed to increased glutathione levels in ZF rats. 48 –50 Importantly, to the best of our knowledge, none of the studies examined the susceptibility of steatotic HFD-fed ZL to APAP-induced liver injury. Our current study overcomes these shortcomings by identifying a rat-based in vivo test system (requiring as little as 2 weeks of HFD challenge) that is susceptible to an increased liver injury risk with an asymptomatic metabolic syndrome phenotype.
Compensatory hyperinsulinemia is a desired phenotype in modeling asymptomatic metabolic syndrome as it plays a central role in the development of hepatic steatosis. Insulin triggers the release of free fatty acids from adipocytes, resulting in storage of triacylglycerol in the liver, skeletal muscle, and the heart. 51 Free fatty acids reduce insulin sensitivity in muscle, which results in increased amounts of glucose presented to the liver where the energy is stored as lipid instead of being converted into glycogen. 52,53 Further underscoring the mechanistic link between hyperinsulinemia and hepatic steatosis, studies suggest that treatment with insulin-sensitizing ligands for the peroxisome proliferator-activated receptor γ improves hepatic steatosis. 54,55 It is worthy to note that type 1 diabetic rats are relatively resistant to APAP-induced hepatotoxicity, primarily due to decreased insulin but also due to increased glutathione levels. These rats readily eliminate APAP as nontoxic glucuronide and sulfate conjugates, with the effect reversed upon insulin administration. 56
The potential impact of hepatic steatosis on liver function is rarely investigated, presumably due to the lack of an overt injury phenotype (eg, no increase in serum liver injury enzymes and/or lack of microscopic evidence of hepatocellular degeneration/death). Yet in this study, we demonstrated that mild hepatic steatosis was linked with increased APAP accumulation within the liver, and the increased APAP levels were likely associated with altered MDR1 efflux transporter protein localization within hepatocytes. Although the function of MDR1 was not assessed in this study, similar findings were previously reported in a rat model of NASH where hepatic MDR1 appeared internalized away from the canalicular membrane compared with chow-fed control rats. 57 Future studies comparing rat models that incorporate additional group of ZL rats fed a normal chow would highlight whether genetic background directly contributes to the observed phenotype of increased susceptibility to APAP-induced liver injury.
Although liver toxicity associated with APAP overdose in patients is more readily recapitulated using mouse models (ie, 300 mg/kg APAP administered intraperitoneally following an overnight fast), we chose to challenge rats with APAP in this study as it is an appropriate test article for evaluating liver injury potential in people with asymptomatic metabolic syndrome. In addition to its wide use for a variety of symptoms, APAP requires the full hepatocellular metabolic machinery for successful metabolism and excretion. Following APAP conversion to the reactive metabolite N-acetyl-p-benzoquinone imine (NAPQI) during phase 1 metabolism, 58 NAPQI is then conjugated by glutathione, and the glucuronide conjugates are excreted into bile via hepatobiliary transporters. 59 In the context of APAP overdose, glutathione capacity is rapidly exceeded and NAPQI levels build up to form adducts with intracellular proteins, ultimately leading to cell degeneration and death. 60 Therefore, protection from APAP-mediated liver injury is dependent on healthy efflux transporter function. Patients with asymptomatic metabolic syndrome may also be at greater risk for APAP-induced liver injury due to existing endoplasmic reticulum (ER) stress in steatotic hepatocytes 61 ; also, limited research suggests that APAP can activate ER stress responses in mouse livers. 62
In conclusion, the results of our study demonstrate that ZL rats fed a HFD (for as little as 2 weeks) develop mild hepatic steatosis and compensatory hyperinsulinemia and are more sensitive to DILI compared with standard chow-fed SD rat model. The results also suggest that the increased sensitivity may be likely due to altered hepatocellular localization of the efflux transporter MDR1, which may have contributed to hepatocellular accumulation of APAP. Future studies should consider evaluating MDR1 functionality and look at other types of DILI to pinpoint whether the results highlighted here are unique to APAP-induced liver injury. Human subjects with asymptomatic metabolic syndrome (eg, those with hepatic steatosis, normal fasting blood glucose, and normal serum liver injury enzyme levels) may be uniquely sensitive to a wide variety of pharmaceuticals and therefore should be identified prior to their enrollment in clinical trials and/or monitored for potential liver injury. There are significant hurdles to identifying human subjects with asymptomatic metabolic syndrome in a drug development setting. Although microscopic examination is the accepted method for diagnosing low-grade hepatic steatosis, because of its interventional nature, it is rarely used in clinical trials. Noninvasive imaging (ie, magnetic resonance imaging) has been successfully used for investigational purposes, 8 yet carries a high cost for a clinical trial. Biomarkers for detecting mild hepatic steatosis and/or subclinical liver injury have been reported. Polymorphisms in the gene encoding Patatin-like phospholipase domain-containing protein 3 (PNPLA3) have been associated with increased liver fat content, 63,64 while increased fragment levels of plasma cytokeratin-18 correlate with hepatic apoptosis and have been proposed as a biomarker for NASH. 65 Lastly, several microRNA targets have been identified as potential biomarkers for NAFLD and NASH. 66 For nonclinical applications, the HFD-fed ZL rat model is not intended to replace the standard SD rat in vivo system in general toxicology studies. However, for drug programs that target susceptible patient populations, the steatotic HFD-fed ZL rat could be deployed as an additional model for investigative studies to identify biomarkers predictive of clinical responses in patients with asymptomatic NAFLD. In summary, the identification and validation of novel biomarkers in ZL rats with hepatic steatosis is warranted as a critical next step for better understanding of the relationship between asymptomatic metabolic syndrome and increased risk for DILI.
Footnotes
Acknowledgments
The authors would like to thank Julio C. Davila, Paul J. Listrani, James A. Warneke, and Shawn O’Neil for the technical assistance with the studies and Colleen Doshna and James Finley for the critical review of the manuscript.
Declaration of Conflicting Interests
The author(s) declared no potential conflicts of interest with respect to the research, authorship, and/or publication of this article.
Funding
The author(s) received no financial support for the research, authorship, and/or publication of this article.