
Abstract
In preclinical studies that involve animal models for hepatic fibrosis, accurate quantification of the fibrosis is of utmost importance. The use of digital image analysis based on deep learning artificial intelligence (AI) algorithms can facilitate accurate evaluation of liver fibrosis in these models. In the present study, we compared the quantitative evaluation of collagen proportionate area in the carbon tetrachloride model of liver fibrosis in the mouse by a newly developed AI algorithm to the semiquantitative assessment of liver fibrosis performed by a board-certified toxicologic pathologist. We found an excellent correlation between the 2 methods of assessment, most evident in the higher magnification (×40) as compared to the lower magnification (×10). These findings strengthen the confidence of using digital tools in the toxicologic pathology field as an adjunct to an expert toxicologic pathologist.
Liver fibrosis is a prevalent pathological finding in chronic liver disorders and is characterized by the increased accumulation of extracellular matrix (ECM) proteins (primarily composed of collagen I and III) in the liver. 1 –4 Collagen production is initiated by hepatic stellate cells as a wound healing response to chronic liver injury, such as alcohol toxicity and viral infection. 5,6 If the injury is not resolved, ECM continues to accumulate, resulting in liver fibrosis, causing disruption of the normal architecture of the liver and impairment of hepatic function. 3 Although most mild cases of liver fibrosis are asymptomatic, in some cases, this process can lead to liver cirrhosis, which in turn can cause complications, such as variceal bleeding, portal hypertension, and hepatocellular carcinoma. 3,7 Advanced liver fibrosis is an incurable condition, which can only be resolved with liver transplantation. 2 Cirrhotic liver disease is the most prevalent cause for liver transplantation. 8 However, if detected and treated early, this process can be reversed. 9
Accurate quantification of liver fibrosis is essential for evaluating the degree of progression to liver cirrhosis, assessing the efficacy of novel therapies and establishing the necessary treatment. 9 –18 Liver biopsy still remains the gold standard for evaluating liver fibrosis both in research and clinical practice. 19 –21 Conventionally, a semiquantitative histological evaluation has been regarded as the method of choice for liver fibrosis assessment. 22 –24 However, in the last 2 decades, automated techniques based on digital image analysis (DIA) of liver biopsy specimens have been developed for fibrosis quantification. These techniques calculate the ratio of the areas of fibrosis relative to the entire liver tissue area examined (collagen proportionate area [CPA]). 19,25 –29 These methods have been found to be very reliable, precise, reproducible, sensitive, and in strong correlation with liver function, stiffness, and portal hypertension. 19,25 –32
Although DIA of liver fibrosis has been in use in clinical practice for many years, its use in animal models has been reported only sparsely in the past. 33 –37 Taking into consideration the importance of animal models of liver disease for research and translational purposes 38 and the growing role of digital pathology and image analysis in toxicologic pathology, 39 additional information on the reliability, accuracy, and usability of such methods is essential. To further expand the applicability of DIA in preclinical models for liver fibrosis, we used data from a study that evaluated liver fibrosis in mice using the carbon tetrachloride (CCl4) model, 40,41 and we compared the traditional semiquantitative evaluation by an experienced toxicologic pathologist with a novel artificial intelligence (AI) application for identification and quantification of liver fibrosis. 42 Furthermore, this analysis was done by deploying the application into the pathologist’s microscope, therefore facilitating its use, without disrupting the regular reporting workflow. 42 –44
Nine-week-old female BALB/c mice were used in this study. The animals were maintained in the animal facility of the Molecular Biotechnology Center of the University of Torino under a 12-hour light-dark cycle with ad libitum access to food and water. Experimental procedures adopted in the study were in conformity with Italian and European Union animal welfare guidelines and laws and were authorized by the Italian Ministry of Health (Authorization No. 308/2020-PR).
The mice received multiple subcutaneous injections in the inguinal area with 100 µL CCl4 in olive oil, twice a week for 8 consecutive weeks (group 2). Carbon tetrachloride dose was escalated from 5% (week 1) to 10% (weeks 2-8). Additional 6 female BALB/c mice did not receive CCl4 and served as healthy controls (group 1).
At the end of the 8-week treatment period, mice from both groups were killed. Nine additional female BALB/c mice received CCl4 for 8 weeks, and then received weekly phosphate-buffered saline injections for 4 weeks (group 3). These mice were killed after 12 weeks, and liver tissue was collected from all 3 groups. After embedding in paraffin, serial sections (3-5 µm thick) were cut and stained with picrosirius red (PSR) for collagen determination. For the DIA, the sections were evaluated using 2 magnifications—×10 and ×40. In the ×40 magnification, 5 different microscopic fields encompassing the centrilobular regions were selected randomly in each liver section. In the ×10 magnification, 5 different microscopic fields were selected randomly by the pathologist in each individual liver section. A new microscopic field was selected for each of the 5 evaluations by moving the microscope stage from the left to the right margin and then to the lower margin. Since the selected fields were relatively larger than the ×40 magnification, the measured regions included both centrilobular and perilobular regions (ie, panlobular measurements). To assess the quality of the positive/negative detection by the algorithm, the obtained images were saved immediately before algorithm application and immediately thereafter. The 2 resulting files were visually compared with great accuracy by switching between the 2 windows of those images. The algorithm was installed on the Augmentiqs system. This enabled the pathologist to work faster by accessing the algorithm directly through the microscope.
For the semiquantitative evaluation, the histopathological changes were scored manually using a semiquantitative grading consisting of 7 grades (0-6, “ISHAK score”), 23 with modification, as follows: 0 = no fibrosis; 1 = fibrous expansion of some centrilobular and/or periportal areas, with or without short fibrous septa; 2 = fibrous expansion of most centrilobular and/or periportal areas, with or without short fibrous septa; 3 = fibrous expansion of most centrilobular and/or periportal areas with an occasional portal to portal (P-P) bridging; 4 = fibrous expansion of portal areas with marked bridging (P-P) as well as portal-central (P-C); 5 = marked bridging (P-P and/or P-C) with occasional nodules (incomplete cirrhosis); and 6 = cirrhosis, probable or definite. After performing the manual evaluation, the AI algorithm for quantitative assessment was applied.
Data Set Preparation
The entire data set consisted of 140 field-of-view images of size 3008 by 4112 pixels including microscopic fields randomly sampled by pathologist at 10× and 40× magnifications. These microscopic field images were acquired using an Olympus BX51 microscope that had been supplemented with a digital pathology imaging and display system (Augmentiqs). 43,44 Of these 140 fields, 80 fields were acquired by randomly selecting microscopic fields from treated group animals while the remaining 60 fields belonged to the control group. The data set was divided into 3 sets—training, validation, and test containing 50 (30 treated + 20 control), 20 (10 treated + 10 control), and 70 (40 treated + 30 control) microscopic field images, respectively. The same division of data set was done for both 10× and 40× magnifications. Figure 1 shows the division of data set at 10× and 40× magnifications.
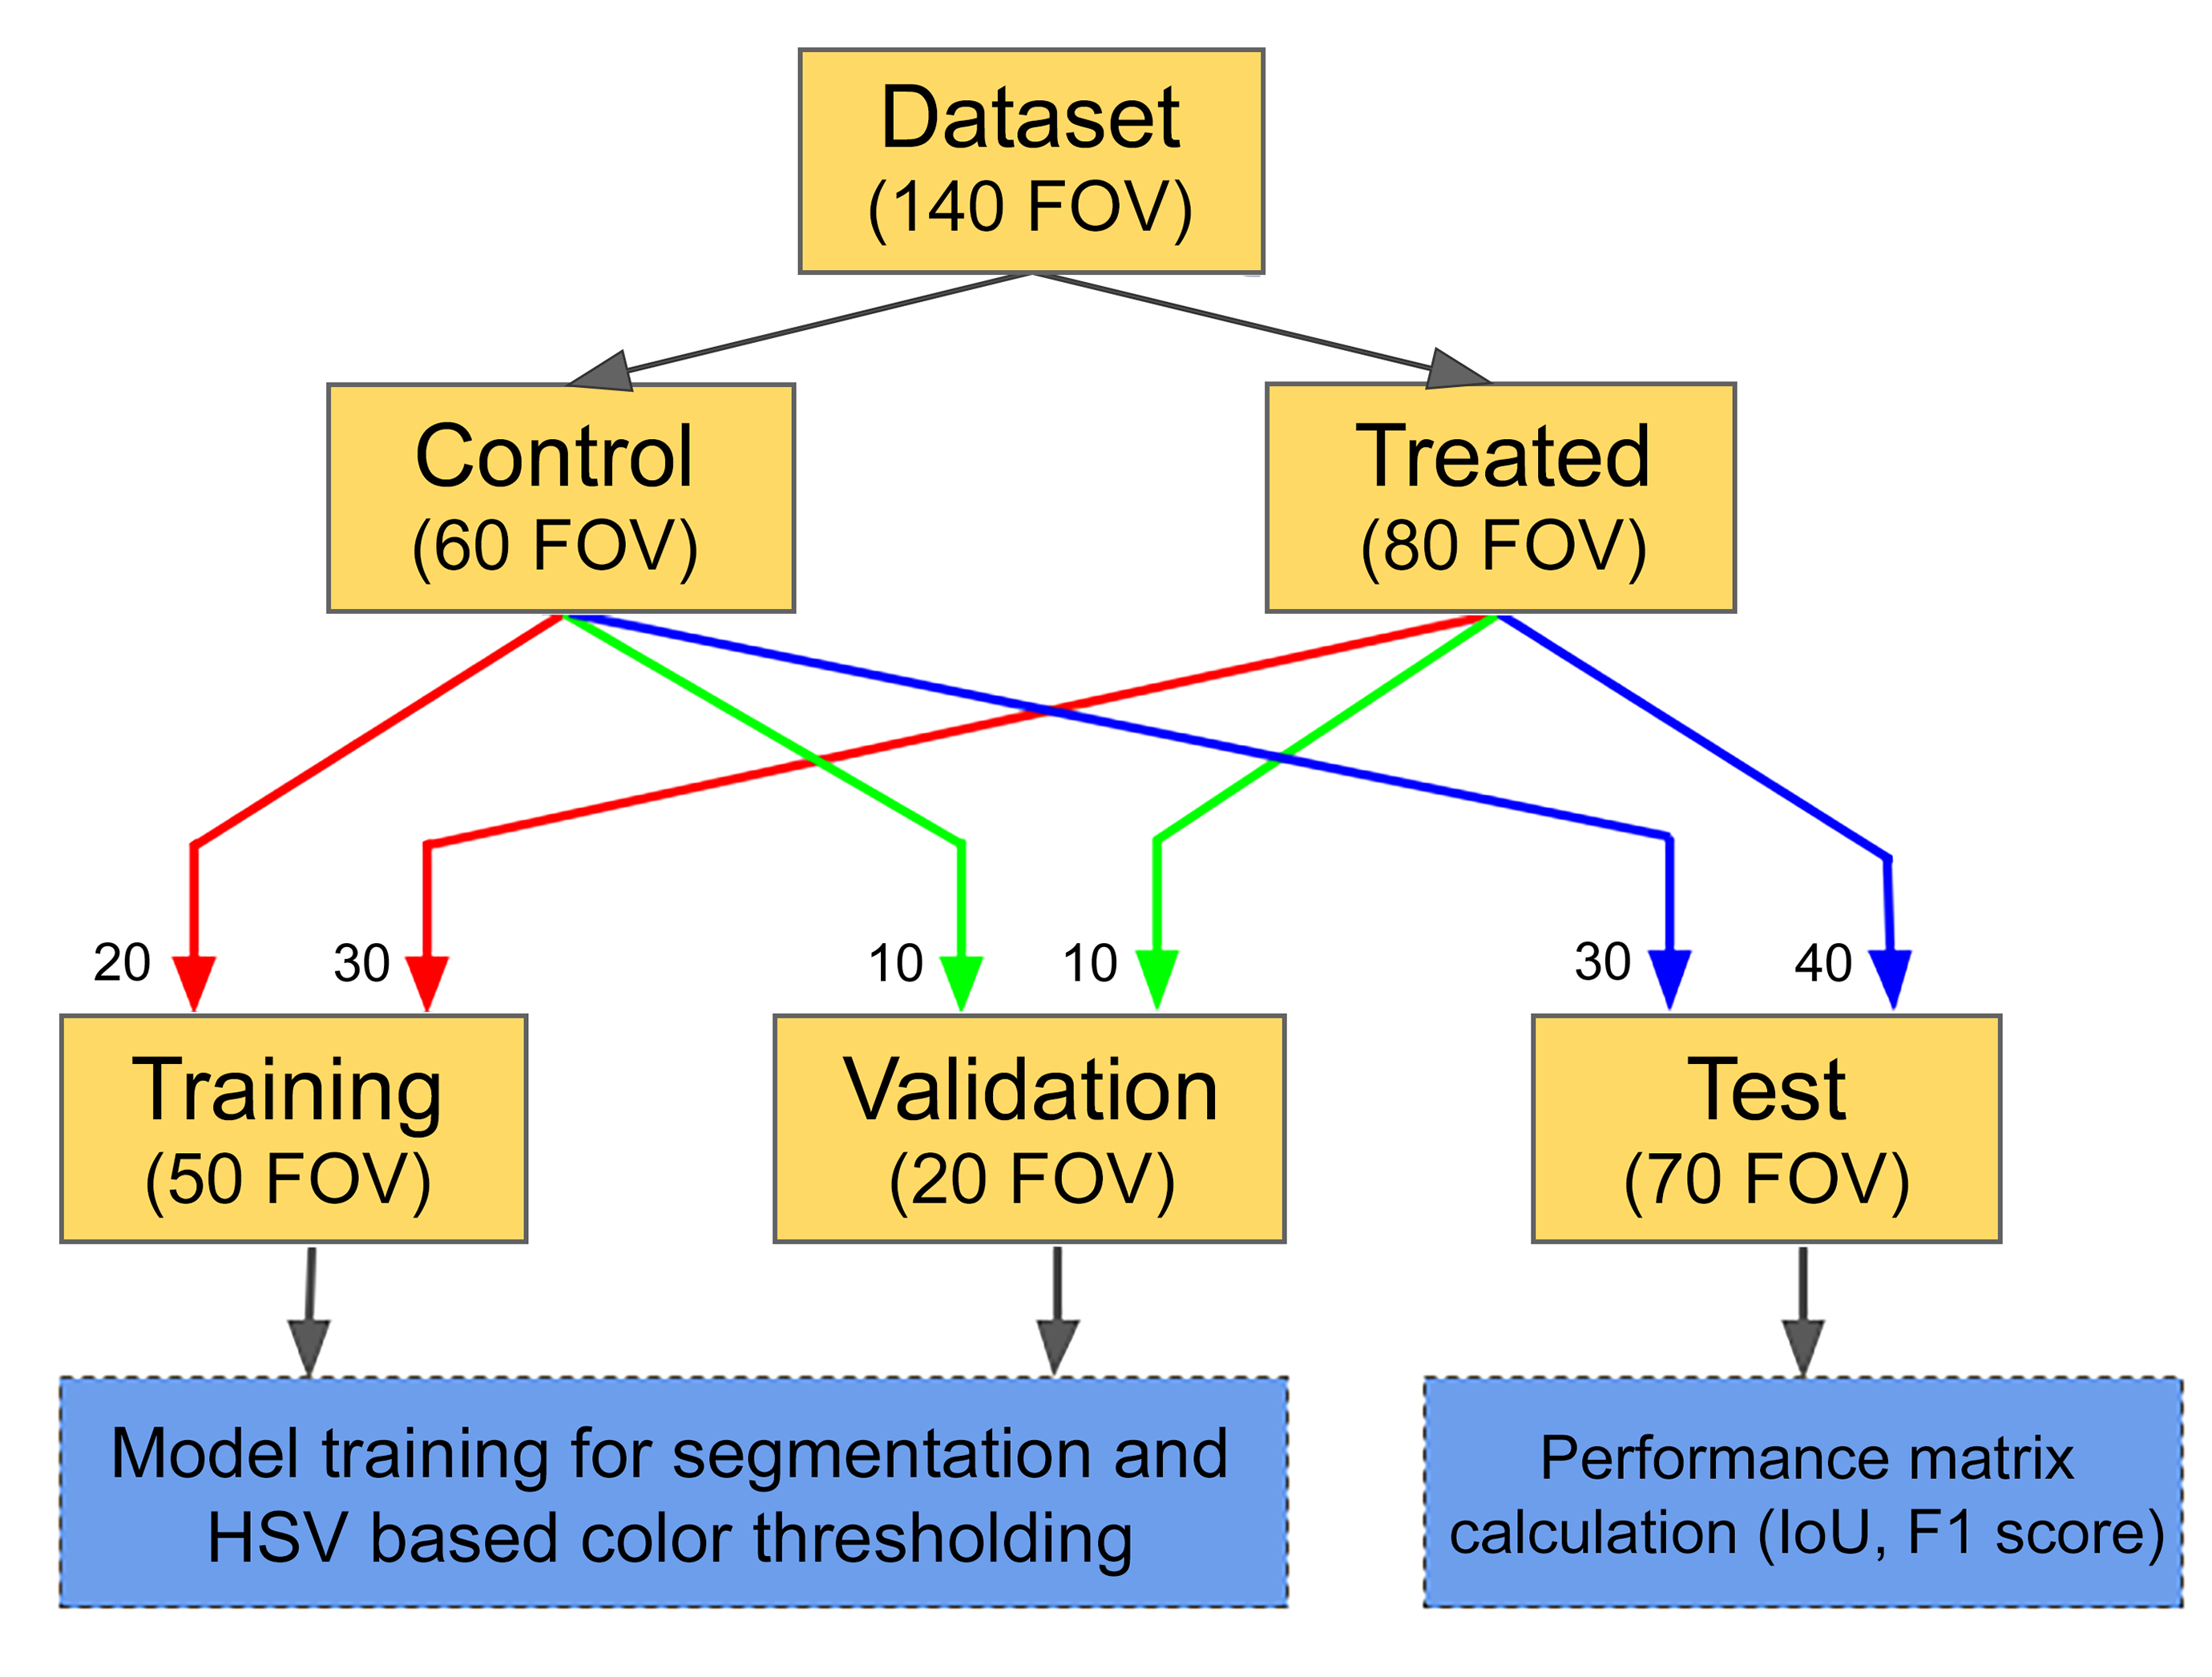
Division of data set.
An expert pathologist annotated the entire data set for collagen identification. Since it is computationally and memory wise expensive to run deep learning (DL) model on the entire filed image of size 3008 by 4112 pixels, each field image from all 3 sets was divided into tiles of 1024 by 1024 pixels. The division was done in such a way that each tile had 25% overlap with neighboring tiles. Additionally, adequate number of rows and/or columns was padded for boundary tiles. To achieve better generalization, the training set was augmented using random affine transformations and color variations on each training tile.
Convolution Neural Network Architecture
The basic architecture was an encoder–decoder network similar to U-Net 45 as seen in Figure 2. The encoder network incorporated inception-like modules, 46 which provided the capability to aggregate context to extract complex features for identifying tissue cell morphology as the feature maps were down-sampled. The network allowed better propagation of information from lower resolution layers of the decoder to higher resolution layers, using a dense shortcut connection at each decoder stage. This concatenated information from the previous stage at lower resolutions with the output of the current stage convolutions. Additionally, both encoder and decoder blocks use proposed parallel convolutions to further enhance context aggregation. The proposed architecture achieved better segmentation performance than most state-of-the-art semantic segmentation models while using a significantly lower number of parameters.
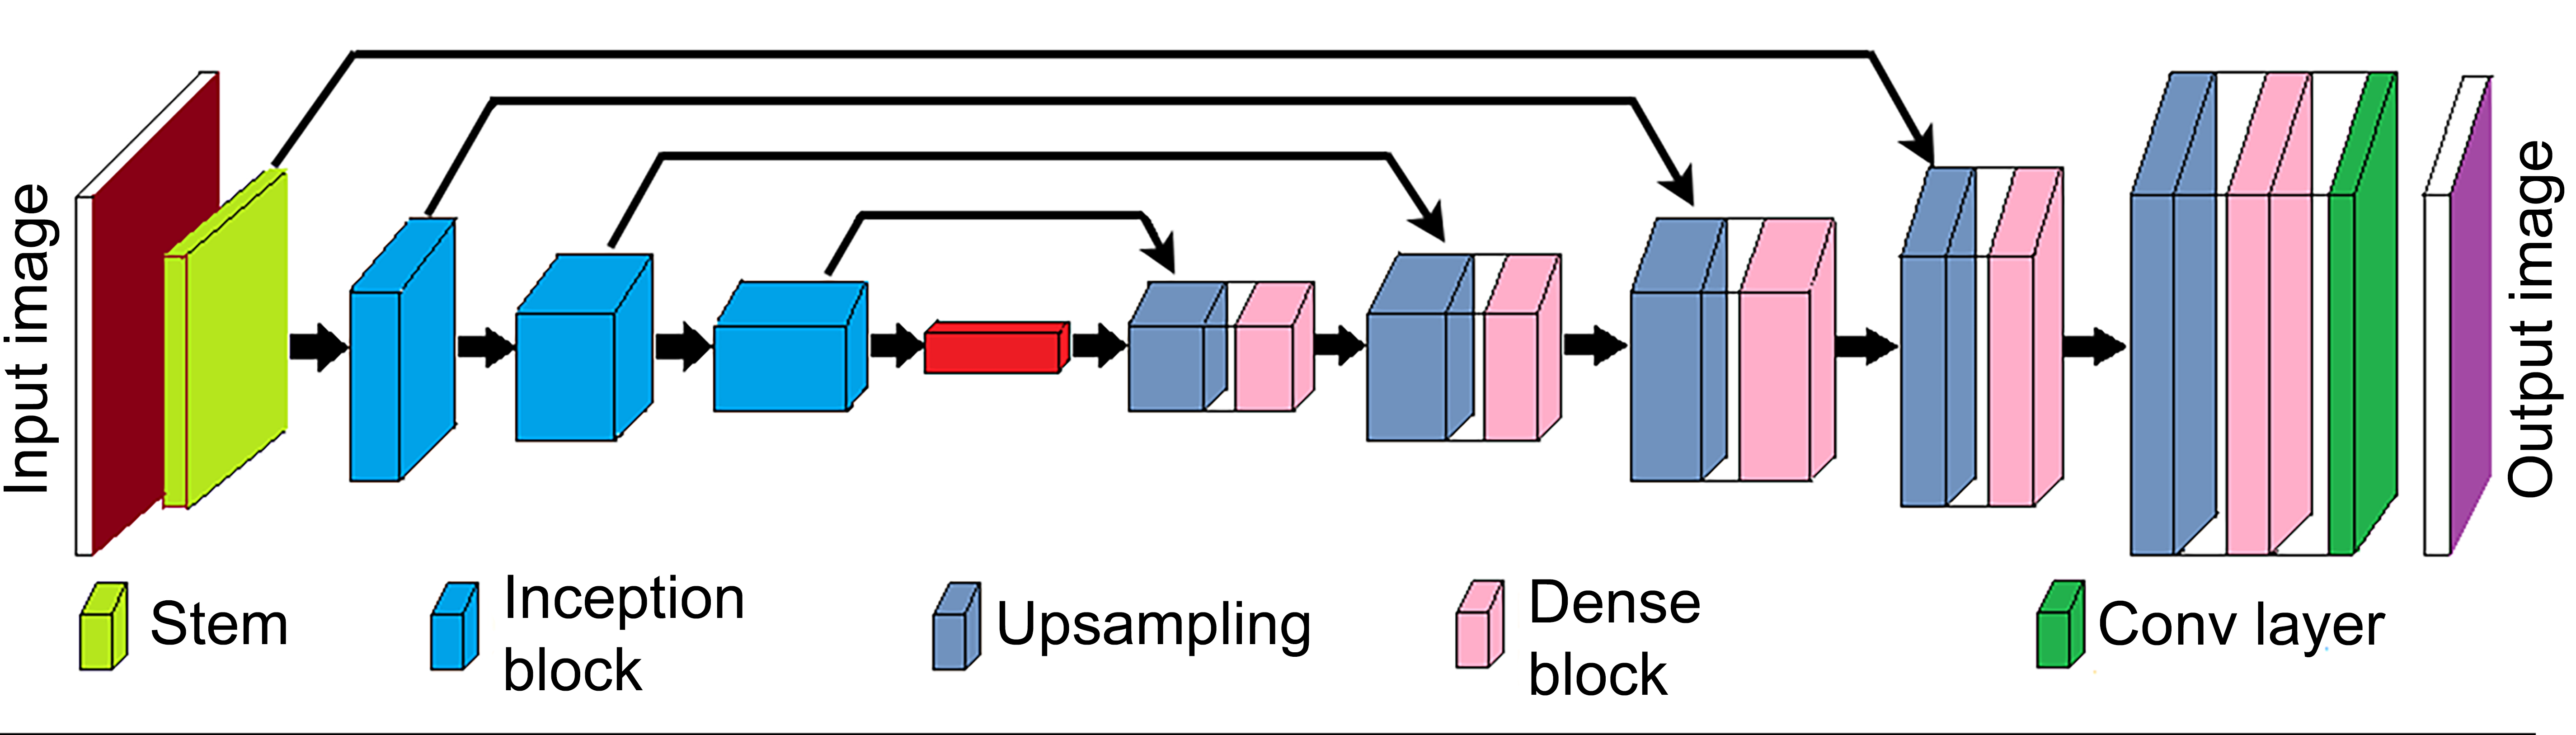
Convolution neural network architecture used for segmentation task.
Algorithm Training
The above model was implemented in Keras with Tensorflow back end and was trained to perform a segmentation task on 1024 by 1024 tiles, as mentioned earlier, until the train-val loss curves flattened. Two different models were trained for 10× and 40× magnifications. The following configuration was used while training: Loss function: Focal Tversky loss function
47
was used which has proven to perform better than standard cross entropy loss for segmentation tasks when the data are imbalanced, that is, data from 1 class are present in a much more amount than the other. Batch size: The model was trained in a batch of 8 tiles. Optimizer and learning rate scheme: An Adam optimizer was used with an initial learning rate of 1e-3, and a stepwise reduction in learning rate was performed after every 50 epochs.
Each tile was preprocessed by mean subtraction, and division by standard deviation was calculated for each RGB (Red, Green, Blue) channel separately. This typically helps convolution neural network (CNN) learn faster, as all the data appear to come from the same distribution.
Along with CNN, color thresholding in HSV (hue, saturation, value) color space was used as a helper output. Each training set image was normalized between 0 and 1, and threshold values were obtained for H, S, and V color channels, such that over 90% of the collagen regions were segmented. These values were used during testing.
Algorithm Testing
Similar to training data, 70 microscopic field images were divided into tiles of 1024 by 1024 pixels and same preprocessing steps were applied. However, these were divided without any overlapping with neighboring tiles. The generated tile-wise results were stitched in proper order to get segmentation output of entire microscopic field image. In addition, the entire microscopic field images were color thresholded in HSV color space as stated in the Algorithm Training section. A combined output for each microscopic field image was generated by logical OR operation on DL output and HSV color threshold output, followed by morphological closing with disk structuring element of radius 15. After comparing algorithm results with the ground truth for all 70 microscopic field images from the test set, intersection over union and F1 score were found to be 0.8011 and 0.8775, respectively.
The evaluating pathologist used an Olympus BX51 microscope that had been supplemented with a digital pathology imaging and display system. 43,44 The AI quantification tool was deployed in real time, and the results were viewed on the display system.
Prior to application of the appropriate statistical method, Shapiro-Wilk normality test was performed. If the normality test did not pass for all groups, Kruskal-Wallis test with Mann-Whitney U test was used. If the normality test passed for all groups, Levene test for equality of variances was performed. If Levene test passed, 1-way analysis of variance (ANOVA) test with Tukey post hoc analysis was performed.
In order to determine whether there is a significant difference in the level of fibrosis between the groups, Kruskal-Wallis test with Mann-Whitney U test was used on the pathologist’s assessment and the AI algorithm quantitative evaluation with the higher magnification. One-way ANOVA test with Tukey post hoc analysis was performed on the AI algorithm quantitative evaluation with the lower magnification. In all cases, a P value of less than .05 was considered statistically significant. In addition, the association between the level of fibrosis assessed by the pathologist and the level of fibrosis assessed by each of the AI algorithm quantitative evaluation was calculated by the Spearman correlation coefficient. According to the semiquantitative assessment, there was no fibrosis in any of the vehicle-treated groups (Table 1 and Figure 3A and G). Administration of CCl4 resulted in liver fibrosis in all the treated animals after 8 weeks (group 2), and liver fibrosis in all examined sections received a score of 4 (Table 1 and Figure 3C and I). After 4 weeks of follow-up (group 3), a slight reduction in fibrosis was seen, and the mean fibrosis score was 2.67 according to the semiquantitative assessment (Table 1 and Figure 3E and K). There was no difference between the different magnifications (×10 vs ×40) in the semiquantitative scoring.
Results of the Semiquantitative and Quantitative Evaluation of Liver Fibrosis.a
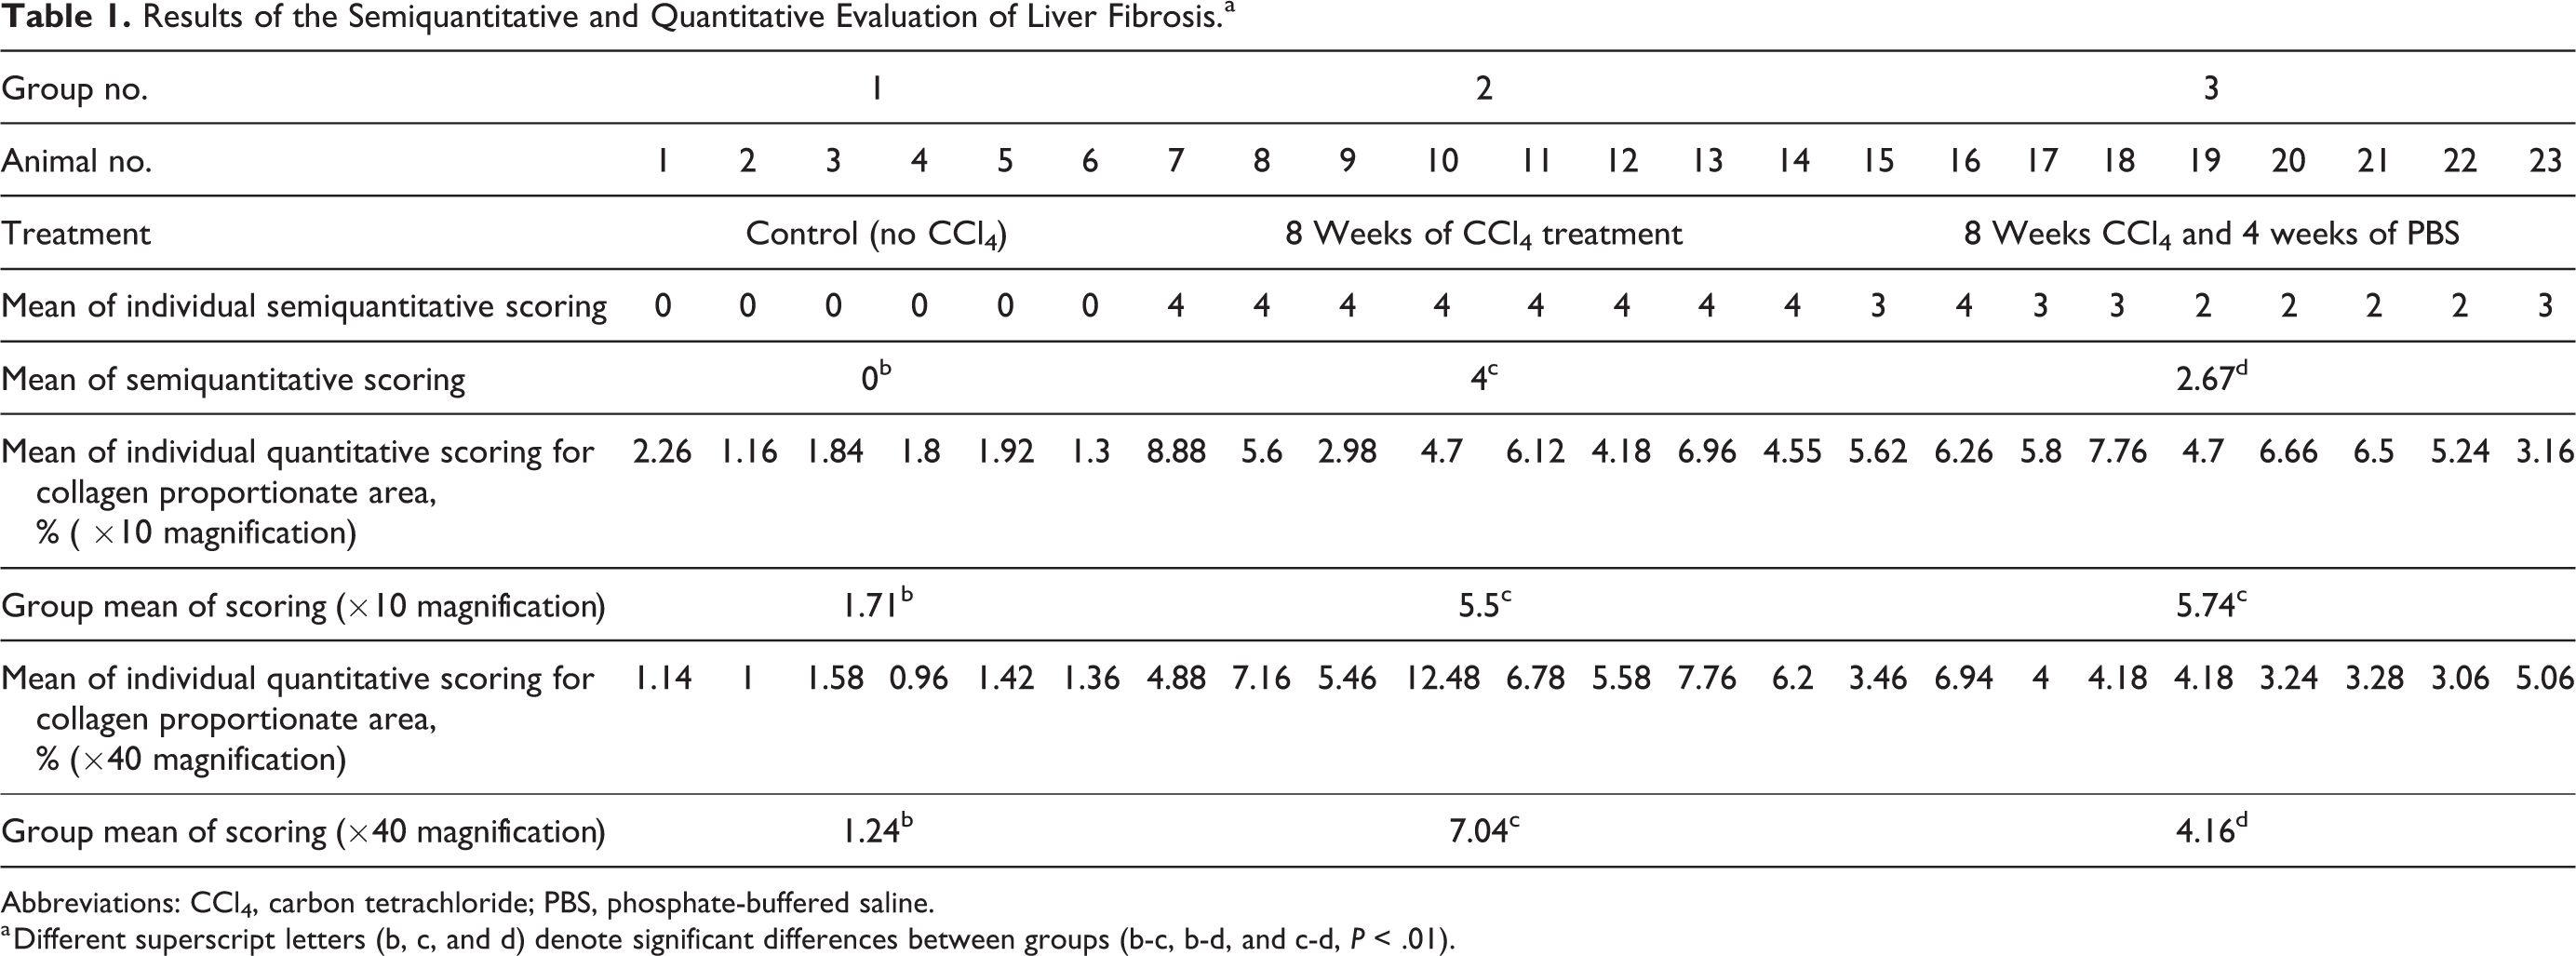
Abbreviations: CCl4, carbon tetrachloride; PBS, phosphate-buffered saline.
a Different superscript letters (b, c, and d) denote significant differences between groups (b-c, b-d, and c-d, P < .01).
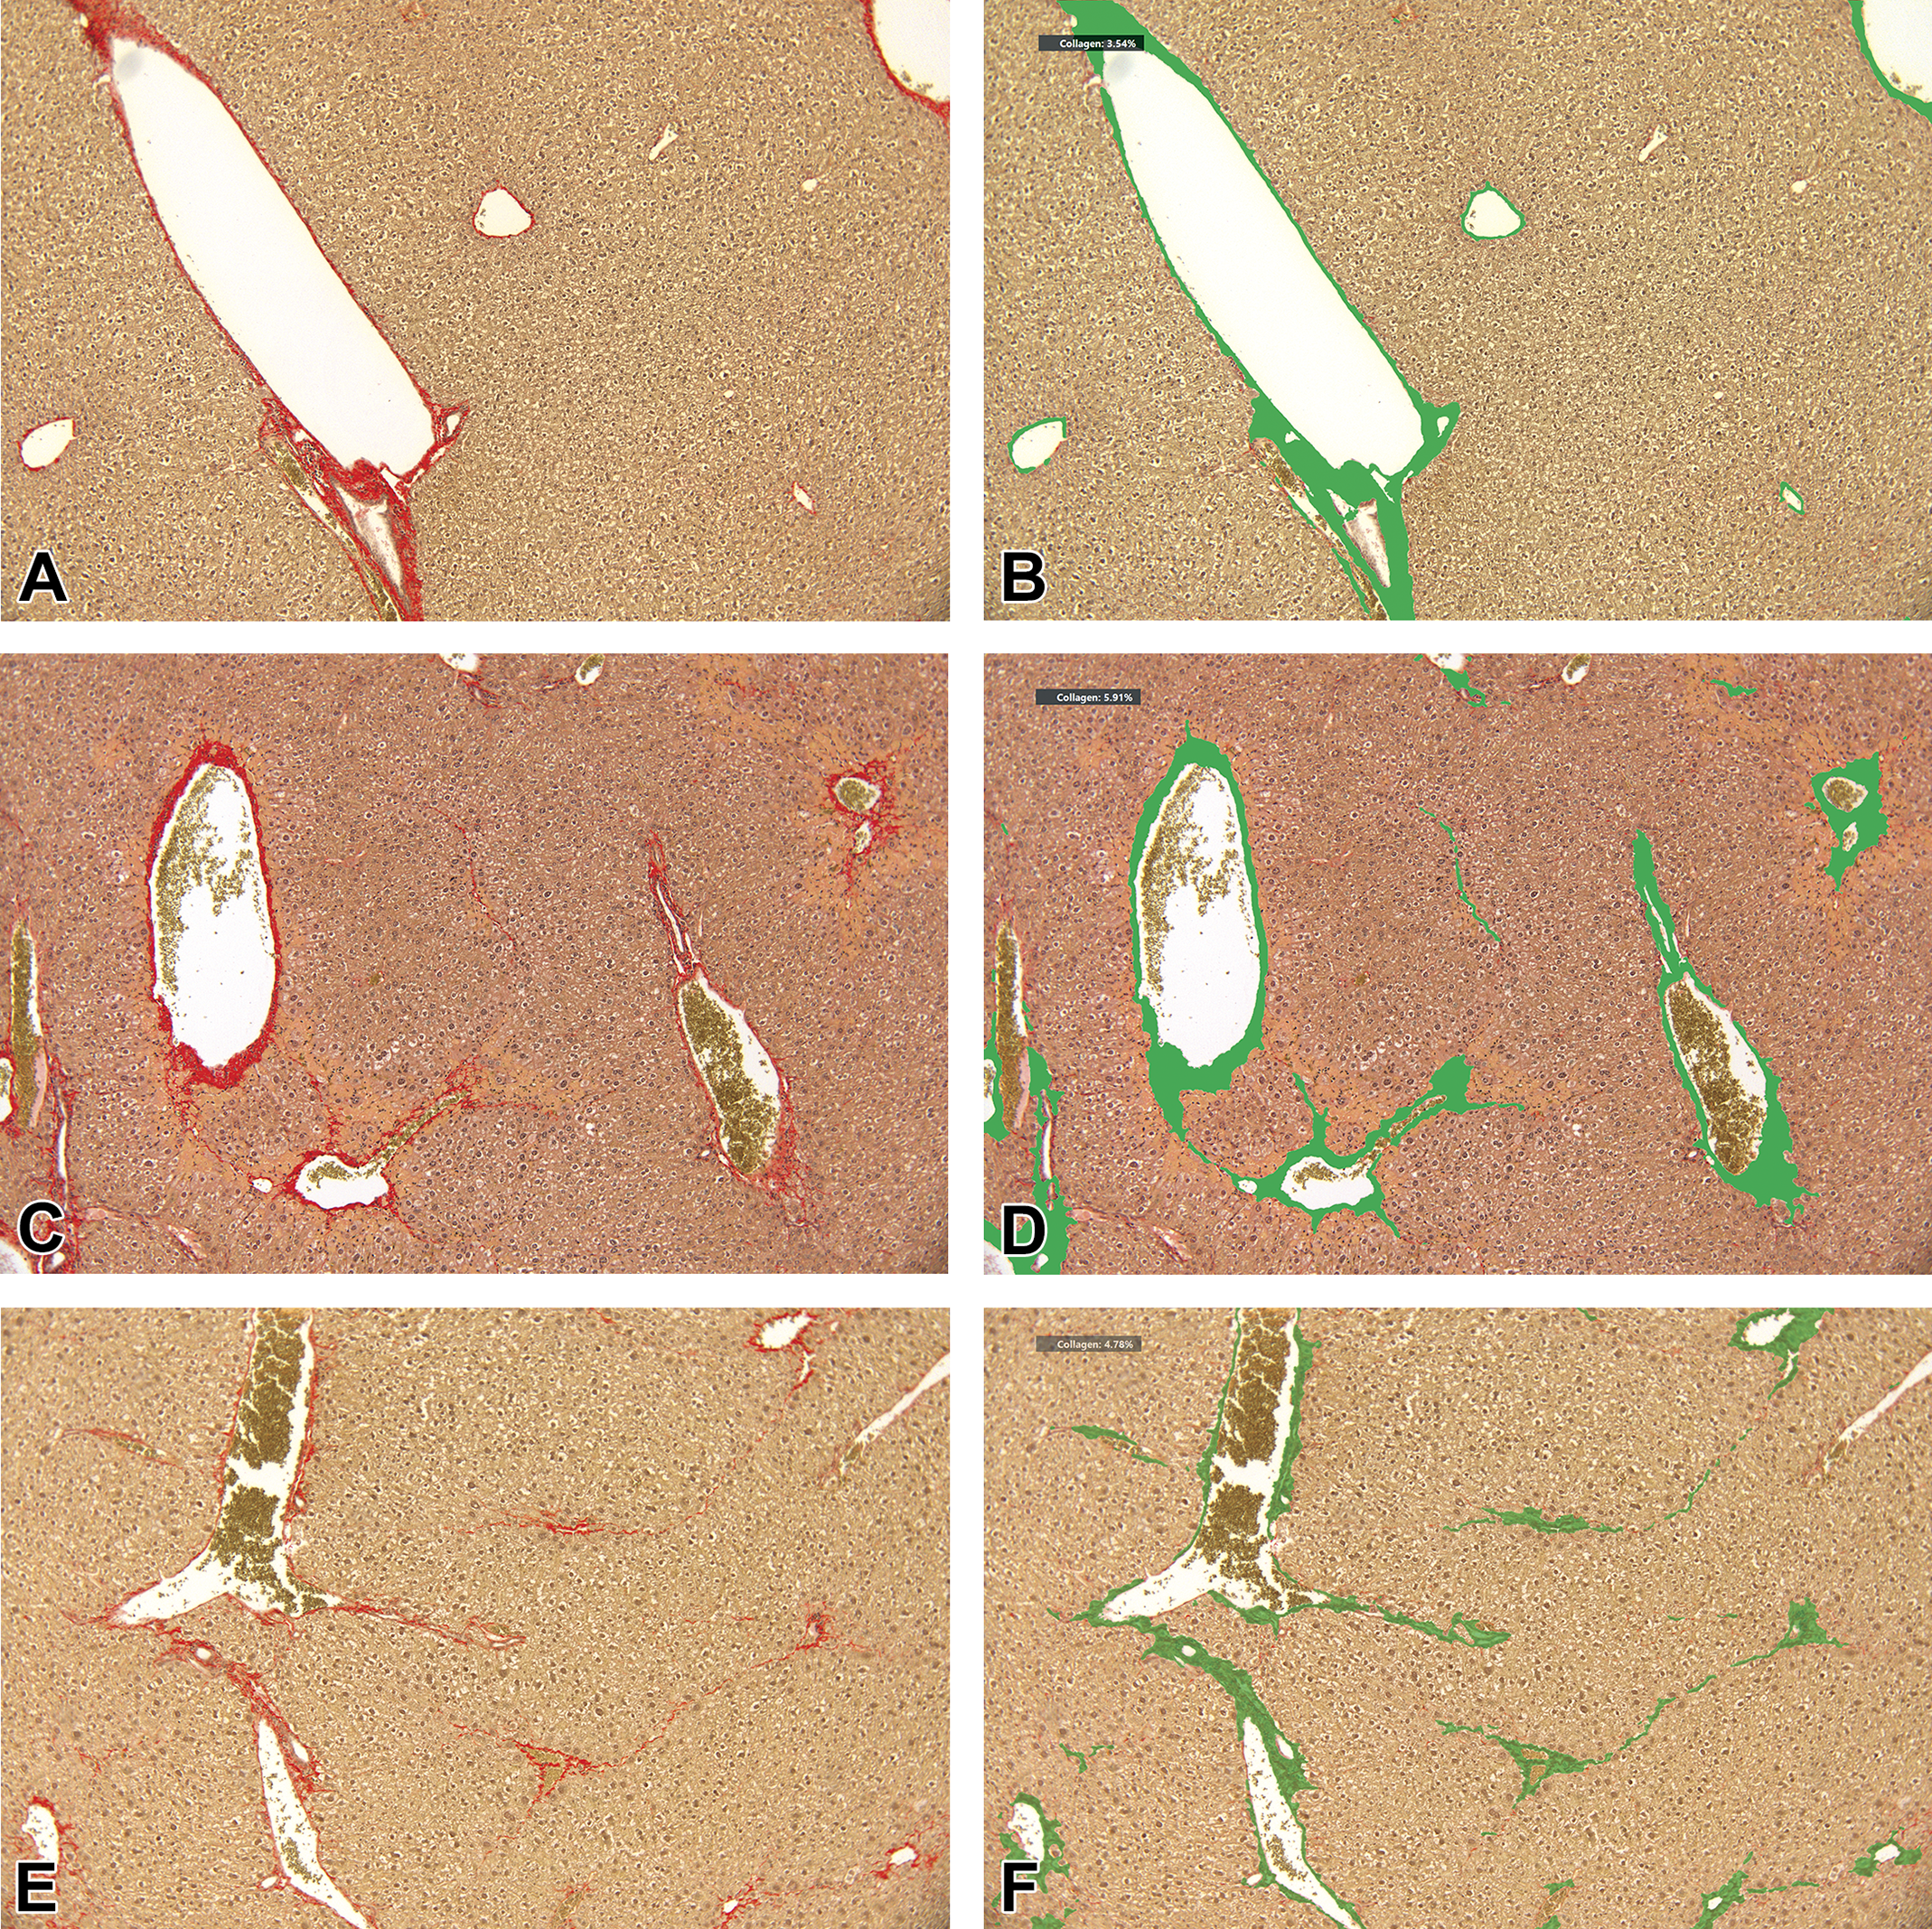
Quantitative assessment of liver fibrosis using image analysis. A, Liver section from a control mouse (group 1), picrosirius red staining, ×10 magnification. Semiquantitative assessment scoring of 0 (ISHAK score with modification). B, Same microscopic field as (A), with applied DIA as seen on the display system; CPA = 3.54%. C, Liver section from a mouse from group 2 (killed after 8 weeks), picrosirius red staining, ×10 magnification. Semiquantitative assessment scoring of 4 (ISHAK score with modification). D, Same microscopic field as (C), with applied DIA as seen on the display system; CPA = 5.91%. E, Liver section from a mouse from group 3 (killed after 12 weeks), picrosirius red staining, ×10 magnification. Semiquantitative assessment scoring of 3 (ISHAK score with modification). F, Same microscopic field as (E), with applied DIA as seen on the display system; CPA = 4.78%. G, Liver section from a control mouse (group 1), picrosirius red staining, ×40 magnification. Semiquantitative assessment scoring of 0 (ISHAK score with modification). H, Same microscopic field as (G), with applied DIA as seen on the display system; CPA = 1.73%. I, Liver section from a mouse from group 2 (killed after 8 weeks), picrosirius red staining, ×40 magnification. Semiquantitative assessment scoring of 4 (ISHAK score with modification). J, Same microscopic field as (I), with applied DIA as seen on the display system; CPA = 13.22%. K, Liver section from a mouse from group 3 (sacrificed after 12 weeks), picrosirius red staining, × 40 magnification. Semiquantitative assessment scoring of 3 (ISHAK score with modification). L, Same microscopic field as (K), with applied DIA as seen on the display system; CPA = 13.62%. CPA indicates collagen proportionate area; DIA, digital image analysis.
Using the DIA, a higher CPA was noted after CCl4 treatment, when compared to vehicle control, similar to the semiquantitative assessment (Table 1 and Figure 3B, D, F, H, J, L). Of note, in the ×10 magnification, there was no difference between group 2 and group 3 in the CPA, while a slightly lower CPA was seen in group 3 in the ×40 magnification, resembling the findings from the semiquantitative assessment (Table 1).
There was a statistically significant difference (P < .01) in the level of fibrosis of the different groups in each of the evaluation methods. However, only the pathologist’s assessment and the AI algorithm with the higher magnification were able to significantly statistically differentiate between the level of fibrosis in group 2 and group 3 (P < .01).
There was also a positive strong correlation (r s = 0.939, P < .001) between the level of fibrosis assessed by the pathologist and the level of fibrosis that was found by the AI algorithm with the higher magnification. A positive but weaker correlation (r s = 0.562, P < .01) was found between the level of fibrosis assessed by the pathologist and the level of fibrosis that was found by the AI algorithm with the lower magnification.
In recent years, DIA is increasingly being applied for evaluation in toxicologic pathology. 39,48 Artificial intelligence techniques are now being used for automated quantification of tissue and disease processes. 49 –51 In the current study, we used an area-based measurement approach, 52,53 where the surface area of PSR staining was quantified to assess the amount of collagen present in the tissue. To reliably detect and quantify the fibrotic tissue in the current study, a DL-AI algorithm was developed for evaluation at the different magnifications that were used in the current study (×10 and ×40 magnifications).
A better correlation was observed between the semiquantitative evaluation performed by the pathologist and the DIA when applied on the ×40 magnification compared to the ×10 magnification. This difference probably stems from the fact that the fibrotic process is most pronounced and initiates in the centrilobular regions. Since the microscopic fields in the ×40 magnification were focused on these regions, a better correlation was evident. In contrast, in the ×10 magnification, panlobular measurements were performed and therefore a larger area of nonfibrotic tissue was evaluated using the DIA, leading to a lesser accurate measurement. This exemplifies the importance of carefully choosing the right magnifications when using DIA for fibrosis quantification. The weaker correlation at lower magnification is likely related to lower accuracy of pathologist scoring and subjectivity inherent to scoring fibrosis across large areas (supralobular) with confounding influence of normal portal fibrous tissue, a factor that the algorithm is precisely designed and trained to overcome. At higher magnification, the subsampling of pathology fields within centrilobular regions eliminated this confounding influence, yielding a greater correlation. In addition, in the current study, 5 microscopic fields were chosen for each slide. Using additional number of fields for fibrosis assessment in each slide may possibly enhance the performance of this evaluation method.
In addition, the algorithm produces objective, reproducible, and faster results. As compared to simple thresholding, CNN achieves more generalization in terms of stain and light variations. Using threshold-based methods, one could adapt/update the threshold(s) even with a slight variation of stain, which CNN can handle if trained with sufficient data augmentation to incorporate stain variations.
In the current study, we have observed regression of fibrosis 4 weeks after cessation of the liver injury (CCl4 administration). This decrease in fibrotic tissue was evident both in the semiquantitative and quantitative (×40 magnification) measurements. While in humans, spontaneous regression of fibrosis is still a matter of research, it has been demonstrated to occur in small animal models. 54 –57 This process probably involves the degradation of the excessive deposited ECM, deactivation of the myofibroblasts, and a shift from a proinflammatory environment to a restorative milieu.
Digital image analysis and the use of automated algorithms can effectively assist toxicologic pathologist, and the pathologist has an important role in assessing and validating the performance of such algorithms. 48,49,58,59 Therefore, reports on correlation studies between semiquantitative evaluations by a board-certified toxicologic pathologist and the quantitative evaluation performed using DIA tools are of utmost importance. We have previously published a report on the use of a DL algorithm for quantification of fatty vacuoles in a fatty liver mouse model. 42 We found an excellent correlation between the manual semiquantitative evaluation and the quantitative evaluation of hepatic fatty vacuoles by the DIA. We believe that these reports and additional ones in the future can be of great benefit to ensure applicability of such novel tools in routine laboratory workflows.
Footnotes
Declaration of Conflicting Interests
The author(s) declared the following potential conflicts of interest with respect to the research, authorship, and/or publication of this article: Abraham Nyska is a consultant to AIRA Matrix, Augmentiqs, and AgomAb Therapeutics. Ameya Deshpande is an employee of AIRA Matrix Private Limited. Virginia Morello and Paolo Michieli are consultants of AgomAb Therapeutics.
Funding
The author(s) received no financial support for the research, authorship, and/or publication of this article.