
Abstract
Nickel nanoparticles (Ni-NPs) have been widely used in various industries related to electronics, ceramics, textiles, and nanomedicine. Ambient and occupational exposure to Ni-NPs may bring about potential detrimental effects on animals and humans. Thus, there is a growing effort to identify compounds that can ameliorate NPs-associated pathophysiologies. The present study examined Cinnamomum cassia (C. cassia) bark extracts (CMBE) for its ameliorative activity against Ni-NPs-induced pathophysiological and histopathological alterations in male Sprague Dawley rats. The biochemical analyses revealed that dosing rats with Ni-NPs at 10 mg/kg/body weight (b.w.) significantly altered the normal structural and biochemical adaptations in the liver and kidney. Conversely, supplementations with CMBE at different doses (225, 200, and 175 mg/kg/b.w. of rat) ameliorated the altered blood biochemistry and reduced the biomarkers of liver and kidney function considerably (p < 0.05) in a dose-dependent manner. However, the best results were at 225 mg/kg/b.w. of rat. The study provided preliminary information about the protective effect of C. cassia against Ni-NPs indicated liver and kidney damages. Future investigations are needed to explore C. cassia mechanism of action and isolation of single constituents of C. cassia to assess their pharmaceutical importance accordingly.
Keywords
Introduction
Nickel exposure is hazardous to human health and provokes skin allergies, such as skin redness, eczema, swelling, and other skin issues. Various industries utilizing electronics products are the source of nickel nanoparticles (Ni-NPs) released in the environment. 1 Nanoparticles are quite different from their bulk form not only in size but also in morphology, chemistry, redox characteristics, biodegradability, aggregation potential, concentration, stability, surface properties, solubility, and colloidal stability. 2 Nanotoxicology is an important subfield of nanotechnology to study the interplay of nanostructures with biological systems with an emphasis on elucidating the relationship between the physical and chemical properties (e.g. size, shape, surface chemistry, composition, and aggregation) and the induction of toxic biological responses. Identification of methods and/or compounds with protective potencies against these adverse effects is also one of the tasks of nanotoxicology. In vivo systems are commonly used and an important model for studying the interactions of the nanostructures with biological components, such as proteins and cells, could lead to unique biodistribution, clearance, immune response, and metabolism.
Plants have many bioactive contents with a broad-spectrum disease eradicating characteristics that can be extracted by various organic solvents. 3 Plant extracts are being utilized as antiatherosclerosis, antibacterial, antifungal, anti-inflammatory, anticancer, and anti-antiallergic products. Globally, more than 25% of drugs are based on extracts from medicinal plants. 4 Cinnamomum cassia (C. cassia) also known as Chinese cassia or Chinese cinnamon is an evergreen tree originated from southern China and widely cultivated in the area of eastern Asia (India, Indonesia, Laos, Malaysia, Taiwan, Thailand, and Vietnam) and southern Asia. In South Africa, C. cassia is used for the remedy of diabetes and also mixed in food as a spice. 5 Various cinnamon plant parts particularly the bark and branches extracts contain a variety of proanthocyanidins that have significant antihyperglycemic and antioxidant properties. 6 Each part of cinnamon has been commercially utilized with more nutraceutical importance in the bark and leaves. The key components of C. cassia are eugenol (leaf), camphor (root), and cinnamaldehyde (bark). 7 A recent study observed that cinnamon methanolic extracts improved the hyperglycemia, the biochemical as well as the histopathological alteration in rats. 8 A study reported that cinnamon ingestion enhanced different antioxidant levels such as superoxide dismutase (SOD), catalase (CAT), glutathione (GSH), and malondialdehyde (MDA) in antioxidant-deficient rats by Streptozotocin treatment. 9 Supportively, the aqueous cinnamon bark extract was found to scavenge the free radicals and helps to increase the concentration antioxidants. 10 The cinnamon infusion has a significant antioxidant activity as compared to ethyl acetate and ethanolic extracts. 11 The cinnamon at a dose of 400 mg/kg/body weight (b.w.) improved the lipid metabolism in rats fed with the high-fat diet. Additionally, C. cassia can reduce the triglyceride, cholesterol level, and fat accumulation in the liver of rats. 12 Cinnamon recovered the liver histoarchitecture of male Wistar rats that pre-treated with carbon tetrachloride (CCl4) by reducing various pathophysiological activities. 13 C. cassia bark extract also mitigated the antioxidant level and histological alterations of the liver as well as hematological parameters in titanium dioxide nanoparticles or titanium dioxide bulk salt-induced hepatotoxicity in Sprague Dawley rats. 14
Although, few studies concerned Ni-NPs-induced toxicity in vivo and its mitigation by medicinal plant products. From the above-cited literature, the protective effect of C. cassia against various metal and drugs is documented due to the presence of its phytoconstituents especially flavonoids and phenolic components. The present study investigated Ni-NPs-induced toxicity in male Sprague Dawley rats and its amelioration by C. cassia methanolic bark extracts. The target organs included were liver and kidneys as these organs are mainly involved in the detoxification and excretion of toxic metals.
Material and methods
Procurement and husbandry of experimental animals
Thirty healthy post-weaning male Sprague Dawley rats weighing approximately 80 g (4 weeks old) were purchased from the breeding center, University of Agriculture. The ethical committee of Government College University Faisalabad approved the use of the experimental animals. The rats were kept under pathogen-free conditions (temperature, 25 ± 2°C; humidity, 45–60%) during the experiment and fed the commercially available feed and tap water ad labium. All rats were treated as per the experimental protocols that evaluated and approved by the ethical committee. Before commencing the experiment, rats were acclimatized about 7 days. Later on, the rats of equal weight were randomly allocated into groups.
Experimental design
After the acclimatization, 30 rats were randomly allocated into six groups (n = 5). The experiment designed for 90 days whereas the route administration of Ni-NPs was intraperitoneal (i.p.) injection and C. cassia doses were administrated via oral gavage (o.g.). In C. cassia treated groups, Ni-NPs (10 mg/kg) was i.p. injected 30 min before C. cassia doses (225, 200, and 175 mg/kg/b.w. of rat) (Table 1).
Allocation of rats into different groups.

i.p.: intraperitoneal; o.g.: oral gavage; b.w.: body weight.
Procurement and dose preparation of Ni-NPs
Engineered Ni-NPs purchased from Richest Group Ltd, Shanghai, China. Ni-NPs sublethal dose was derived from the previously reported study of Ni-NPs-induced toxicity in rats. 15 For the preparation of Ni-NPs solution, mixed Ni-NPs in saline water (0.9 mg/100 mL) and then ultrasonicated (Universal Ultrasonic Cleaner, DSA100-SK1-2.8L) for 1 h to prevent the suspension to settle down and vortexed before use.
Ni-NPs characterization
The surface morphology of the Ni-NPs was analyzed using scanning electron microscope (SEM) (TESCAN VEGA 3). X-ray diffraction (XRD) technique was carried out for structural investigation. The X-ray source was Cu X-ray and the wavelength was 1.54°A and followed Scherrer’s equation to detect particle size.

where β is the full width at half maxima in radians and λ is the wavelength of X-rays.
Procurement, identification, and extract preparation of C. cassia bark
The scientific name of C. cassia verified by international database (the plant list and Tropicos). The complete accepted scientific name of C. cassia is Cinnamomum cassia (L.) J. Presl and the record was derived from World Checklist of Selected Plant Families (WCSP) (in review) (data supplied on March 23, 2012). C. cassia bark was purchased from the local market located in Faisalabad City and authenticated by the Department of Botany, Government College University Faisalabad. C. cassia barks were washed, dried, and ground with mechanical grinder into fine powder. One kilogram of C. cassia bark powder mixed into 2 L of methanol for extraction. The mixture of bark powder placed in the container at room temperature for 15 days until the C. cassia bark powder was dissolved in the methanol. Later on, the mixture was strained and the extract residue in methanol solution was isolated by vacuum filtration concentrated via rotary evaporator (1L/2L R-1001VN/R-1001LN). 16 The precipitate (C. cassia methanolic bark extract) weighed (445 g) and stored at room temperature for further use.
C. cassia dose preparation
The high (225 mg/kg/b.w.), medium (200 mg/kg/b.w.), and low (175 mg/kg/b.w.) doses of C. cassia methanolic bark extract (CMBE) were selected based on previously reported LD50 = 4.16 g/kg. 17 CMBE extracts were weighed according to need and mixed in 0.9% saline according to a certain ratio to make stock solution. The solution was ultrasonicated (Universal Ultrasonic Cleaner, DSA100-SK1-2.8L) for 1 h to prevent the suspension to settle down and vortexed before used.
Fourier transform infrared spectroscopy characterization of C. cassia bark extract
Fourier transform infrared (FTIR) spectroscopy (Spectrum 2, Perkin Elmer) was used to assess the phytoconstituents in C. cassia bark extract at the fingerprint regions. FTIR spectrometer was equipped with a deuterated triglycine sulfate detector and recorded in the rage of 500–4000 cm−1 range. Precisely weighed, dry C. cassia bark extract powder (100 mg) was coated on the KBr tablets to form thin liquid films for infrared spectrometry analysis. After baseline correction and smoothing were performed using the Spectrum 10 software (L1101006).
Blood and serum biomarker assessment
The rats were fastened overnight and anesthetized on the next day via administering ketamine hydrochloride (30 mg/kg/b.w.) and sacrificed. Blood was collected in blood clotting activator tubes (IMPROVACUTER®) and separated the serum by centrifugation at 3000 r min−1 for 10 min at 4°C for serum analysis to determine liver biomarkers (alanine aminotransferase, alkaline phosphatase, aspartate aminotransferase, total bilirubin, and lactate dehydrogenase) and biomarkers of kidney function (uric acid and creatinine and blood urea nitrogen). We collected the blood in EDTA tubes (IMPROVACUTER®) for assessment of blood chemistry (red blood cells, hemoglobin, hematocrit, mean corpuscle volume, mean corpuscle hemoglobin, mean corpuscle hemoglobin concentration, white blood cells, and platelet). All the parameters were assessed by an autoanalyzer (Chemistry Analyzer Tecno 786).
Tissue collection and homogenate formation for oxidative stress determination
The liver and kidney were excised and trimmed off fat tissues and washed with ice-cold phosphate saline buffer. The liver and kidney were then stored at −80°C for oxidative stress determination. Then, 100 g of tissue sample was weighed for determination of oxidative stress biomarkers such as GSH, MDA, CAT, and lipid peroxidation (LPO). Tissues were homogenated in 0.1M Tris-HCl, pH of buffer 7.4 and centrifuged at 9000 r min−1 at 4°C for 15 min. The supernatant collected and stored at −20°C. The oxidative stress biomarker CAT, GSH, MDA, and LPO were evaluated according to previous methodology. 18,19
Liver and kidney fixation and staining for histological analysis
The liver and kidney tissues collected at the time of sacrifice, trimmed fat tissue and fixed in 10% neutral buffered formalin. The fixed tissues were embedded in paraffin and sectioned about 3–4 µm and stained with hematoxylin-eosin (H&E). The slides were then examined under the microscope (Meiji Techno. MT4300H) and the images were captured with the camera (OPTIKA C-B1 1.3 Megapixel CMOS) and observed histopathologies. 20 The ordinal score was marked to evaluate the progression of pathologies. 21 In this method, we assigned data into defined categorical groups and scoring system was based on evaluation of the percentage of the pathology frequency per five randomly selected microscopic fields (400×) per rat (30 fields/organ/group of H&E stained sections that were within the normal limit or affected by pathology; in this case, the grade (0–4) were assigned (Tables 4 and 5).
Statistical analysis
The data statistically analyzed using analysis of variance (ANOVA) in the general linear model by Minitab 17 software to detect the effect of treatments on different parameters at p < 0.05 followed by Tukey post hoc test. The graphs were drawn via GraphPad Prism 8.0.1 software (Figure 1).

Graphical experimental scheme.
Results
Characterization of Ni-NPs
SEM characterization of Ni-NPs showed the average particle size range from 30 nm to 40 nm in homogeneous Ni-NPs solution (Figure 2). Whereas XRD peak (Figures 3) values (111, 200) were correspondent to 2θ (44.5° and 51.8°). The data showed that Ni-NPs have cubic phase according to peaks and showed a broadening trend due to the reduction of particle size. The Scherer formula used to calculate crystalline size that was 36.53 nm. The slight variation in SEM and XRD analysis is due to the agglomeration of Ni-NPs. While 88.02% Ni-NPs purity was recorded in the powder sample determined via energy-dispersive X-ray analysis (Figure 4).

SEM images of Ni-NPs at different magnification and the yellow labeling indicates Ni-NPs size randomly. (a) Magnification: 10 kx, bar 2 µm and (b) magnification: 10 kx, bar 2 µm. SEM: scanning electron microscope.

X-ray diffraction of Ni-NPs from the powder sample.

EDX analysis of Ni-NPs from powder sample. EDX: energy-dispersive X-ray. FTIR characterization of C. cassia bark extract.
FTIR characterization of C. cassia
The FTIR spectrum for C. cassia bark shows the presence of various constituents (Figure 5) and the present study focused on various fingerprint regions. Peak at 1320.40 cm−1 shows O–H bending and denotes the presence of derivatives of phenol. The 1617–1651 cm−1 explain the carbonyl group (C=O) that expresses the presence of aldehydes and cinnamaldehyde. The absorption at 1867 cm−1 attributes the presence of anhydride and isothiocyanate corresponds to the range (2000–2400 cm−1). The absorption at 3270.62, 36669.02, and 3736.34 cm−1 shows the presence of alkaloids and phenolic contents in C. cassia bark extracts.

FTIR spectrum of C. cassia. The spectrum shows a range of 500–4000 cm−1 wave numbers (along x-axis) and the function of % transmittance (along y-axis). FTIR: Fourier transform infrared.
Renal and liver function tests
Significant production of total bilirubin (TB), aspartate aminotransferase (AST), alkaline phosphatase (ALP), alanine transaminase (ALT), blood urea nitrogen (BUN), creatinine (CRT), and uric acid (UA) were measured after only Ni-NPs (10 mg/kg/b.w.) injection for 90 days. However, the CMBE supplementations (225, 200, and 175 mg/kg/b.w. of rat) with pre-treatments of Ni-NPs (10 mg/kg/b.w.) for 90 days on an alternate day significantly (p < 0.05) reduced TB, AST, ALP, ALT, BUN, CRT, and UA concentrations than only Ni-NPs treated group (Tables 2 and 3). The data showed dose-dependent response after the CBME supplementations and the best results were observed at high-dose (225 mg/kg) group (N-CG1).
The liver function test results in treatment groups.a

LFT: liver function test; TB: total bilirubin; AST: aspartate aminotransferase; ALT: alanine aminotransferase; ALP: alkaline phosphatase; LDH: lactate dehydrogenase; ANOVA: analysis of variance; SD: standard deviation.
a Values are mean ± SD. One-way ANOVA was used between the groups followed by Tukey post hoc test for comparison of means within groups. The means that do not share the same alphabets are significantly different at p < 0.05.
The renal function test results in treatment groups.a

RFT: renal function test; BUN: blood urea nitrogen; CRT: creatinine; UA: uric acid; ANOVA: analysis of variance; SD: standard deviation.
a Values are mean ± SD. One-way ANOVA was used between the groups followed by Tukey post hoc test for comparison of means within groups. The means that do not share the same alphabets are significantly different at p < 0.05.
Hematological analysis
The hematological analysis showed that only Ni-NPs exposure for 90 days on alternate reduced red blood cells (RBCs), hemoglobin (HB) that led to change in their indices hematocrit (HTC), mean corpuscular volume (MCV), mean corpuscular hemoglobin (MCH), and mean corpuscular hemoglobin concentration (MCHC). The white blood cells (WBCs) included granulocytes (GRA), monocytes (MON) and lymphocytes (LMY) and platelet (PLT) productions increased (p < 0.05) as well in only Ni-NPs treated group (NG). Although CMBE (225, 200, and 175 mg/kg/b.w.) supplementations for 90 days with pre-treatment of Ni-NPs (10 mg/kg/b.w.) significantly (p < 0.05) improved the RBCs and HB levels, as well as their indices (MCH, MCHC, HTC, and MCV) with dose-dependent manner than NG group (only Ni-NPs treated rats). The platelets and white blood cells (GRA, LMY, and MON) production also reinstated (p < 0.05) than only Ni-NPs (10 mg/kg) after CMBE supplementation for 90 days (Table 4). However, the best results of the hematological analysis were recorded in C. cassia high-dose (225 mg/kg) group (N-CG1).
The hematological analysis results in treatment groups.a

HB: hemoglobin; RBCs: red blood cells; WBCs: white blood cells; HTC: hematocrit; MCV: mean corpuscle volume; MCH: mean corpuscle hemoglobin; MCHC: mean corpuscle hemoglobin concentration; PLT: platelets; MON: monocyte; LYM: lymphocyte; GRA: granulocyte.
a Values are mean ± SD. One-way ANOVA was used between the groups followed by Tukey post hoc test for comparison of means within groups. The means that do not share the same alphabets are significantly different at p < 0.05.
Assessment of antioxidant defense biomarkers
The CAT and GSH levels lowered significantly (p < 0.05) in the liver and kidneys of NG group (only Ni-NPs i.p. injection at 10 mg/kg/b.w. of rat) than the control group (without treatment) after 90 days of exposure. Although C. cassia supplementations (225, 200, 175 mg/kg/b.w.) along with pre-treatment of Ni-NPs (i.p. injection at 10 mg/kg/b.w.) considerably (p < 0.05) restored the CAT as well as GSH levels in liver and kidneys tissues in a dose-dependent manner than only Ni-NPs group after 90 days of administration on an alternate day (Figures 6 to 9).

The oxidative stress biomarkers showing CAT level in kidney of control as well as treated groups. Values are mean ± SE. One-way ANOVA was used between the groups followed by Tukey post hoc test used for comparison within groups. The values do not bear the same letters that are significantly different (p < 0.05) in the kidney/liver group. SE: standard error; ANOVA: analysis variation; CAT: catalase.
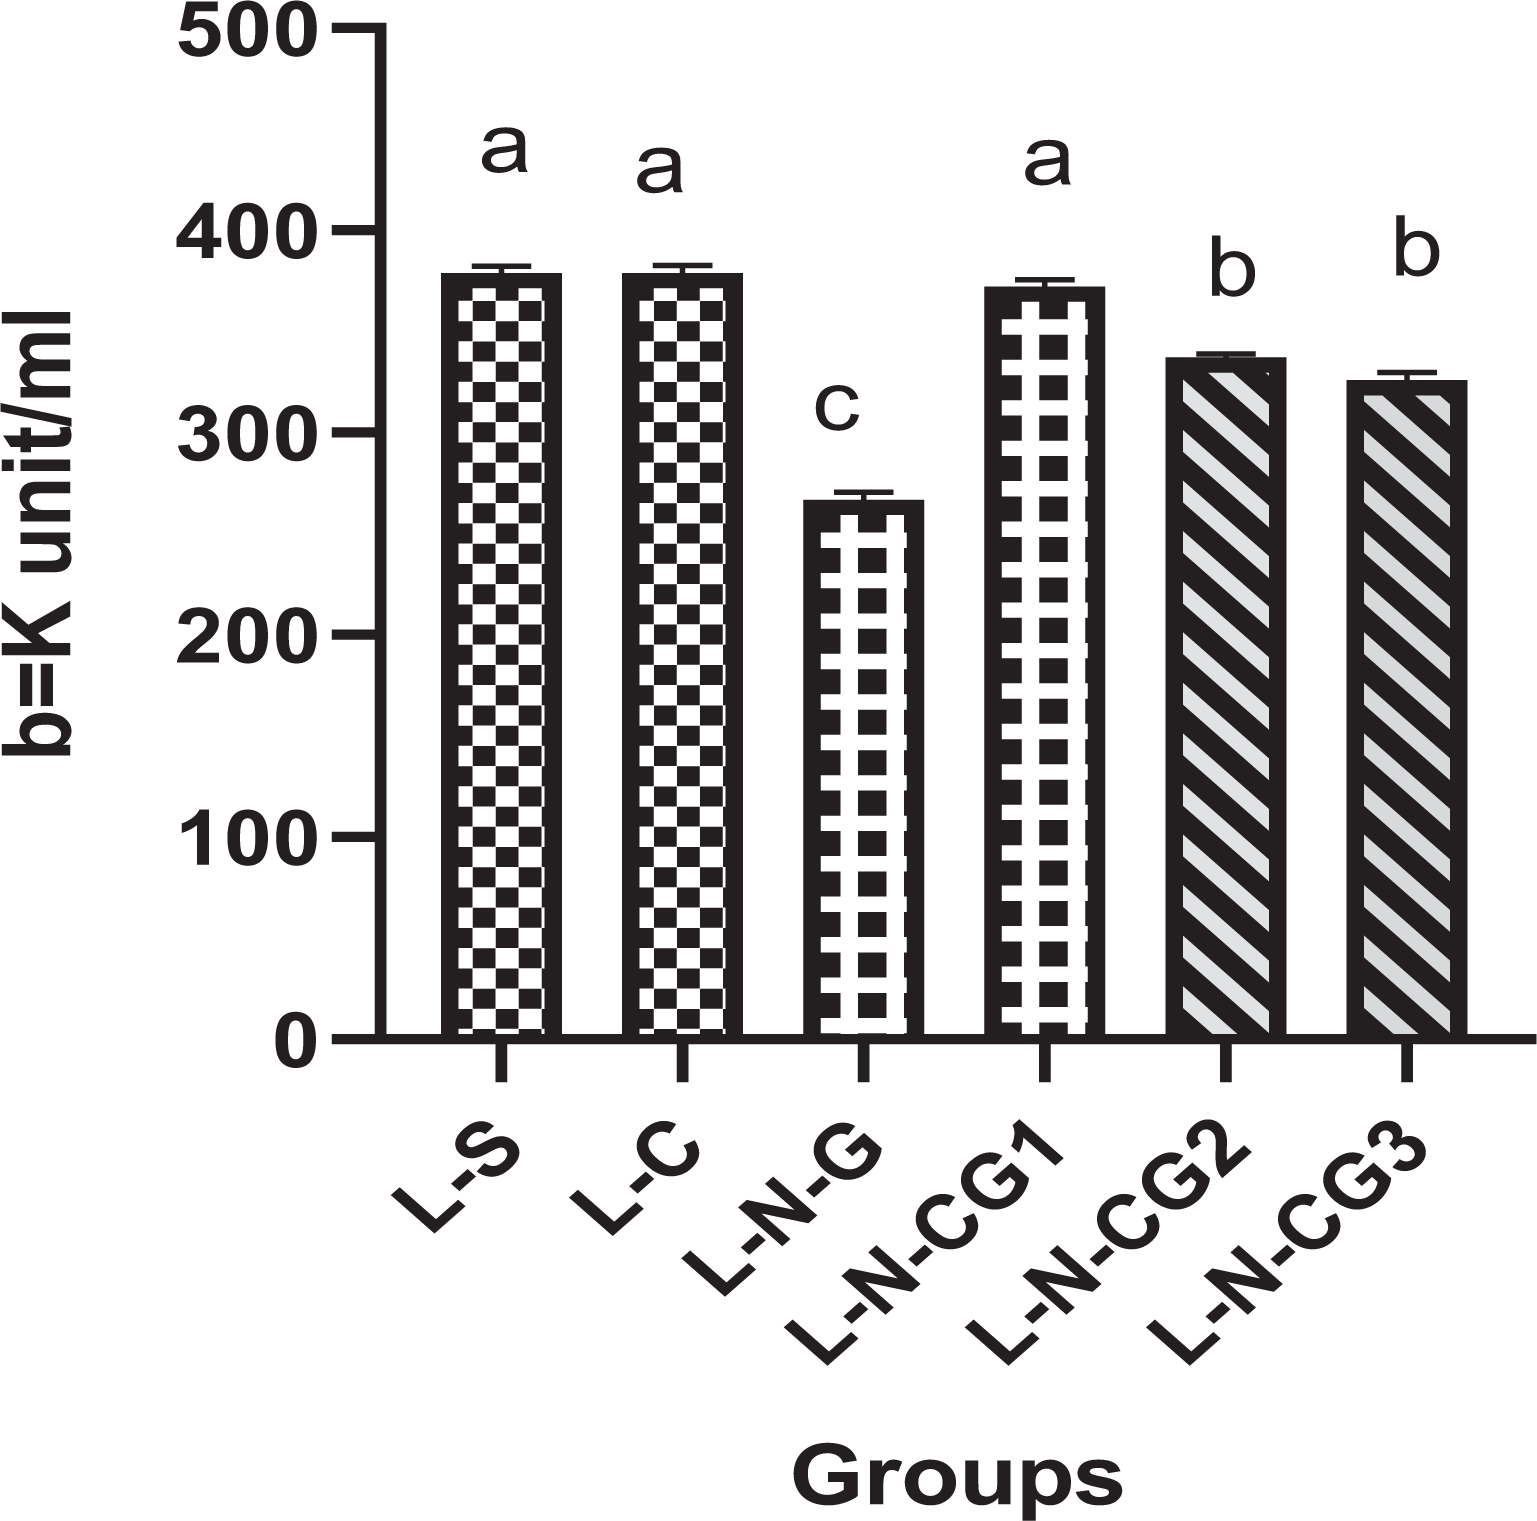
The oxidative stress biomarkers showing CAT level in liver of control as well as treated groups. Values are mean ± SE. One-way ANOVA was used between the groups followed by Tukey post hoc test used for comparison within groups. The values do not bear the same letters that are significantly different (p < 0.05) in the kidney/liver group. SE: standard error; ANOVA: analysis variation; CAT: catalase.

The oxidative stress biomarkers showing GSH level in liver of control as well as treated groups. Values are mean ± SE. One-way ANOVA was used between the groups followed by Tukey post hoc test used for comparison within groups. The values do not bear the same letters that are significantly different (p < 0.05) in the kidney/liver group. SE: standard error; ANOVA: analysis variation; GSH: glutathione.

The oxidative stress biomarkers showing GSH level in kidney of control as well as treated groups. Values are mean ± SE. One-way ANOVA was used between the groups followed by Tukey post hoc test used for comparison within groups. The values do not bear the same letters that are significantly different (p < 0.05) in the kidney/liver group. SE: standard error; ANOVA: analysis variation; GSH: glutathione.
Assessment of peroxidative damage by MDA and LPO levels
MDA and LPO levels of liver and kidneys were significantly (p < 0.05) high in NG group as compared to the negative control group (without treatment). While supplementations of CMBE for 90 days on an alternate day with pre-treatment of Ni-NPs (i.p. injection at 10 mg/kg/b.w.) reduced the MDA and LPO levels significantly (p < 0.05) than NG group and the concentrations of MDA and LPO decrease with the increase in the concentration of CMBE (Figures 10 to 13).

The oxidative stress biomarkers showing LPO level in liver of control as well as treated groups. Values are mean ± SE. One-way ANOVA was used between the groups followed by Tukey post hoc test used for comparison within groups. The values do not bear the same letters that are significantly different (p < 0.05) in the kidney/liver group. SE: standard error; ANOVA: analysis variation; LPO: lipid peroxidation.

The oxidative stress biomarkers showing LPO level in kidney of control as well as treated groups. Values are mean ± SE. One-way ANOVA was used between the groups followed by Tukey post hoc test used for comparison within groups. The values do not bear the same letters that are significantly different (p < 0.05) in the kidney/liver group. SE: standard error; ANOVA: analysis variation; LPO: lipid peroxidation.

The oxidative stress biomarkers showing MDA level in kidney of control as well as treated groups. Values are mean ± SE. One-way ANOVA was used between the groups followed by Tukey post hoc test used for comparison within groups. The values do not bear the same letters that are significantly different (p < 0.05) in the kidney/liver group. SE: standard error; ANOVA: analysis variation; MDA: malondialdehyde.

The oxidative stress biomarkers showing MDA level liver of control as well as treated groups. Values are mean ± SE. One-way ANOVA was used between the groups followed by Tukey post hoc test used for comparison within groups. The values do not bear the same letters that are significantly different (p < 0.05) in the kidney/liver group. SE: standard error; ANOVA: analysis variation; MDA: malondialdehyde.
The biochemical analyses (serum, blood, and oxidative stress biomarker analyses) revealed the best results after supplementations of C. cassia bark extracts were recorded in high dose (225 mg/kg/b.w. of rat) and the order of improvements in groups is explained as N-CG1 > N-CG2 > N-CG3.
Histopathological analysis of kidney
Histopathological examination marked considerable necrosis and vascular dilation in kidney sections after Ni-NPs (10 mg/kg/b.w.) i.p. injection for 90 days (Figure 14(e) and (f)). The changes in the histopathologic parameter and the progression of renal damage are shown in Table 4. While after CMBE supplementations (225, 200, 175 mg/kg/b.w.) for 90 days on an alternate day with pre-treatment of i.p. injection of Ni-NPs reduced interstitial edema, acute tubular necrosis, glomerulus sclerosis, vascular dilation, hypertrophy, cloudy swelling (Figure 15(a) to (f)). The ordinal score observed improvement of progression of pathologies with the increase in CMBE concentrations (Table 5). The order improvement of kidney histoarchitecture after C. cassia supplementation is as N-CG1 > N-CG2 > N-CG3.
The ordinal grading of kidney histopathologies.a

ATN: acute tubular necrosis; GN: glomerulus nephritis; GS: glomerulus sclerosis; ISE: interstitial edema; VD: vascular dilation; CS: cloudy swelling; TH: hypertrophy; PN: pyknotic nuclei.
a Randomly selected sections (n = 5 per rat per group) then designated within the normal limit or with pathology. Percentage (%) progression of pathologies. Damaged sections/total sections × 100. Ordinal grading (0–4) of progression of pathologies; 0: no abnormal structural changes: 1: low progression, 20% structural changes; 2: mild progression, 40% structural changes; 3: moderate progression, 60% structural changes; and 4: severe progression, 60% structural changes. The values do not bear the same letters that are significantly different (p < 0.05).

The transverse kidney sections were stained with hematoxylin and eosin (H&E). (a) and (b) Normal glomerulus in the cortex and medulla region in the control group (without any treatment); C (×400). (c) and (d) Normal glomerulus in the cortex and medulla region in placebo (i.p. injection of 1 mL 0.9% saline); P (×400). (e) and (f) Histopathologies in only Ni-NPs (10 mg/kg/b.w.) treated group and observed GN, ATN, VD around medulla region; NG (×400). GN: glomerulus nephritis; ATN: acute tubular necrosis; VD: vascular dilation.

The transverse kidney sections were stained with hematoxylin and eosin (H&E). (a) and (b) GS, ISE, ATN, VD, and PN in CMBE high-dose (225 mg/kg/b.w.) treated group (N-CG1 (×400)). (c) and (d) GS, ATN, ISE, VD, CS, and HT in CMBE medium-dose (200 mg/kg/b.w.) treated group (N-CG2 (×400)). (e) and (f) GS, HT, and VD in CMBE low-dose (175 mg/kg/b.w.) treated group (N-CG3 (×400)). GS: glomerulus sclerosis; ISE: interstitial cell edema; ATN: acute tubular necrosis; VD: vascular dilation; PN: pyknotic nuclei; CMBE: Cinnamomum cassia bark extracts; CS: cloudy swelling; HT: hypertrophy.
Histopathological analysis of liver
Histopathological analysis of liver sections of control and placebo showed normal histoarchitecture (Figure 16(a) to (d)). Considerable histopathological alterations like steatosis, sinusoidal dilation, necrosis, inflammation, and congestion observed in only Ni-NPs (i.p. injection of 10 mg/kg/b.w.) treatments for 90 days (Figure 16(e) to (f)). However, after 90 days the CBME supplementation (225, 200, and 175 mg/kg/b.w.) on an alternate day mitigated the severity of histopathologies due to pre-treatment of Ni-NPs (10 mg/kg/b.w.) included sinusoidal dilation, infiltration, congestion, necrosis, vascular dilation, infiltration, and hypertrophy (Figure 17(a) to (f)). The ordinal score observed reduction of pathological progression with the increase in CMBE concentrations (Table 6). The order of improvement of histopathologies after C. cassia treatments is as N-CG1 > N-CG2 > N-CG3.

The transverse liver sections were stained with hematoxylin and eosin (H&E). (a) and (b) Normal liver PV and CV area in the control group (C (×400)). (c) and (d) Normal liver PV and CV area in saline (injected) group (P (×400)). (e) and (f) Histopathologies in only Ni-NPs (10 mg/kg/b.w.) treated group (NG (×400)) and marked SD, ST, NIC around CV area, infiltration and CON around the PV and CV. H: hepatocytes; PV: portal vein; CV: central vein; SD: sinusoidal dilation; NIC: necrosis; CON: congestion.

The transverse liver sections were stained with hematoxylin and eosin (H&E). (a) and (b) VC, NIC around CV area, and ST in CMBE high-dose (225 mg/kg/b.w.) treated group (N-CG1 (×400)). (c) and (d) NIC and HT, SD, and CON in CMBE medium-dose (200 mg/kg/b.w.) treated group (N-CG2 (×400)). (e) and (f) NIC around CV and PV and HT, VD and INF around CV in CMBE low-dose (175 mg/kg/b.w.) treated group (N-CG3 (×400)). VC: vascular constriction; NIC: necrosis; ST: steatosis; CMBE: Cinnamomum cassia bark extracts; HT: hypertrophy; VD: vascular dilation; PV: portal vein; CV: central vein; SD: sinusoidal dilation; CON: congestion; INF: infiltration.
The ordinal grading of liver histopathologies.a
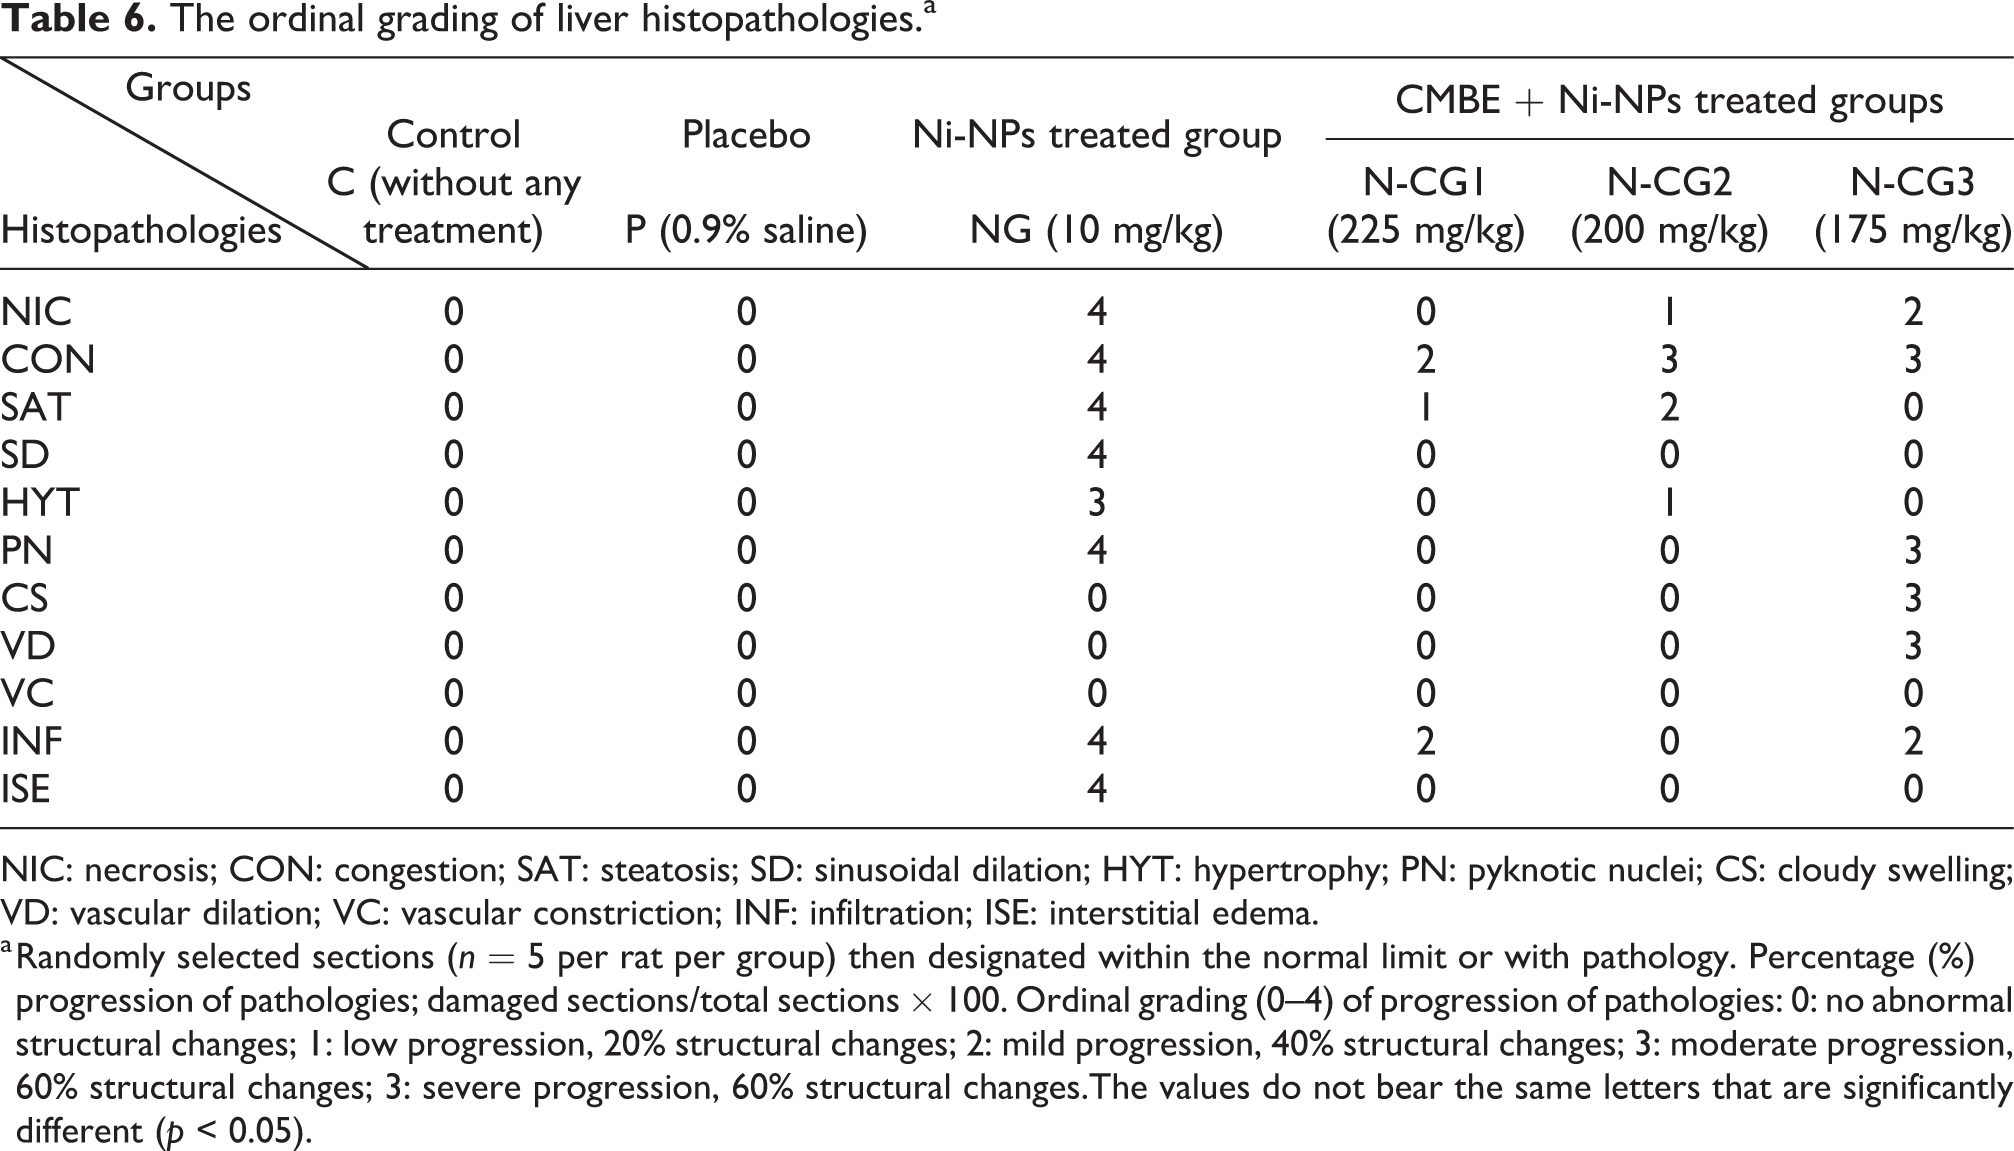
NIC: necrosis; CON: congestion; SAT: steatosis; SD: sinusoidal dilation; HYT: hypertrophy; PN: pyknotic nuclei; CS: cloudy swelling; VD: vascular dilation; VC: vascular constriction; INF: infiltration; ISE: interstitial edema.
a Randomly selected sections (n = 5 per rat per group) then designated within the normal limit or with pathology. Percentage (%) progression of pathologies; damaged sections/total sections × 100. Ordinal grading (0–4) of progression of pathologies: 0: no abnormal structural changes; 1: low progression, 20% structural changes; 2: mild progression, 40% structural changes; 3: moderate progression, 60% structural changes; 3: severe progression, 60% structural changes.The values do not bear the same letters that are significantly different (p < 0.05).
Discussion
The Ni-NPs is considered as one of the important and used NPs owing to their commercial and industrial utilization. Thus, the present study aimed to assess potent toxic effects of Ni-NPs after i.p. injection in male Sprague Dawley rats to induce liver and kidney pathophysiological and histopathological alterations and the amelioration by C. cassia. The study used engineered Ni-NPs of less than 40 nm. We characterized Ni-NPs by SEM and XRD analysis to assess mean size and crystalline structure. The characterization revealed that the average size of Ni-NPs was 30–40 nm and the XRD peaks (111, 200) expressed the crystallization in the cubic phase and Scherrer equation calculated the mean size of NiO NPs as 36.53 nm. These results were relevant with the findings of Shamim et al. who exhibited the diffraction pattern of Ni-NPs and observed three distinctive peaks at 37.248°, 43.275°, and 62.878° which indexed to 111, 200, and 220 and calculated average size of 45 nm and SEM results showed an average size of 40 nm. 22 We also characterized C. cassia bark extract by FTIR spectroscopy and found fingerprint regions corresponded to the flavonoids and phenolic compounds which suggested C. cassia have the potential to mitigate Ni-NPs-induced toxicity. 23,24
The hematological analysis of blood samples collected from only Ni-NPs (i.p. injection of Ni-NPs at 10 mg/kg) exposed group showed considerable (p < 0.05) decrease in RBCs and HB which indicated the anemia. The anemic condition might be due to the blood cell lysis. The increase in the production of WBCs and platelets were detected in the NG group on the account of immunogenic response to cope with infection after Ni-NPs exposure at 10 mg/kg/b.w. on alternate 90 days. The finding also corresponds to Tiwari et al. 25 who reported increase in WBCs production after injection of silver nanoparticles in Wistar rats in a dose-dependent manner. While C. cassia supplementations (225, 200, 175 mg/kg/b.w.) after pre-treatment of Ni-NPs showed dose-dependent improvement than NG group. While better results were found on C. cassia high dose (225 mg/kg). Very few studies have focused on the cinnamon protective effects against metal or any drug-induced toxicity. One of few investigations of cinnamon protective effects against TiO2 NPs and bulk TiO2 found mitigation of hematotoxicity on oral supplementations of cinnamon extracts. 14
The liver profile showed the biochemical changes and significant (p < 0.05) increase in liver biomarkers (TB, ALP, ALT, AST, and LDH) were observed in NG group (only treated with 10 mg/kg/b.w.) than those control. The increase in the production of liver enzymes observed due to the accumulation of Ni-NPs in hepatocytes. While the biomarkers (CRT, BUN, and UA) of kidneys were also increased significantly (p < 0.05) which indicated kidney dysfunction. As per the previous finding, the increase in liver enzymes production involved the accumulation of NiO NPs in liver cells on oral administration that caused cell necrosis and destruction of cell membranes which led to the leakage of liver enzymes in the blood system. That may explain the high concentrations of liver enzymes. 26 Valentini et al. investigated titanium oxide nanoparticles (TiO2 NPs)-induced injuries in Kupffer cells, hepatocytes, and immunohistochemistry marked 4-hydroxynonenal that is a biomarker of oxidative stress. While in the kidney the most affected parts were proximal tubes when exposed to higher doses of TiO2 NP and these biochemical alterations explained as the kidney and liver damage. 27 These findings were also consistent with the findings of Wang et al. who reported the alteration of biomarkers of liver and kidneys due to TiO2 NPs caused liver and kidney histoarchitectural alterations (glomerulus swelling and tubules became pack with the proteomic liquid) because of accumulation of TiO2 NPs. 28 The present study showed supplementations of C. cassia for 90 days with pre-treatment of Ni-NPs (i.p. injection at 10 mg/kg/b.w.) on the alternate days helped to improve the liver and kidney profile (p < 0.05) than only Ni-NPs treated rats in dose-relation and found better results at 225 mg/kg/b.w. Our findings are consistent with Tanomand and Najafian 29 who reported cinnamon protective effects against gentamicin-induced on supplementations of cinnamon extract at doses, that is, 50, 100, and 200 mg/kg/b.w. of rat. While Ullah et al. 30 also found co-supplementation of cinnamon plus gentamicin at highest concentration improved the kidney profile in rats and suggested antioxidant effects of cinnamon are due to the presence of the copious amount of phenolic and flavonoid contents. Several recent studies have described a direct relationship between the oxidant stress induced by toxins or metal nanoparticles and its characterization by determination of the activity of oxidative stress-related biomarkers (MDA, LPO, CAT, and GSH). Our study observed significant (p < 0.05) reduction of GSH and CAT levels and an increase in the by-product of oxidation like MDA and LPO after Ni-NPs (10 mg/kg) i.p. injection for 90 days than the control group. These findings were in line with previous studies who reported the inhibitory effect of nanoparticles which hinder the antioxidative system. 31 -33 Although after the CMBE supplementations with pre-treatment of Ni-NPs we observed considerable improvements in antioxidant levels (CAT and GSH) and reduction of the oxidation by-products (LPO and MDA) in liver and kidneys than only Ni-NPs treated group (NG). The antioxidant properties of C. cassia against Ni-NPs-induced oxidative stress was similar to findings of Shakeel et al. 14 who reported a significant dose-dependent decrease of MDA and increase of anti-oxidant enzymes GPX, SOD, and CAT due to C. cassia oral administration in titanium oxide (TiO2 NPs) exposed Sprague Dawley rats. Similar findings were also observed in Morgan et al. (2012) 34 study who stated a stable antioxidant system after C. cassia administration in octylphenol- and bisphenol A-induced oxidative stress in rats. The current finding also consistent with the previous investigations of Azab et al. who investigated the reduction of radiation-induced oxidative stress by cinnamon extract in rats and found considerable amelioration of the liver antioxidant system; glutathione peroxidase, CAT, SOD activities, and reduced glutathione concentration than only irradiated rats. 35
These serum biochemical alterations and oxidative stress in liver and kidney because of Ni-NPs (10 mg/kg/b.w.) exposure led to the occurrence of various histopathologies (cloudy swelling, pyknotic nuclei, and necrosis). The accumulation of blood urea, bilirubin, uric acid, and creatinine, and significant (p < 0.05) liver enzymes production might cause swelling and injuries in renal and hepatic tissues. The main phenomenon in this regard was reported in previous investigations which stated the deposition of fat vacuoles that brought about mitochondrial destruction because of nanoparticle accumulation that leads to ionic imbalance and energy loss. These pathophysiological alterations included pyknotic nuclei, necrotic cells, and tubular dilation of kidney and liver tissues. 36 Our findings are in great agreement to Dumala et al. investigation who found biochemical changes and accumulation of NiO NPs-induced liver injuries in rats. 26 The present data also agree with the finding of Magaye et al. who reported that Ni-NPs-induced liver injuries were due to significant serum biochemical alteration in Sprague Dawley rats. 37 Wang et al. observed the toxic effects of ferric oxide and zinc oxide nanoparticles and marked significant liver and kidney alterations in Wistar rats nanoparticle accumulation. 38 CMBE supplementations exhibited dose-dependent improvements of liver and kidney histopathologies (necrosis, sinusoidal dilation, congestion, cloudy swelling, hypertrophy, infiltration of inflammatory cells, vascular dilation, and pyknotic nuclei) than only Ni-NPs treatments. The ordinal scoring showed that the significant mitigation exhibited at the higher dose of CMBE (225 mg/kg). Our histological analysis after CMBE supplementations is consistent with Hussain et al. investigations who found the hepato- and renal-protective role of C. cassia against acetaminophen-induced liver and kidney injuries and suggested antioxidant role C. cassia is due to the surplus amount of phytoconstituents. 39
These pathophysiological and structural mitigation by C. cassia methanolic bark extracts might be due to phenolic and flavonoids derivatives as our FTIR spectrum denoted their presence.
Conclusion
The present study reported that Ni-NPs at 30–40 nm induced liver and kidney pathophysiological changes in liver and kidney and supplementations with CMBE attributed to improving pathophysiological parameters in a dose-dependent manner. Additionally, CMBE was found to be proficient to reinstate the kidney and liver profile as well as restored the typical array of liver and kidney histoarchitecture. Our results also suggested that the hepatic- and renal-protective effects of C. cassia bark extracts are due to the presence of phytoconstituents such as phenolic and flavonoid contents which may assist to decrease the reactive oxygen species generation by scavenging the free radicals. The decrease in oxidative stress led to recovering the pathophysiologies as well as histopathologies. Conclusively, the study denoted C. cassia methanolic bark extracts is a potent antidote to improve Ni-NPs-induced hepato- and nephrotoxicity. Further phytochemical analysis is required to evaluate the quantity and bioavailability of individual phytoconstituents that seemed to be involved in various biological activities. There is also a need to extend the study to assess C. cassia mechanism of action at the molecular level to figure out their signaling pathways and evaluation of upregulation or downregulation of important transcription factors, which modulate the signaling pathways associated with Ni-NPs-induced toxicities. Moreover, for proper medical use, further study requisite to prescribe safer doses for humans in accordance with pathology.
Footnotes
Acknowledgments
I acknowledged my research work to my supervisors Prof. Dr Farhat Jabeen and Dr Cheng Peng for their continuous guidance.
Declaration of conflicting interests
The author(s) declared no potential conflicts of interest with regard to the research, authorship, and/or publication of this article.
Funding
The author(s) received no financial support for the research, authorship, and/or publication of this article.