
Abstract
Mer proto-oncogene tyrosine kinase (MerTK), which is expressed in the retinal pigment epithelium (RPE), regulates phagocytosis of shed photoreceptor outer segments (POS). To investigate the effects of drug-induced MerTK inhibition on the retina, UNC569, a specific MerTK inhibitor, was orally administered to male mice at a concentration of 60, 100, or 150 mg/kg for up to 14 days. Furthermore, MerTK inhibition in the retinal tissue sample was examined using a phosphorylation assay following a single dose of UNC569 at 100 mg/kg. In electron microscopic examination, UNC569 at 100 mg/kg or more increased phagosomes and phagolysosomes in the RPE. In addition, UNC569 at 150 mg/kg increased chromatin-condensed nuclei in the outer nuclear layer, indicating the early phase of apoptosis of photoreceptor cells. MiR-183, miR-96, and miR-124, which are enriched in photoreceptor cells, were elevated in the plasma of mice following treatment of 150-mg/kg UNC569, in conjunction with the photoreceptor lesion. Additionally, 100-mg/kg UNC569 inhibited MerTK phosphorylation in the retina. These results suggest that MerTK inhibition impaired phagocytic function of the retina, leading to accumulation of shed POS within the POS layer and increasing phagosomes and phagolysosomes in the RPE to delay POS renewal, resulting in apoptosis of photoreceptor cells.
The retinal pigment epithelium (RPE) plays crucial roles in the function and survival of photoreceptor cells (Strauss 2005). The major functions of the RPE are (i) transportation of nutrients and ions between photoreceptors and the choriocapillaris, (ii) phagocytosis of shed photoreceptor outer segments (POS), and (iii) reisomerization of all-trans-retinal back into 11-cis-retinal, namely, the maintenance of the “visual cycle.” In general, tight junctions between the RPE, a part of the blood–retinal barrier, are thought to prevent photoreceptor cells from being affected by systemically administered drugs, but the RPE itself can be influenced by drugs because of its localization; basolateral membranes face the choriocapillaris (Mecklenburg and Schraermeyer 2007; Strauss 2016). Therefore, drug-induced changes on the RPE raise safety concerns regarding photoreceptor integrity.
Mer proto-oncogene tyrosine kinase (MerTK) is a member of the Tyro 3, Axl, and Mer (TAM) transmembrane receptor tyrosine kinase subfamily, which is widely expressed by immune, nervous, vascular, and reproductive system cells. TAM receptors bind to their ligands, Gas6 and Protein S, leading to TAM dimerization, tyrosine phosphorylation, and intracellular signaling. TAMs regulate diverse processes including phagocytosis of apoptotic cells, inhibition of inflammatory responses, and cell proliferation. In addition, they are overexpressed in numerous cancers, such as myeloid and lymphoblastic leukemia, melanoma, breast, lung, colon, and liver cancers; thus, TAM receptors may be therapeutic targets for cancers (Hall et al. 2005; Linger et al. 2008; Lemke 2013).
In the retina, MerTK is expressed in the RPE and regulates the phagocytosis of shed POS. The process of RPE phagocytosis is divided into 3 phases: binding, internalizing, and digesting shed POS. The former 2 are the receptor-mediated events, with the αvβ5 receptor and MerTK mediating the binding and internalization of shed POS, respectively (Hall and Abrams 1987; Finnemann et al. 1997; Feng et al. 2002). The Royal College of Surgeons (RCS) rat, which shows the loss of photoreceptor cells attributed to failure of the RPE to phagocytize shed POS, has been widely used as a model of retinal dystrophy for several decades (Dowling and Sidman 1962; LaVail 2001). Recently, RCS rats were reported to contain a genomic deletion in the second exon of MerTK, leading to shortened and aberrant transcripts (D’Cruz et al. 2000; Nandrot et al. 2000). MerTK knockout mice display a similar phenotype as the RCS rat (Duncan et al. 2003). However, few studies have examined the effect of the retina on MerTK inhibition by systemically administered drugs, and thus, the relevance of drug-induced MerTK inhibition for patient safety remains unclear.
Retinal toxicity is one of the greatest concerns in drug development because photoreceptors do not regenerate and the lack of reliable predictive biomarkers. Retina-enriched miRNAs such as the miR-183/96/182 cluster and miR-124 have well-documented expression profiles and functions in mice. These miRNAs were shown to be expressed mainly in photoreceptor cells but not in the RPE in the retina (Ryan, Oliveira-Fernandes, and Lavker 2006; Loscher et al. 2007; Krol et al. 2010; Sanuki et al. 2011). Recently, plasma levels of miR-183/96/182 cluster and miR-124 were reported to be elevated in several retinal toxicity models by the pan-CDK inhibitor NaIO3 or laser treatment, suggesting that these miRNAs are biomarkers for injury of retinal neurons including photoreceptor cells (Peng, Huang, and John-Baptiste 2014; Peng et al. 2016).
To clarify the effects of drug-induced MerTK inhibition on the retina, morphological changes in the retina were investigated in mice orally administered UNC569, a specific MerTK inhibitor (Liu et al. 2012). MerTK phosphorylation in the retina, which is known to display a circadian rhythm (Nandrot et al. 2004), was also sequentially analyzed to examine the inhibition potency of UNC569. Additionally, plasma miR-96, miR-124, and miR-183 levels, which are enriched in photoreceptors, were measured to confirm the utility of these miRNAs in predicting retinal toxicity.
Material and Method
Test Substance
UNC569, a MerTK inhibitor, was synthesized at Daiichi Sankyo RD Novare Co., Ltd. (Tokyo, Japan).
Animals
Male BALB/c AnNCrlCrlj mice aged 7 weeks were obtained from Charles River Japan, Inc. (Kanagawa, Japan). The animals were housed individually in stainless mesh cages in a room controlled at a temperature of 23°C ± 2°C and relative humidity of 55% ± 15% and under a 12-hr light and 12-hr dark cycle. Commercial pellets (CRF-1, Oriental Yeast Co., Ltd., Tokyo, Japan) and tap water were available ad libitum. All animal procedures were performed in accordance with the guidelines of the Animal Care and Use Committee of Daiichi Sankyo Co., Ltd. (Tokyo, Japan).
Experimental Design
The animals were divided into 2 groups: experiment 1 (pathological examination, miRNAs measurement, and toxicokinetics [TKs] evaluation following a 14-day repeated dosing) and experiment 2 (MerTK phosphorylation analysis following a single dose). The experimental protocol for the sampling schedule of the retinal tissue and lighting conditions in both experiments is shown in Figure 1.
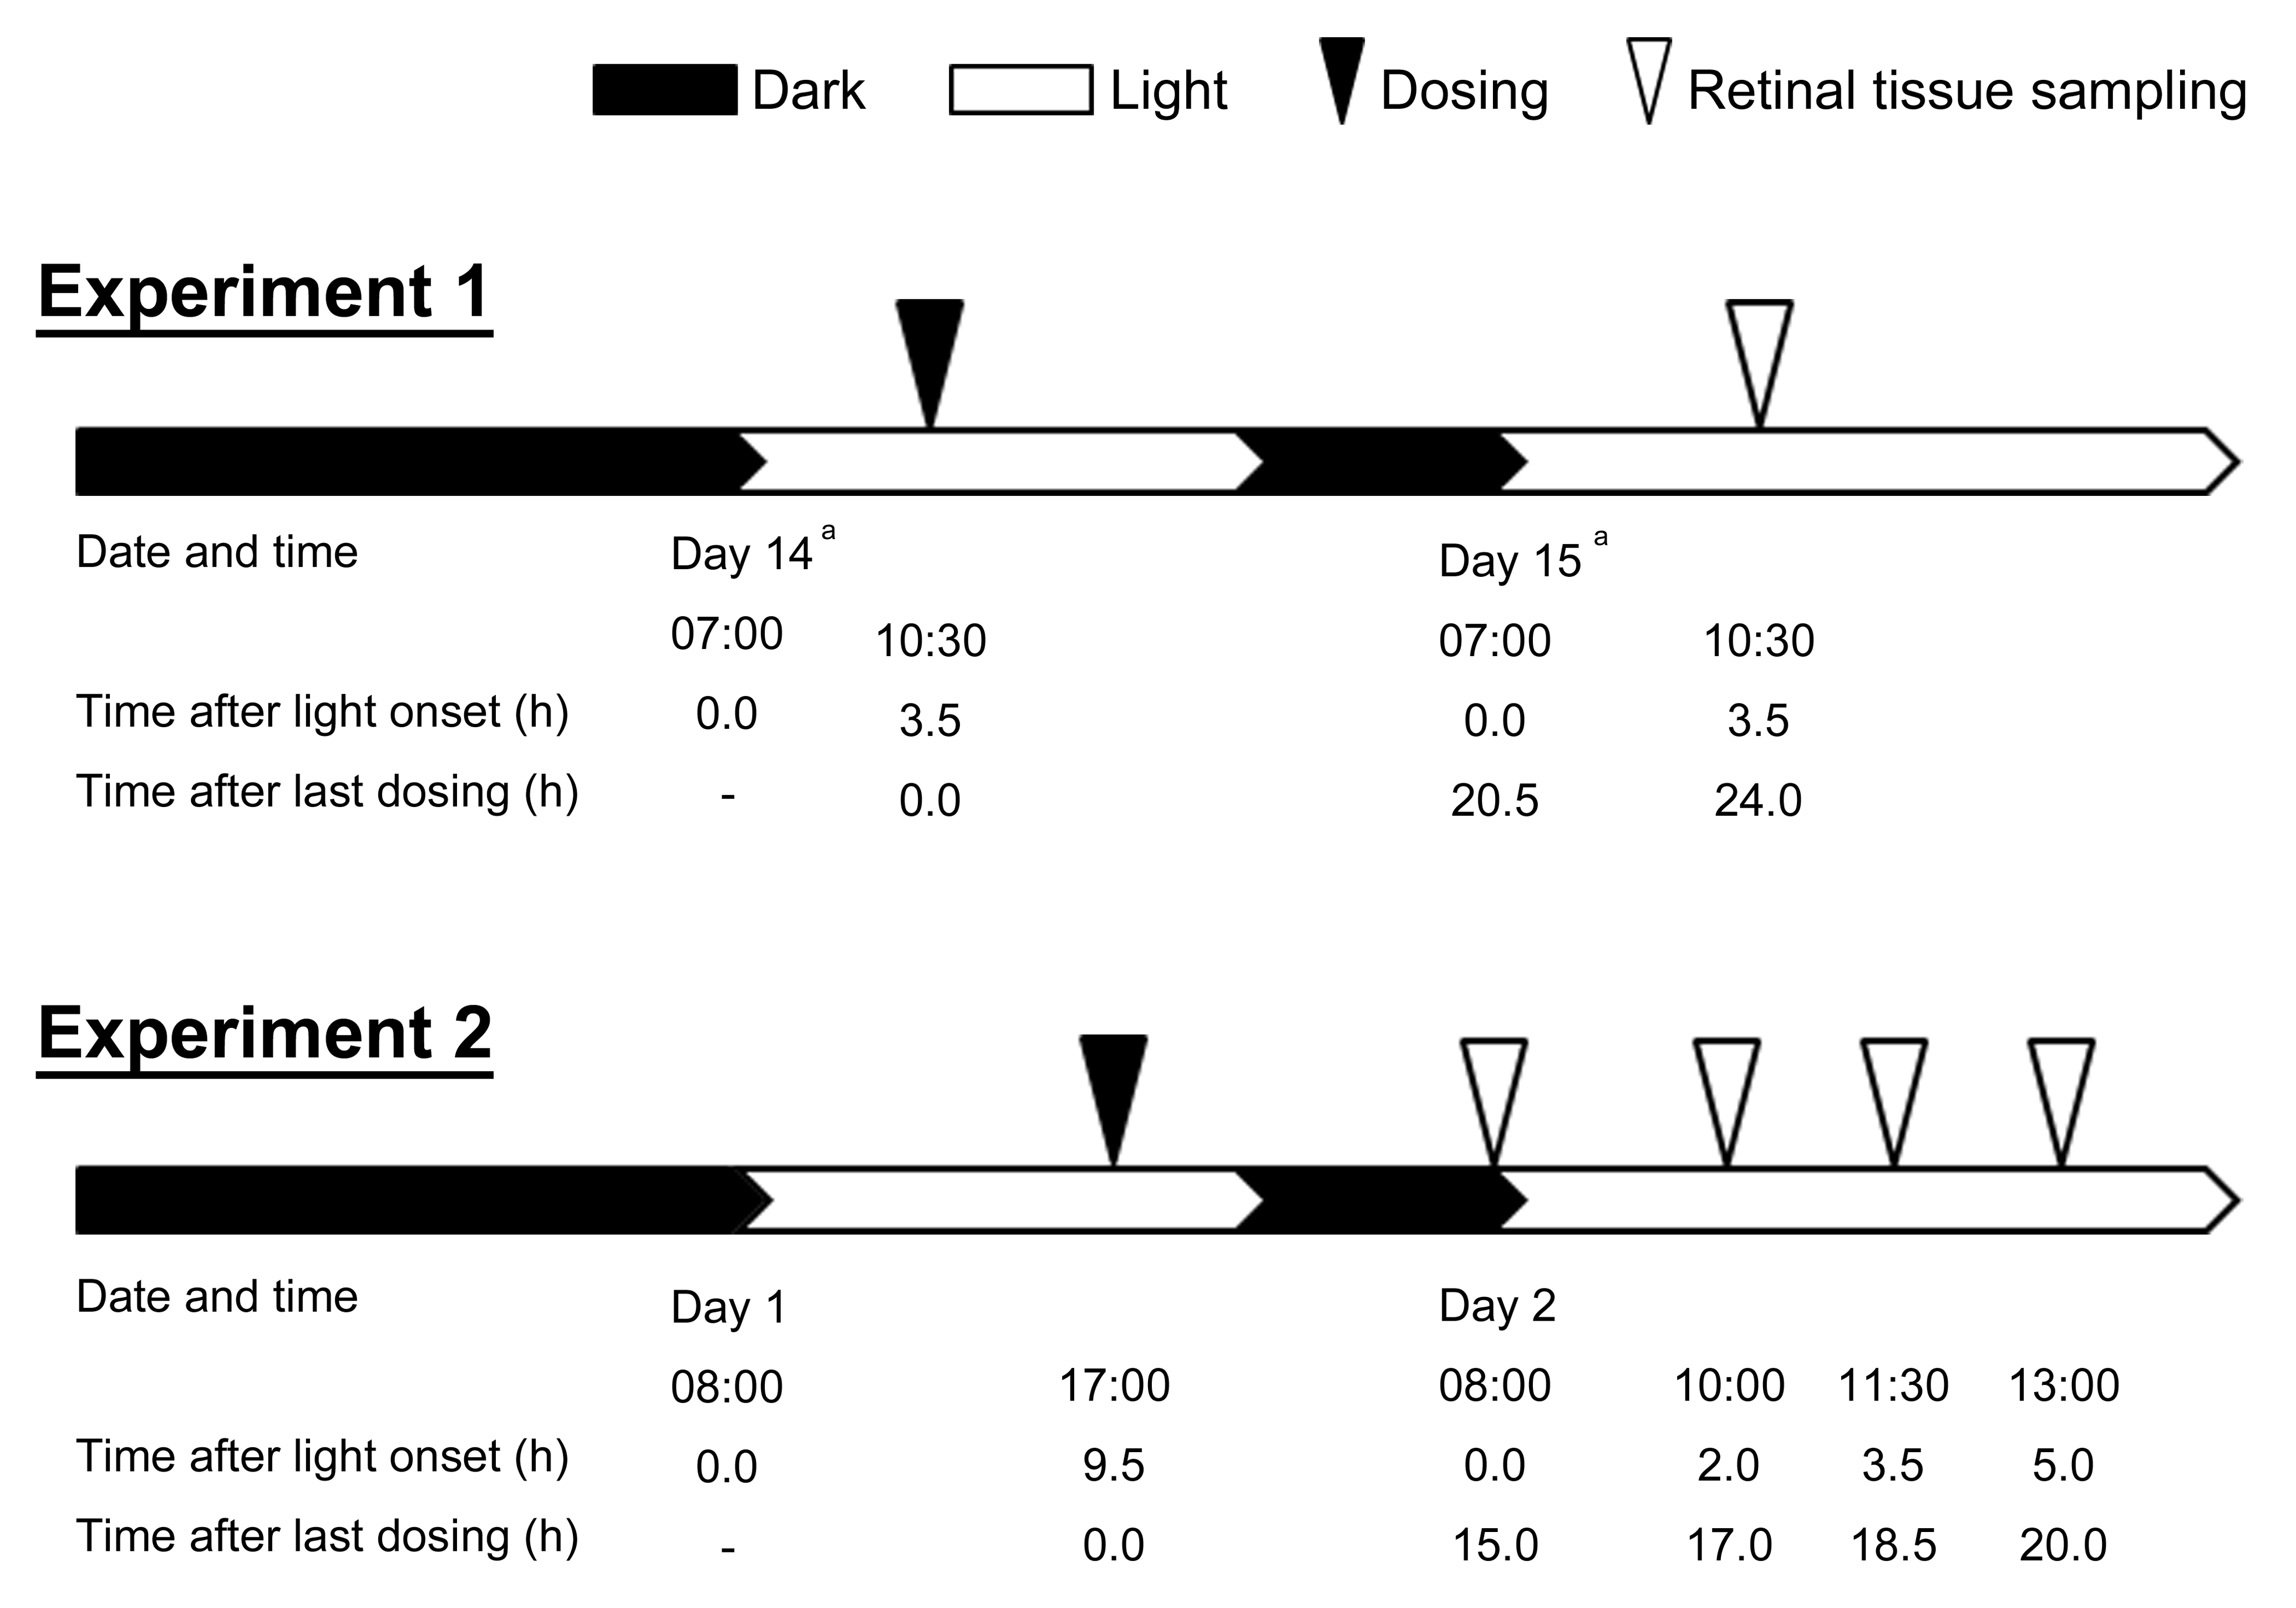
Time schedule for the sampling of the retinal tissue and lighting conditions in experiments 1 and 2. aIn the 150 mg/kg group, mice were euthanized on day 10, the day after the last dosing on day 9.
Experiment 1
UNC569 was orally administered to animals at 60, 100, and 150 mg/kg once daily for 14 days (n = 5/toxicity group, n = 3/TKs group). The animals administered 0.5 w/v% methyl cellulose in the same manner were used as controls. The dose levels were set based on a preliminary dose range finding 4-day study using male mice, in which body weight loss was observed at 200 mg/kg. Light was introduced into the room at 7:00, and dosing was conducted at 10:30 throughout the experiment. The first day of dosing was defined as day 1. The animals were euthanized by exsanguinations under isoflurane anesthesia and necropsied at 10:30 on day 15. Samples from animals in the toxicity evaluation group were used for pathology and miRNA analysis, while those from the TK group were used for measurement of drug concentrations.
Experiment 2
UNC569 was orally administered once to animals at 100 mg/kg (n = 4). Based on the experiment 1, the dose was set at 100 mg/kg, which caused retinal toxicity. The animals receiving 0.5 w/v% methyl cellulose in the same manner served as the vehicle control (n = 4). Light was introduced into the room at 8:00, and dosing was conducted at 17:00. Animals were euthanized by exsanguinations under isoflurane anesthesia at 8:00, 10:00, 11:30, and 13:00 on the day after dosing (15, 17, 18.5, and 20 hr after the dosing; n = 1/time point). The timing of light onset and dosing was planned based on the results of the 14-day experiment to conduct the last sampling within 24 hr after dosing, when the higher amount of UNC569 compared with the IC50 value for MerTK (2.9 nM; Liu et al. 2012) was assumed to be distributed in the retinal tissues.
Pathology
At necropsy, the eyes were removed from all animals. Right eyes were fixed in Davidson’s fixative and embedded in paraffin, and histopathological specimens were prepared and stained with hematoxylin and eosin (HE) for light microscopy. Left eyes were fixed in 2.5% glutaraldehyde, postfixed in 2% osmium tetroxide, and embedded in Quetol 812 (Nisshin EM, Tokyo, Japan) resin. The semithin sections were stained with toluidine blue (TB) for light microscopy, and ultrathin sections were stained with uranyl acetate and Sato’s (1968) lead for electron microscopy.
Plasma miRNA Analysis
miRNA analysis was conducted by RT-qPCR as previously described (Sakurai et al. 2016). Briefly, whole blood samples were collected from the inferior vena cava of anesthetized animals into EDTA 2K-containing tubes at necropsy. Plasma samples were obtained by centrifugation at 10,000 × g at 4°C for 5 min. Total RNA was extracted from 200 μL of plasma using the miRNeasy Mini Kit (QIAGEN, Hilden, Germany) following the manufacturer’s protocol. The RT reaction was performed using a TaqMan MicroRNA Reverse Transcription Kit (Thermo Fisher Scientific, Waltham, MA, USA) with a target miRNA RT primer of the TaqMan MicroRNA Assays (Thermo Fisher Scientific). To enhance the sensitivity for target miRNAs, the RT products were preamplified using TaqMan PreAmp Master Mix (Thermo Fisher Scientific) with a GeneAmp PCR System 9700 under the following cycling conditions: 95°C for 10 min, followed by 14 cycles of 95°C for 15 s and 60°C for 4 min. Next, the qPCRs were performed with a 7900HT Fast Real-Time PCR System using the TaqMan MicroRNA Assays and TaqMan Fast Advanced Master Mix (Thermo Fisher Scientific). The cycling conditions were as follows: 50°C for 2 min and 95°C for 20 s, followed by 45 cycles of 95°C for 1 s and 60°C for 20 s. The cutoff level was set at cycle threshold >40 cycles. The expression level of each miRNA was normalized to spiked-in miR-238 (Syn-cel-miR-238 miScript miRNA Mimic, QIAGEN) as an external control. The value of each miRNA is presented as the ratio of the expression level to the mean expression level of the concurrent control group. The primer assay IDs for miR-96, miR-124, miR-183, and miR-238 were 000186, 001182, 002269, and 000248, respectively.
Drug Concentration Measurement in Plasma and Retinal Tissue Sample
Blood samples were collected from the jugular vein of unanesthetized animals into heparin lithium-containing tubes prior to dosing and 1, 2, 4, and 24 hr after the final dosing of the test compound on day 14 (n = 2/time point). Plasma samples were obtained by centrifugation of the blood samples at 19,000 × g at 4°C for 10 s and stored in a freezer at −80°C until analysis. Right eyeballs were removed from animals in the 60, 100, and 150 mg/kg groups at necropsy. The cornea, lens, and vitreous were removed from eyeballs, and the obtained retinal tissue samples, which consist of the retina, choroid, and sclera, and optic disc, were weighed, individually transferred to a polypropylene tube, and stored in a freezer at −80°C until analysis. Each retinal sample was homogenized with 100 μL of distilled water using a Shake Master NEO (Bio Medical Sciences K.K., Tokyo, Japan) with tungsten beads (2.4 mm). For blank samples, plasma and retinal tissue samples were obtained from untreated mice (n = 2). The plasma and retinal concentrations of UNC569 were measured by liquid chromatography/mass spectrometry/mass spectrometry. Area under the plasma concentration–time curve (AUC) 0 to 24 hr and maximum plasma concentration (Cmax) were calculated by noncompartmental analysis using the computer software Phoenix WinNonlin (ver. 6.3, Certara G.K., Tokyo, Japan).
MerTK Phosphorylation Analysis in the Retinal Tissue Sample
Right eyeballs were collected from the animals, and then the cornea, lens, and vitreous were removed from the eyeballs. The obtained retinal tissue samples, which consist of the retina, optic disc, choroid, and sclera, were stored in a freezer at −80°C until analysis. Each retinal sample was homogenized with ice-cold Tissue Protein Extraction Reagent (Thermo Fisher Scientific) containing protease inhibitor cocktail (SIGMA, St. Louis, MO, USA) and phosphatase inhibitor cocktail Set II (EMD Millipore, Darmstadt, Germany) and purified by centrifugation. Total protein concentrations of the lysates were determined using Quick Start Bradford (Bio-Rad, Hercules, CA, USA). The lysate was mixed with Laemmli sample buffer (Bio-Rad) containing 100-mM DTT and incubated at 4°C overnight. Equal amounts of protein (5 μg) were separated by 5% to 20% SDS-PAGE and electrotransferred to polyvinylidene fluoride membranes in an iBlot2 transfer system (Thermo Fisher Scientific). The membranes were blocked with StartingBlock T20 blocking reagent (Thermo Fisher Scientific) and incubated with a dilution of anti-phospho-MerTK antibody (ab192649; abcam, Cambridge, UK) or anti-MerTK antibody (ab95925; abcam) overnight at 4°C. After washing, the membranes were incubated with secondary horseradish peroxidase–coupled antibody and processed for enhanced chemiluminescence detection using Luminata Forte Western HRP substrate (EMD Millipore). Immunoreactive protein was visualized on an ImageQuant LAS 4000 (GE Healthcare, Little Chalfont, UK) and analyzed by ImageQuant TL software, version 7.0. Relative levels of MerTK phosphorylation (p-MerTK/MerTK) were calculated based on the quantified band intensities of p-MerTK and MerTK.
Statistical Analysis
Quantitative data are expressed as the mean ± SD. For statistical analysis among multiple groups, the parameters were statistically analyzed by nonparametric Dunnett’s multiple comparison test. These statistical analyses were performed using SAS System Release 9.2 (SAS Institute, Inc., Cary, NC, USA). A p value less than 5% was considered statistically significant.
Results
Clinical Signs and Body Weights
Decreased activities accompanied by significant body weight loss were observed from day 9 in animals given 150 mg/kg and 1 animal died on day 9. Therefore, all remaining animals in the 150 mg/kg group were necropsied on day 10 ahead of schedule for ethical reasons. Unscheduled necropsy was conducted before dosing at 10:30 on day 10, and the retinal tissue for pathology and drug concentration measurement and blood sample for plasma miRNA analysis were collected. Blood samples for drug concentration measurement in plasma were not collected from the 150 mg/kg group. The other organs (liver, kidney, heart, lung, alimentary tract, adrenal, pituitary, thymus, spleen, bone marrow, brain, spinal cord, sciatic nerve, testis, and epididymis) in the dead animal were histopathologically examined; however, the cause of death was not determined (data not shown). In the 100 mg/kg group, animals showed transient decreases in body weights on day 6. No remarkable changes were observed in the 60 mg/kg group (data not shown).
Pathology
Microscopically, histopathological changes in the retina by UNC569 were detected only in the TB stain of semithin sections but not in HE sections. No histopathological changes were observed in HE sections in all dose groups. Increased granules deeply stained with TB and vacuoles in the RPE were observed in the 100 and 150 mg/kg groups (Figure 2).
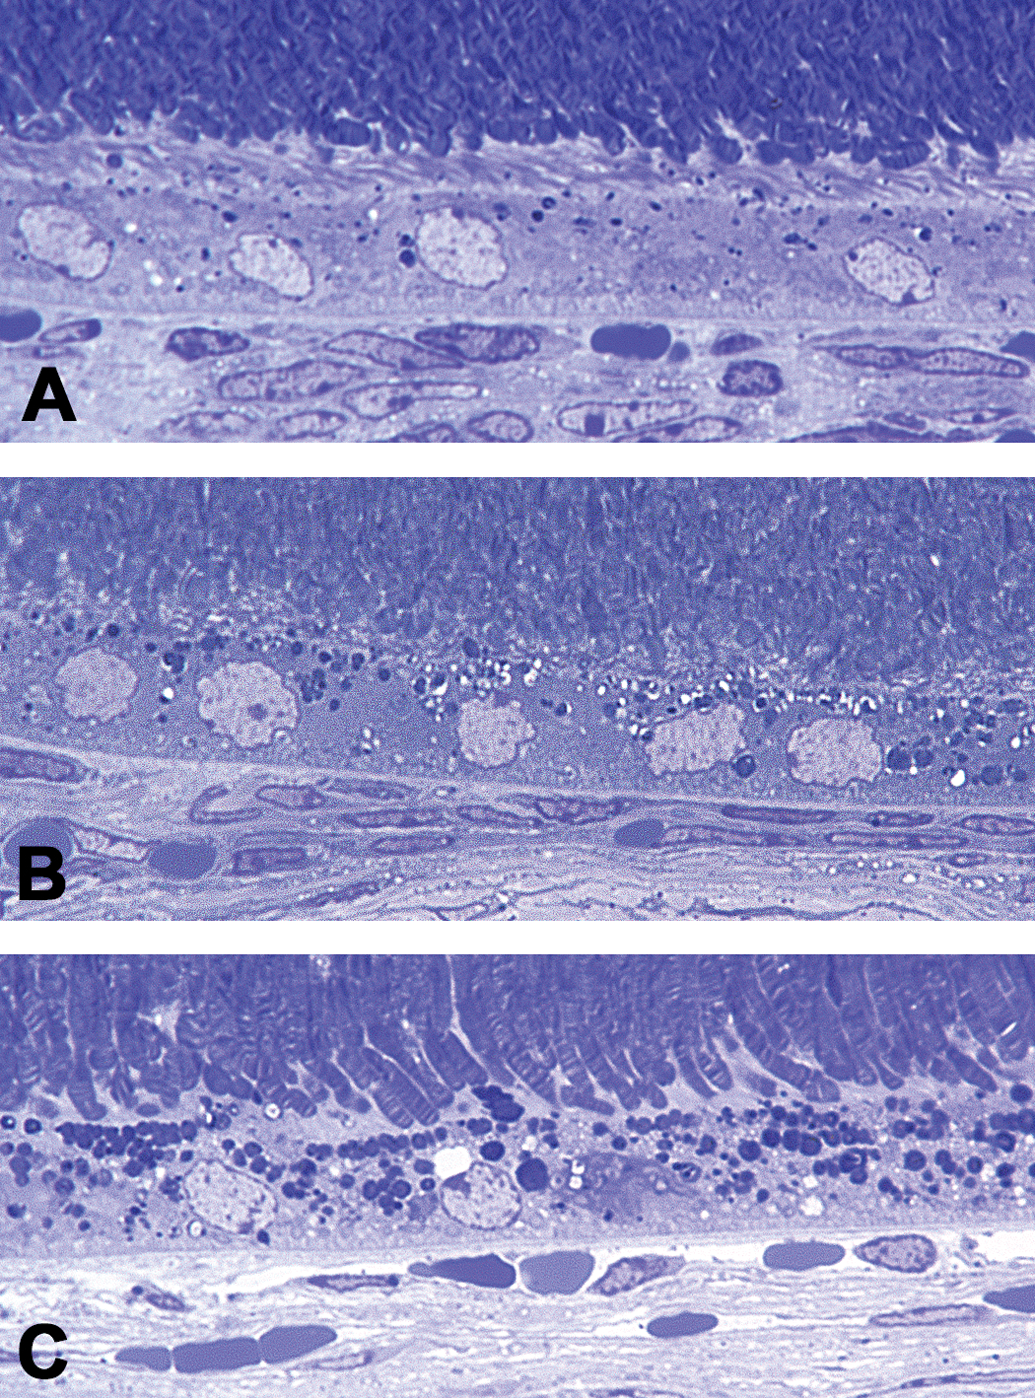
Light microscopy images of the retinal pigment epithelium in mice treated with UNC569. (A) Vehicle control on day 15. (B) The 100 mg/kg group on day 15. (C) The 150 mg/kg group on day 10. Deeply stained granules and vacuoles increased in the retinal pigment epithelium in UNC569-treated groups. Toluidine blue stain of semithin section. Original objective 100×.
Ultrastructurally, membrane-bound multilamellated bodies in the RPE were increased in the 100 and 150 mg/kg groups compared to the control. They were rather uniform in size and mainly distributed from the apical cell surface to the perinuclear zone of the RPE. In addition, the endoplasmic reticulum in the RPE was dilated in the 150 mg/kg group (Figure 3A–C). Increased multilamellated bodies were surrounded by a single membrane, but an additional limiting membrane was occasionally discernible. The lamellar elements showed various appearances. Some closely resembled the POS, while others showed thinner lamellae than that of the POS. Some lamellar elements were disorganized, forming electron-lucent areas. There were also multilamellated bodies whose lamellated elements were packed closely, forming electron-dense cores (Figure 3E and F). Moreover, chromatin-condensed nuclei in the outer nuclear layer, electron-dense POS, and irregularly dilated interspace between disks of POS were observed in the 150 mg/kg group (Figure 4). There were no changes in organelles including the mitochondria of photoreceptor cells.
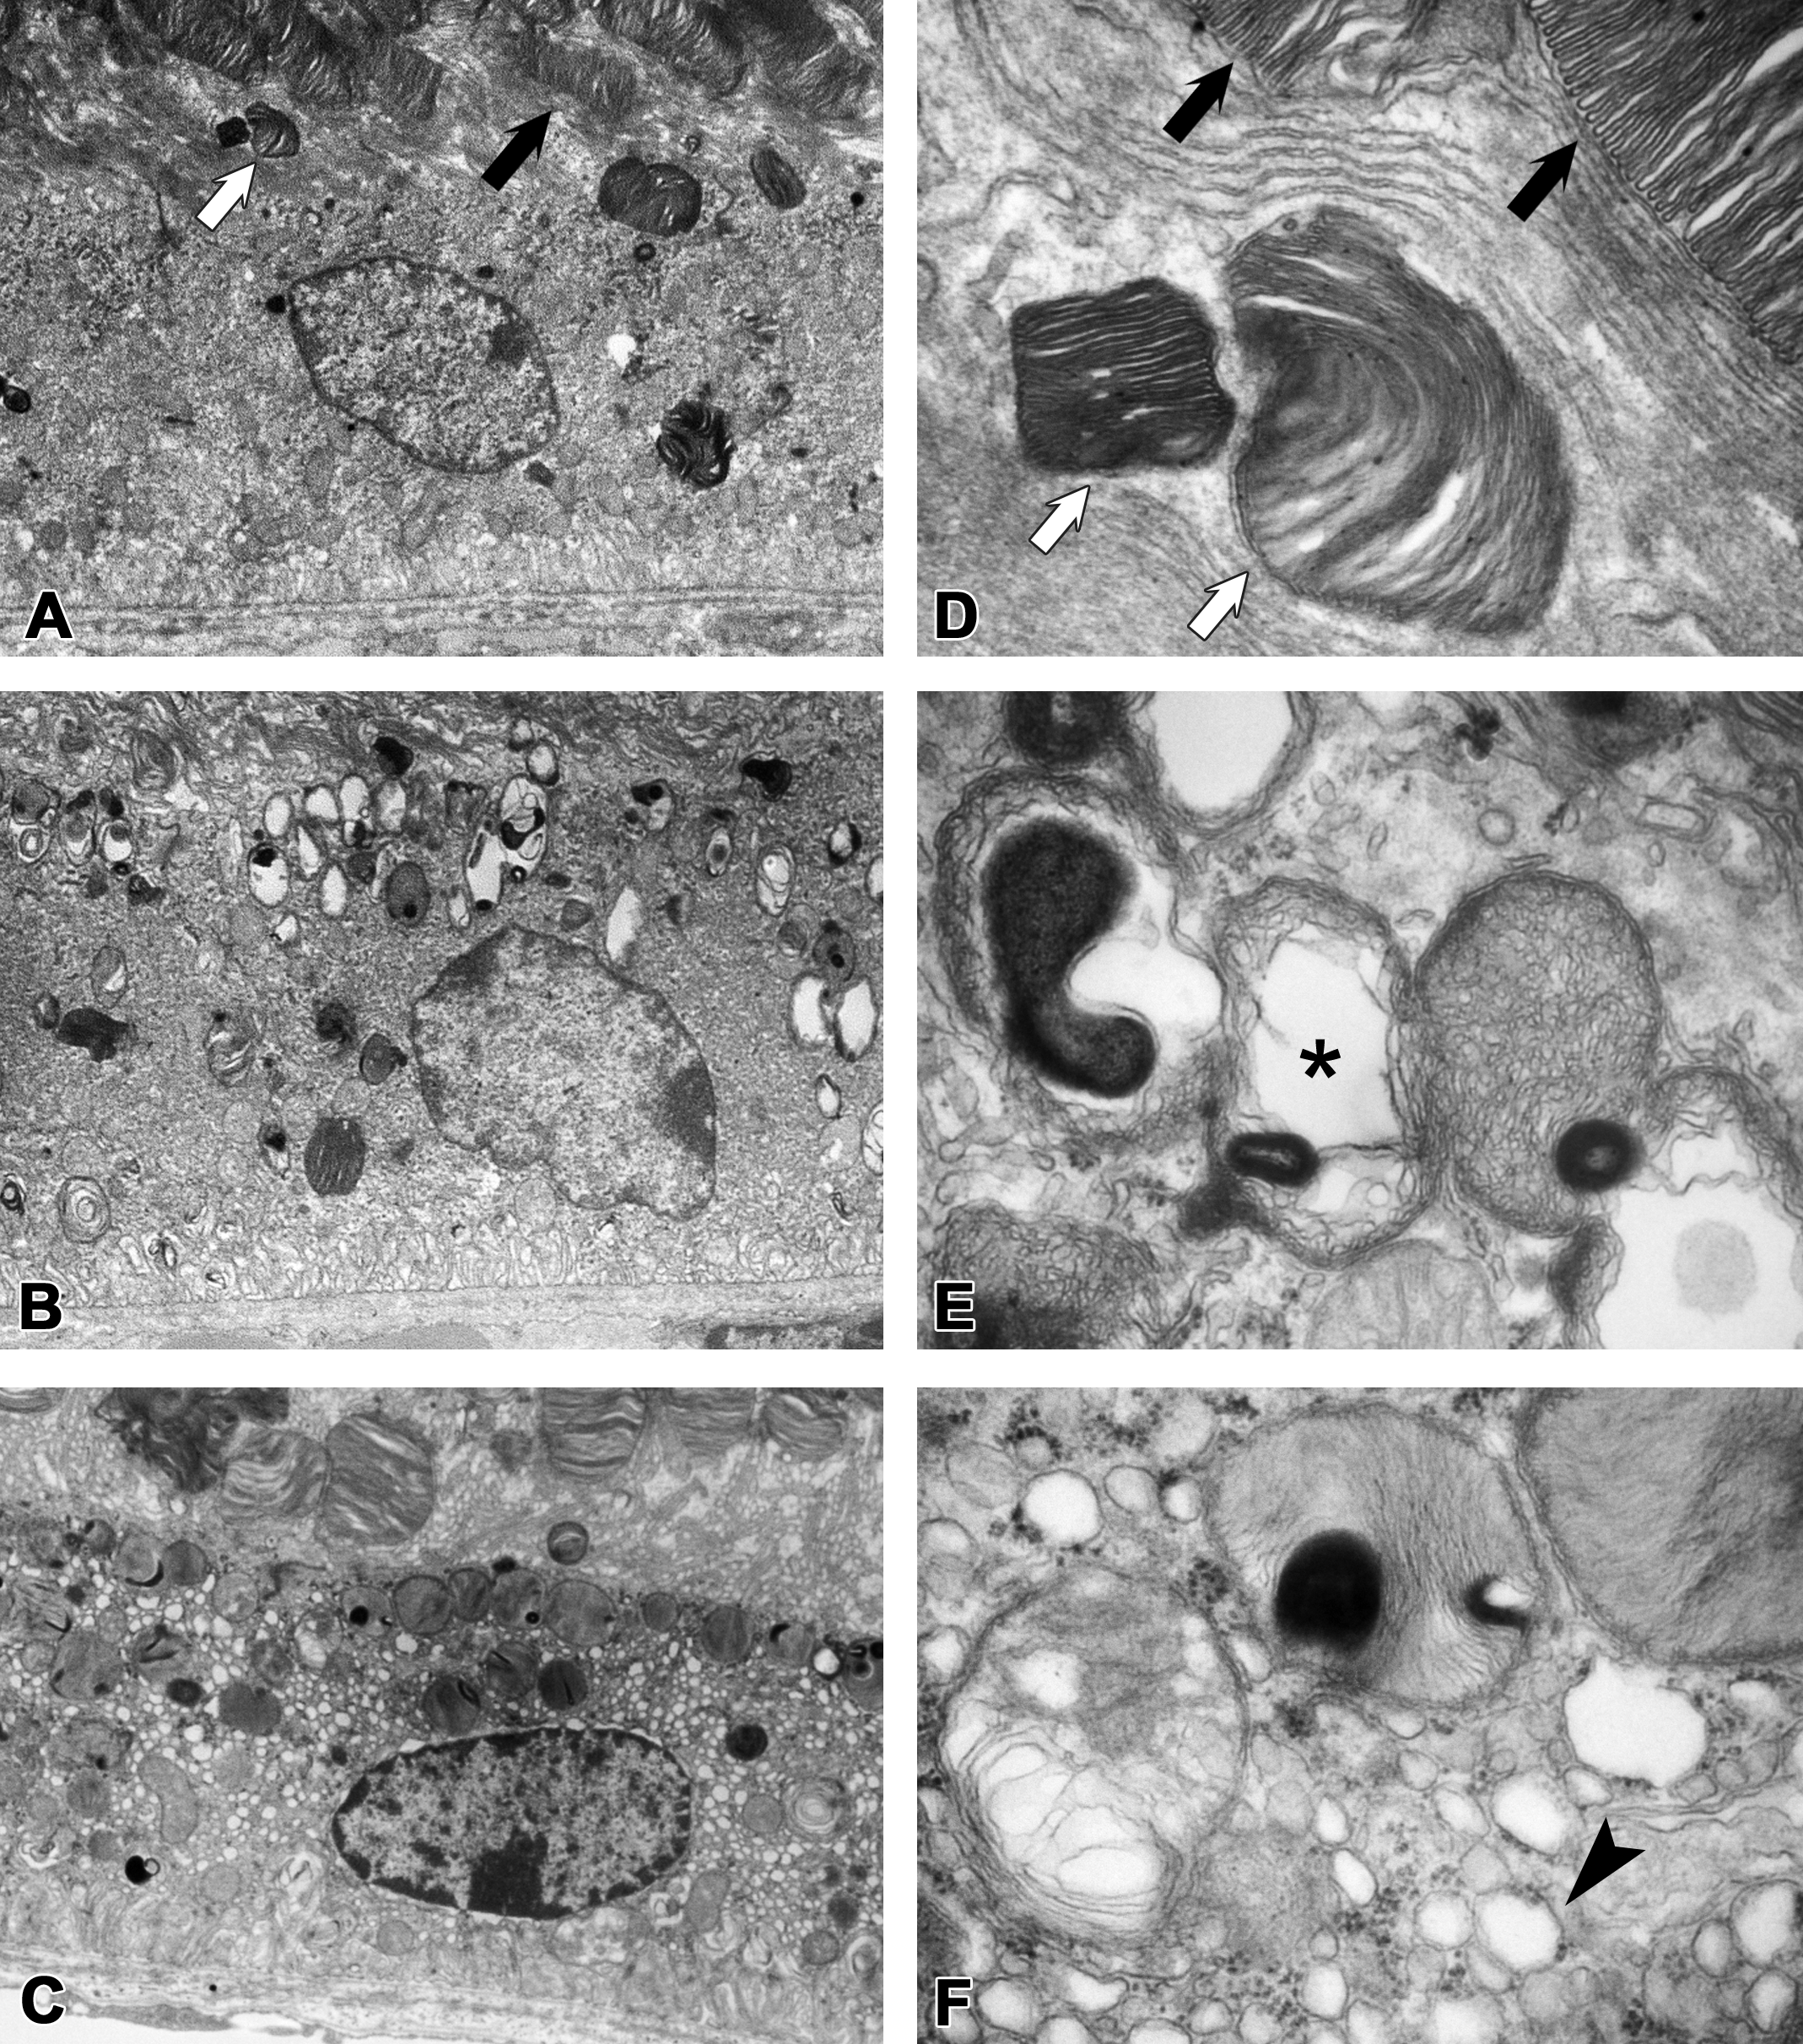
Electron microscopic appearance of the retinal pigment epithelium in mice treated with UNC569. (A and D) vehicle control on day 15. Membrane-bound multilamellated bodies (white arrows) resembled photoreceptor outer segments (black arrows) were observed in the retinal pigment epithelium (RPE). (B and E) The 100 mg/kg group on day 15. Membrane-bound multilamellated bodies increased in the apical region of the RPE. Some lamellar elements were disorganized, forming electron-lucent areas (asterisk) and electron-dense cores. (C and F) The 150 mg/kg group on day 10. Dilated endoplasmic reticulum (arrowhead) was observed in the RPE, as well as increased membrane-bound multilamellated bodies. Original objective: A, B, and C: 5000×. D, E, and F: 40,000×.
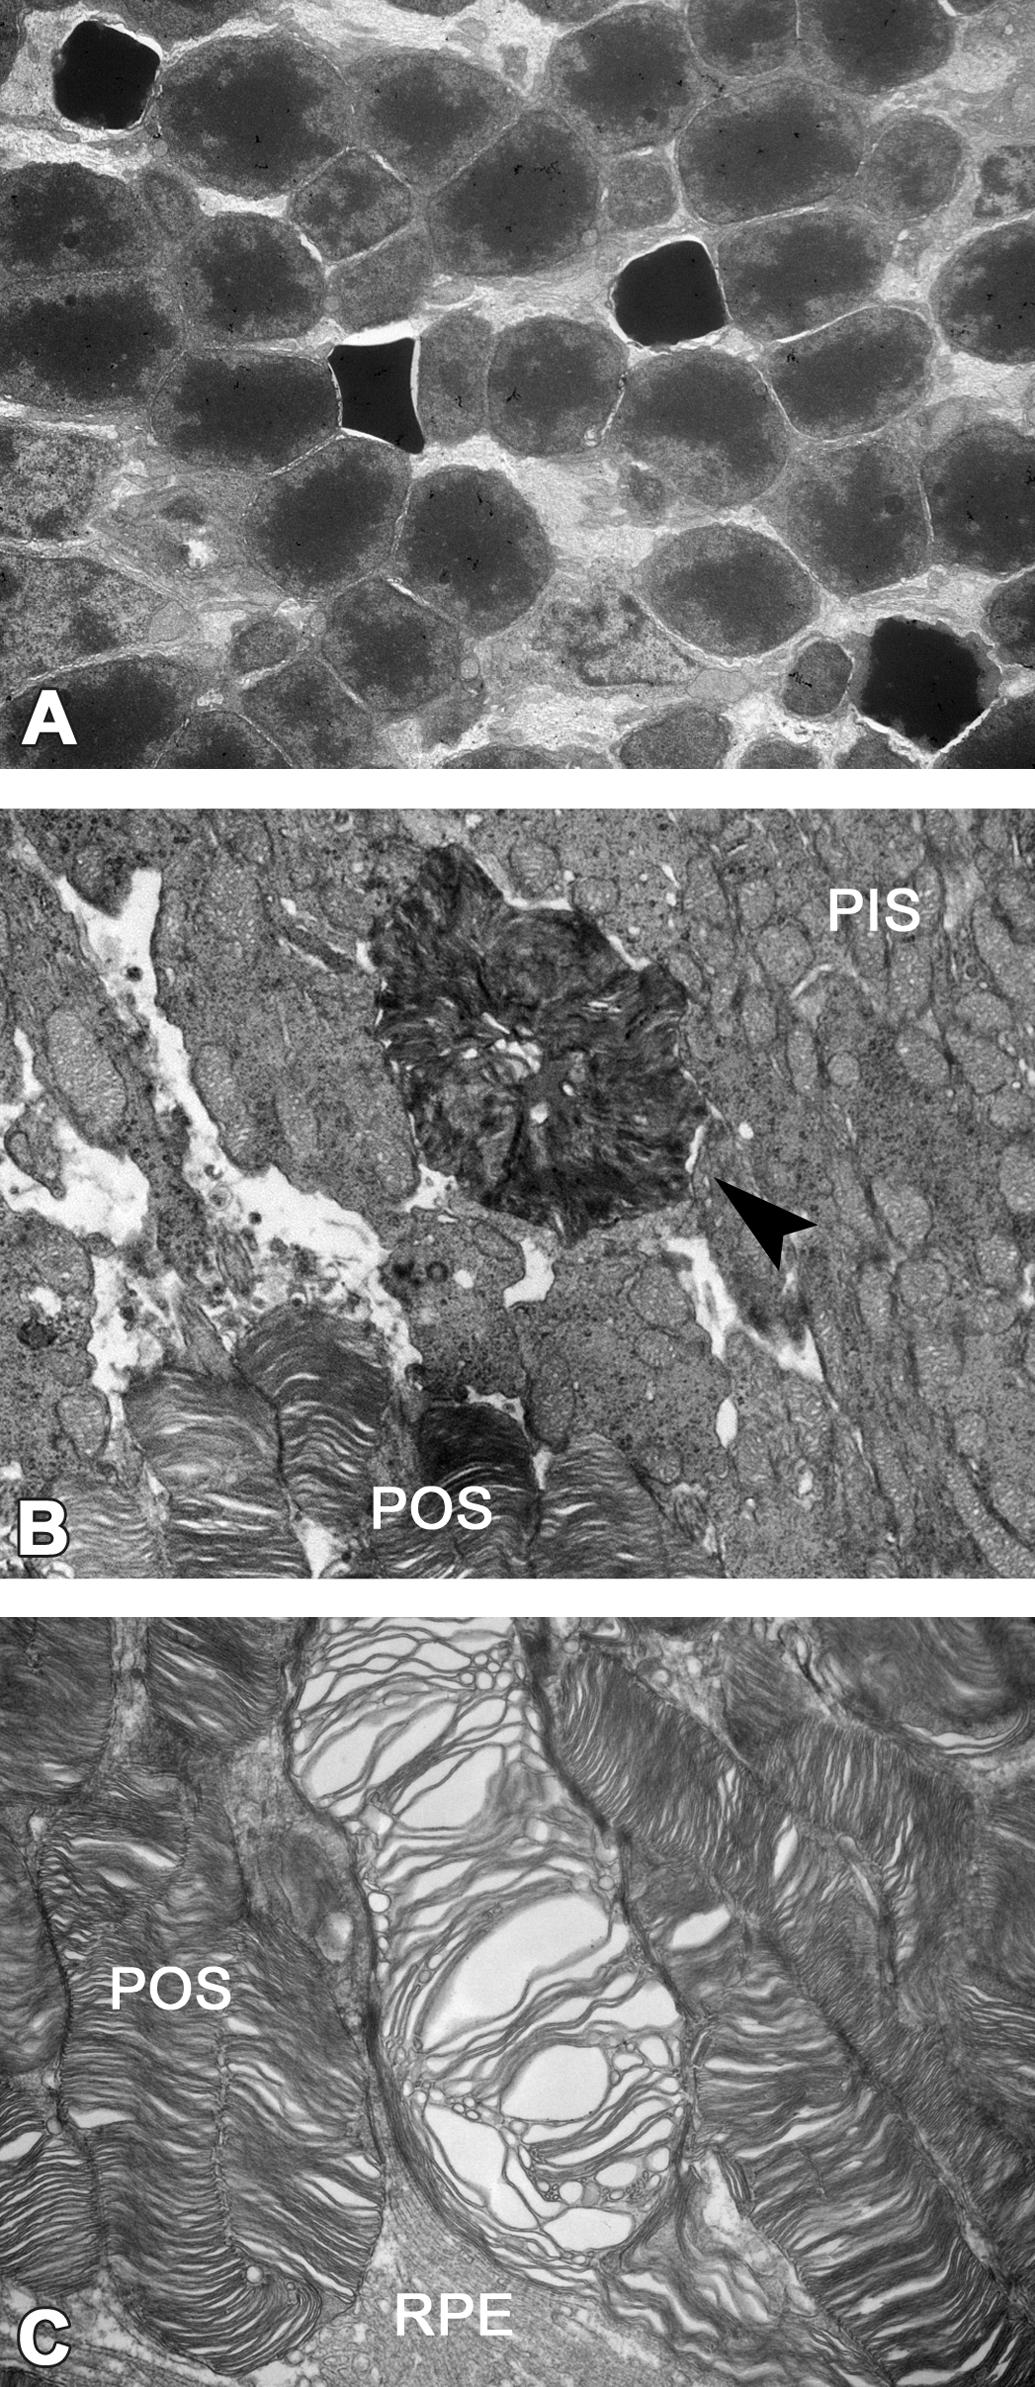
Electron microscopic appearance of photoreceptor cells in mice treated with UNC569 at 150 mg/kg on day 10. (A) Chromatin-condensed nuclei increased in the outer nuclear layer. Original objective 4000×. (B) Disks of photoreceptor outer segments (POS) aggregated and showed electron-dense appearance at the base of POS (arrowhead). Original objective 8,000×. (C) Interspace between disks of POS irregularly dilated mainly at the apex of POS. Original objective 15,000×. PIS = photoreceptor inner segments; RPE = retinal pigment epithelium.
Plasma miRNA Analysis
Plasma miR-183 was elevated in the 100 mg/kg group on day 15; and plasma miR-96, miR-124, and miR-183 were also elevated in the 150 mg/kg group on day 10 (Figure 5). In the control group, plasma miR-183 and miR-124 were detected, but plasma miR-96 was lower than the detection limit in 4 of the 5 animals.
Plasma miRNA levels in mice treated with UNC569. (A) miR-183, (B) miR-96, and (C) miR-124 at 60 and 100 mg/kg on day 15 or at 150 mg/kg on day 10. Data are expressed as the mean ± SD of their relative expression levels to that of vehicle control group (n = 5). *p < .05: Significantly different from the vehicle control group by Dunnett’s test. Statistical analysis was not conducted in the 150 mg/kg group.
Drug Concentration in Plasma and Retinal Tissue Sample
Plasma exposure (AUC0–24 hr and Cmax) of UNC569 increased in a dose-dependent manner. Tmax values occurred at 2 hr after dosing both in the 60 and 100 mg/kg groups on day 14 (Figure 6A). Retinal drug concentrations also showed dose-dependent increases: the concentrations were 16.8, 52.0, and 125.0 ng/g tissue in the 60, 100, and 150 mg/kg groups, respectively (Figure 6B).
UNC569 concentrations in plasma and the retinal tissue samples of mice treated with UNC569. (A) Plasma concentrations at 60 and 100 mg/kg group on day 14. Data represent the mean of 2 animals. (B) Tissue concentrations at 60 and 100 mg/kg groups on day 15 or at 150 mg/kg group on day 10. Data are expressed as mean ± SD (60 and 100 mg/kg groups, n = 3) or as mean (150 mg/kg group, n = 2).
MerTK Phosphorylation Analysis in Retinal Tissue Sample
In the control group, the ratio of phosphorylated MerTK to total MerTK (p-MerTK/MerTK) increased at 2, 3.5, and 5 hr after light onset compared with the initial level (0 hr). In contrast, in the UNC569 group, the level of p-MerTK/MerTK remained low at 2 hr after light onset (15 hr after dosing) but was comparable to the levels in the control group at 3.5 and 5 hr after light onset (18.5 and 20 hr after dosing; Figure 7B). The expression levels of MerTK were constant in both the control and UNC569 groups at all time points (Figure 7A).
Temporal effects on MerTK phosphorylation in the retinal tissue samples of mice treated with UNC569 at 100 mg/kg. (A) Time course profiles of MerTK phosphorylation in the retinal tissue samples (n = 1/time point). (B) Relative levels of MerTK phosphorylation (p-MerTK/MerTK). Ct = vehicle control; U = UNC569; MerTK = Mer proto-oncogene tyrosine kinase; p-MerTK = phosphorylated MerTK.
Discussion
Our study characterized the morphologic features of retinal changes induced by the MerTK inhibitor UNC569 in mice.
In pathological examination, increased granules and vacuoles in the RPE were observed following TB staining of semithin sections in the 100 and 150 mg/kg groups. Ultrastructurally, these changes were recognized as increased membrane-bounded multilamellated bodies in the RPE. Photoreceptor cells are highly differentiated and lack the innate capacity to regenerate, whereas their segments, POS, are renewed continuously. The POS comprise stacked membranous disks containing light-sensitive photopigments, and its renewal involves disk formation at the base and disk shedding at the apex of the POS. The shed packets of disks are engulfed by the phagocytic process of the RPE, and the POS are entirely replaced by newly formed every 10 days in mice (Young 1967; LaVail 1973). The increased membrane-bound multilamellated structures in the RPE in our study may have been engulfed shed POS because they showed the characteristic lamellar structure resembling POS. Similar to during the general process of phagocytosis, engulfed shed POS are enclosed by cellular membranes forming phagosomes, followed by fusion with lysosomes which formed phagolysosomes, and then degraded by lysosomal enzymes (Bosch, Horwitz, and Bok 1993). During digestion, engulfed shed POS show various transitional features including disorganized membranous structures (Ishikawa and Yamada 1970). A variety of appearances of lamellar elements such as electron-lucent areas and electron-dense cores observed in the present study may have reflected the different stages of intracellular digestion. Therefore, membrane-bound multilamellated structures in the RPE may have been phagosomes and phagolysosomes. The following 2 possibilities are suggested as mechanisms of increased phagosomes and phagolysosomes: increased phagocytosis and suppressed degradation. Determining which mechanism is correct is difficult without time-lapse analyses. However, in the present study, the increased phagocytosis may be attributable to the increased phagosomes and phagolysosomes, as most were distributed from the apical cell surface to the perinuclear zone of the RPE, as is the case in normal animals (Ishikawa and Yamada 1970). In addition, engulfed shed POS showed various appearances, suggesting that digestion occurred as described above. Further, excess lipofuscin accumulation, a hallmark of inhibition of POS digestion (Fielden et al. 2015), was not observed in our study.
In the present study, morphologic changes in photoreceptor cells as well as the RPE were observed only in the 150 mg/kg group. Chromatin-condensed nuclei in the outer nuclear layer without changes in organelles indicate the early phase of apoptosis of photoreceptor cells. N-Methyl-N-nitrosourea and quinolones, which are known to cause apoptosis of photoreceptor cells, also showed morphological or quantitative changes in the mitochondria in photoreceptor cells at the initial stage (Shimoda and Kato 1999; Chen et al. 2014). In contrast, there were no changes in organelles including in the mitochondria of photoreceptor cells in the present study. Therefore, the mechanism of photoreceptor cell injury caused by UNC569 may have differed from those of N-methyl-N-nitrosourea and quinolones. The lesions of photoreceptor cells are thought to be induced secondarily by functional disturbance of the RPE.
In TK analysis of UNC569, dose-dependent systemic exposures were observed both in the plasma and in the retinal tissue sample. UNC569 concentrations of retinal tissue samples in the 60, 100, and 150 mg/kg groups were 16-, 45-, and 108-fold higher, respectively, compared with the IC50 value for MerTK (2.9 nM) as previously reported (Liu et al. 2012).
In MerTK phosphorylation analysis, the ratio of p-MerTK/MerTK was increased 2 hr after light onset in the control group. The turnover of POS is regulated by circadian rhythms in a manner such that rods shed their tips with the onset of light (LaVail 1976). MerTK phosphorylation and RPE phagocytosis were also shown to be synchronized with circadian rhythms and peak at 2 hr after light onset in mice (Nandrot et al. 2004). In the UNC569 group, phosphorylated MerTK did not increase 2 hr after light onset (17 hr after dosing) but was increased in the control group. In contrast, the levels of phosphorylated MerTK at 3.5 and 5 hr after light onset (18.5 and 20 hr after dosing) were comparable to those in the control group. These results indicate that UNC569 inhibited MerTK phosphorylation in the retinal tissue samples for up to 17 hr after oral administration, which may contribute to the disturbance of phagocytosis. The inhibitory effect of MerTK phosphorylation by UNC569 in the retinal tissue samples was withdrawn 18.5 and 20 hr after dosing, although the retinal drug concentrations 24 hr after the last dosing were 45-fold higher than the IC50 value for MerTK. In the present study, MerTK expressed in choroidal vasculature might be included in the retinal tissue sample. However, the synchronization of phosphorylation of MerTK expressed in choroidal vasculature with circadian rhythms as MerTK expressed in the RPE has not been demonstrated; therefore, most of phosphorylation and its inhibition detected in the present study were thought to be the RPEs.
Our results indicate that systemically administered UNC569 inhibited MerTK phosphorylation, causing inhibition of RPE phagocytosis and leading to apoptosis of photoreceptor cells. However, this hypothesis is somewhat inconsistent with the fact that RPE phagosomes were ultrastructurally increased in the present study. In a 14-day study, dosing and sampling of the retina were conducted 3.5 hr after light onset. The peak time of phagocytosis is thought to be 2 hr after light onset (Nandrot et al. 2004), and inhibition of MerTK phosphorylation by UNC569 may continue until 17 hr after dosing (20.5 hr after light onset). Therefore, in the UNC569 group, the phagocytic process in the RPE was thought to be temporarily active at least for 1.5 hr (from 2 to 3.5 hr after light onset), but the duration of phagocytosis may be shorter than that in the control group during the dosing period. Insufficient phagocytosis can cause accumulation of shed POS in the space between the RPE and photoreceptors. Accumulated shed POS, containing a high concentration of radicals, photodamaged proteins, and lipids, may function as oxidative stress in photoreceptor cells (Strauss 2005). In fact, the defect of phagocytosis was reported to cause the loss of photoreceptor cells in several studies (D’Cruz et al. 2000; Nandrot et al. 2000; Duncan et al. 2003). In addition, the retinal samples for pathology were collected after 1 hr after the peak of phagocytosis under uninhibited conditions of MerTK phosphorylation. Therefore, the RPE may have actively phagocytized excessively accumulated shed POS in the UNC569 group at the time of sampling. Further investigations are needed to verify the influence of insufficient inhibition and time course in the study.
In conclusion, the MerTK inhibitor UNC569 induced ultrastructural changes of RPE and photoreceptor cells in the retina. These results suggest that MerTK inhibition due to UNC569 impaired the phagocytic function of the RPE, leading to excess accumulation of shed POS and resulting in increased phagosomes and phagolysosomes in the RPE, as well as delayed POS renewal that resulted in the early phase of apoptosis of photoreceptor cells. Our findings emphasize the need for careful evaluation of potential retinal toxicity when the candidates exhibit inhibitory activity on MerTK in drug development.
Footnotes
Acknowledgments
We wish to thank Yasuhiro Kinpara, Yoshikazu Nezu, and Tetsuya Ohsawa for conducting the animal experiments, Makoto Akai for preparing the test substance, Yui Tanaka for her assistance in drug concentration measurements, and Kunio Wada for synthesizing the test substance.
Authors’ Contribution
Authors contributed to conception or design (AS, TM, KY, KK, KM); data acquisition, analysis, or interpretation (AS, KO, KN, TK, TI); drafting the manuscript (AS, TK, TI); and critically revising the manuscript (KO, KN, TK, TI, TM, KY, KK, KM). All authors gave final approval and agreed to be accountable for all aspects of work in ensuring that questions relating to the accuracy or integrity of any part of the work are appropriately investigated and resolved.
Declaration of Conflicting Interests
The author(s) declared no potential conflicts of interest with respect to the research, authorship, and/or publication of this article.
Funding
The author(s) received no financial support for the research, authorship, and/or publication of this article.