
Abstract
Basal insulin peglispro (BIL) consists of insulin lispro with a 20-kDa polyethylene glycol (PEG) moiety covalently attached to lysine B28. Because chronic parenteral administration of PEGylated proteins to animals has sometimes resulted in PEG vacuolation of tissue macrophages, renal tubular cells, and choroid plexus ependymal cells, we investigated whether chronic subcutaneous (sc) injection of BIL in rats (52 weeks) and dogs (39 weeks) was associated with systemic toxicities or other changes, including vacuolation of tissue macrophages, renal tubular cells, and ependymal cells. Rats and dogs received daily sc injections of BIL (rats: 0.17, 0.45, or 1.15 mg/kg/d and dogs: 0.025, 0.10, or 0.20 mg/kg/d) and the reference compound, HUMULIN N® (neutral protamine Hagedorn [NPH] human insulin; rats: 0.15 mg/kg/d and dogs: 0.02–0.03 mg/kg/d). Animals were evaluated for standard end points including mortality, clinical signs, body weights, toxicokinetics, glucodynamics, clinical pathology, and morphological pathology. Nonadverse injection site lipohypertrophy occurred for all BIL and NPH doses but more frequently with BIL. No BIL-related hyperplasia or neoplasia was observed. There was no vacuolation of tissue macrophages, renal tubular cells, or ependymal cells attributable to PEG. These studies demonstrate BIL is not associated with tissue vacuolation attributable to PEG at 4- to 6-fold multiple of the median clinical exposure in patients with diabetes.
Basal insulin peglispro (BIL; Eli Lilly and Company, Indianapolis, IN) is a novel long-acting basal insulin analog with a single 20-kDa polyethylene glycol (PEG) moiety attached at lysine B28 of insulin lispro. Because of the attached PEG moiety, BIL has a large hydrodynamic size that may contribute to delaying insulin absorption and reducing clearance, resulting in a longer duration of action (Caparrotta and Evans 2014).
PEGylation has been used to enhance the properties of protein products, resulting in a stable molecule with low toxicity (Jain and Jain 2008; Milla, Dosio, and Cattel 2012; Veronese, Mero, and Pasut 2009), a longer half-life (Jain and Jain 2008; Kaminskas et al. 2008; Milla, Dosio, and Cattel 2012; Veronese, Mero, and Pasut 2009), less immunogenicity (Jain and Jain 2008; Milla, Dosio, and Cattel 2012), and a lower likelihood of enzymatic degradation (Jain and Jain 2008; Milla, Dosio, and Cattel 2012; Veronese, Mero, and Pasut 2009). Nonclinical toxicology studies of approved PEGylated protein products in rodents, dogs, pigs, and monkeys have identified vacuolation of phagocytic cells (macrophages, histiocytes) in various organs, especially the mononuclear phagocyte system (reticuloendothelial system) as well as renal tubular epithelial cells in rodents, dogs, pigs, and monkeys (Bendele et al. 1998; European Medicines Agency [EMA] 2012; Fruijtier-Pölloth 2005; Webster et al. 2007, 2009; Xu et al. 2013; Zhang, Liu, and Wan 2014; Ivens et al. 2015). The tissue vacuolation observed with PEGylated drugs may be due to the expected clearance mechanism for PEGylated products by phagocytic cells, thus indicating PEG vacuolation is an adaptive, rather than toxic, response (EMA 2012; Food and Drug Administration [FDA] 2008; Ivens et al. 2015; Turecek et al. 2016).
More recently, reports of vacuolation of ependymal cells of choroid plexus from toxicity studies or proteins conjugated with high molecular weight (≥40 kDa) PEGs have emerged (EMA 2012; Rudmann et al. 2013; Ivens et al. 2015). Immunohistochemistry has confirmed PEG in these cytoplasmic vacuoles (Rudmann et al. 2013; Ivens et al. 2015). In nonclinical toxicological studies of PEGylated drugs, changes in the ependymal cell structure in response to vacuolation may result in functional impairments of the choroid plexus and subsequent adverse events in animals (Ivens et al. 2015).
High molecular weight PEGs have demonstrated renal tubular toxicity (Webster et al. 2009), unlike lower molecular weight PEGs (≤20 kDa), which undergo glomerular filtration (Jevsevar, Kunstelj, and Porekar 2010; Webster et al. 2009) based on their shape, charge, and similar molecular weight to albumin (Calceti and Veronese 2003; Jevsevar, Kunstelj, and Porekar 2010). In contrast to the predominant urinary excretion of 20-kDa PEG, recent studies in rats have shown nearly equivalent urinary and fecal excretion when the 20-kDa PEG is attached to insulin lispro in BIL (Knadler et al. 2015).
Insulin and insulin-like growth factor-1 (IGF-1) act through their respective receptors to increase DNA synthesis and cell proliferation; thus, it is important to characterize both the in vitro and in vivo mitogenic potential of insulin analogs (European Agency for the Evaluation of Medicinal Products [EMEA] 2001). In vitro pharmacology studies demonstrated that BIL had reduced mitogenic potential relative to human insulin, insulin lispro, insulin glargine, and AspB10 insulin with respect to both binding affinity at the human IGF-1 receptor and in the human osteosarcoma cell line (SAOS-2). These in vitro data suggested that the mitogenic potential of insulin peglispro may be reduced compared to other insulin analogs (Owens et al. 2012).
In addition to supporting phase 3 clinical trials of BIL, one objective of our toxicology studies was to determine whether long-term daily subcutaneous (sc) injection with BIL was associated with systemic target organ toxicities based on chronic toxicity studies in dogs (39-week duration) and rats (52-week duration). Because BIL contains a single 20-kDa PEG moiety and other molecules with larger PEG moieties have resulted in tissue vacuolation (Jain and Jain 2008), another objective of our toxicology studies was to evaluate whether chronic treatment with BIL is associated with other changes, specifically the detection of vacuolation of tissue macrophages, renal tubular cells, or the modified ependymal cells that make up the choroid plexus of the brain. We also determined the in vivo mitogenic potential of BIL by incorporating measures of cell proliferation in the 52-week rat study. Lastly, we assessed the carcinogenic potential of BIL in the 52-week rat study, which was a modified tumorigenicity study that was consistent with the EMA guidance on insulin analogs (EMEA 2001) and included a statistical analysis for tumor types.
Materials and Methods
The toxicology testing program for BIL followed the development pathway of a typical human insulin analog and is consistent with current FDA, EMA, and International Conference on Harmonisation (ICH) regulatory guidances for nonclinical pharmacology/toxicology development of insulin analogs (FDA 2010; ICH 2009, 2011), including EMA nonclinical guidance on human insulin analogs (EMEA 2001, 2002). Rats and dogs were selected as the test species because they are commonly used in nonclinical safety studies of pharmaceuticals, especially insulin analogs, and because the pharmacological activity of BIL has been demonstrated in these species. The sc route of exposure was chosen because it is the route of BIL dosing in humans. Dose selection was based on dose-limiting pharmacology (i.e., hypoglycemia) identified in earlier subchronic and chronic toxicity studies of BIL (Eli Lilly and Company, data on file).
The toxicology studies were performed in accordance with Good Laboratory Practice regulations and were consistent with the Organization for Economic Cooperation and Development and the Japanese Ministry of Health, Labor, and Welfare standards in effect at the time of these chronic toxicity studies in rats and dogs. Applicable ICH, EMA Committee for Medicinal Products for Human Use (CHMP), and FDA guidance documents were also referred to during the development of BIL. In addition, in accordance with EMA CHMP guidance, these chronic toxicity studies in rats and dogs included a human insulin reference group, neutral protamine Hagedorn (NPH) insulin (HUMULIN N®, human insulin [recombinant DNA origin] isophane suspension; Eli Lilly and Company; EMEA 2001). Mammary tissue from the chronic studies in rats was evaluated for cellular proliferation using Ki-67 immunohistochemistry (EMEA 2001). These studies were done in compliance with the Animal Welfare Act, the Guide for the Care and Use of Laboratory Animals, and the Office of Laboratory Welfare. The animal facilities at Covance Laboratories, Inc. (Madison, WI) are accredited by the Association for Assessment and Accreditation of Laboratory Animal Care International. The design for the rat and dog studies described in this article was reviewed and approved by the management at Eli Lilly and Company and the Animal Care and Use Committee at Covance Laboratories, Inc.
12-Month Chronic Rat Toxicity Study
Male and female Crl:CD(SD) rats from Charles River Laboratories (Portage, MI) weighing from 182 g to 278 g (males) or from 129 g to 198 g (females) and aged 6 to 7 weeks were randomly assigned to receive once daily sc injections of BIL or NPH insulin for 52 weeks for carcinogenicity or toxicokinetic/glucodynamic evaluations (Table 1). Injection sites were rotated on a daily basis. Male and female rats were housed individually in stainless steel cages in a room with a temperature range of 20°C to 26°C and 30% to 70% relative humidity with a 12-hr light/dark cycle and offered Certified Rodent Diet #2014C (formerly known as Harlan Laboratories, Inc., now known as Envigo, Indianapolis, IN) and water ad libitum.
52-Week Rat Study Design.
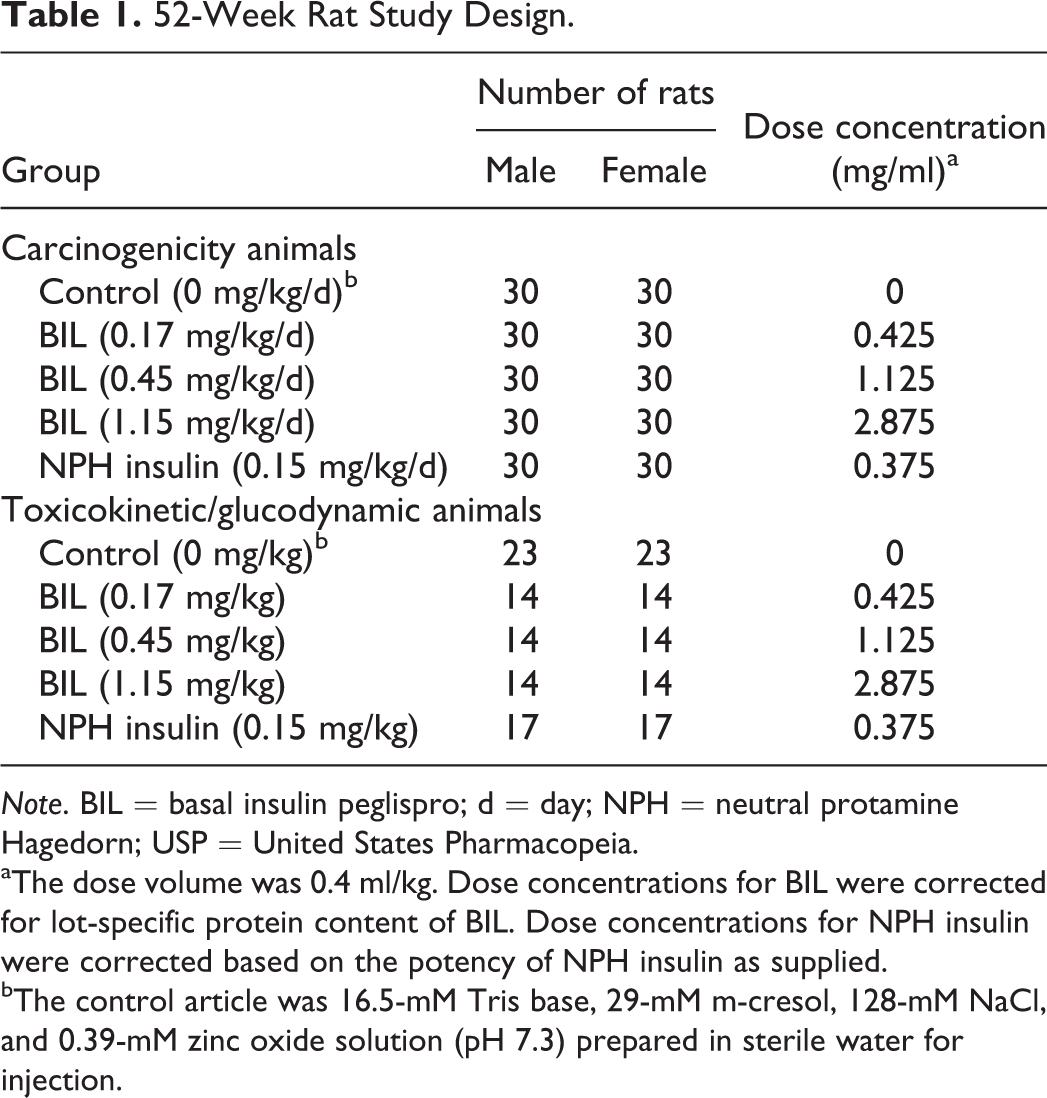
Note. BIL = basal insulin peglispro; d = day; NPH = neutral protamine Hagedorn; USP = United States Pharmacopeia.
aThe dose volume was 0.4 ml/kg. Dose concentrations for BIL were corrected for lot-specific protein content of BIL. Dose concentrations for NPH insulin were corrected based on the potency of NPH insulin as supplied.
bThe control article was 16.5-mM Tris base, 29-mM m-cresol, 128-mM NaCl, and 0.39-mM zinc oxide solution (pH 7.3) prepared in sterile water for injection.
Assessment of toxicity was based on mortality, clinical signs (including observation of palpable masses), body weights, food consumption, clinical (hematology, coagulation, clinical chemistry [including amylase and lipase activities, and trypsinogen-like immunoreactivity], and urinalysis) and anatomic pathology, and immunohistochemistry. Blood samples were collected for toxicokinetic and glucodynamic determinations as well as for anti-BIL antibody analysis. Concentrations of immunoreactive BIL were determined in serum, using a validated enzyme-linked immunosorbent assay (ELISA) method specific for BIL at the Charles River Laboratories (Senneville, Canada). The lower limit of quantitation was 75 pM. Concentrations of immunoreactive NPH insulin in serum were determined using a validated ELISA method at Intertek Pharmaceutical Services (San Diego, CA). The lower limit of quantitation for this assay was 129.1 pM.
Serum samples collected in the rat studies were analyzed for antidrug antibodies (BIL-reactive antibodies) using a validated, qualitative ELISA at Intertek Pharmaceutical Services, formerly known as Alta Analytical Laboratory. During the rat-specific method validation, surrogate assay sensitivity was estimated at 0.0078 µg/ml as defined by a rat IgG/IgM cocktail. Drug tolerance was demonstrated as being less than or equal to 50 µg/ml (1,937,384 pM) based on a 1:1,600 dilution of a rat anti-insulin peglispro positive control serum pool. Positive and negative controls run on each sample analysis plate served to monitor assay performance and determine plate acceptability.
A sample was considered immunoreactively negative if the mean optical density (OD) at the minimum required dilution (1:5) was less than or equal to the cut point OD (mean OD of the duplicate negative control values plus 0.069—the cut point constant established using the median derived cut point of 30 samples of normal individual rat serum during assay validation) or the posttreatment sample titer was less than or equal to the pretreatment sample titer from the same animal. Samples demonstrating a mean OD greater than the cut point OD and a posttreatment sample titer greater than the pretreatment sample titer from the same animal were considered positive for immunoreactivity.
After at least 52 weeks of dosing, all surviving animals were anesthetized with sodium pentobarbital and exsanguinated, and then a necropsy was performed. Terminal body weights and selected organ weights were collected. A set of 46 tissues was collected and fixed in 10% neutral-buffered formalin except for the eyes, optic nerves, testes, and harderian gland, which were fixed in modified Davidson’s fixative. To provide an enhanced evaluation of the brain, including multiple sections of the choroid plexus, the brains were sectioned into 8 coronal sections. All 46 tissues were embedded in paraffin, sectioned at 5 µM, stained with hematoxylin and eosin (H&E), and examined microscopically by a board-certified veterinary pathologist. Another board-certified veterinary pathologist conducted an independent peer review of a subset of tissues. In addition to the histologic examination of the sections stained with H&E, mammary glands were evaluated following immunohistochemical labeling for the cell proliferation marker Ki-67.
After tissue processing, the mammary gland tissues were embedded in paraffin and cut at 4 µM. The tissue sections were immunolabeled with a monoclonal rabbit primary antibody against Ki-67 IgM (Ki-67 [SP6], Spring, M-3062, 1:200). The Ki-67 labeling index was determined quantitatively by counting a total of 1,000 mammary epithelial cells and determining the ratio of Ki-67-positive mammary epithelial cells to the total mammary epithelial cells. Specific mammary gland structures (i.e., terminal end buds, terminal ducts, alveolar buds, and lobules) were not evaluated separately in this analysis.
Dog Study
Male and female purpose purebred beagle dogs (Covance Research Products, Denver, PA), aged 7 months and weighing from 8.0 kg to 10.7 kg (males) or from 6.6 kg to 9.2 kg (females) at the start of treatment, were given once daily sc doses of BIL or NPH insulin for 39 weeks (Table 2). Injection sites were rotated on a daily basis.
39-Week Beagle Dog Study Design.
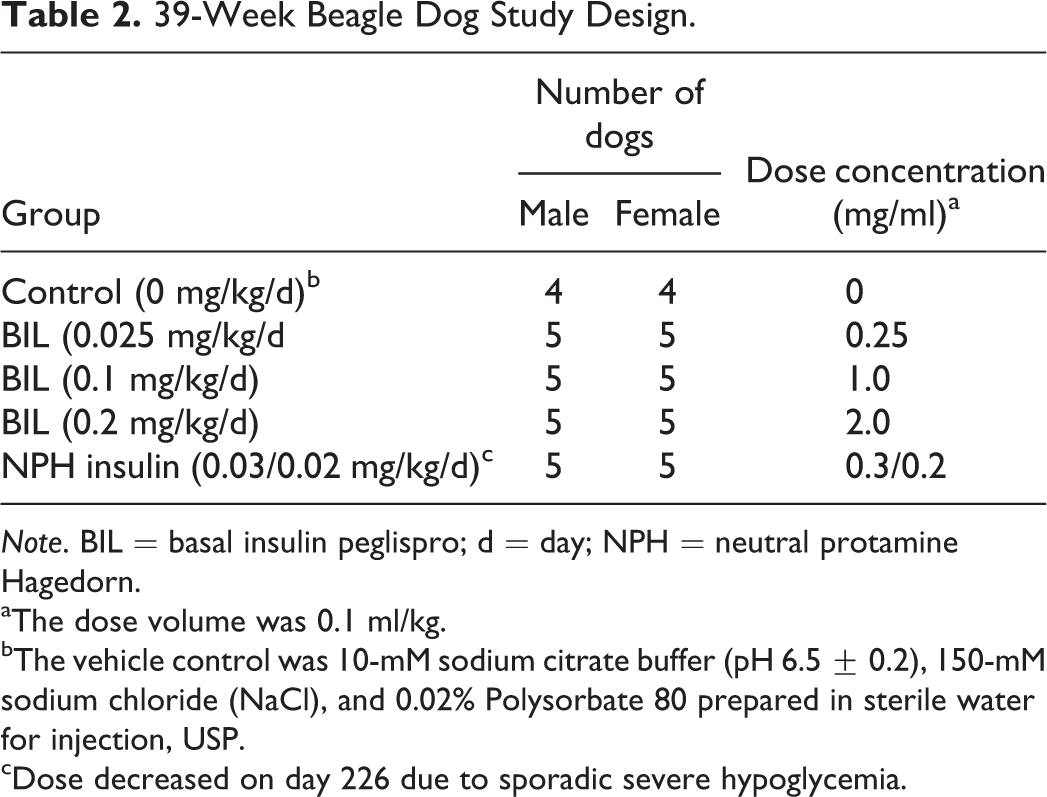
Note. BIL = basal insulin peglispro; d = day; NPH = neutral protamine Hagedorn.
aThe dose volume was 0.1 ml/kg.
bThe vehicle control was 10-mM sodium citrate buffer (pH 6.5 ± 0.2), 150-mM sodium chloride (NaCl), and 0.02% Polysorbate 80 prepared in sterile water for injection, USP.
cDose decreased on day 226 due to sporadic severe hypoglycemia.
Dogs were housed individually in double-wide stainless steel cages in an environmentally controlled room (18°C to 26°C, 30% to 70% relative humidity, and 12-hr light/dark cycle). Dogs were given water and Certified Canine Diet #8727C (Harlan Teklad, Indianapolis, IN, USA) ad libitum through day 15 of the dosing phase and were then transitioned to Certified Canine Diet #2027C (formerly known as Harlan Teklad, now known as Envigo) ad libitum beginning on day 16 and continuing throughout the remainder of the in-life phase of the study. Dogs were also supplemented with canned food (Hill’s Science Diet, Topeka, KS) to minimize the likelihood of severe hypoglycemia.
Assessment of toxicity was based on mortality, clinical signs, body weight, body weight change, food consumption, electrocardiographic, ophthalmic, hematology, clinical chemistry (including amylase and lipase activities, and trypsinogen-like immunoreactivity), urinalysis, immunogenicity, organ weight, macroscopic, and microscopic data. Blood samples were collected for toxicokinetic and glucodynamic determinations.
Concentrations of immunoreactive BIL were determined in serum using a validated ELISA method specific for BIL at BioPharma Services (now known as Eurofins Pharma Bioanalytical Services, Saint Charles, MO). The lower limit of quantitation was 75 pM. In the NPH insulin dogs, concentrations of total immunoreactive insulin in serum were determined using a validated radioimmunoassay (RIA) method at BioPharma Services. The lower limit of quantitation for this assay was 20 pM.
After 39 weeks of treatment, all surviving animals were anesthetized with sodium pentobarbital and exsanguinated, and then a necropsy was performed. Terminal body weights and selected organ weights were collected. A set of 45 tissues was collected and fixed in 10% neutral-buffered formalin except for the eyes, optic nerves, and testes, which were fixed in modified Davidson’s fixative. In the dog, the brain evaluations consisted of hemicoronal sections from 5 brain levels. All tissues for histopathologic analyses were embedded in paraffin, sectioned at 5 µM, stained with H&E, and evaluated by light microscopy by a board-certified veterinary pathologist. Another board-certified veterinary pathologist conducted an independent peer review of all tissues from a subset of dogs. Unlike the rat study, the dog study did not incorporate an assessment of Ki-67 labeling in the mammary gland because the rat is the preferred choice as a test species for assessing carcinogenic potential of insulin analogs (EMEA 2001), and the limited group size in the dog study limits the ability to interpret quantitative differences in labeling index.
Statistical analyses (dog and rat)
Continuous data were reported as mean ± standard deviation (SD) and were analyzed using SAS Version 8.02 (Cary, NC). Levene’s test (Draper and Hunter 1969; Levene 1960) was used to test for homogeneity of variance. In the case of heterogeneity of variance at p ≤ .05, rank transformation was used to stabilize the variance. Comparison tests took variance heterogeneity into consideration. Body weights, body weight changes, food consumptions, continuous clinical pathology values (including urine specific gravity and pH values) were appropriate, and organ weight data were analyzed using a one-way analysis of variance (ANOVA). For dogs, if the ANOVA was significant (p ≤ .05), then Fisher’s least significant difference t-test (Miller 1980) was used for group comparisons. For rats, if the ANOVA showed significance for body weights during the first week of the dosing phase, then one-way analysis of covariance (ANCOVA) was used to analyze body weights with the initial body weights used as the covariate. If the ANCOVA was significant, covariate-adjusted means were used for comparisons between the control group and specific treatment group at the 5.0% significance level.
Mortality data for the rat were evaluated for a dose-related trend using the Cox Tarone method (Tarone 1975). One-sided tests for trend and heterogeneity among control and treatment groups were conducted. Fatal, incidental, and mortality independent tumor data were evaluated using an appropriate survival-adjusted trend test (FDA 2001; Peto, Pike, and Day 1980). Palpable neoplastic lesions (e.g., fibroma, fibrosarcoma) and mammary lesions were analyzed by the same methods as the survival data using the first observation time of histopathologically verified lesions such as their latency (onset time). Site or tumor combinations were statistically analyzed if the incidence in at least 1 group was increased or decreased by at least 2 occurrences compared with the control group. Because the standard normal approximation used in analysis of tumorigenicity data may lead to artificially small p-values in the presence of low tumor incidence (Ali 1990), exact trend tests were performed for those site or tumor combinations with overall tumor incidence <10.
For the Ki-67 labeling index in mammary epithelial cells, Levene’s test indicated the variances were heterogeneous for females and homogeneous for males. Therefore, untransformed data for males were analyzed by ANOVA with Dunnett’s t-test for group comparison with control. The female data were ranked, transformed, and then analyzed by ANOVA with group comparison with control using Dunnett’s t-test. Animals without 3,3′-Diaminobenzidine (DAB)-positive mammary epithelial cells were not used for determining the Ki-67 labeling index and are not listed in the data.
Results
12-Month Chronic Rat Toxicity Study
Survival and clinical signs
BIL had no effect on survival at any dose (Table 3). A slightly higher incidence of mortality was observed in males given 0.45 mg/kg and 1.15 mg/kg BIL; however, because the overall incidence was low and females did not exhibit a similar trend, this pattern was likely due to normal variability. Although animals sacrificed in moribund condition presented with anomalies, there was no consistent pattern of change. The cause of death or moribundity in these animals was not considered to be BIL related. No compound-related clinical signs or differences in the incidence of palpable masses were observed for BIL or NPH insulin. Clinical signs were observed either equally or more frequently in the control group, occurred in individual animals with no relation to dose level, or were of low incidence.
Summary of Survival in Rats at 52 Weeks.
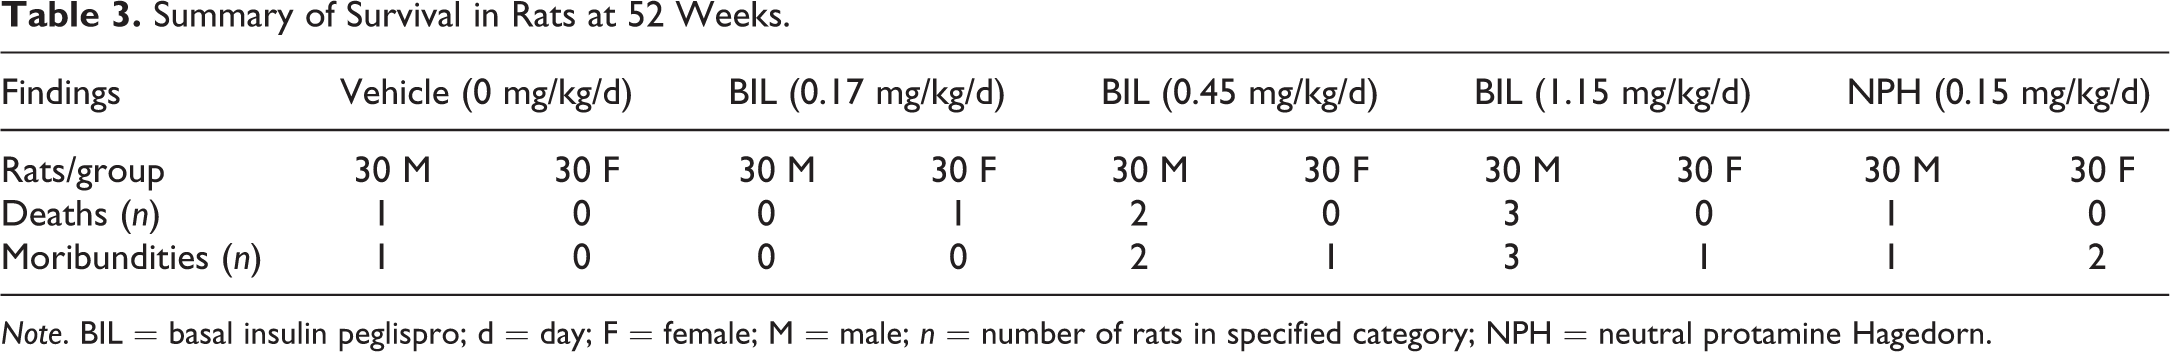
Note. BIL = basal insulin peglispro; d = day; F = female; M = male; n = number of rats in specified category; NPH = neutral protamine Hagedorn.
Body weight and food consumption
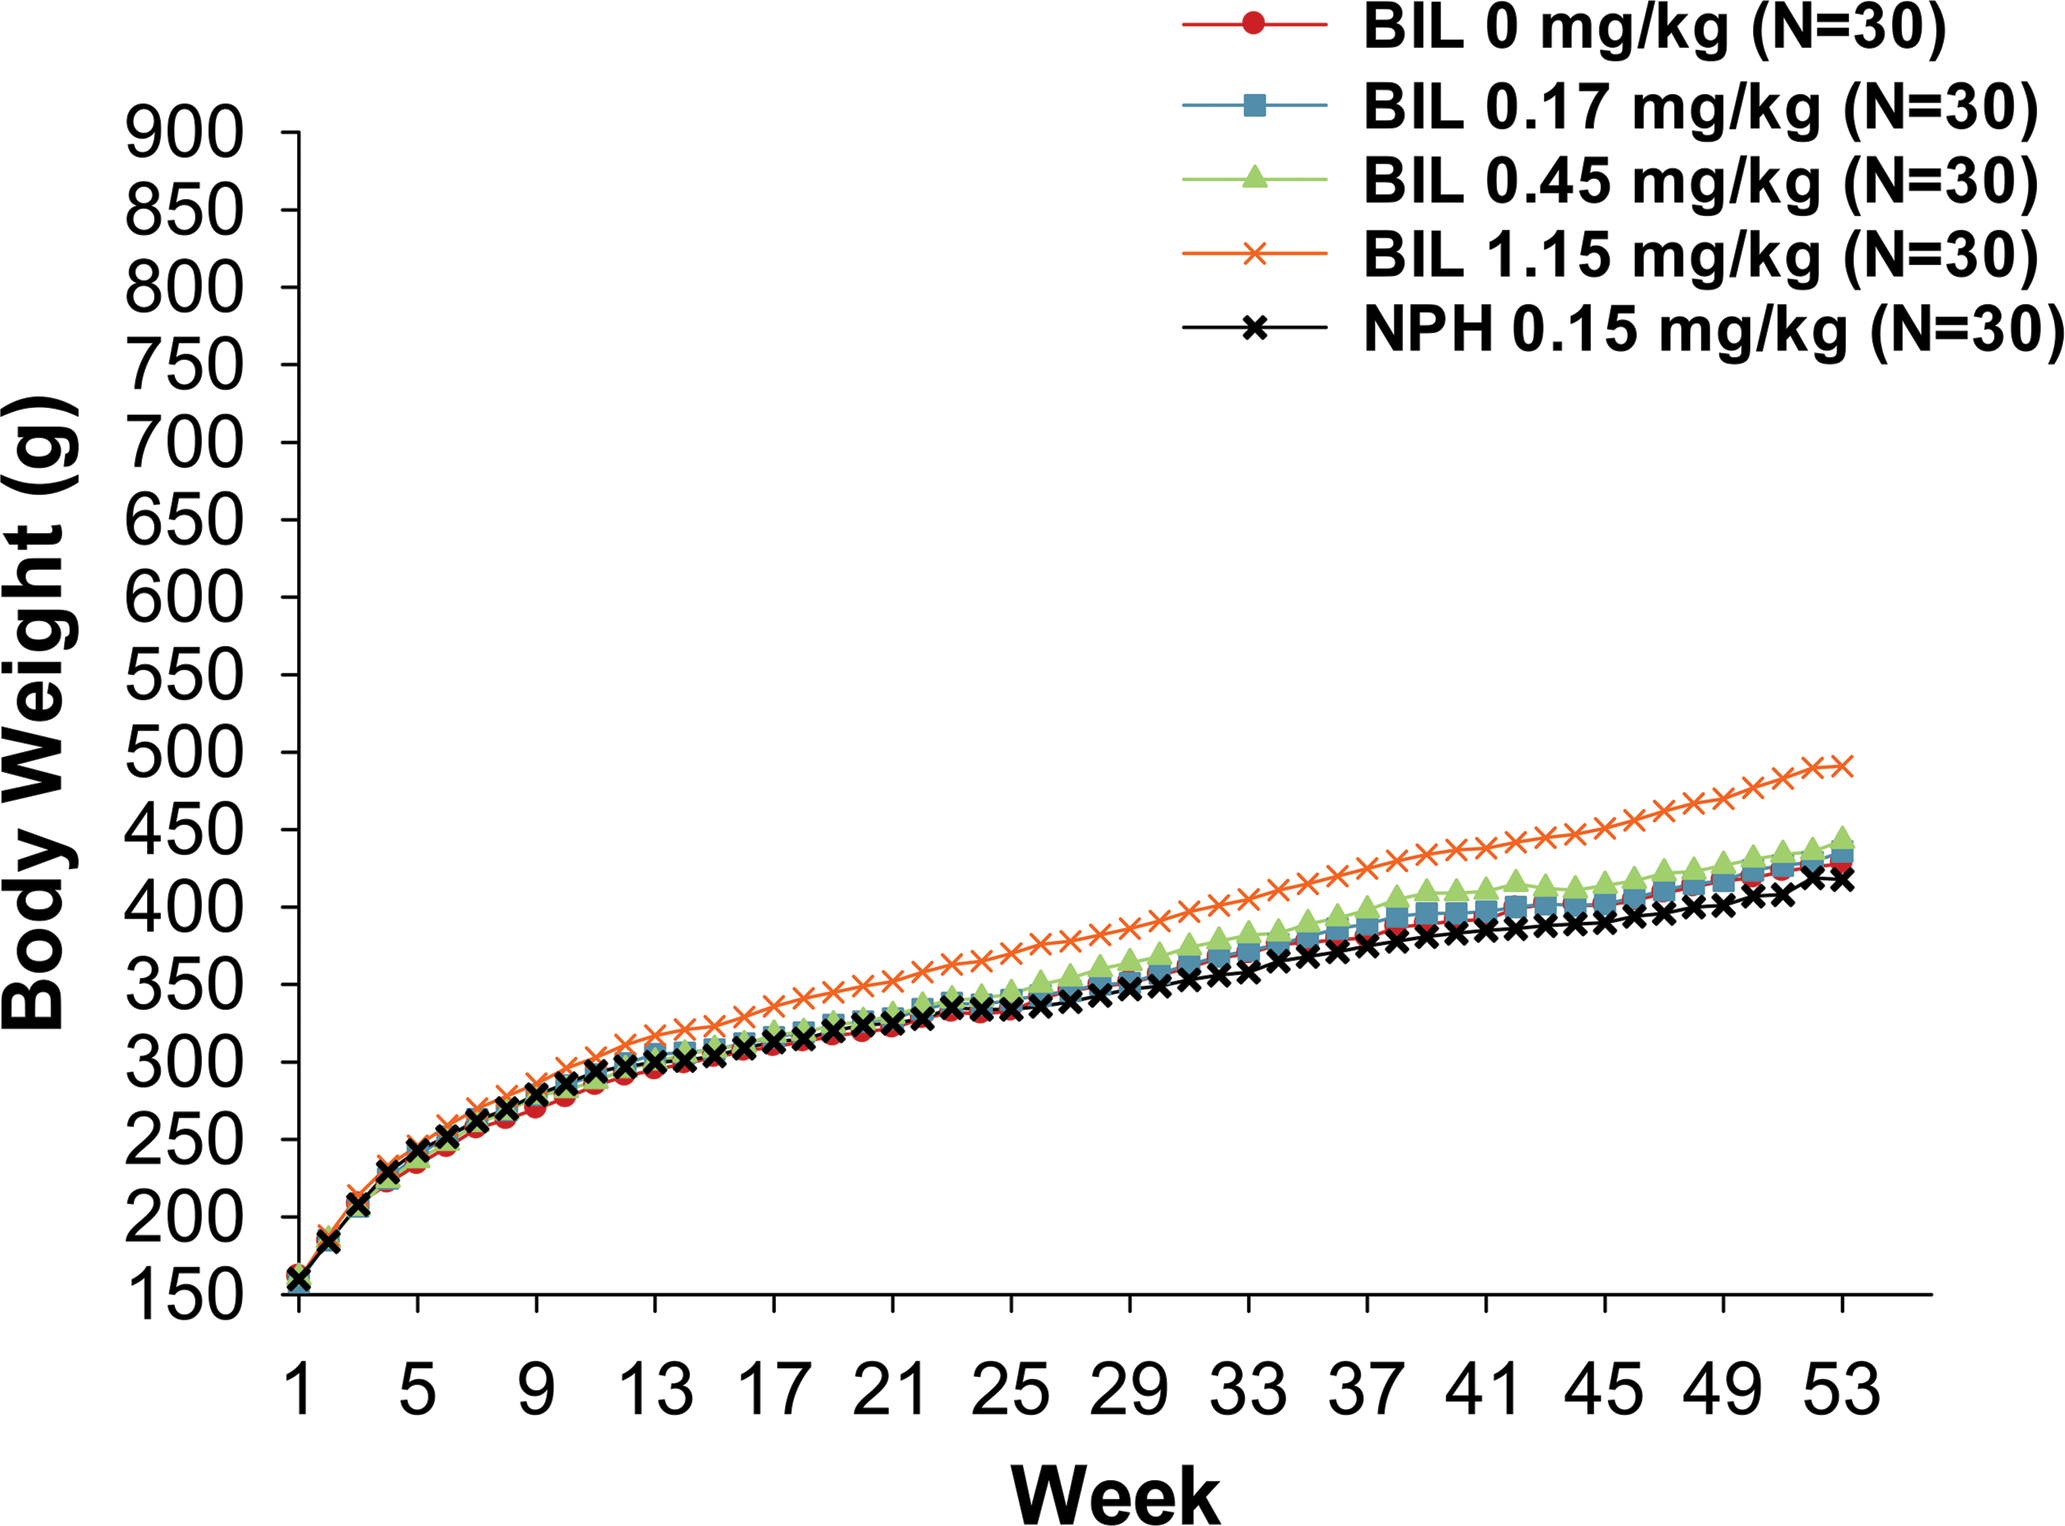
Statistically significantly higher mean weekly food consumption, a well-recognized counterregulatory response to insulin-induced hypoglycemia in humans and animals (Booth and Brookover 1968; Grossman and Stein 1948; Sanders et al. 2006; Schultes et al. 2003; Smith and Epstein 1969), was observed for rats given 1.15-mg/kg BIL compared with the control animals, whereas food consumption for rats given 0.17- or 0.45-mg/kg BIL or NPH insulin groups was generally similar to that of the control rats. Rats given 1.15-mg/kg BIL also had statistically significantly higher body weights as early as week 20 in males (Figure 1) and week 12 in females (Figure 2) when compared with control rats. A similar pattern was observed for body weight gains where statistically significant increases in body weight gains were detected as early as week 1 of the treatment period for females and week 2 of the treatment period for males. Overall mean body weight gains for males given 0.17-, 0.45-, or 1.15-mg/kg BIL were 108.2%, 105.8%, and 117.0%, respectively, of the control male mean body weight gain. The corresponding overall mean body weight gains for females were 104.5%, 106.0%, and 124.0%, respectively, of the control female mean body weight gain.
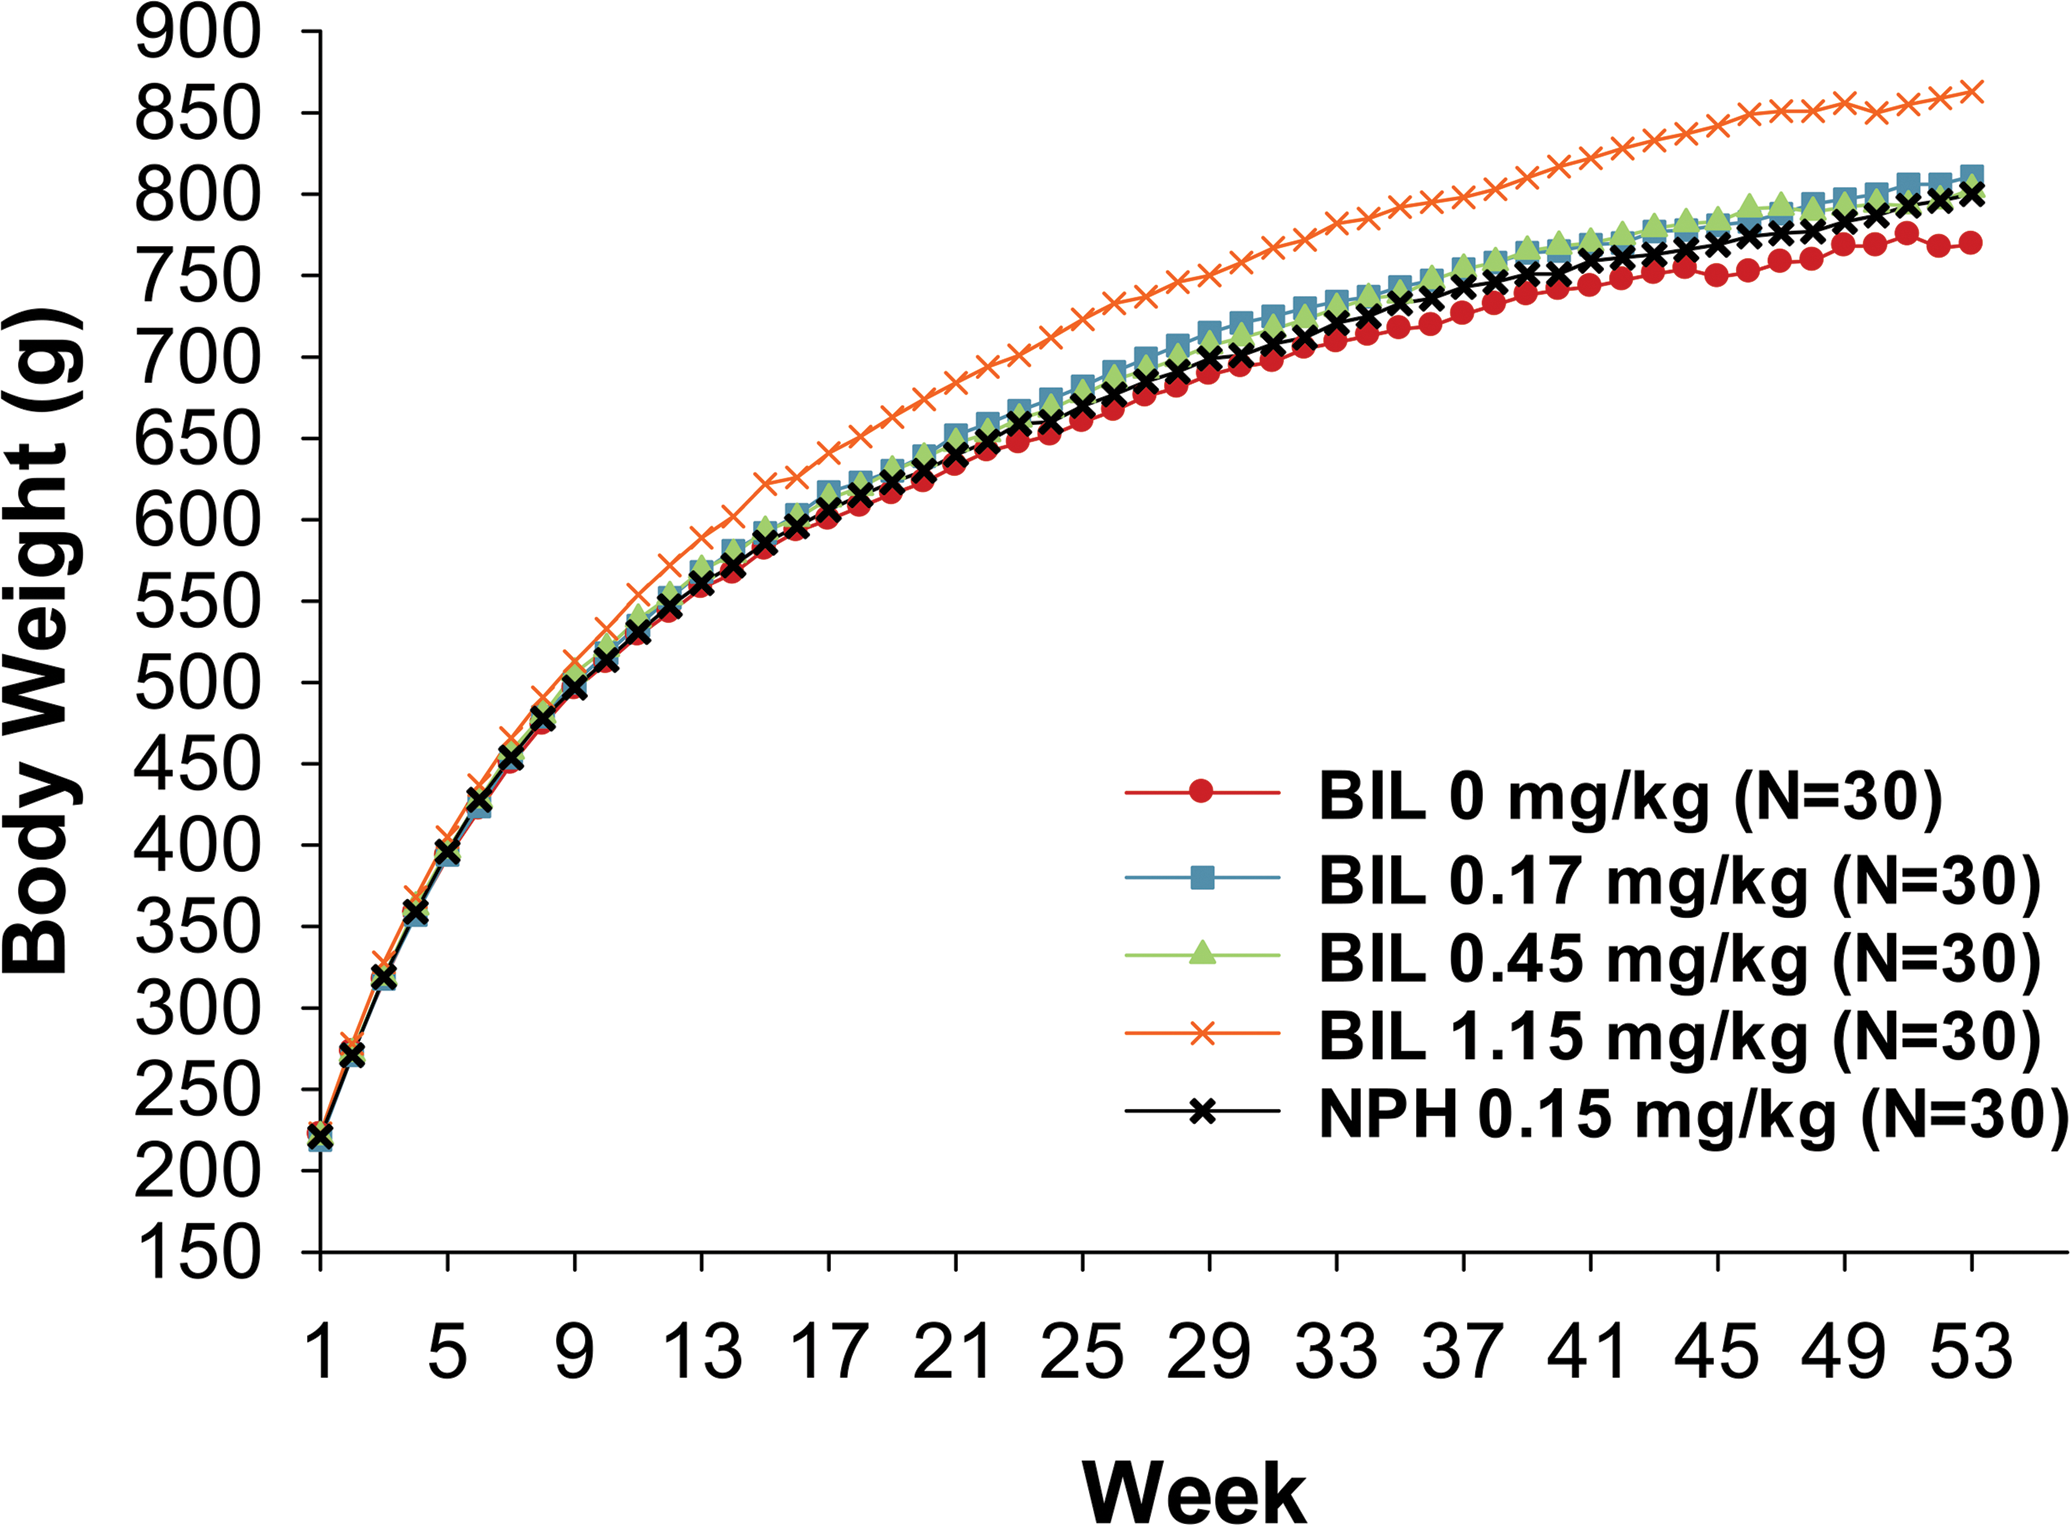
Growth curves for male rats given daily subcutaneous injections of basal insulin peglispro (BIL) or neutral protamine Hagedorn (NPH) insulin for 53 weeks. Data are reported as the mean. p ≤ .05 for week 20, 24–28, 31, 33–37, 40–53, BIL 1.15 mg/kg versus control.
Growth curves for female rats given daily subcutaneous injections of basal insulin peglispro (BIL) or neutral protamine Hagedorn (NPH) insulin for 53 weeks. Data are reported as the mean. p ≤.05 for week 12–14, 16–53, BIL 1.15 mg/kg versus control.
Toxicokinetics
After sc administration of BIL, the observed time of maximum plasma concentration (T max) values ranged from 3 hr to 12 hr (data not shown). Systemic exposure following daily sc doses of BIL generally increased with increasing dose level (Table 4). The increases in C max and area under the plasma concentration versus time curve from 0 hr to 24 hr (AUC0–24hr) were roughly dose proportional. Sex differences in BIL C max and AUC0–24hr values were generally less than 2-fold. Values for C max and AUC0–24hr on days 91, 182, and 360 were generally similar to or slightly higher than values following a single dose on day 1, but the differences were less than 2-fold with the exception of the high-dose group. In general, there appeared to be little accumulation of BIL, but there was some variability across dose groups.
Exposure of Rats to Immunoreactive BIL after Administration of 0.17, 0.45, or 1.15 mg/kg of BIL during a 52-Week Toxicology Study.
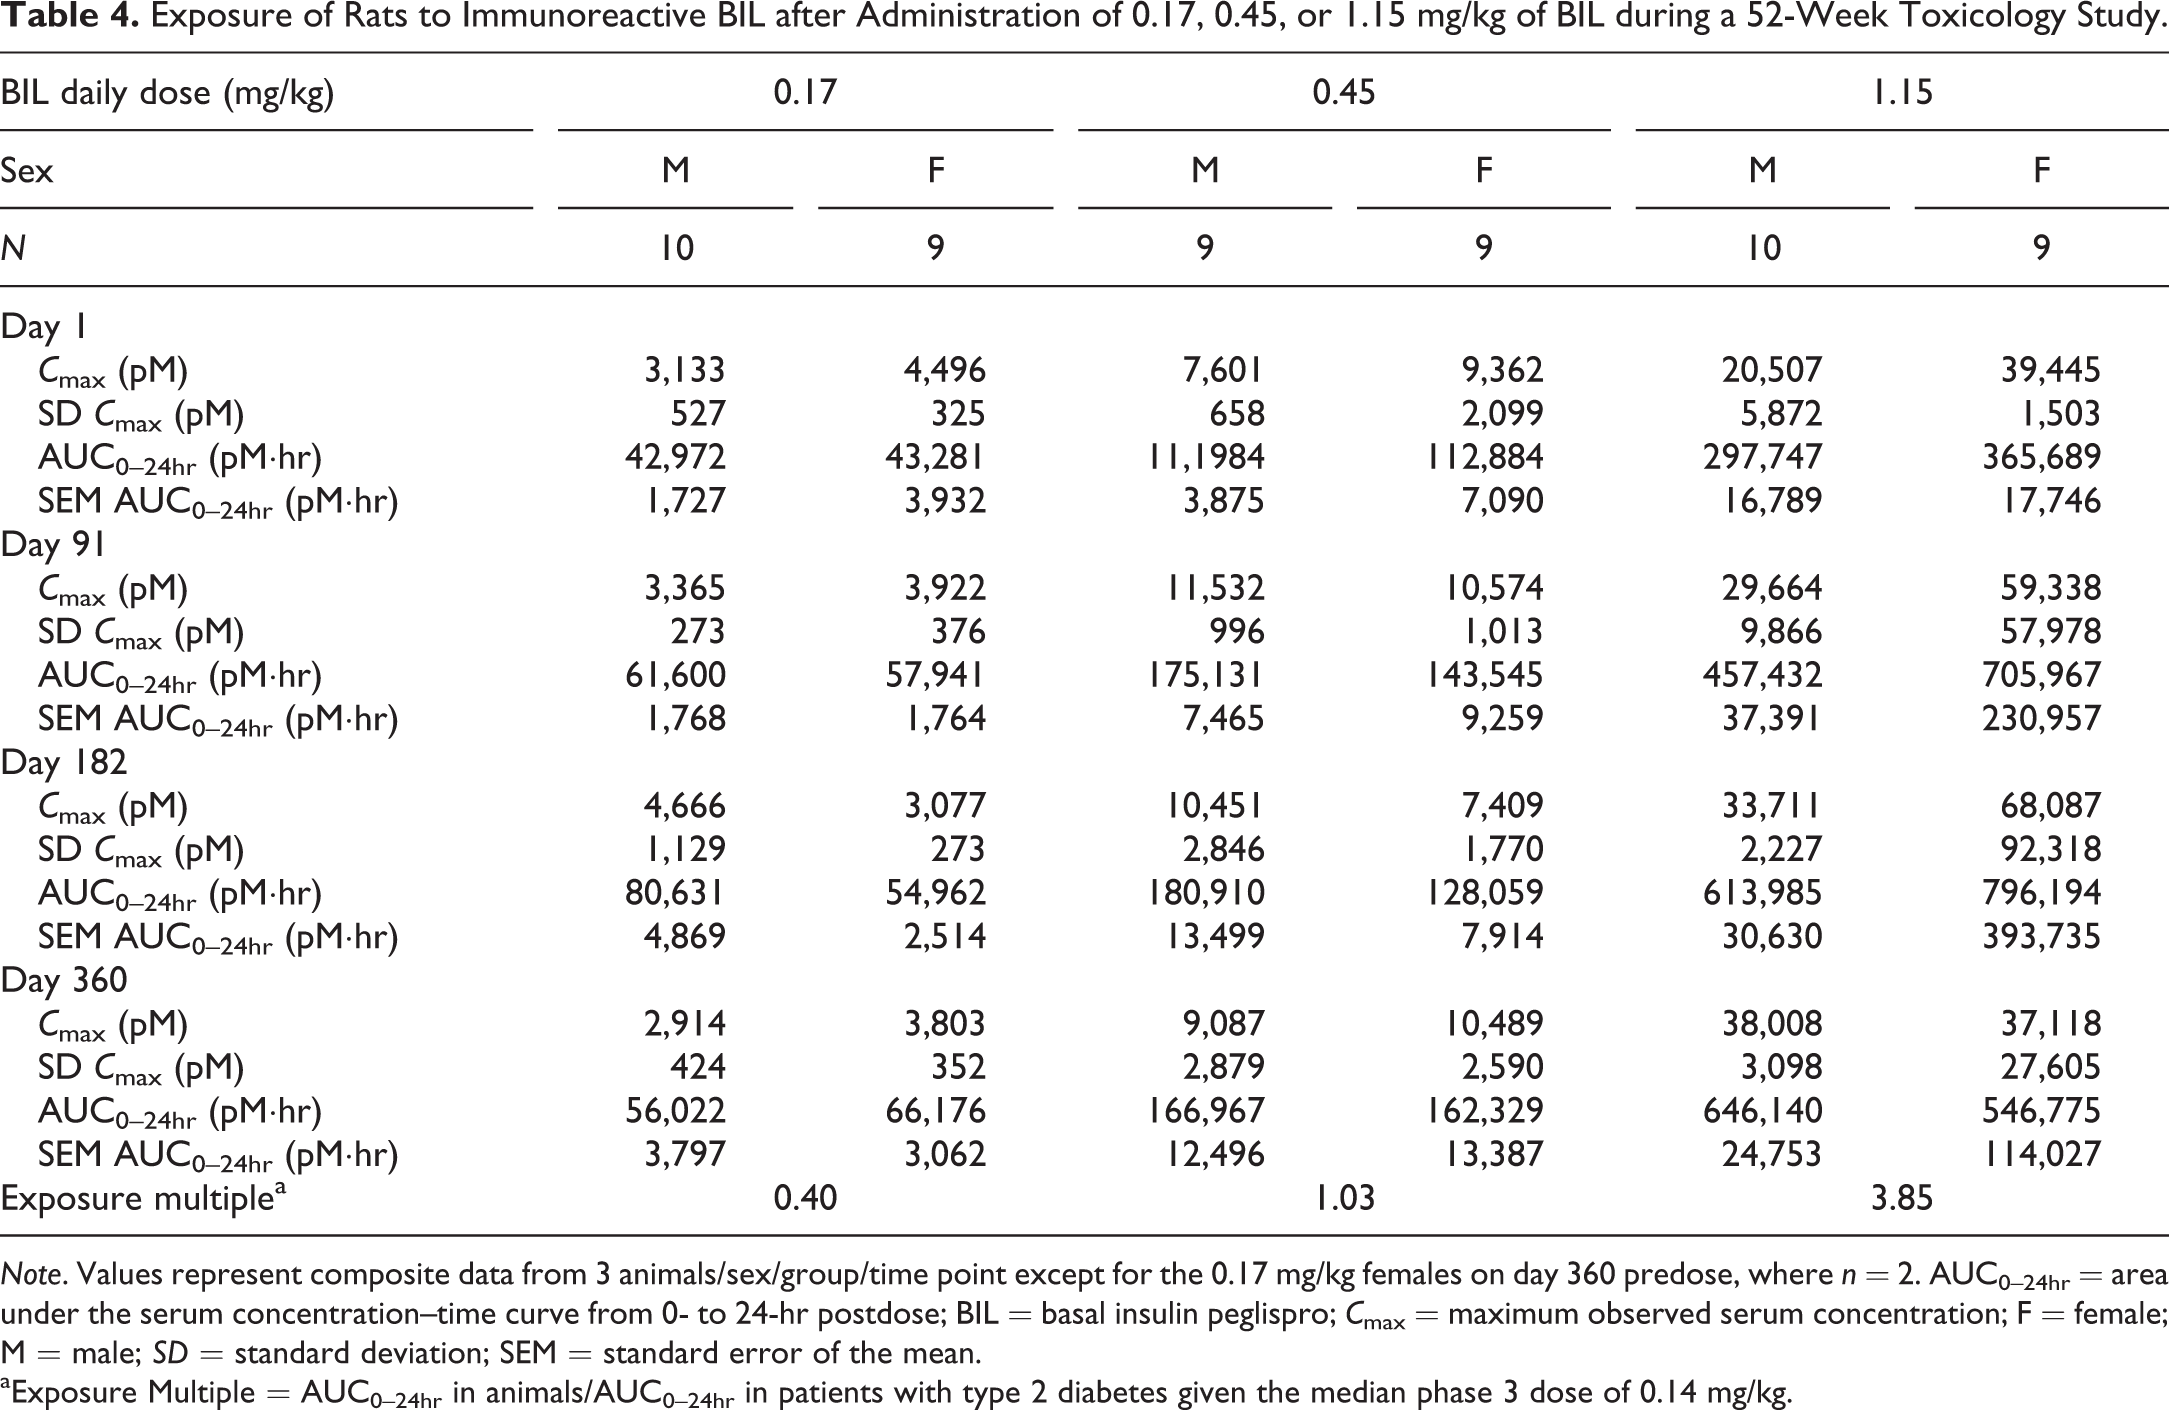
Note. Values represent composite data from 3 animals/sex/group/time point except for the 0.17 mg/kg females on day 360 predose, where n = 2. AUC0–24hr = area under the serum concentration–time curve from 0- to 24-hr postdose; BIL = basal insulin peglispro; C max = maximum observed serum concentration; F = female; M = male; SD = standard deviation; SEM = standard error of the mean.
aExposure Multiple = AUC0–24hr in animals/AUC0–24hr in patients with type 2 diabetes given the median phase 3 dose of 0.14 mg/kg.
After sc administration of NPH, animals were exposed to human insulin with T max values shorter than those for BIL and ranging from 0.5 hr to 2 hr. Exposure appeared similar in males and females (<2-fold difference), and exposure was similar after single dose and multiple dosing, indicating no accumulation of human insulin (data not shown).
Anti-BIL antibodies
The incidences of anti-BIL antibody titers were observed as follows: carcinogenicity animals: 2/47 rats (control), 6/55 rats (0.17-mg/kg BIL), 9/42 rats (0.45-mg/kg BIL), 8/53 rats (1.15-mg/kg BIL) and toxicokinetic animals: 0/6 rats (control), 1/5 rats (0.17-mg/kg BIL), 0/3 rats (0.45-mg/kg BIL), and 0/6 rats (1.15-mg/kg BIL). As can be expected for screening immunogenicity assays, there was a false-positive rate of about 4% (Jaki, Allacher, and Horling 2016). However, because measureable concentrations of BIL were found in all samples with anti-BIL antibodies and very high concentrations of BIL can interfere with the accuracy of the anti-BIL antibody assay, false-negative results potentially may have been reported. Food consumption and body weight remained elevated throughout the second half of the study despite an absence of hypoglycemia, suggesting a continuation of the counterregulatory insulin pharmacology and an absence of neutralizing anti-BIL antibodies. Mayer and Bates (1952) reported a similar increase in food intake during treatment of rats with NPH insulin doses too small to produce hypoglycemia.
Glucodynamics and clinical pathology
Administration of 0.17-mg/kg BIL had no effect on postdose serum glucose concentration. In contrast, female rats given 0.45-mg/kg BIL showed numerically lower serum glucose concentration 3- and 6-hr postdose on day 1; however, serum glucose concentrations were not affected at other postbaseline intervals (days 91, 182, and 360) during the treatment period. Serum glucose concentration decreased in rats given 1.15-mg/kg BIL and was most pronounced on day 1 (Figures 3 and 4) but had no effect at days 182 and 360 (data not shown).
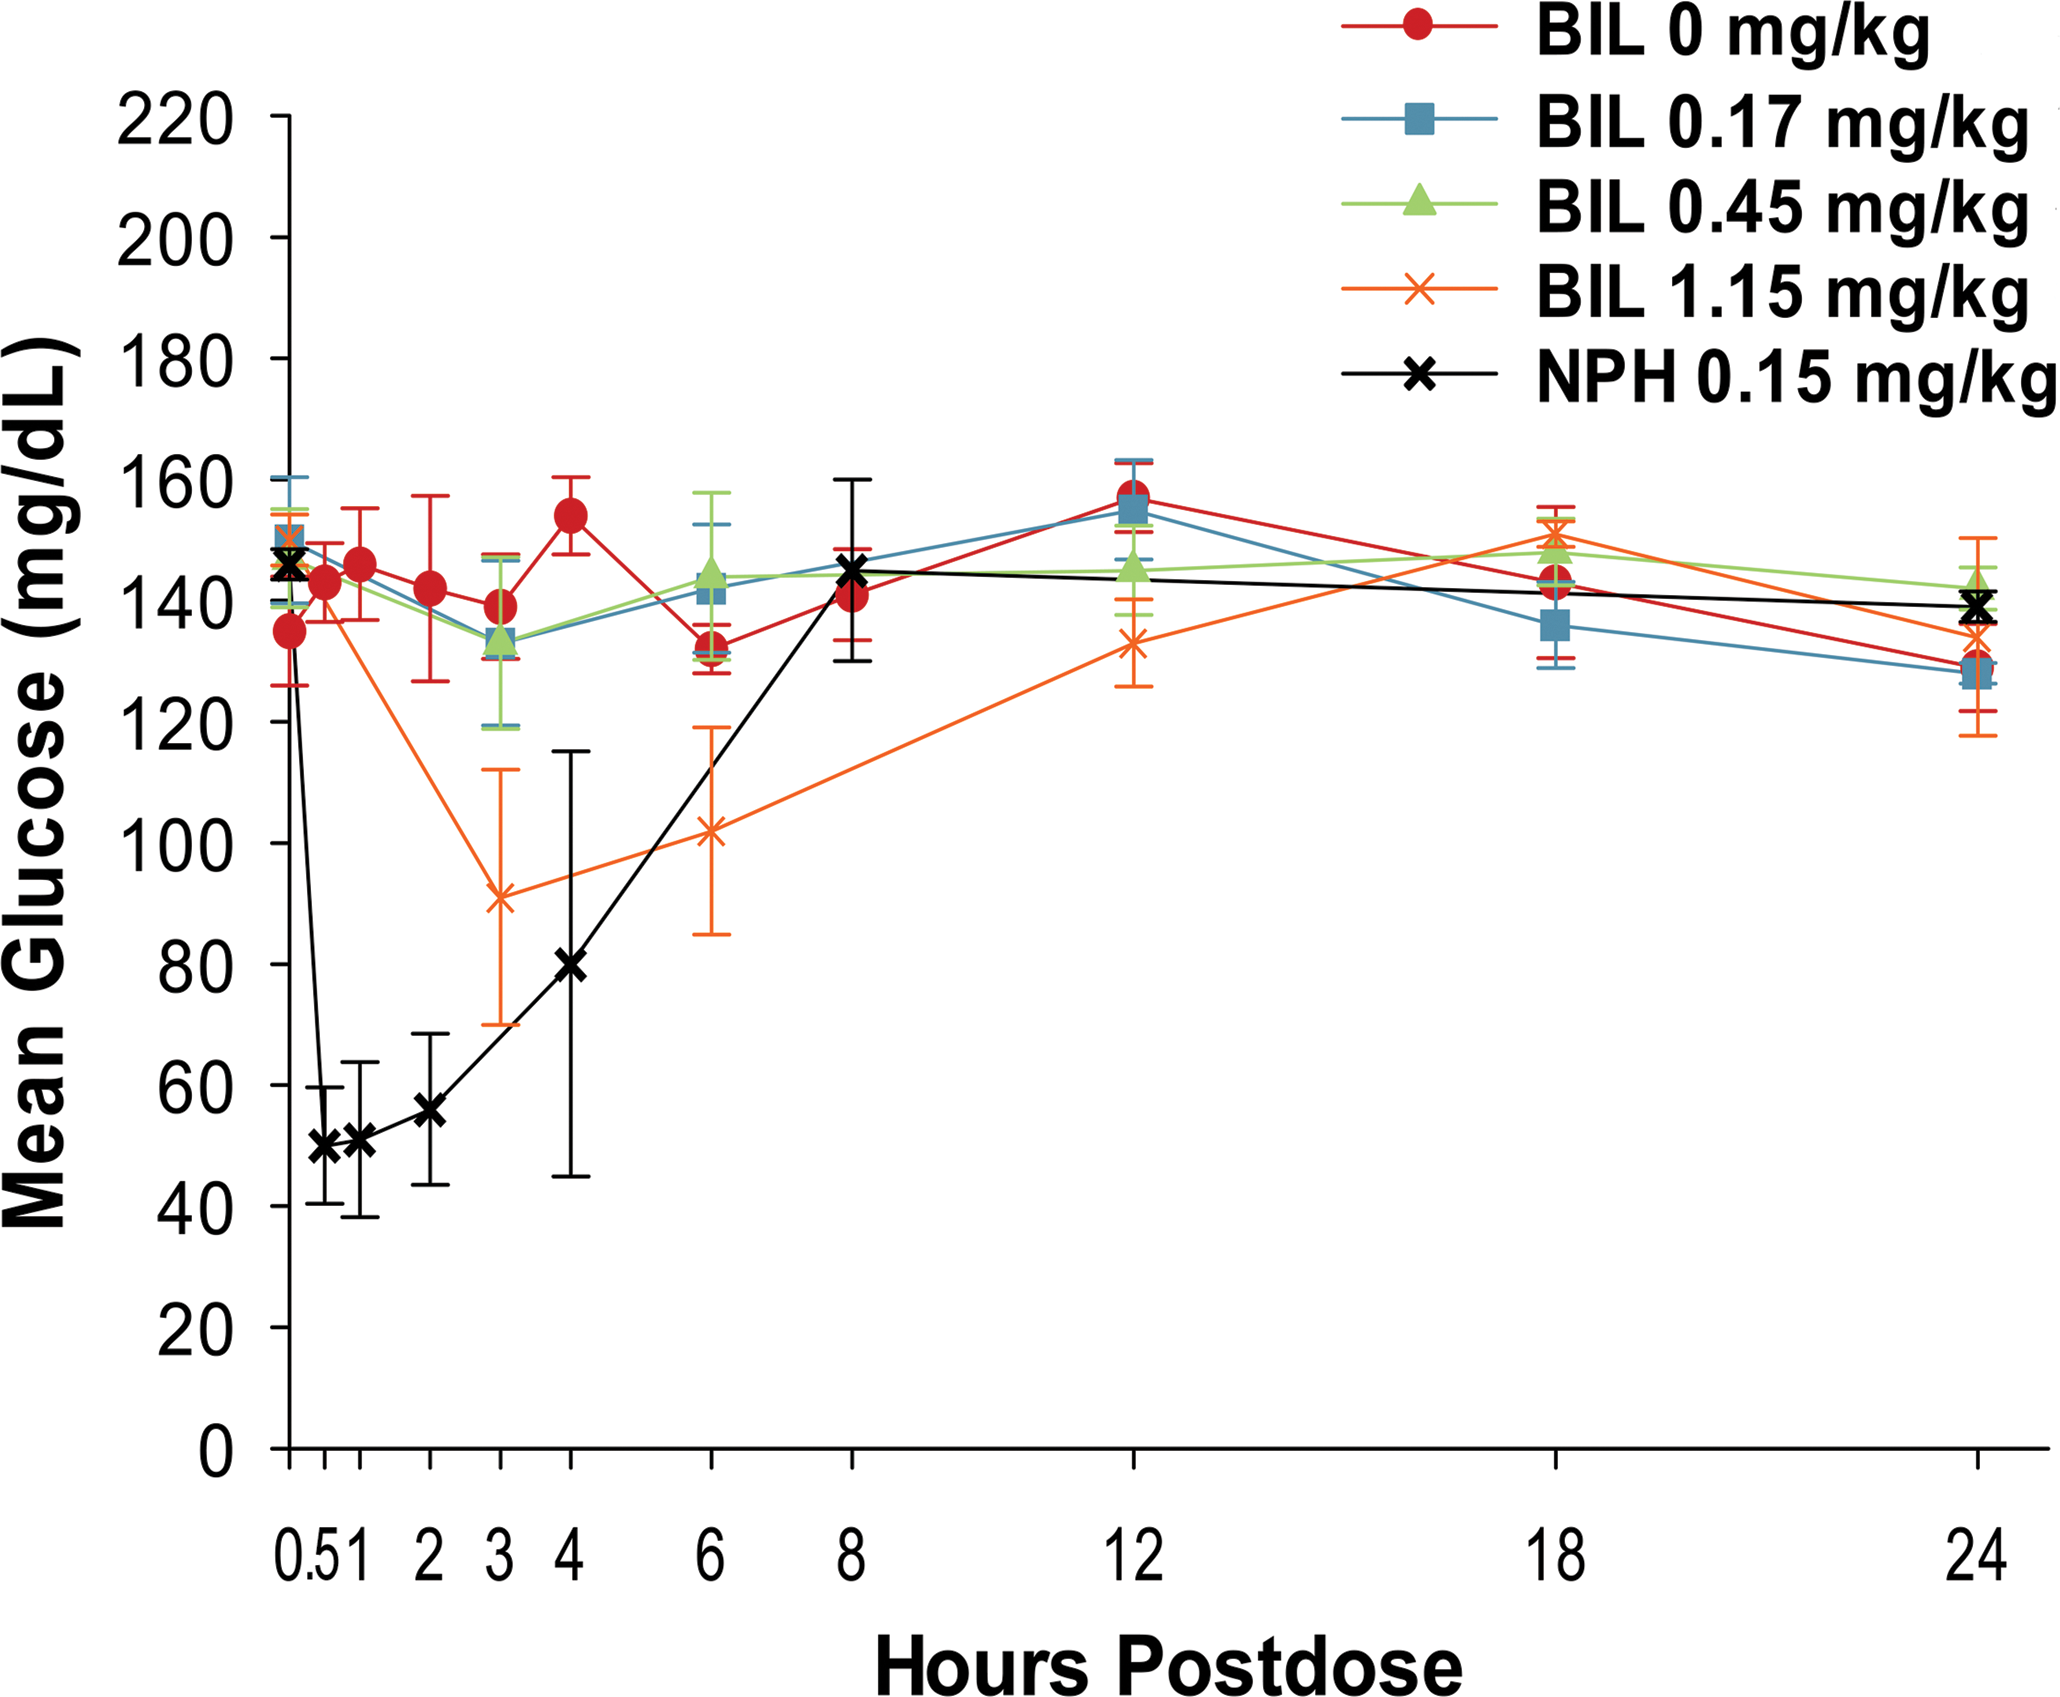
Glucodynamic curves for male rats given subcutaneous injections of basal insulin peglispro or neutral protamine Hagedorn insulin on day 1. Data are presented as the mean ± standard deviation.
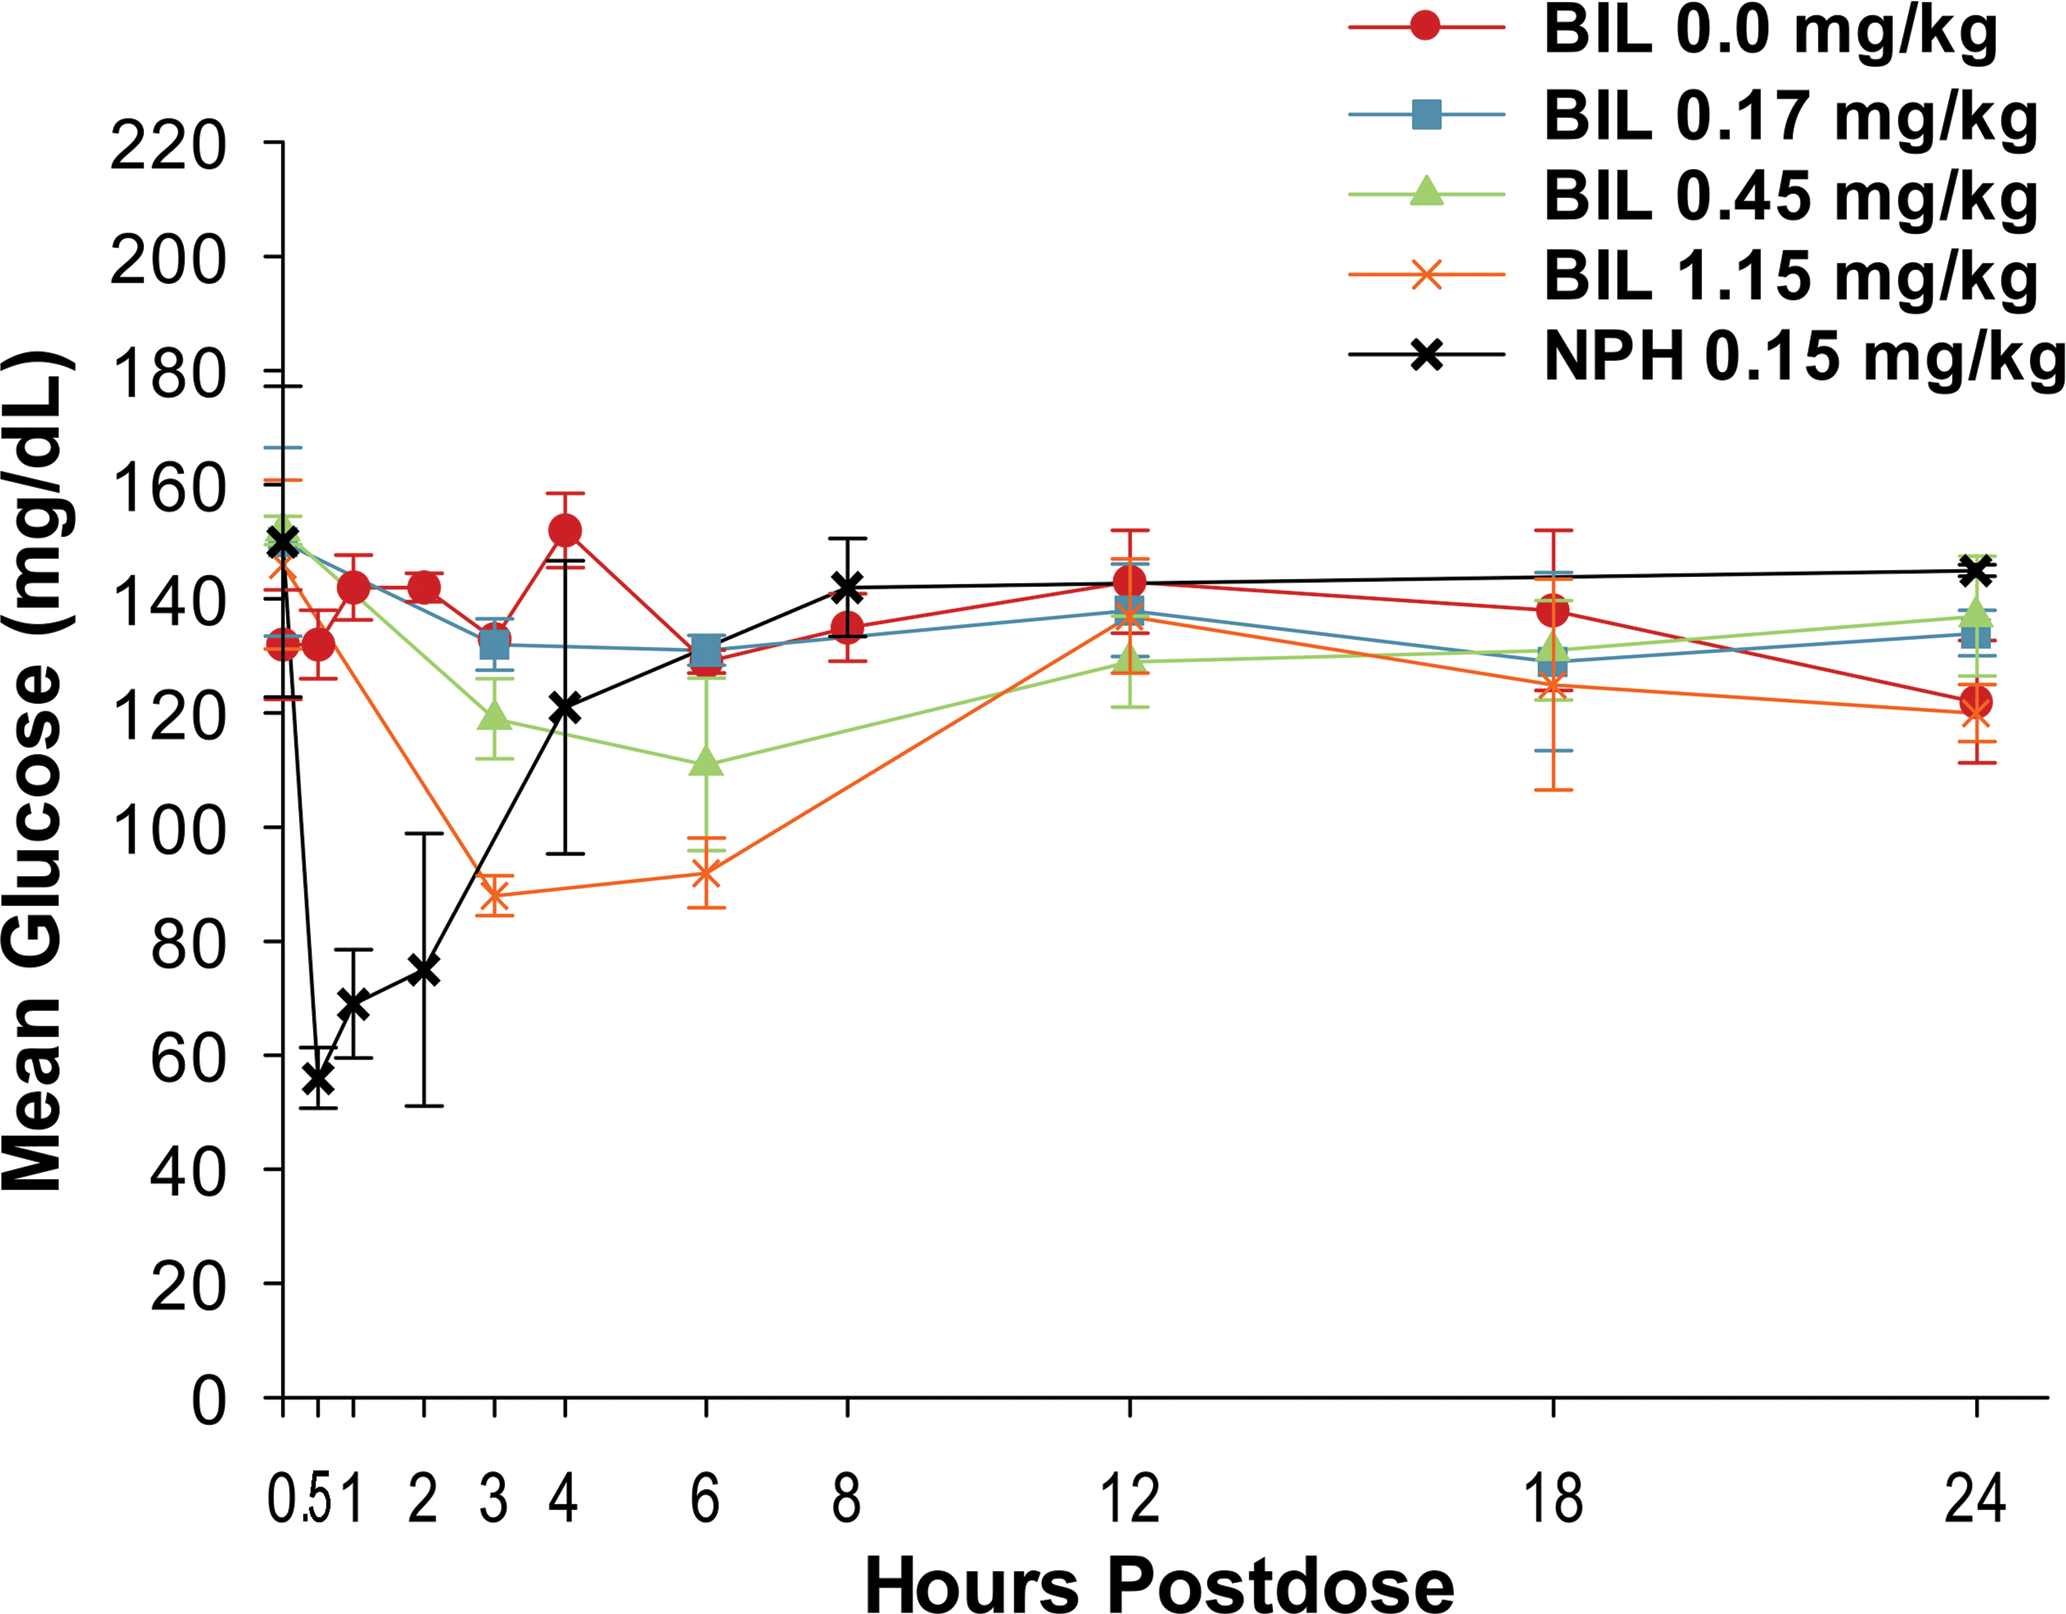
Glucodynamic curves for female rats given subcutaneous injections of basal insulin peglispro or neutral protamine Hagedorn insulin on day 1. Data are presented as the mean ± standard deviation.
In contrast with the phases 2 and 3 clinical program for BIL, where increases in alanine aminotransferase (ALT) and aspartate aminotransferase (AST) activities were observed (Cusi et al. 2016), there were no toxicologically important hepatic effects attributable to BIL or NPH including no increases in ALT or AST activities (data not shown) or microscopic findings. At termination on day 367, minor BIL-related effects consisted of minimally increased absolute monocyte counts for female rats given 1.15-mg/kg BIL, mildly lower serum glucose concentrations for male and female rats given 1.15-mg/kg BIL, and mildly decreased triglyceride concentrations in male rats given 0.45- or 1.15-mg/kg BIL (data not shown). At day 367, minor NPH-related effects were limited to mildly higher glucose concentration for males, mildly lower creatine kinase activity for males, minimally lower amylase activity for females, and minimally higher inorganic phosphorus concentration for males (data not shown).
Morphologic pathology
Administration of BIL did not produce any changes in organ weights. BIL-related macroscopic findings were limited to thickening of the sc injection sites. One female given 1.15-mg/kg BIL and 1 male given NPH insulin had thickening of their sc injection sites, which correlated microscopically with increased adipose tissue. Although thickening of sc injection sites was only noted macroscopically in a few animals, microscopically increased adipose tissue was noted at 1 or more sc injection sites of numerous animals at all dose levels. Microscopically, a dose-related increased incidence and/or severity of increased adipose tissue occurred at all sc injection sites for females given 0.17-, 0.45-, or 1.15-mg/kg BIL and males given 1.15-mg/kg BIL. There was also an increased incidence and/or severity of increased adipose tissue within the sc injection sites in males given the NPH. Increased adipose tissue at the injection site was characterized by increased size and/or number of adipose cells in the deep dermis. This finding at the injection sites in rats is consistent with a well-recognized cutaneous complication of injectable insulin therapy in human patients with diabetes known as lipohypertrophy, which is characterized by benign adipocyte hypertrophy and hyperplasia and is indicative of the local lipogenic pharmacologic activity inherent in insulin (Fujikura et al. 2005; Roper and Bilous 1998).
In this study, pituitary adenomas occurred in males and females given the control vehicle, BIL, or the reference compound. A small numerically increased incidence of microscopic pituitary adenomas occurred in females given 0.17-mg/kg (13/30 rats), 0.45- mg/kg (13/30 rats), or 1.15- mg/kg (14/30 rats) BIL compared to control vehicle (9/30 rats) and NPH reference group (7/29 rats). This finding was neither dose related nor statistically significant when compared to control.
No BIL-related findings occurred in the other examined tissues. In addition, BIL did not produce epithelial proliferation in mammary tissue, a known target tissue in rats of the tumorigenic insulin analog AspB10 (Jorgensen, Dideriksen, and Drejer 1992), as measured by Ki-67 labeling (Table 5). Although increased liver fat content has been reported in patients with diabetes previously treated with insulin who switched to BIL therapy for 26 and 52 weeks (Cusi et al. 2016), there was no evidence of increased liver fat in rats. No PEG vacuolation was observed at any BIL dose level in any tissue, including ependymal cells of choroid plexus, renal tubular cells, and tissue macrophages (Table 5).
Selected Anatomic Pathology and Histopathology Findings in Rats at 52 Weeks.
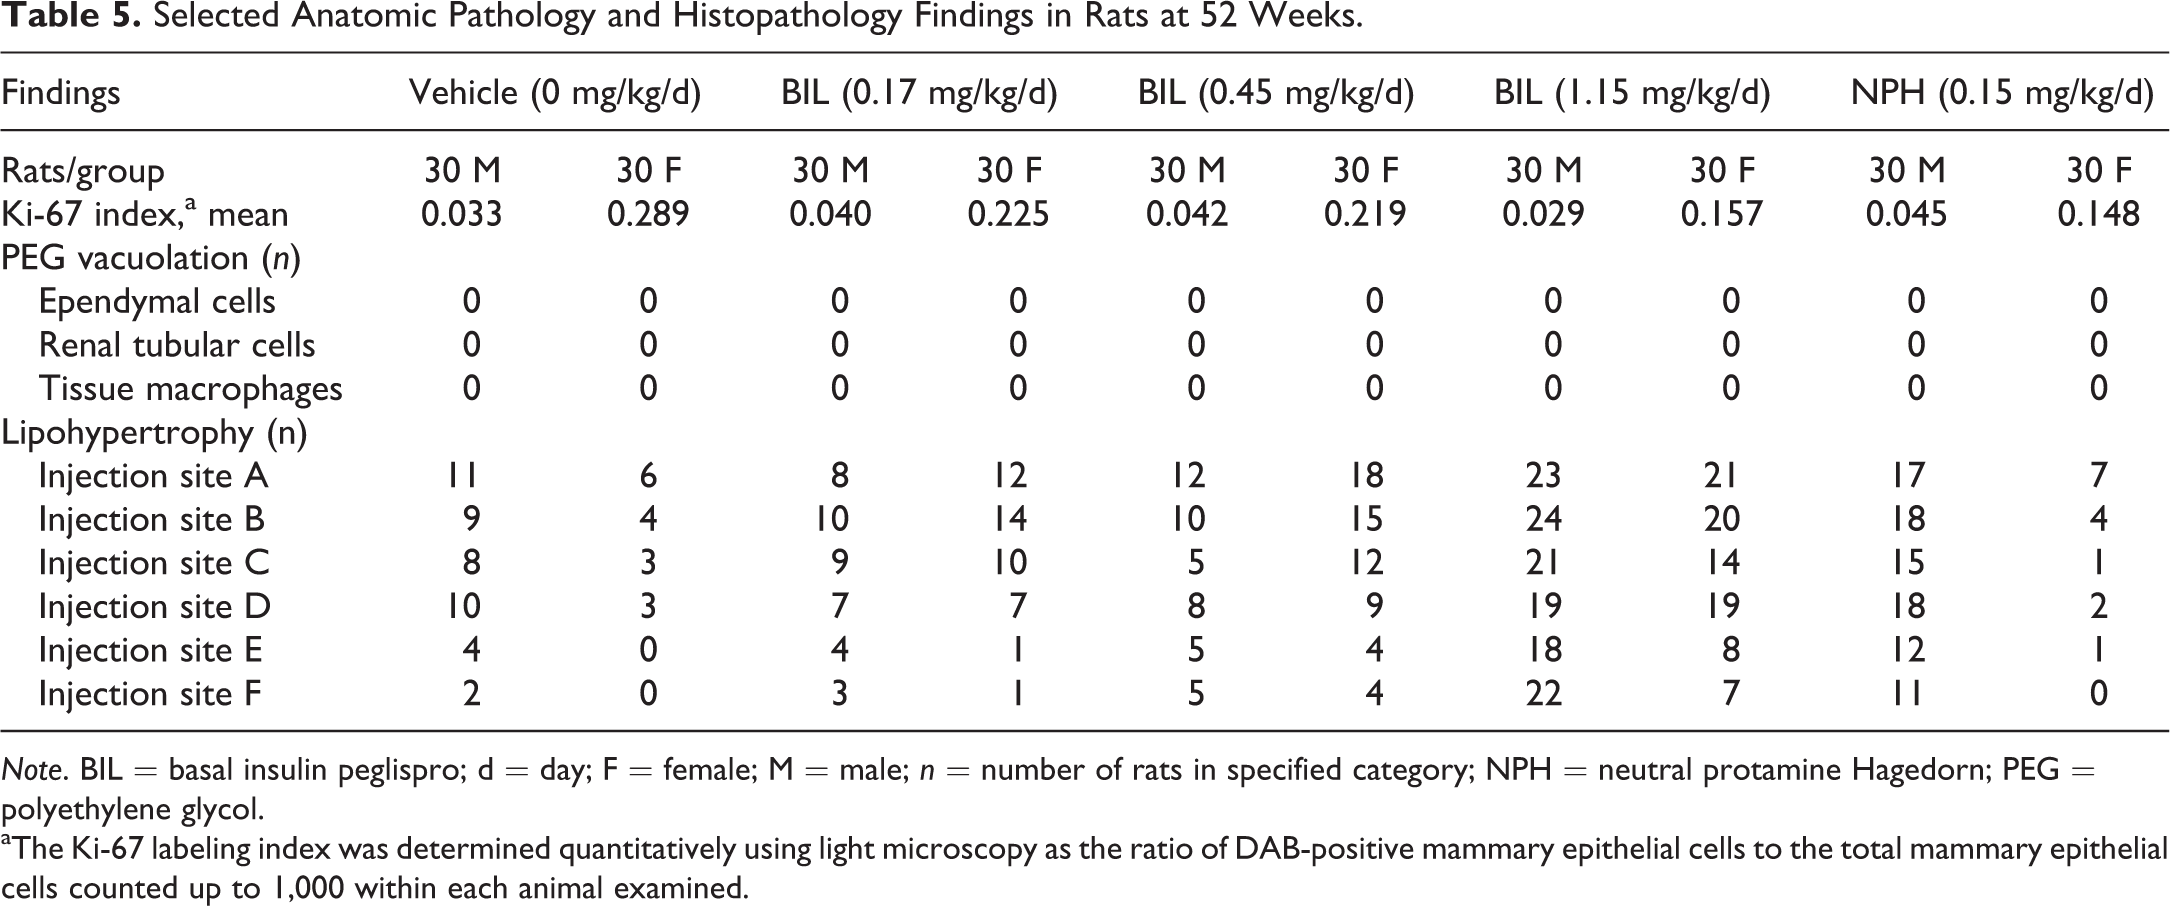
Note. BIL = basal insulin peglispro; d = day; F = female; M = male; n = number of rats in specified category; NPH = neutral protamine Hagedorn; PEG = polyethylene glycol.
aThe Ki-67 labeling index was determined quantitatively using light microscopy as the ratio of DAB-positive mammary epithelial cells to the total mammary epithelial cells counted up to 1,000 within each animal examined.
39-Week Dog Study
Survival and clinical signs
There were no deaths in the control and BIL groups (Table 6). One dog that received NPH was euthanized on day 117 with clinical signs of severe hypoglycemia. Between days 135 and 221 of the treatment period, some animals given 0.03-mg/kg NPH insulin had sporadic clinical signs of hypoglycemia, including tremors, ataxia, hypoactivity, and/or being cold to the touch; however, all of these animals recovered after rescue treatment with intravenous 10% dextrose. Subsequently, the NPH dose for the remaining dogs in the NPH group was lowered from 0.03 mg/kg to 0.02 mg/kg on day 226 with a marked reduction in the occurrence of hypoglycemia-related clinical signs. No unusual or abnormal clinical signs (e.g., appearance, excretion) were observed in animals administered BIL. The only BIL-related clinical sign was a dose-related swelling at the injection sites (Table 6). The swelling was not seen clinically in the 0 mg/kg/day BIL (control) or the NPH insulin groups.
Summary of Survival, Select Clinical Findings, and Total Weight Gain (Days 1 through 274) in Dogs at 39 Weeks.
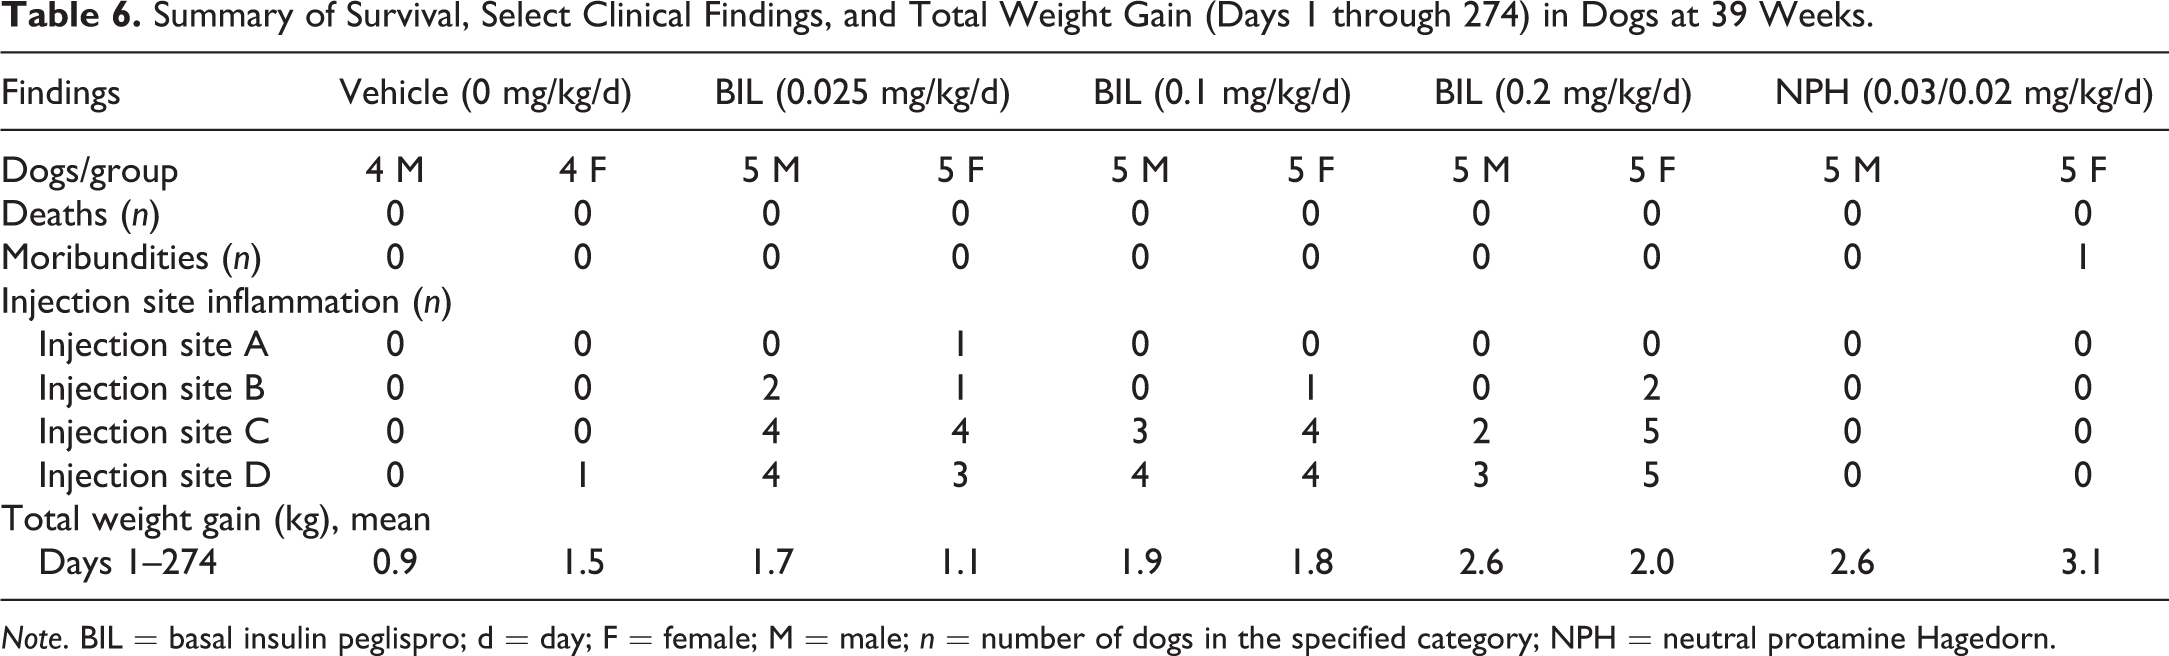
Note. BIL = basal insulin peglispro; d = day; F = female; M = male; n = number of dogs in the specified category; NPH = neutral protamine Hagedorn.
Body weight and food consumption
No BIL-related body weight or food consumption changes were noted in dogs (data not shown). Sporadic, statistically significant changes in body weight change and food consumption were seen in the dosing phase, but neither of these parameters demonstrated a clear dose response or correlated with a given interval and therefore were not considered BIL related. Dose-related increases in total weight gain (days 1 through 274) were observed in male dogs at all BIL doses and in female dogs in the mid and high doses; while these changes in total weight gain did not achieve statistical significance, they were considered to be BIL related.
Ophthalmic, neurological, and electrocardiographic evaluations
No BIL-related ophthalmic or neurological findings were noted (data not shown). All evaluated electrocardiograms were considered qualitatively and quantitatively normal for the dogs. There were no important changes in heart rate or QT/QTc intervals in the any of the BIL or NPH insulin groups (data not shown).
Toxicokinetics
After daily sc injections, the mean T max values for BIL ranged from 3 hr to 11 hr (Table 7). Systemic exposure of BIL was similar for male and female dogs. No accumulation of BIL was observed following multiple dosing because the exposure on day 271 was similar to that on day 148 and slightly less than that on day 1. Mean BIL C max and AUC0–24hr values increased in a roughly dose-proportional manner. The human insulin concentrations peaked at 1.5 hr to 8 hr postdose. The exposure was similar in male and female dogs, and there did not appear to be any accumulation with multiple dosing when dose normalized C max and AUC0–24hr values were compared. On day 271, the mean C max values was 455 pM for males and 482 pM for females, whereas the AUC0–24hr was 3,200 pM·hr for males and 4,323 pM·hr for females.
Mean Toxicokinetic Parameters for Immunoreactive BIL Following Daily Subcutaneous Administration of 0.025, 0.1, and 0.2 mg/kg of BIL to Dogs for 39 Weeks.
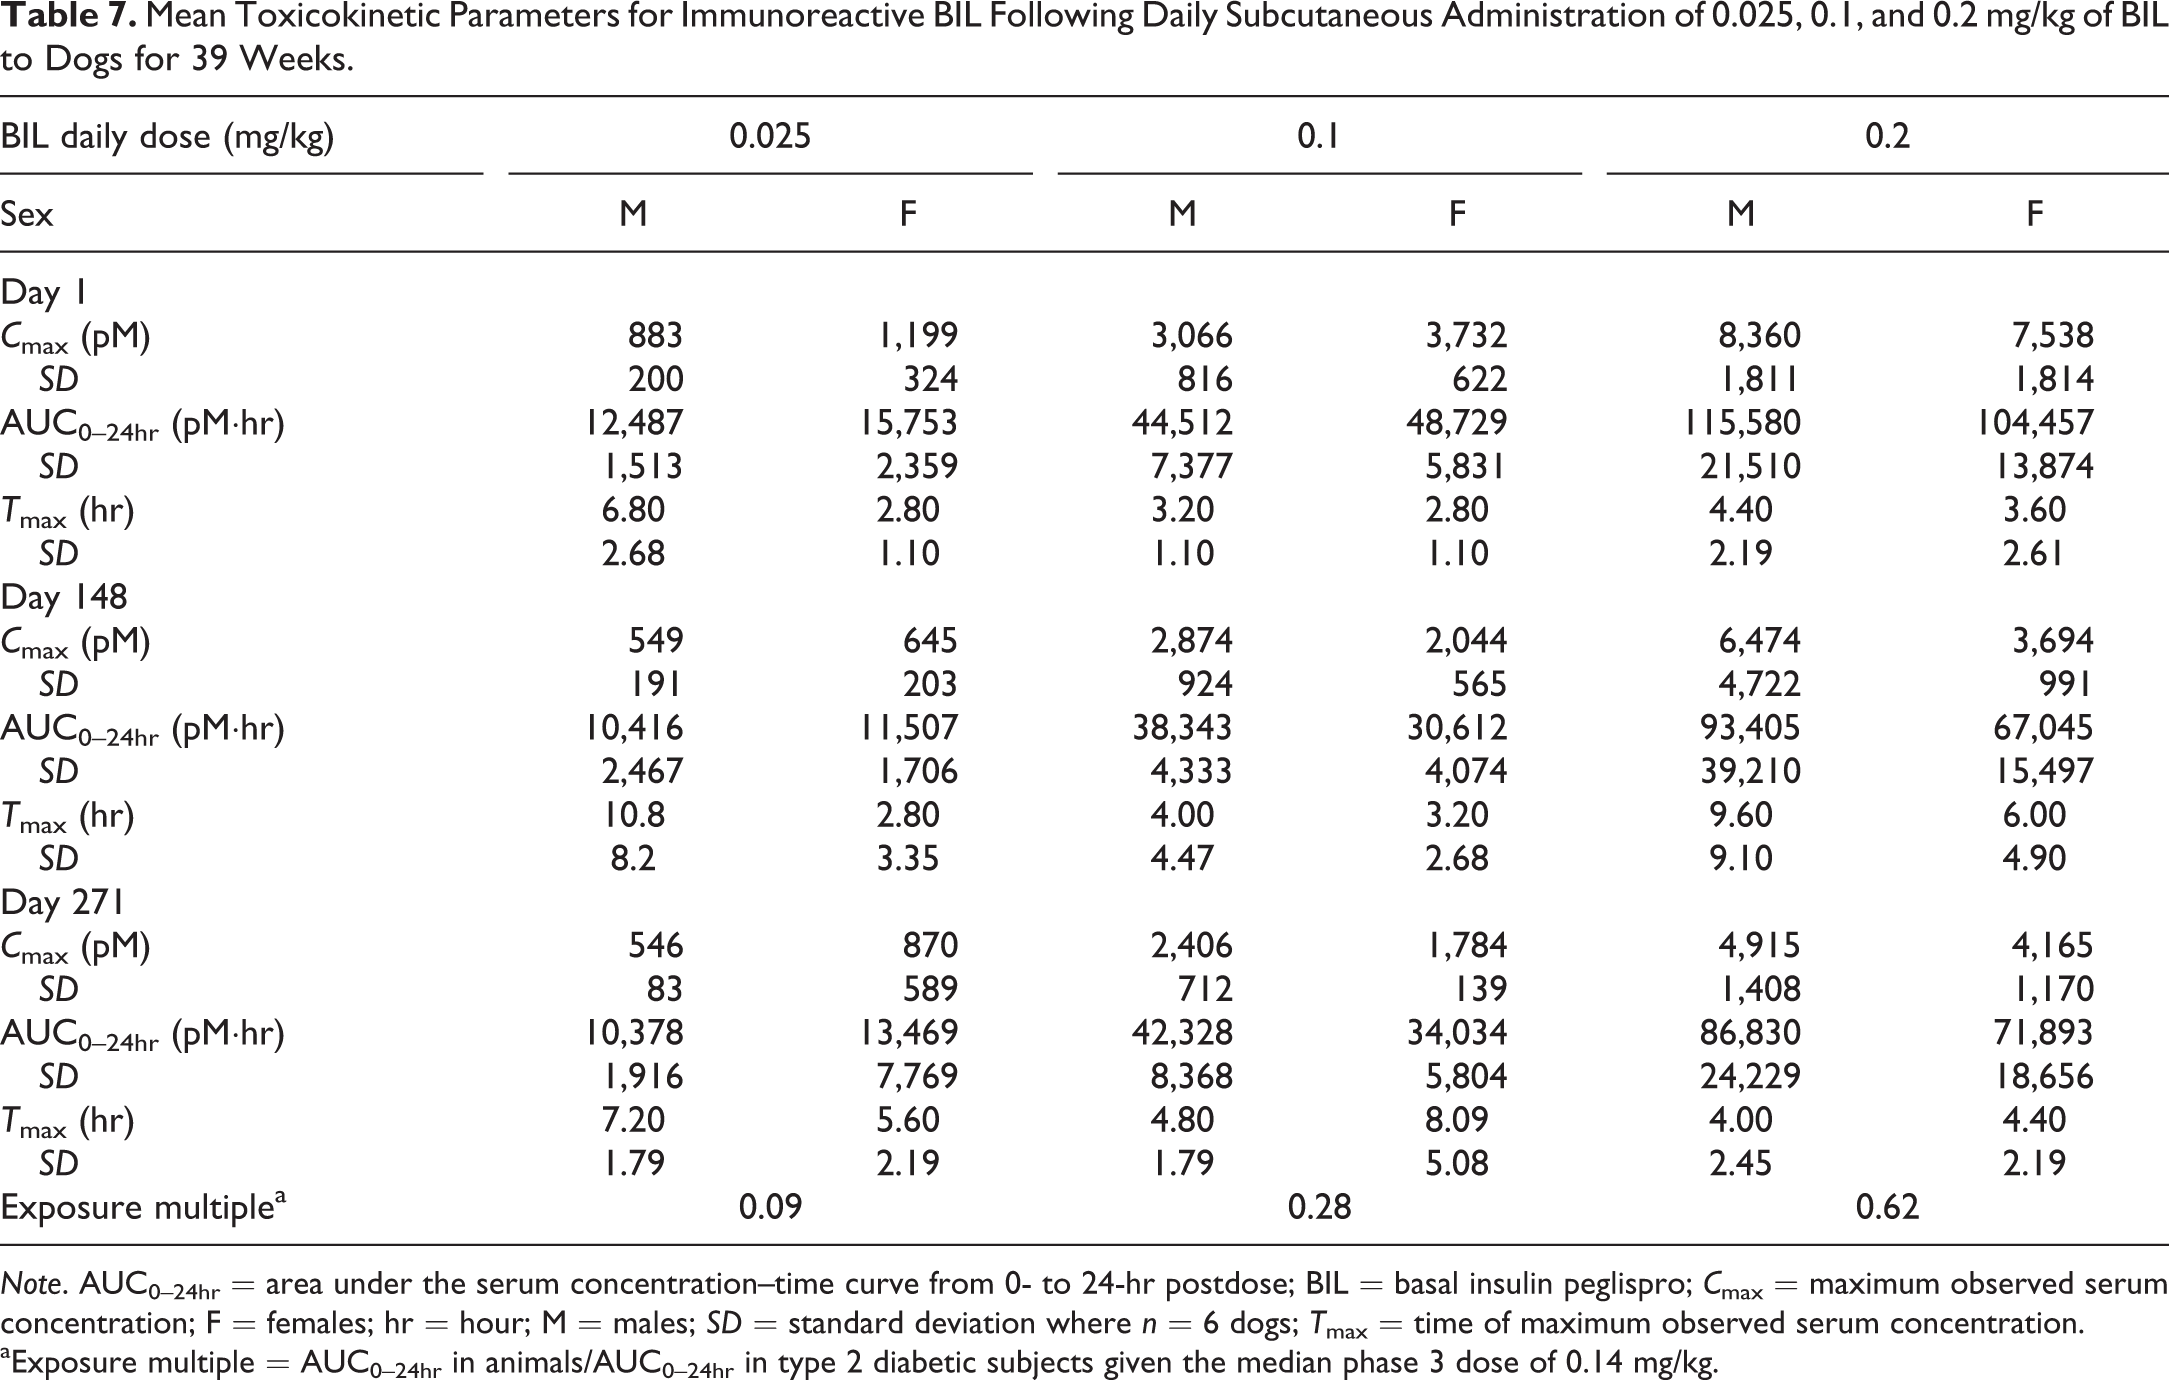
Note. AUC0–24hr = area under the serum concentration–time curve from 0- to 24-hr postdose; BIL = basal insulin peglispro; C max = maximum observed serum concentration; F = females; hr = hour; M = males; SD = standard deviation where n = 6 dogs; T max = time of maximum observed serum concentration.
aExposure multiple = AUC0–24hr in animals/AUC0–24hr in type 2 diabetic subjects given the median phase 3 dose of 0.14 mg/kg.
Glucodynamics and clinical pathology
BIL administration resulted in minimally to moderately decreased mean serum glucose concentrations for animals given 0.1 or 0.2 mg/kg (Figures 5 and 6). As expected, the decreases in mean serum glucose concentration showed a dose-related pattern. The decreases in glucose concentration for animals given BIL at 0.1 or 0.2 mg/kg usually occurred 2-hr postdose and persisted through 16-hr postdose for animals given 0.2 mg/kg. Beginning on day 14 of the dosing phase and continuing to the end of dosing, the predose serum glucose concentration and 24-hr postdose serum glucose concentration were mildly (e.g., 10 to 20%) decreased in animals given 0.2-mg/kg BIL compared to the glucose concentrations for concurrent controls. The nadir for mean serum glucose concentration following BIL administration, regardless of dose, ranged from 2- to 12-hr postdose. The greatest decreases in mean serum glucose concentration for animals given BIL at 0.2 mg/kg were 37% (males) and 44% (females) compared to concurrent controls.
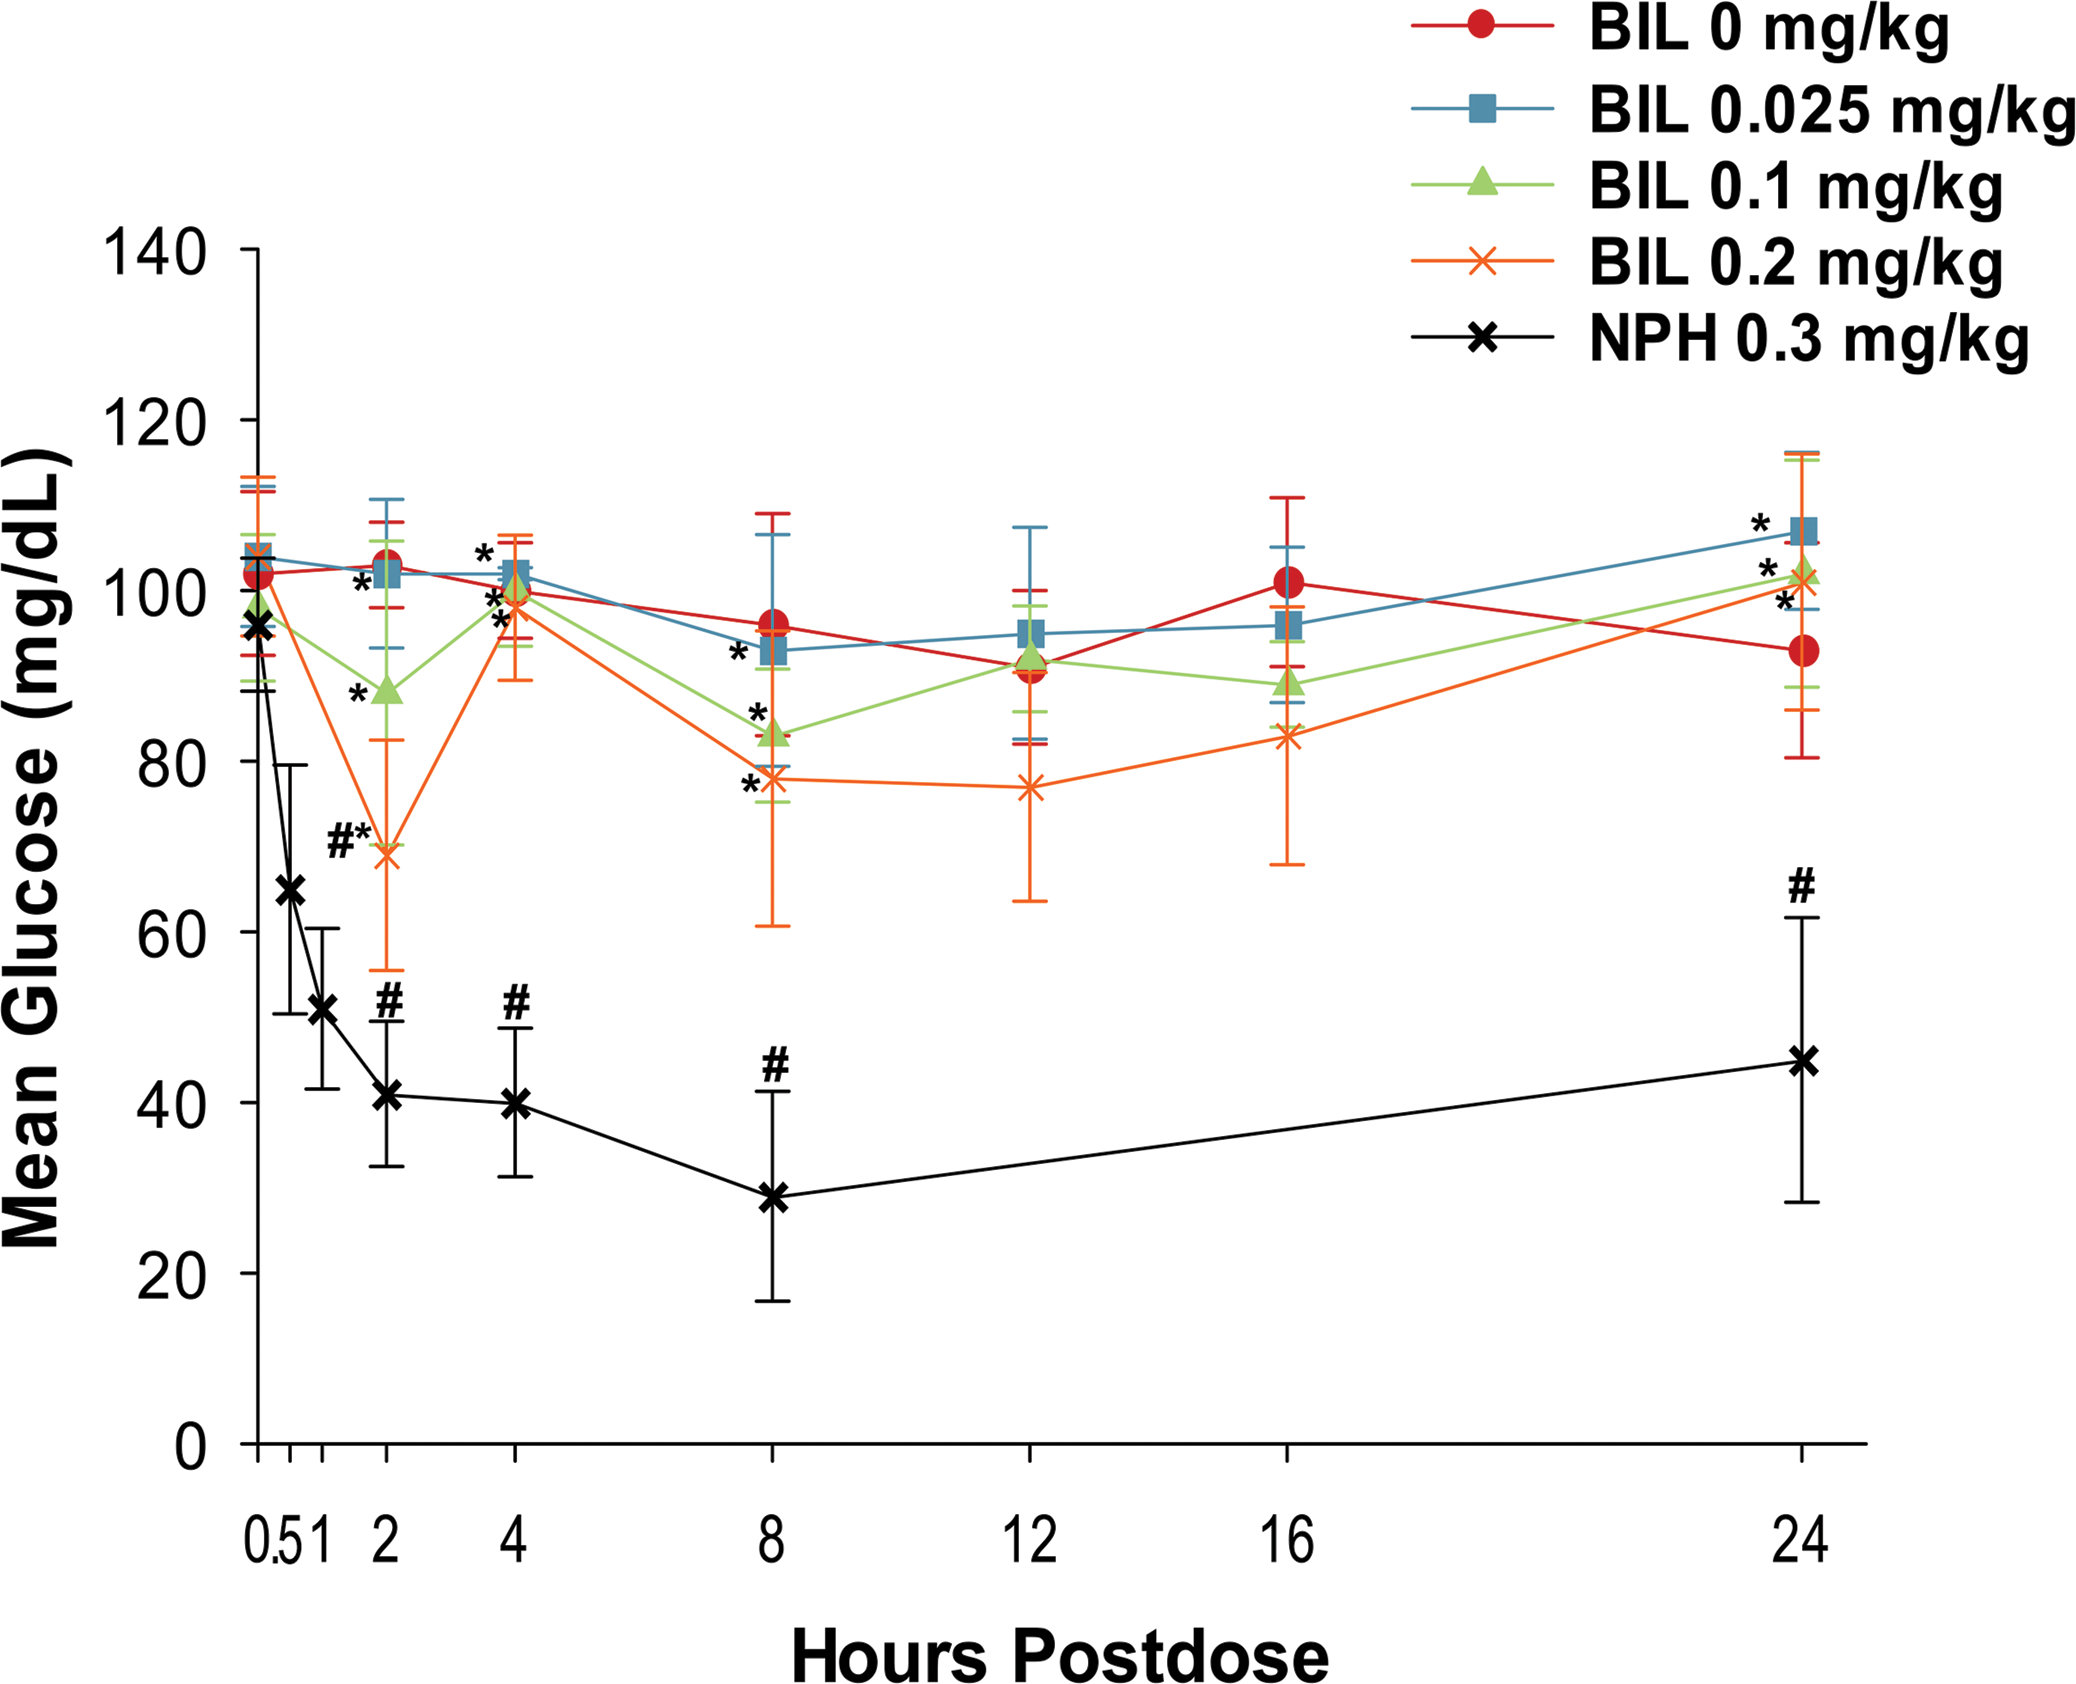
Glucodynamic curves for male dogs given subcutaneous injections of basal insulin peglispro (BIL) or neutral protamine Hagedorn (NPH) insulin on day 1. Data are presented as the mean ± standard deviation. *p ≤.05, BIL versus NPH; #p ≤.05, BIL versus control.
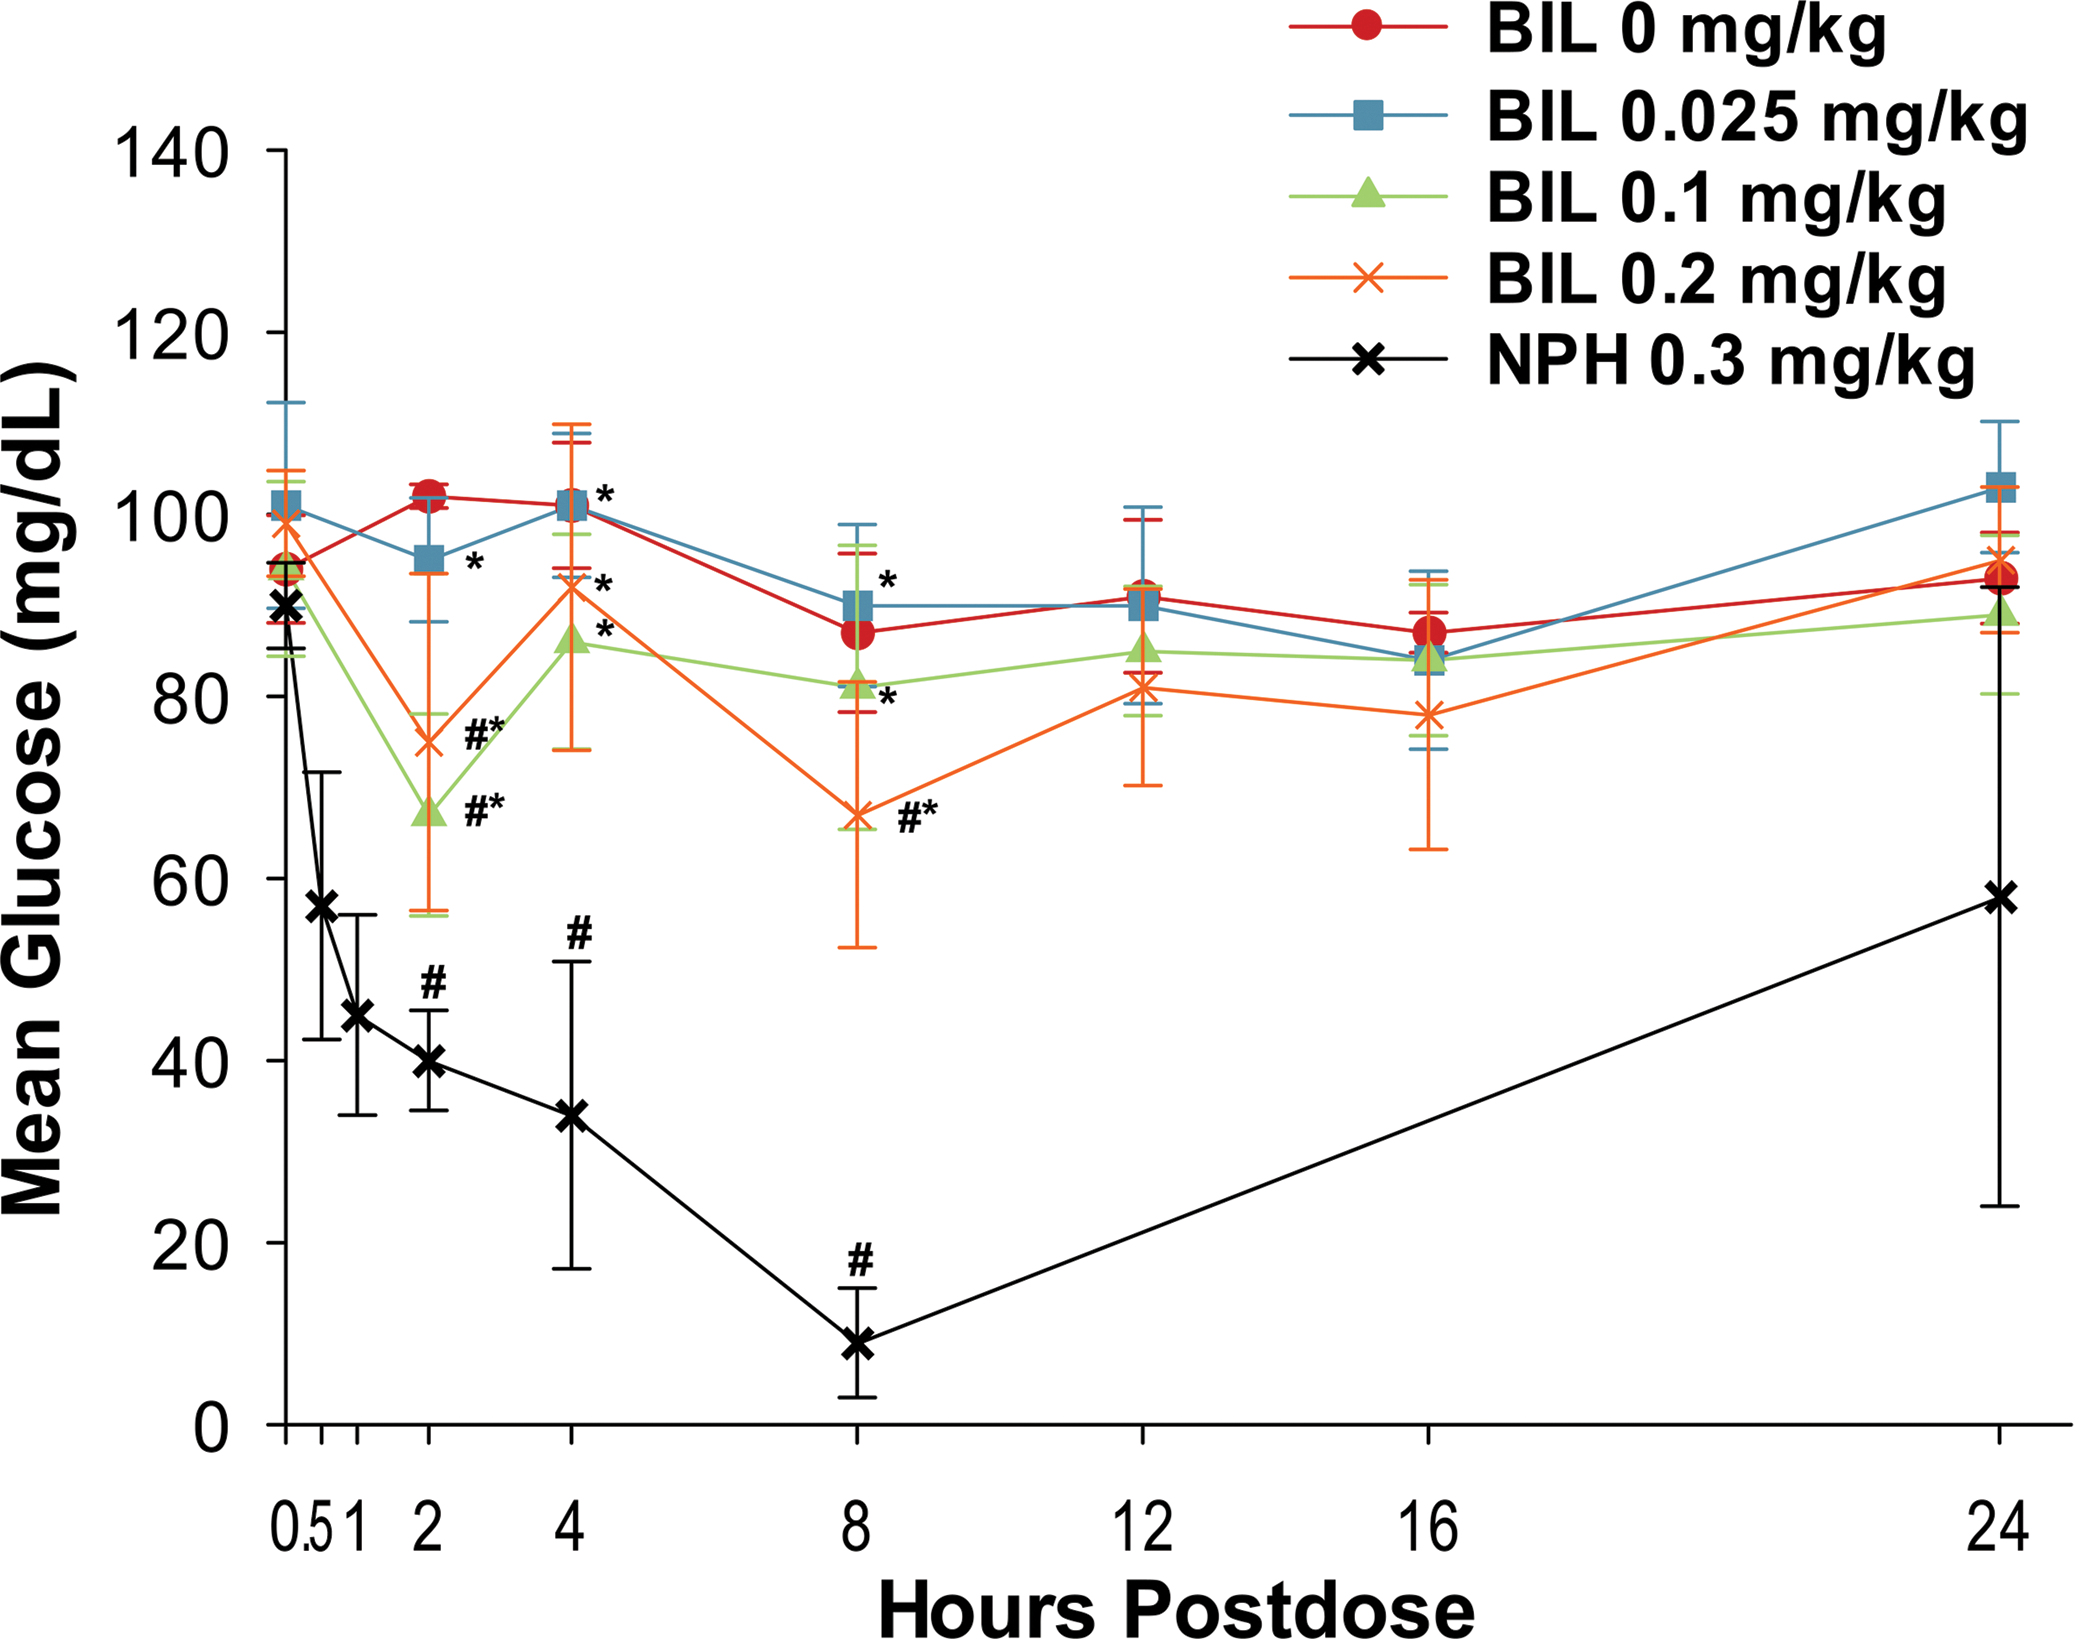
Glucodynamic curves for female dogs given subcutaneous injections of basal insulin peglispro (BIL) or neutral protamine Hagedorn (NPH) insulin on day 1. Data are presented as the mean ± the standard deviation. *p ≤.05, BIL versus NPH; #p ≤.05, BIL versus control.
Administration of NPH insulin resulted in decreased serum glucose concentration. The nadir for mean serum glucose concentration for animals given 0.02- or 0.03-mg/kg NPH insulin typically occurred 2-hr postdose and was lower compared to animals given BIL. The effect of NPH insulin was completely reversed by 8-hr postdose.
No BIL-related effects were observed for hematology, urinalysis, and other clinical chemistry parameters, including no increases in ALT or AST activities. There was no treatment effect of BIL on the pancreatic biomarkers of amylase activity, lipase activity, and trypsinogen-like immunoreactivity.
Morphologic pathology
The increase in absolute adrenal gland weight of female animals in the 0.2-mg/kg BIL and NPH insulin groups was statistically significant compared to the control group. However, no BIL-related correlative adrenal gland morphological abnormalities were observed in micro- and macroscopic evaluations. Terminal body weights and organ weights were within individual and background ranges.
At necropsy, macroscopic thickening of the injection sites was observed for all animals given BIL regardless of dose level. This change was characterized by localized, diffuse thickening of the entire injection site region, which was palpably soft and gelatinous in appearance. Visible from the cut section, the subcutis was expanded in affected areas by homogenous tissue consistent with white fat. Microscopically, sc adipocyte hyperplasia and hypertrophy, often accompanied by fibroplasia/fibrosis, were observed at all injection sites for all dogs given BIL (Figure 7 and Table 8) and the 1 female given NPH insulin that had injection site thickening. In general, the incidence of BIL injection site inflammation or lymphocyte/plasma cell/macrophage infiltrate was not greater than in NPH insulin or control article injection sites (data not shown).
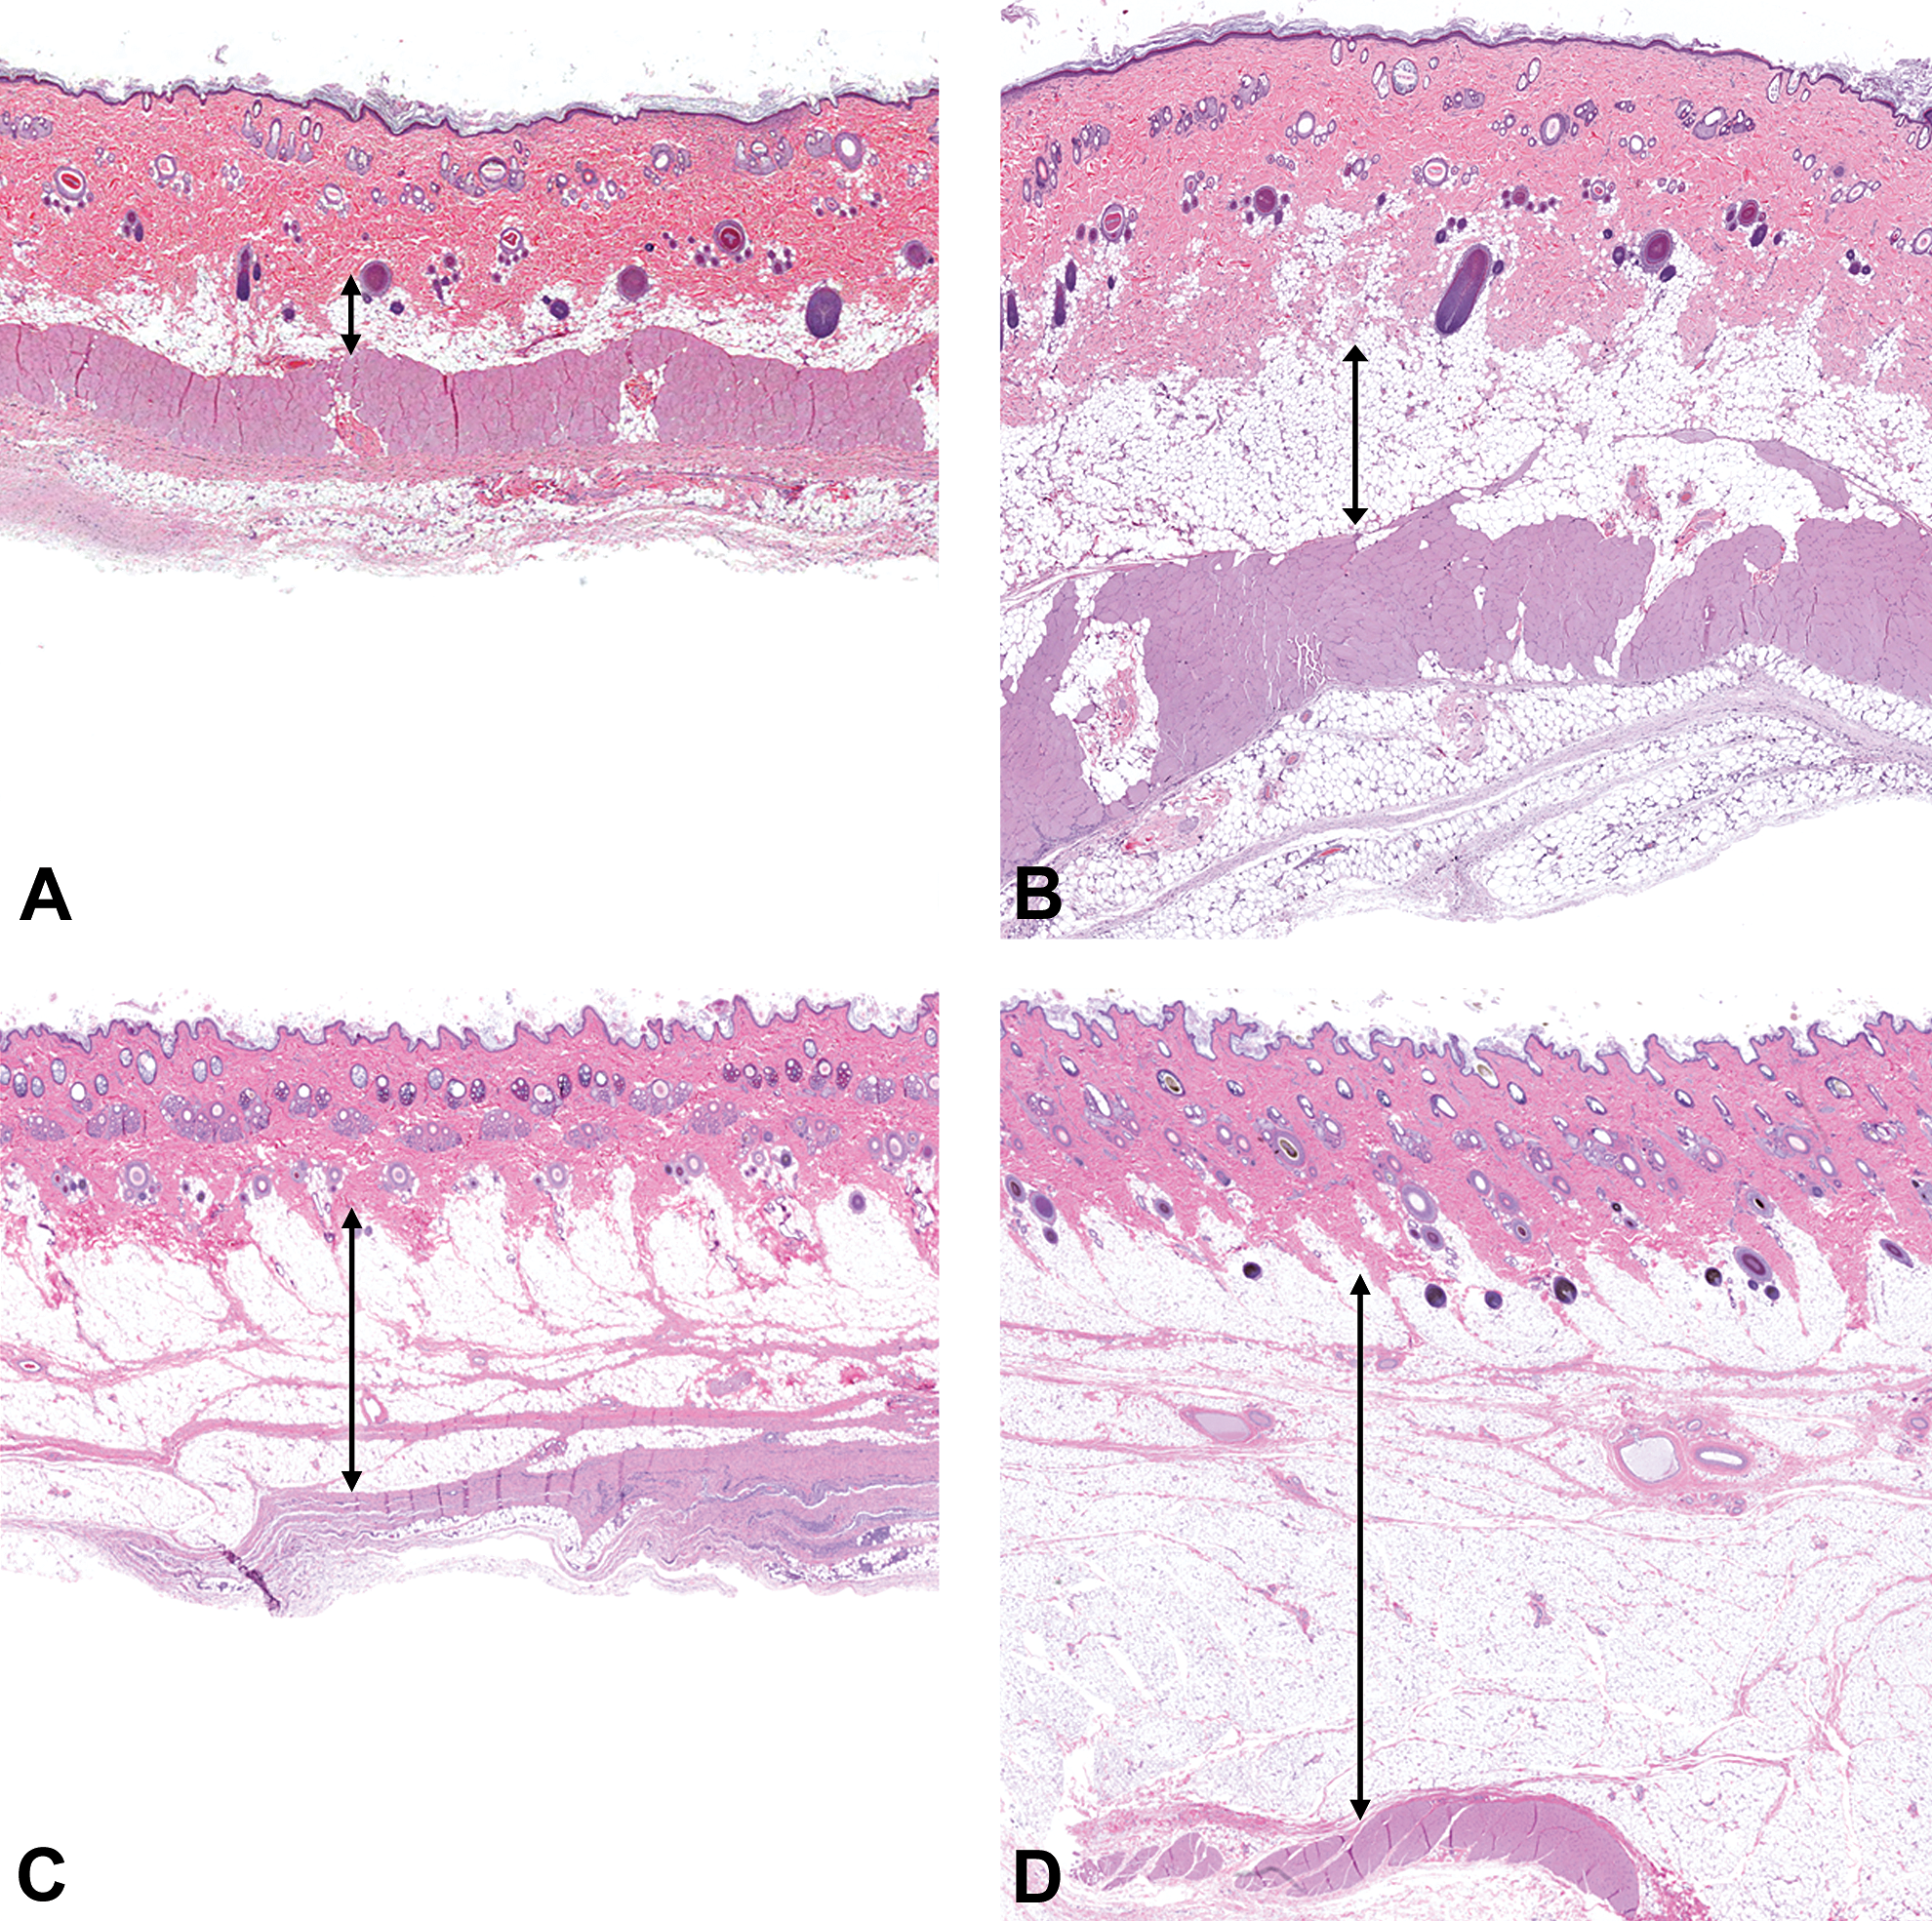
Subcutaneous lipohypertrophy in injection sites in rats (A and B) and dogs (C and D) given neutral protamine Hagedorn (NPH) insulin or basal insulin peglispro (BIL). The subcutis in the rat (B) and in the dog (D) given BIL by subcutaneous injection is expanded compared to the similar region in the rat (A) or dog (C) given NPH insulin by subcutaneous injection. Hematoxylin and eosin–stained sections of skin. Original objective 1×. Double-headed arrows indicate the thickness of the subcutis. The original photomicrographs (acquired on an Aperio AT2, captured at 1× using Aperio ImageScope v12.0.1.5027) were resized and cropped in a manner that maintained the relative dimensions and proportions between image pairs within the figure panel. In some images, the color of the “white space” around the tissue section was adjusted.
Selected Anatomic Pathology and Histopathology Findings in Dogs at 39 Weeks.
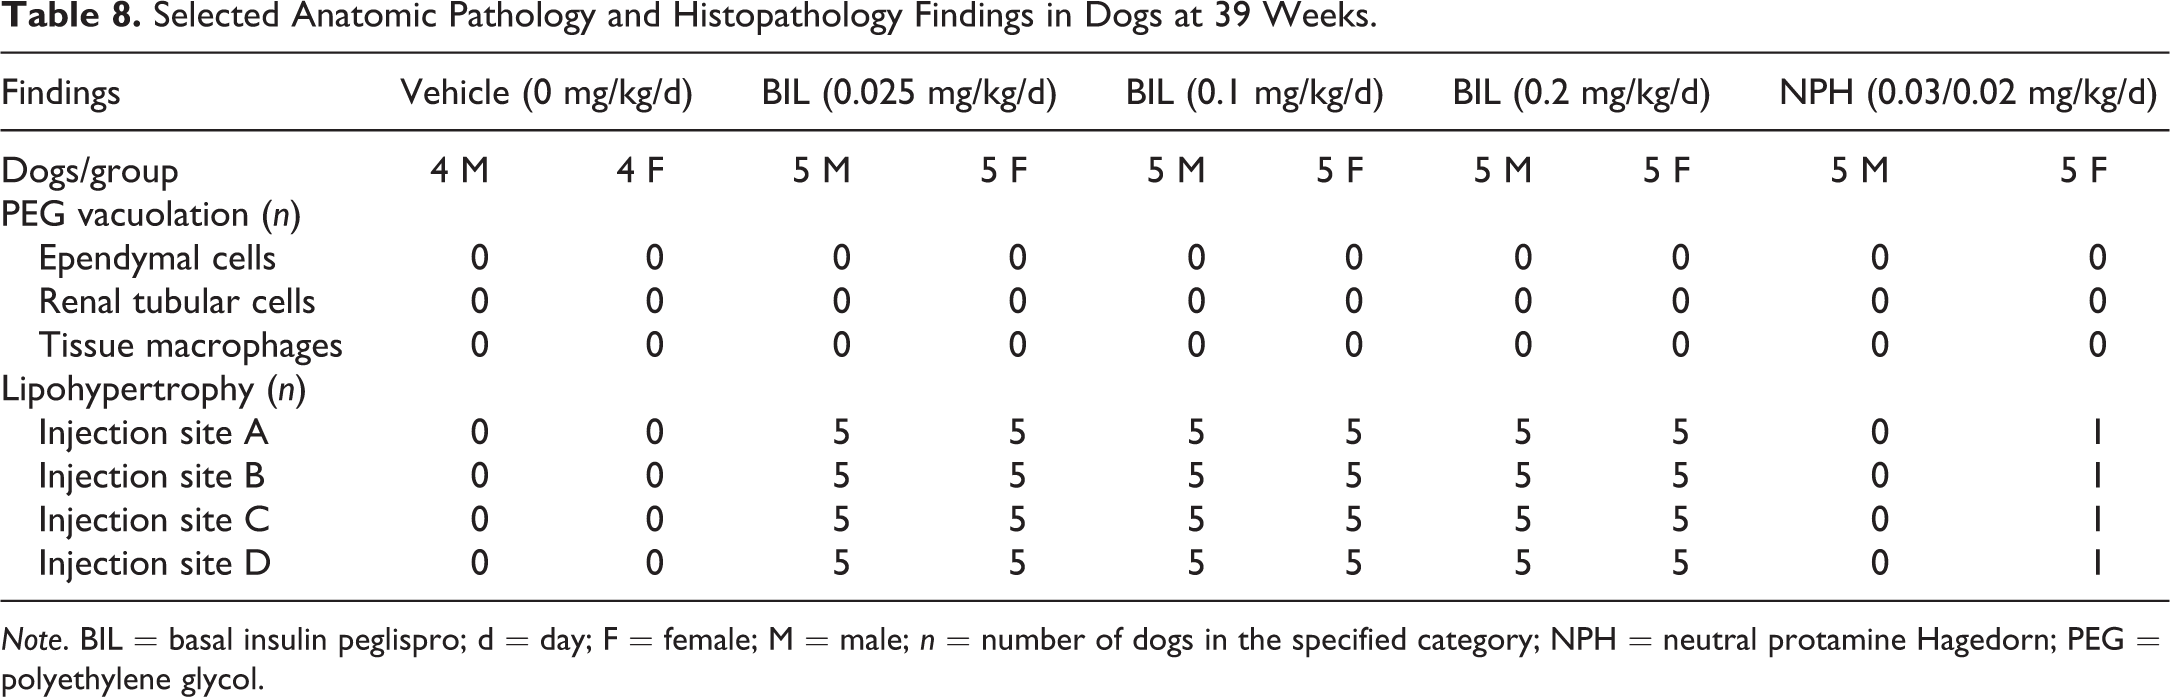
Note. BIL = basal insulin peglispro; d = day; F = female; M = male; n = number of dogs in the specified category; NPH = neutral protamine Hagedorn; PEG = polyethylene glycol.
No BIL-related findings occurred in the other examined tissues. As with the findings for the rat specimens, there was no evidence of increased liver fat at any BIL dose or with NPH for the dog specimens. No PEG-related vacuolation occurred at any BIL dose level in any tissue including ependymal cells of choroid plexus, renal tubular cells, or tissue macrophages (Table 8). No BIL-related hyperplastic or neoplastic tissue changes were observed in any tissue. The remaining tissue findings were considered incidental or background tissue changes.
Discussion
In this set of chronic toxicology studies in which BIL was administered for 9 months (dogs) or 12 months (rats), there was no evidence of vacuolation in any tissues including those tissues frequently associated with PEG-related vacuolation such as tissue macrophages, renal tubular cells, or ependymal cells. The absence of vacuolation in the current studies with BIL contrasts with the findings of 5 marketed PEGylated biotherapeutics intended for chronic administration (Ivens et al. 2015; Turecek et al. 2016). In a review of 12 approved PEGylated biopharmaceuticals, 5 of those products reported PEG-related vacuolation that was typically observed in the phagocytic cells and not accompanied by functional impairments, suggesting that vacuolation may have been an adaptive response (Ivens et al. 2015; Turecek et al. 2016). In addition, vacuolation was generally observed with longer-term studies that ranged from 12 weeks to 52 weeks (Ivens et al. 2015).
The absence of vacuolation associated with BIL is likely due to the lower overall dose of PEG administered and the lower molecular weight of the linear PEG chain used. The administered PEG dose with BIL to rats and dogs was ≤1.35 µmol/kg/month, which is lower than the administered PEG dose for CIMZIA® (≥4.0 µmol/kg/month). The PEG moiety in BIL is a single 20-kDa linear PEG versus a 40-kDa PEG in CIMZIA (certolizumab pegol injection, solution; UCB, Inc. [Smyrna, GA]; FDA 2008). Most of the tissue vacuolation that has been observed with PEGylated molecules has been with those molecules with 40-kDa branched PEG chain (EMA 2012; Rudmann et al. 2013). In addition, the dose-limiting pharmacology of BIL (hypoglycemia) constrained the total PEG dose to relatively low levels. Despite the absence of liver and renal findings, these tissues would most likely have been exposed to PEG as the 20-kDa PEG in BIL was shown to be eliminated about equally in both the feces and urine in rats (Knadler et al. 2015). The current studies lower the level of concern for vacuolation of tissue macrophages, renal tubular cells, and ependymal cells in patients with diabetes taking BIL as a novel basal insulin treatment.
In addition to an absence of tissue vacuolation, there were no BIL-related target-organ toxicities identified and no evidence of hyperplastic or neoplastic changes following chronic administration of BIL. The 12-month rat study is designed to provide an in vivo assessment of carcinogenic potential of insulin analogs (EMEA 2001), and the BIL study included an evaluation of mammary gland proliferation by routine light microscopy and evaluation of cell proliferation measured by Ki-67 labeling. No effects of BIL administration were noted on either histologic evaluation of the mammary gland, and no increase in Ki-67 labeling was detected. The absence of an effect on the mammary gland was consistent with the in vitro pharmacology studies of BIL, which did not suggest mitogenic potential (Owens et al. 2012).
No BIL-related mortality in rats and dogs occurred with BIL administration. No BIL-related body weight changes, food consumption changes, ophthalmic observations, or neurological observations were noted in dogs. However, increased food consumption, a well-recognized counterregulatory response to insulin-induced hypoglycemia in humans and animals (Booth and Brookover 1968; Grossman and Stein 1948; Sanders et al. 2006; Schultes et al. 2003; Smith and Epstein 1969) occurred in rats given BIL, resulting in dose-dependent increases in body weight. Systemic exposure following daily sc doses of BIL generally increased with dose levels.
Expected pharmacologic decreases in serum glucose concentration in dogs given 0.1 or 0.2 mg/kg of BIL occurred, but glucose concentrations did not decrease low enough to cause clinical signs of hypoglycemia; therefore, the hypoglycemia was not considered adverse. As expected, the reference compound, NPH insulin, also caused decreased serum glucose concentration. This finding was an expected pharmacologic effect, was dose related, and was relatively consistent over the entire course of the study. Therefore, the no observed adverse effect level was 0.2 mg/kg under the conditions of this study. At the end of this study, a dose of 0.2 mg/kg corresponded to average (males and females) C max and AUC0–24hr values of 4,540 pM and 79,361.5 pM·hr, respectively. The timing of the nadir for mean serum glucose concentration postdose was variable, regardless of dose level, and was likely due, at least in part, to erratic absorption from the sc injection sites that exhibited adipocyte hyperplasia and hypertrophy often accompanied by fibroplasia/fibrosis.
Other than the expected effect on blood glucose concentration, the only effects in the current studies attributable to BIL administration was increased adipose tissue at the sc injection sites (i.e., lipohypertrophy) of rats and dogs (Figure 7), and it occurred at a higher incidence with BIL than with NPH human insulin. Such findings are consistent with the known lipogenic pharmacological effects inherent in insulin and insulin analogs (Fujikura et al. 2005; Géloën et al. 1989; Roper and Bilous 1998). In the 39-week dog study, BIL produced injection site thickening in all dogs at all doses that had the macro- and microscopic appearance of white fat in all dogs at all doses; 1 animal given NPH insulin was similarly affected. This finding is consistent with a well-recognized cutaneous complication of injectable insulin therapy in patients with diabetes known as lipohypertrophy (Radermecker, Piérard, and Scheen 2007). It is characterized by both benign adipocyte hypertrophy and hyperplasia. Some researchers have reported the clinical incidence of this complication at approximately 50% (Kordonouri et al. 2007) or as high as 86% (Vardar and Kizilci 2007) and have linked the finding to infrequent rotation of injection sites (Kordonouri et al. 2007; Vardar and Kizilci 2007). In vitro assays of lipogenesis have ranked lipogenic potency of regular human insulin and several analogs, including BIL, by quantitating the incorporation of [14C]-glucose into newly synthesized triglycerides. BIL was less potent (Half maximal effective concentration [EC50] = 15.51 nM) than insulin AspB10, human insulin, insulin lispro, and insulin glargine (EC50 = 0.53, 0.61, 0.80, and 4.77 nM, respectively) and more potent than insulin detemir (EC50 = 53.81 nM; Eli Lilly and Company, data on file), suggesting that the higher incidence of lipohypertrophy in rats and dogs injected with BIL is not due to relative differences in lipogenic potency. Because this was a localized pharmacologic response indicative of lipogenic insulin activity, it was not considered to be adverse. BIL has been shown to be mainly absorbed through the lymphatic system in sheep, where the absorption was 88% (Knadler et al. 2016) versus approximately 17% with NPH (Porter and Charman 2001). The slower absorption observed with BIL may contribute to a longer residence time in the sc tissues and may account for the higher incidence of lipohypertrophy observed with BIL sc injection relative to NPH sc injection.
Continued injection of insulin into lipohypertrophic sc tissue has been reported to attenuate insulin absorption from the subcutis leading to poor glycemic control in patients with diabetes (Chowdhury and Escudier 2003; Johansson et al. 2005). Similarly, in the current study, this injection site lipohypertrophy was most likely responsible for the high variability in glucose values and the lower plasma levels of BIL that occurred in dogs on days 148 and 271.
Although the incidence of pituitary adenomas in female rats treated with BIL (43–47% range) was numerically higher than that of the control group (30%), the lack of statistical significance by Peto’s test, a well-accepted statistical approach for assessing the rate of tumors, and the lack of a true dose–responsive pattern in the incidence of this tumor among groups given BIL suggested the numerical differences in the incidence of pituitary adenoma in rats may have occurred by chance. In addition, pituitary adenomas are a common background finding in rats of the age and strain used in our study (Attia 1996; Chandra, Riley, and Johnson 1992; Sandusky et al. 1988). Moreover, at the time of this writing, the authors are not aware of any reports that document development of pituitary adenomas in rats treated with marketed insulin compounds. Although we cannot completely exclude a potential for BIL to increase the incidence of pituitary adenomas in female rats, the lack of statistical significance and dose response suggests it is possible that the numerical difference occurred by chance. Regardless of relationship to BIL treatment, this numerical difference in the background rate of a common tumor in a single sex has limited clinical significance.
In the clinical program for BIL increases in ALT and AST activities were observed (Cusi et al. 2016), and it is notable that in the animal studies described in this report there were no toxicologically important hepatic effects attributable to BIL or NPH including no increases in ALT or AST activities or microscopic findings indicative of hepatocellular injury. Because the mechanism of the hepatic changes in patients administered BIL have not been determined, it was not possible to determine why similar findings did not occur in the animal studies of BIL.
In summary, after chronic administration of BIL (up to 12 months in rats and up to 9 months in dogs), PEG-related vacuolation was not observed in any tissue including the choroid plexus, macrophages in lymphoid organs, or renal tubular epithelial cells. Our results demonstrate that long-term daily sc injection with BIL is not associated with tissue vacuolation attributable to PEG at 4- to 6-fold median clinical exposure in patients with diabetes. In addition, these studies lower the level of concern for vacuolation of tissue macrophages, renal tubular cells, and ependymal cells in patients with diabetes who receive BIL as a novel basal insulin treatment.
Footnotes
Authors’ Note
Richard A. Byrd, Jamie L. Blackbourne, Mary Pat Knadler, Albert E. Schultze, and John L. Vahle are employees of Eli Lilly and Company.
Acknowledgments
The authors would like to thank Eileen Girten of inVentiv Health Clinical and Dan Blaukopf, formerly of inVentiv Health Clinical, for assistance in the preparation of this manuscript. They also thank and acknowledge the expertise of Dr. D. Greg Hall (Eli Lilly and Company) in preparation of the images of the microscopic appearance of the injection sites in rats and dogs given NPH insulin or BIL.
Author Contribution
Authors contributed to conception or design (RBMK, AS, JV); data acquisition, analysis, or interpretation (RB, JB, MK, AS, JV); drafting the manuscript (RB, AS); and critically revising the manuscript (RB, JB, MK, AS, JV). All authors gave final approval and agreed to be accountable for all aspects of work in ensuring that questions relating to the accuracy or integrity of any part of the work are appropriately investigated and resolved.
Declaration of Conflicting Interests
The author(s) declared no potential conflicts of interest with respect to the research, authorship, and/or publication of this article.
Funding
The author(s) disclosed receipt of the following financial support for the research, authorship, and/or publication of this article: This work was supported by Eli Lilly and Company.