
Abstract
Conjugation of therapeutic proteins with high molecular weight polyethylene glycols (HMW PEGs) is used to extend the half-life of biologics. To evaluate the effects of HMW PEGs in animals, we used an immunohistochemical procedure to study the tissue distribution and toxicity of unconjugated HMW PEGs in rats given 100 mg/kg 10KPEG, 20KPEG, or 40KPEG intravenously. Both the PEG cellular distribution and the histology were different between groups. In 10KPEG and 20KPEG groups, PEG immunoreactivity was most prominent in the renal tubule epithelium and in alveolar macrophages and hepatic Kupffer cells and cellular vacuolation was absent. In contrast, rats given 40KPEG had strong PEG immunoreactivity in splenic subcapsular red pulp macrophages, renal interstitial macrophages, and choroid plexus epithelial cells that was frequently associated with cytoplasmic vacuolation. While the vacuolation appeared to be an adaptive response, there was focal renal tubular epithelial degeneration associated with strong PEG immunoreactivity in one rat given 40KPEG. These data indicate that both the tissue distribution and the vacuolation observed with unconjugated HMW PEGs are markedly influenced by the molecular weight of the PEG and that when vacuolation is observed it is likely an adaptive change that is associated with PEG cytoplasmic immunoreactivity.
Introduction
PEGylation using high molecular weight polyethylene glycols (HMW PEGs ≥ 10 kDa) is an important tactic employed to increase half-life, reduce renal clearance, and potentially decrease the immunogenicity of therapeutic proteins (Harris and Chess 2003; Webster et al. 2009). HMW PEGs are also considered promising carriers due to their presumed low potential for toxicity based on preclinical and clinical data available for oral and intravenous (IV) delivery of low molecular weight (LMW) PEGs (<10 kDa; Webster et al. 2009). Namely, toxicity is only observed with the delivery of high IV doses of LMW PEGs and is limited to the kidney (Webster et al. 2009).
The renal toxicity observed with LMW PEGs is likely the result of high local tissue concentrations of PEG because while some intracellular enzymatic metabolism of LMW PEGs occurs, the primary clearance mechanism for PEG is renal excretion of the intact molecule (Webster et al. 2009). Higher molecular weight PEGs that are methoxy-capped also are highly metabolically inert chemicals. Assuming PEG size does not exclude it from glomerular filtration, HMW PEGs would be expected to be excreted in the kidney intact (Harris and Chess 2003; Webster et al. 2009). There is little published information on the distribution of PEGs that cannot efficiently pass the glomerular filtration barrier (Elliott et al. 2012).
Several biologics conjugated to HMW PEGs are now approved for use in a variety of diseases (Harris and Chess 2003; Webster et al. 2009). While less is known about the potential safety risks associated with chronic use of HMW PEGs, there are reports of increased vacuolation in tissues from animals administered PEGylated proteins (BLA #125160 2006; Bendele et al. 1998; Young et al. 2007; Webster et al. 2009) and clinical reports of anti-PEG antibodies that reduce the effectiveness of treatment (Armstrong et al. 2007). For Cimzia (CDP870) and PEGylated tumor necrosis factor binding protein (TNFbp), 40KPEG and 20KPEG, respectively, were used as the carriers (BLA #125160 2006; Bendele et al. 1998). Cynomolgus monkeys given 100 or 400 mg/kg IV of the 40KPEG CDP870 for 4, 13, or 26 weeks had increased spleen and/or liver weights and foamy (vacuolated) macrophages in numerous tissues including regional lymph nodes, thymus, spleen, adrenal gland, uterus, and cervix, and in the choroid plexus epithelial cells within the ventricles of the brain. In these studies, this vacuolation in epithelial cells and/or macrophages was presumed to be related to intracytoplasmic PEG accumulation. For 20KPEG TNFbp, rats and cynomolgus monkeys given 10 to 40 mg/kg IV for up to 3 months had vacuolation in renal tubular epithelial cells. For the 20KPEG TNFbp studies, the histologic severity score and reversibility of renal epithelial vacuolation was dose related and associated with immunohistochemical (IHC) localization of the TNFbp moiety itself (Bendele et al. 1998). At the end of recovery phases, renal epithelial vacuoles remained but were negative for TNFbp by IHC suggesting these vacuoles may be associated with cellular HMW PEG. Yet, in these studies, the presence of PEG in the vacuolated renal epithelial cells was not directly measured. Additionally, the investigators demonstrated that vacuolation did not occur in rats dosed with 40 mg/kg of an unconjugated 20KPEG vinyl sulfone, PEG diol, or ethylene glycol suggesting that conjugation to TNFbp was required for the observed histologic changes (Bendele et al. 1998). Unfortunately, the investigators did not examine potential differences in the pharmacokinetics and tissue distribution of the unconjugated 20KPEG vinyl sulfone, PEG diol, or ethylene glycol versus 20KPEG TNFbp as an alternative explanation for this observation.
There are few studies examining the impact of modifying the molecular weight of HMW PEG on animal toxicity (Bendele et al. 1998; Gursahani et al. 2009; Webster et al. 2009; Yamaoke et al. 1994). As the dose and/or size of the PEG used for conjugation is increased, renal clearance saturates based on a glomerular filtration barrier for PEGs of approximately 30 kD (Harris and Chess 2003). Presumably as a consequence of this barrier function of the glomerulus, TNFbp conjugated to a larger PEG (50KPEG) produced less severe renal tubular vacuolation than TNFbp conjugated to 20KPEG (Bendele et al. 1998). Therefore, one would predict that the PEG tissue distribution and toxicologic profile would be dependent on the size of the HMW PEG used as the proteins carrier. As demonstrated by the PEGylated TNFbp work, it also appears that the distribution of a HMW PEGylated proteins may be altered by the affinity of the proteins for specific cell populations (Bendele et al. 1998; Webster et al. 2009).
Despite current data suggesting that the potential inherent toxicity of HMW PEGs is low, it is possible that with chronic dosing continued uptake and the accumulation of HMW PEG within a cell or tissue will have untoward effects on function. For 20KPEG TNFbp, despite prominent vacuolation and distortion of renal epithelial cells, there were no effects on epithelial cell integrity as assessed by histology or renal function as measured by urinary N-acetyl-β-(D)-glucosaminidase (NAG) and serum blood urea nitrogen (BUN) and creatinine concentrations (Bendele et al. 1998). In studies conducted to support the development of Cimzia, despite vacuolation of several cell types, there was only modest suppression of in vitro macrophage phagocytic activities (EMEA/664021/2009 2009). Taken together, this suggests that cytoplasmic vacuolation of the various cell types may be an adaptive response to an increased demand for PEG clearance rather than a toxicologic response due to effects of PEG on cellular physiology.
Vacuolation of various cell types has been attributed to accumulation of HMW PEGs in the affected cells; however, to our knowledge, there are no published studies demonstrating PEG within the cytoplasm of vacuolated cells. Localizing PEG with cellular resolution is important for examining the potential relationship of PEG and the histologic changes observed with biologics conjugated to HMW PEGs. Unfortunately, while there are nuclear magnetic resonance spectroscopy and gel electrophoresis methods as well as enzyme-linked immunosorbent assay techniques for assessing PEG in tissues or fluids, an analysis of the effects of different HMW PEGs on cellular PEG distribution and PEG-related toxicologic findings has not been done, likely because a PEG IHC technique was unavailable (Cheng et al. 2012; Elliott et al. 2012; Tsai, Cheng, and Roffler 2001; Webster et al. 2009). Recently, anti-PEG antibodies have been developed by several groups and their potential utility as IHC reagents demonstrated in published pharmacology studies (Hu et al. 2011; Menkhorst et al. 2009; White et al. 2007). These antibodies were developed to bind either the PEG molecule itself, the backbone linker of the PEG, or the terminal PEG methoxy group (Cheng et al. 2012; Webster et al. 2009). The development of a PEG IHC procedure would have multiple advantages for toxicology studies. First, the procedure would have diagnostic value for determining whether histologic changes observed in cells and tissues are related or not to PEG. Second since PEG is an exogenous material, the same antibody would likely be useful for the study of PEG effects across multiple preclinical species and man.
With this in mind, we developed an IHC procedure to detect PEG in formalin-fixed paraffin-embedded tissues and then studied the effect of varying the molecular weight of unconjugated HMW PEG (10KPEG, 20KPEG, and 40KPEG) on PEG cellular distribution and PEG-related histologic changes in rats dosed intravenously for 3 months. We used IHC to evaluate whether observed histologic changes were associated with PEG immunoreactivity. We hypothesized that the pattern of PEG tissue and cellular distribution and PEG-related vacuolation would be different for rats given 10KPEG, 20KPEG, or 40KPEG, and that any cellular vacuolation observed would be associated with PEG immunoreactivity.
Method
Anti-PEG Antibody IHC Validation Studies
Validation IHC studies were conducted with archived blocks of brain including choroid plexus from rats or cynomolgus monkeys dosed with an 80KPEGylated peptide or vehicle (phosphate buffered saline [PBS]) for 3 months. These blocks had been stored at room temperature and were from animals with histologically confirmed choroid plexus vacuolation. For each IHC experiment, negative tissue controls included sections without choroid plexus vacuolation from vehicle-dosed rats or monkeys as well as sections from 80KPEGylated peptide-dosed animals where the anti-PEG antibody was replaced by an isotype-matched immunoglobulin G (IgG) control antibody (see below). Positive tissue controls included archived blocks of spleen and kidney from rats treated with unconjugated 40KPEG (IV, 10 mg/kg, and 4 days of dosing).
The Leica BOND Refine system was used for all IHC procedures (Table 1). Five micron tissue sections were deparaffinized and rehydrated and for each IHC procedure blocking was done to eliminate nonspecific binding due to endogenous peroxide, avidin/biotin, and proteins. The primary antibody used was a rabbit monoclonal for PEG (Epitomics, PEG-B-47) at 5 µg/ml. The extent of binding of the antibody is not affected by size of the PEG per the manufacturer and our own internal data (data not shown). The secondary was a link antibody used per manufacturer recommendation (BOND Refine Kit, Leica, DS9800) and labeling was done with a polymer-horseradish peroxidase (HRP). Incubation periods for the primary, secondary polymer-HRP were 15 and 8 min, respectively. 3,3-diaminobenzidine was the chromagen (10 min) and hematoxylin was the counterstain. Isotype-matched immunoglobulin (rabbit IgG) matched by concentration was used in place of the primary for all negative controls.
Conditions for PEG immunohistochemistry.a
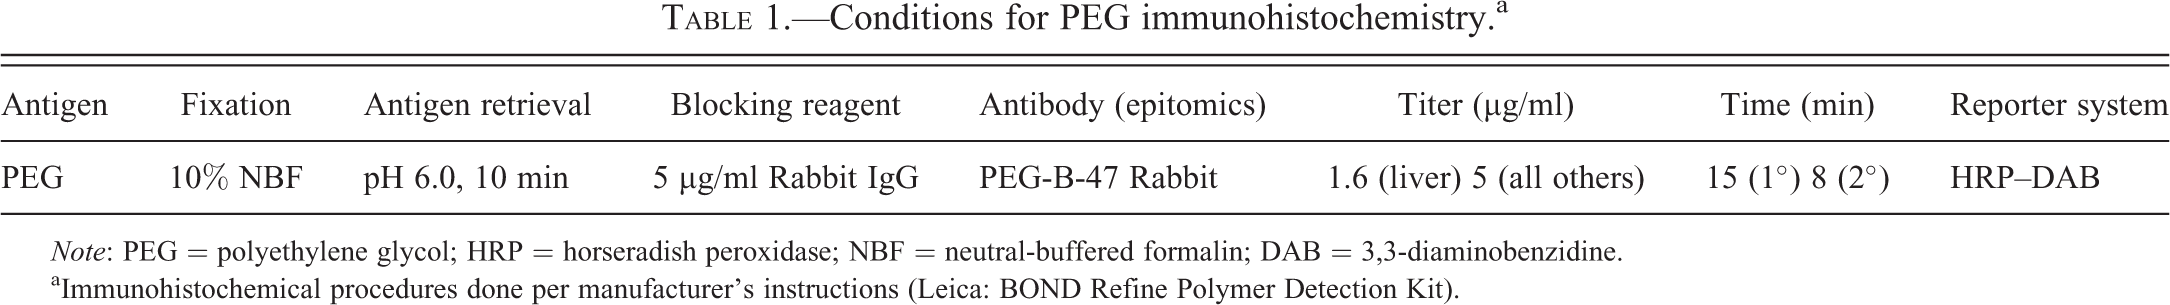
Note: PEG = polyethylene glycol; HRP = horseradish peroxidase; NBF = neutral-buffered formalin; DAB = 3,3-diaminobenzidine.
aImmunohistochemical procedures done per manufacturer’s instructions (Leica: BOND Refine Polymer Detection Kit).
In-life Procedures and Necropsy for 3 Months HMW PEG Study
All procedures were in compliance with the United States Department of Agriculture’s Animal Welfare Act (9 Code of Federal Regulations Parts 1, 2, and 3); the Guide for the Care and Use of Laboratory Animals: Eighth edition (Institute for Laboratory Animal Research, The National Academies Press, Washington, DC, 2010); and the National Institutes of Health, Office of Laboratory Animal Welfare. Whenever possible, procedures in this study were designed to avoid or minimize discomfort, distress, and pain to animals.
Seven to nine weeks old male Sprague-Dawley (SD) CD/IGS rats (5/group) were administered 100 mg/kg of linear 10 kD (10KPEG), 20 kD (20KPEG), or 40 kD (40KPEG) α-aminopropyl-ω-methoxy, polyoxyethylene (NOF Corp, Tokyo) in pH 7.0 PBS by IV injection (2 ml /kg) for 3 months. The 100 mg/kg dose approximated the high dose used in previous toxicology studies based on the literature (Bendele et al. 1998; BLA #125160 2006; Webster et al. 2009) and our own internal experience (unpublished data) with PEGylated biologics. To adjust for molecular weight of the administered PEG, 10KPEG, 20KPEG, and 40KPEG were administered once daily, every other day, and twice weekly, respectively. Because PEG is not normally present in animals and the PEG was not conjugated to a protein, a saline only group was not considered necessary to examine the differences in PEG distribution. Therefore, for comparisons of tissue and plasma changes from PEG-treated animals, control reference ranges and tissues from previous SD rat studies were used as a comparator.
Clinical observations were recorded daily before dosing, approximately 15 min post dose, and in the afternoon. On nondosing days, twice daily observations were recorded. Animals were weighed on day 3, pre-dose on day 1, and then twice weekly. Feeder weights were recorded the same day body weights were collected beginning with day 1. Blood was collected in potassium (K3) ethylenediaminetetraacetic acid tubes from all animals at their scheduled necropsy, processed to plasma, and analyzed for plasma BUN and creatinine concentrations.
Each rat had a complete gross necropsy on the Monday after the last dose. At a minimum, brain, heart, kidney, liver, lung, and spleen were collected from all animals. These tissues were fixed by immersion in 10% neutral buffered formalin and then processed using standard techniques to paraffin blocks for microtomy. For the brain, trimming was done such that anatomical sites evaluated histologically included the frontal cortex, striatum, hippocampus, thalamus/hypothalamus, cerebellum, and medulla oblongata.
Immunohistochemistry and Morphometry
All tissues were cut at 5 µm, slide-mounted, and immunostained for PEG using the procedures described earlier (Table 1). A board-certified veterinary pathologist (American College of Veterinary Pathologists or ACVP) first evaluated qualitatively all stained sections. Based on this evaluation, patterns of PEG immunoreactivity were assessed for the brain, lung, kidney, and spleen using morphometry (described subsequently) and for the liver and heart by scoring the PEG immunoreactivity using the following scale: 0, no labeled cells; 1+, light stain and/or occasional cells (minimal); 2+, light–medium stain and/or small numbers of cells/types of cells (mild); 3+, moderate stain and/or medium numbers of cells/types of cells (moderate); and 4+, dark stain and/or large numbers of cells/types of cells (marked).
For the brain, lung, kidney, and spleen, slides were digitally scanned and PEG immunoreactivity was measured using morphometric techniques. Briefly, the slides were scanned on a whole slide imaging system at a 20× magnification setting (Aperio XT). The kidney and spleen were scanned on the same slide. Using the “Pen Tool” and “Negative Pen Tool” within Aperio’s ImageScope software, regions were manually outlined on each slide to specify the tissue regions to be analyzed. Based on the qualitative review done by the pathologists, the choroid plexus was outlined for the brain, the renal cortex for the kidney, and the whole tissue for the lung and spleen. For all tissues, the pathologist reviewed the tissue and excluded tissue areas known to be problematic for the image analysis (e.g., folds that trap particulate or stain precipitate in an image may be counted as brown by the algorithm). Aperio’s Positive Pixel count was used to analyze the brain, kidney, and spleen tissues. The default parameters were used for the algorithm. The “Positive Pixel v9” algorithm classifies pixels into one of three categories: clear (background), negative, or positive, with positive further subclassified into 3 levels of intensity (weak, 1+; medium, 2+; or strong, 3+). The percentage of pixels in each of the positive intensity categories was reported (e.g., % strong, % medium, % weak positive pixels vs. total pixels).
Aperio’s IHC Nuclear algorithm was used to count PEG immunoreactive cells in the lung. The algorithm’s size, shape, intensity ranges, and colors were tuned for the lung. The algorithm selects staining color using the color deconvolution algorithm (Ruifrok and Johnston 2001). The “IHC Nuclear” algorithm finds round shapes and identifies them as 0+/1+ (weak)/2+ (medium)/3+ (strong). The reported data were presented as the number of 1+, 2+, and 3+ cells per mm2.
Histology
An ACVP board–certified pathologist examined hematoxylin and eosin–stained 4-µm tissue sections immediately adjacent to sections immunolabeled for PEG. Tissues were examined for histologic findings using standard descriptive morphologic terminology and the following semiquantitative scale for severity of the change: 1, minimal; 2, slight; 3, moderate; 4, marked; and 5, severe.
Statistics
For clinical pathology (BUN and creatinine) and morphometric data, a Tukey-Kramer Honestly Significant Difference test was used to perform the group mean comparisons between the 10KPEG, 20KPEG, and 40KPEG groups. Significance was indicated when p ≤ 0.05.
Results
Clinical Findings in Rats Administered Different Molecular Weight PEGs for 3 Months
All animals survived to study termination. There were only procedure-related changes (tail scabs and abrasions at IV injection sites) and observations commonly observed (haircoat changes) in rats on study. These did not differ across groups and were not considered to represent treatment-related changes. Body weight gain and food consumption changes were also not different between groups and were consistent with growth curves for this age SD rat. There were no differences in mean plasma BUN and creatinine between different groups and relative to reference ranges for SD rats (Table 2).
Plasma blood urea nitrogen (BUN) and creatinine in rats treated with 100 mg/kg IV 10KPEG, 20KPEG, or 40KPEG for 3 months.
aClinical chemistry reference ranges for male SD rats > 72 days of age (reference ranges derived from SD rat animal data, Covance Inc., Greenfield, IN).
Optimization of PEG Immunohistochemistry Method
The optimized protocol for PEG IHC is summarized in Table 1 and described in the methods. Kidney and spleen from rats given unconjugated 40KPEG, serving as positive controls, had staining of renal tubular epithelial cells and splenic red pulp macrophages (Figure 1). Also, the cytoplasm of vacuolated choroid plexus epithelial cells from 80KPEGylated treated cynomolgus monkeys and rats were strongly immunoreactive for PEG, while choroid plexi from vehicle-treated cynomolgus monkeys or rats were negative (Figure 2). There was no immunoreactivity using the isotype-matched IgG antibody applied at comparable concentrations to the choroid plexus of 80KPEGylated peptide (data not shown) or vehicle-treated rats or monkeys (Figure 2).
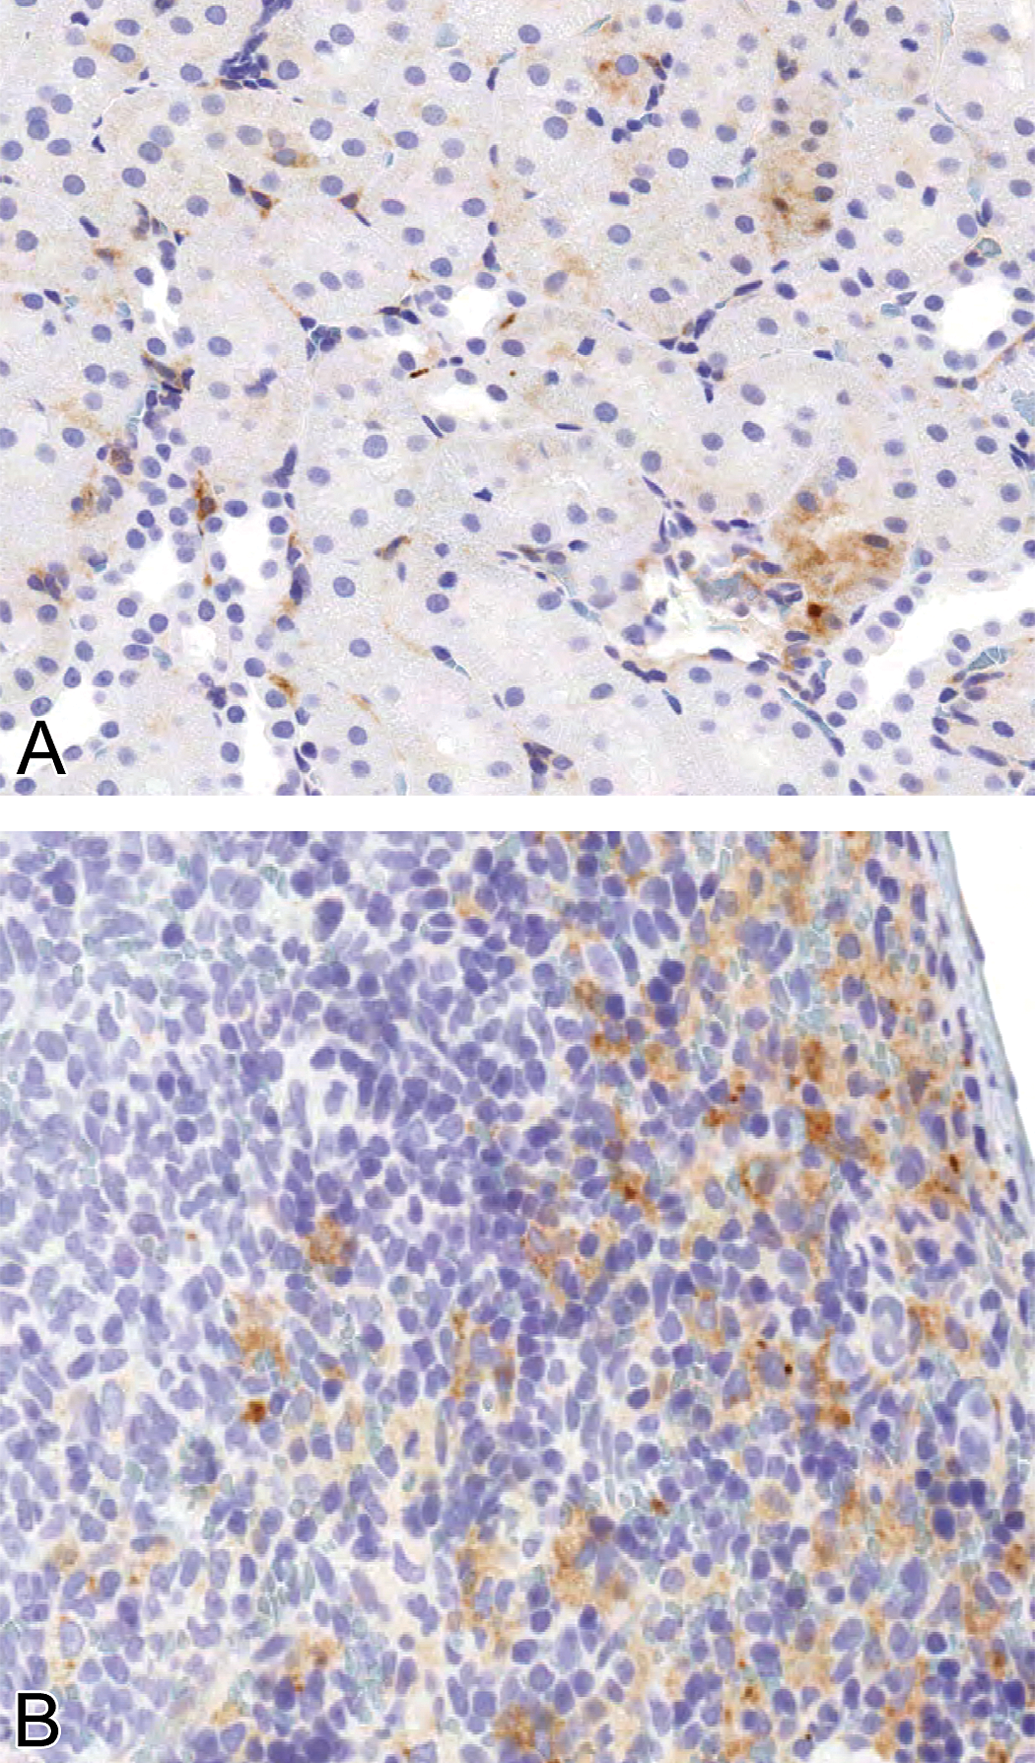
PEG immunoreactivity in cytoplasm of renal cortical tubule epithelial cells and splenic red pulp macrophages kidney and spleen from rats dosed with 40KPEG IV for 4 days. Magnification = 200×.
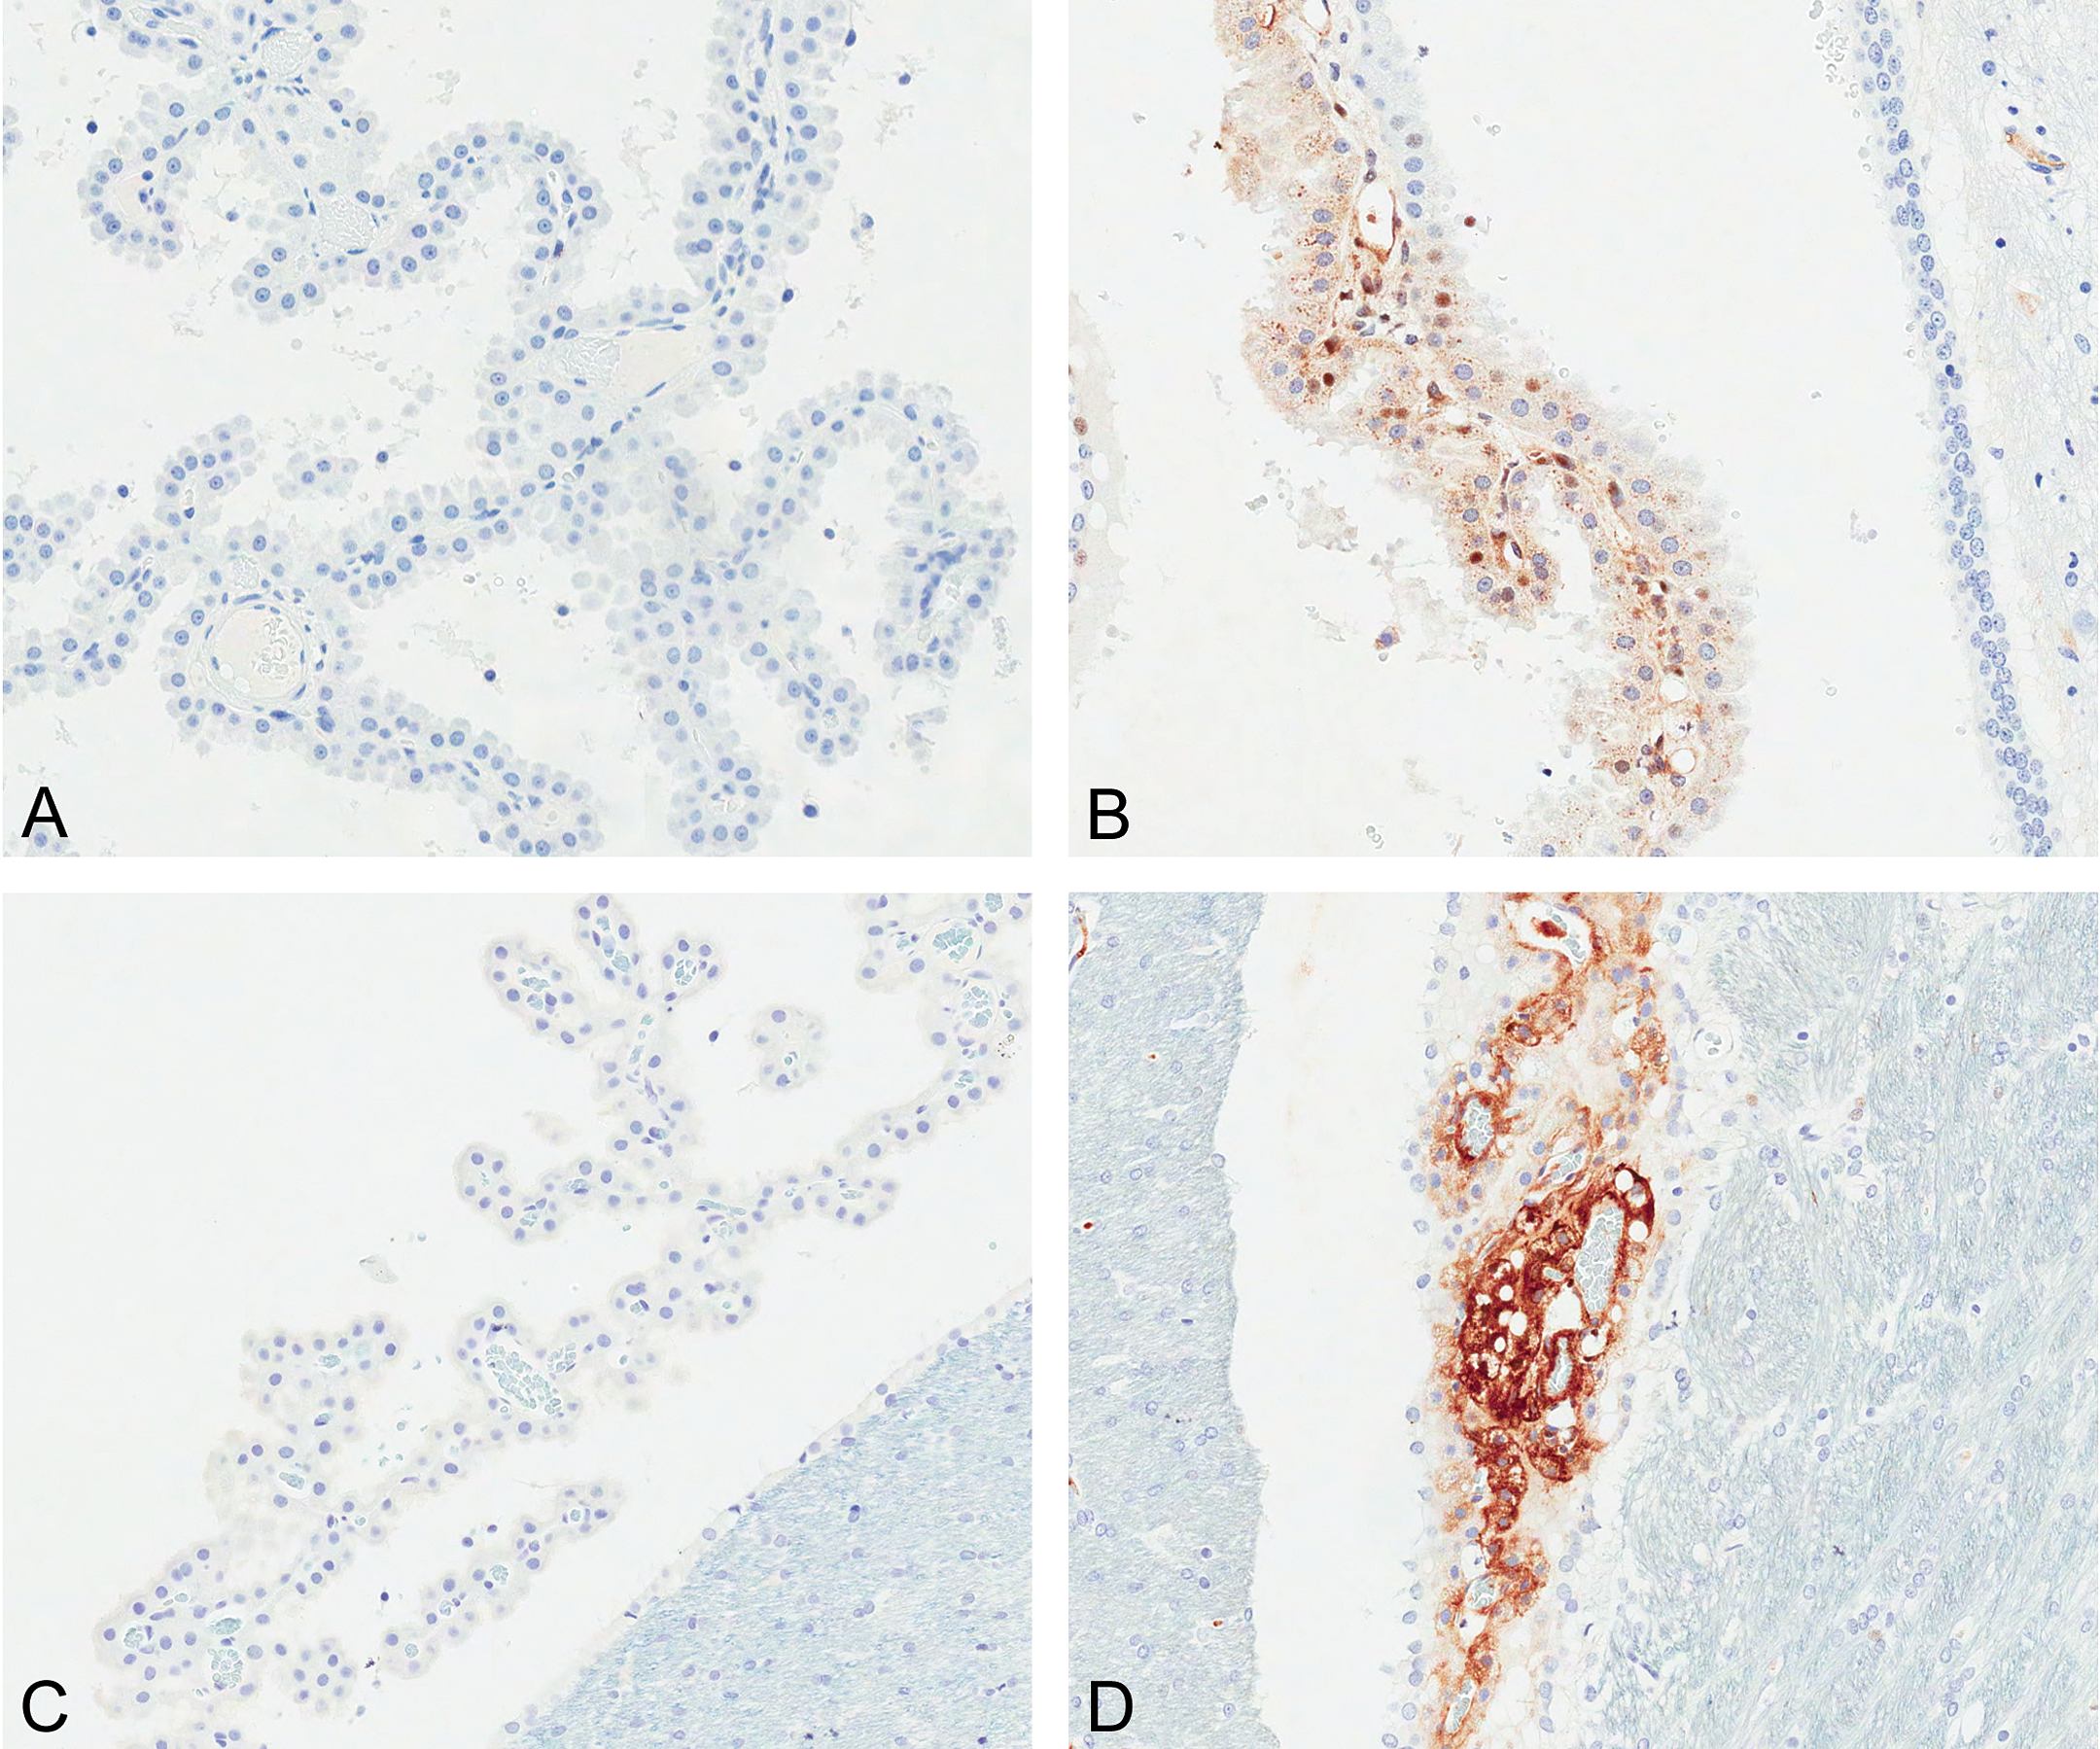
PEG immunoreactivity in choroid plexus epithelial cells from cynomolgus monkey (A, B) and rat (C, D) treated with saline vehicle (A, C), or 80KPEG-peptide X (B, D) for 3 months. Magnification = 50×.
PEG IHC Labeling of Tissues from Rats Dosed with Different Molecular Weight PEGs
In rats treated with unconjugated 10KPEG, 20KPEG, or 40KPEG, there were striking differences in the pattern of tissue and cell-specific PEG immunoreactivity. For rats given 10KPEG, the immunoreactivity was greatest in the proximal convoluted tubules of the kidney, alveolar macrophages of the lung, and Kupffer cells of the liver (Figures 3 and 4). For 40KPEG-treated rats, the splenic subcapsular red pulp macrophages, renal interstitial macrophages and glomerular podocytes/endothelial cells, choroid plexus epithelial cells and interstitial macrophages, and cerebral cortical capillaries were PEG immunoreactive (Figure 5). Rats dosed with 20KPEG had an intermediate phenotype (data not shown). For all 10KPEG, 20KPEG, and 40KPEG groups, cells with morphologic characteristics of macrophages in the subepicardium of the heart were also immunoreactive, albeit at higher numbers for 40KPEG-treated rats (Table 3). Also occasional subepicardial cardiomyocytes were immunoreactively positive for PEG in 40KPEG-treated rats only.
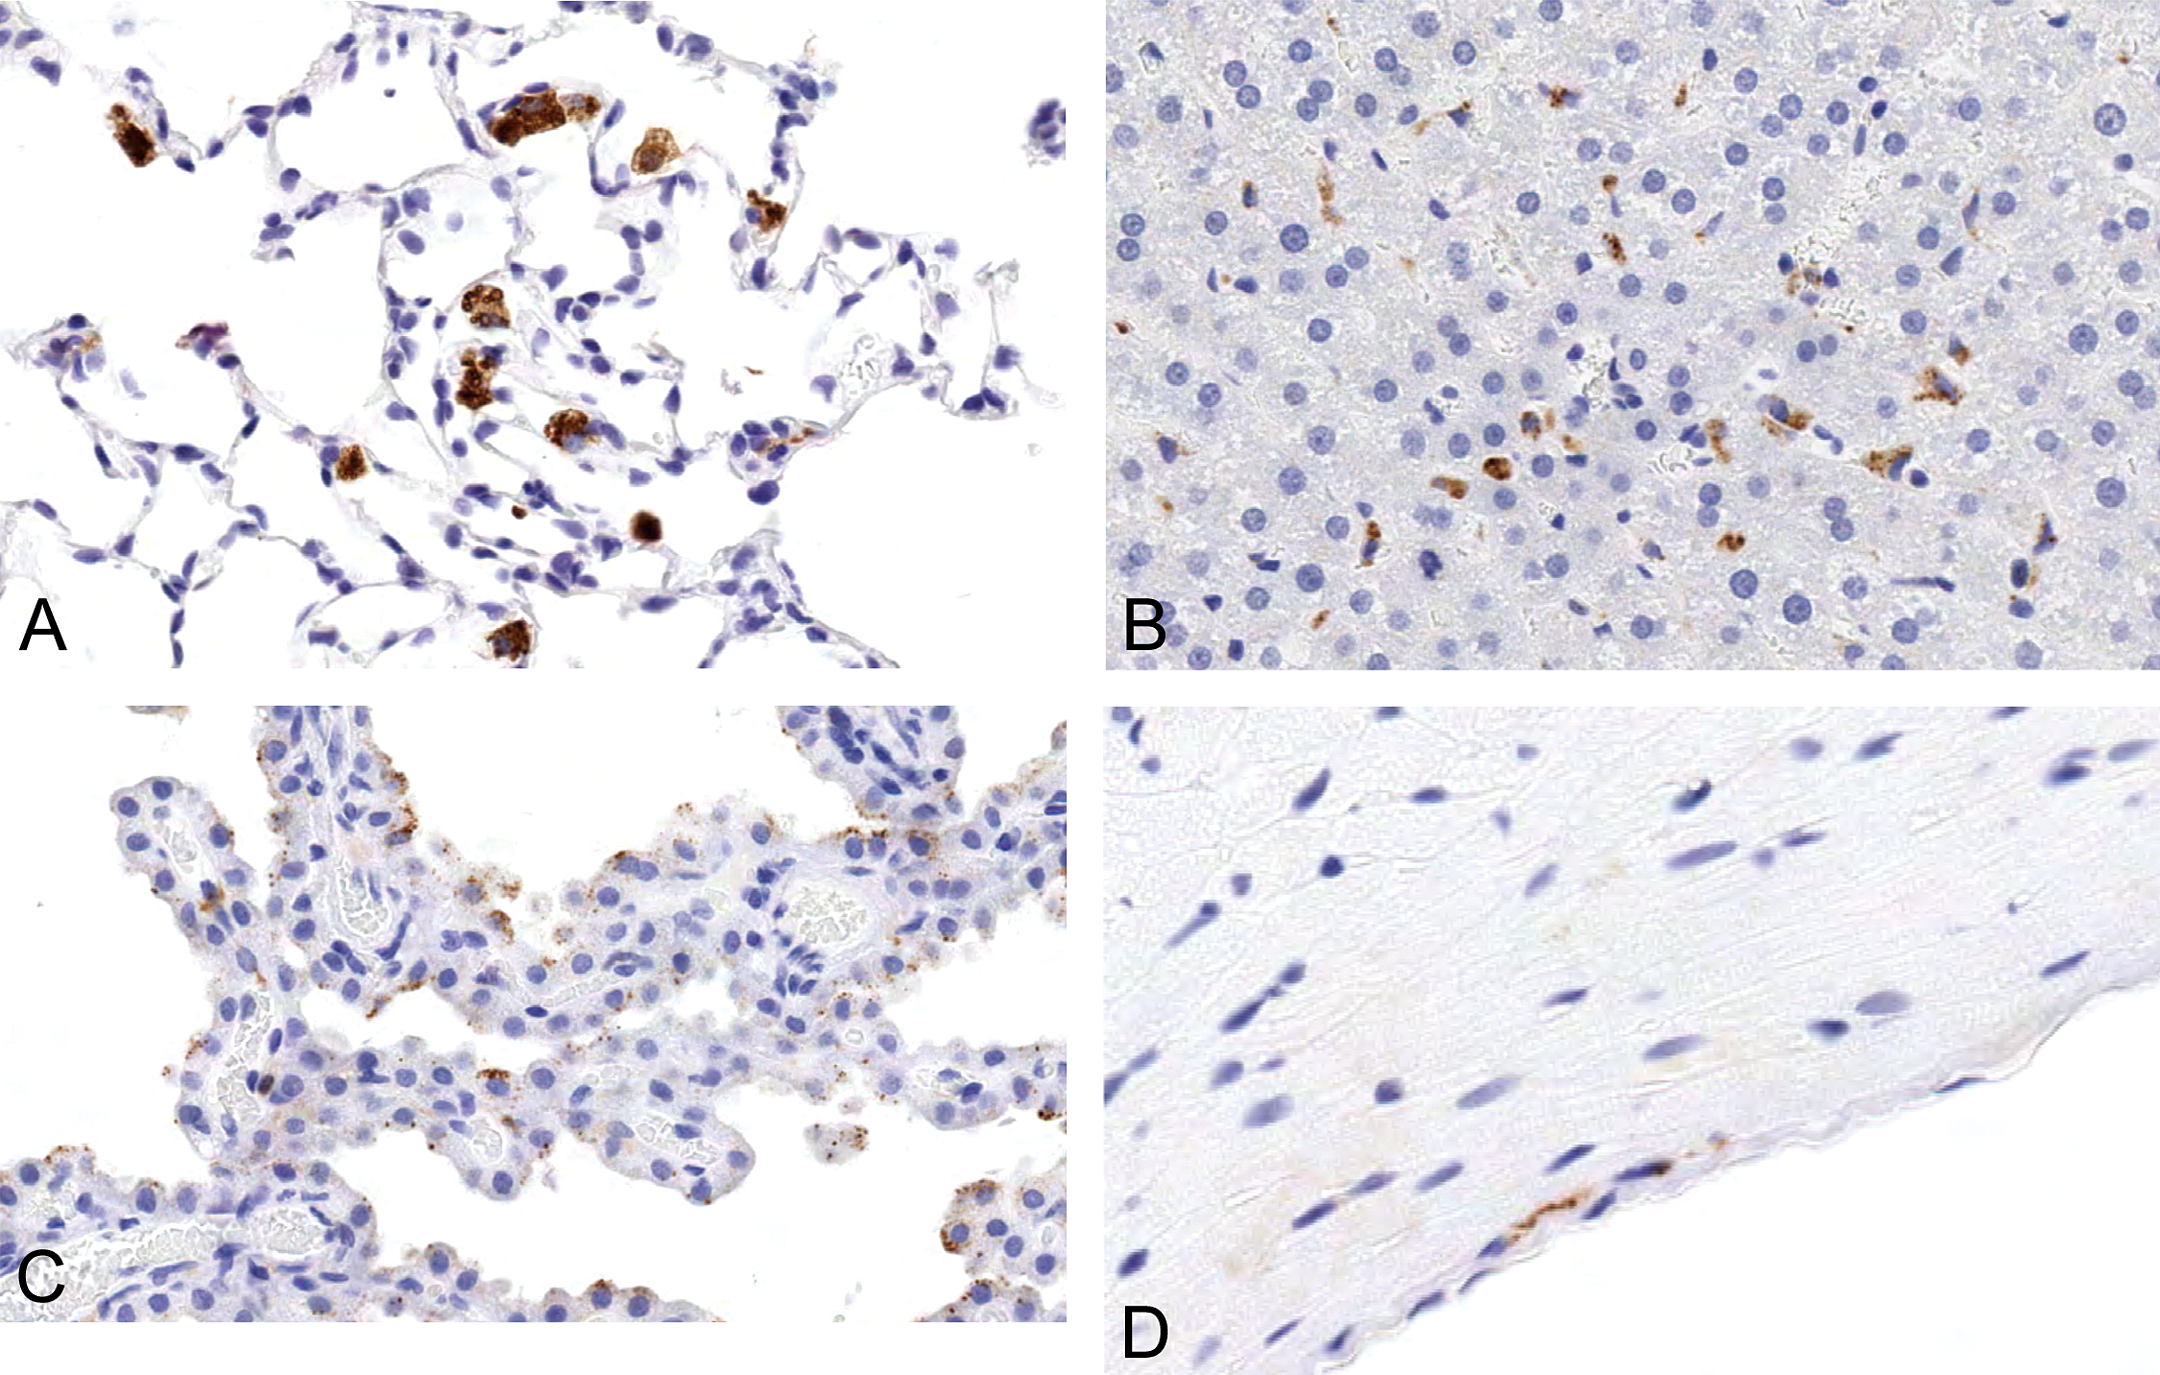
PEG immunoreactivity in pulmonary alveolar macrophages (A), hepatic Kupffer cells (B), choroid plexus epithelial cells (C), and subepicardial macrophages (D) in rats given 100 mg/kg 10KPEG IV. The PEG staining is strong and present in large numbers of alveolar macrophages and Kupffer cells. Choroid plexus epithelial staining is mild and is limited to small, punctuate staining within the cytoplasm. Magnification = 250×.
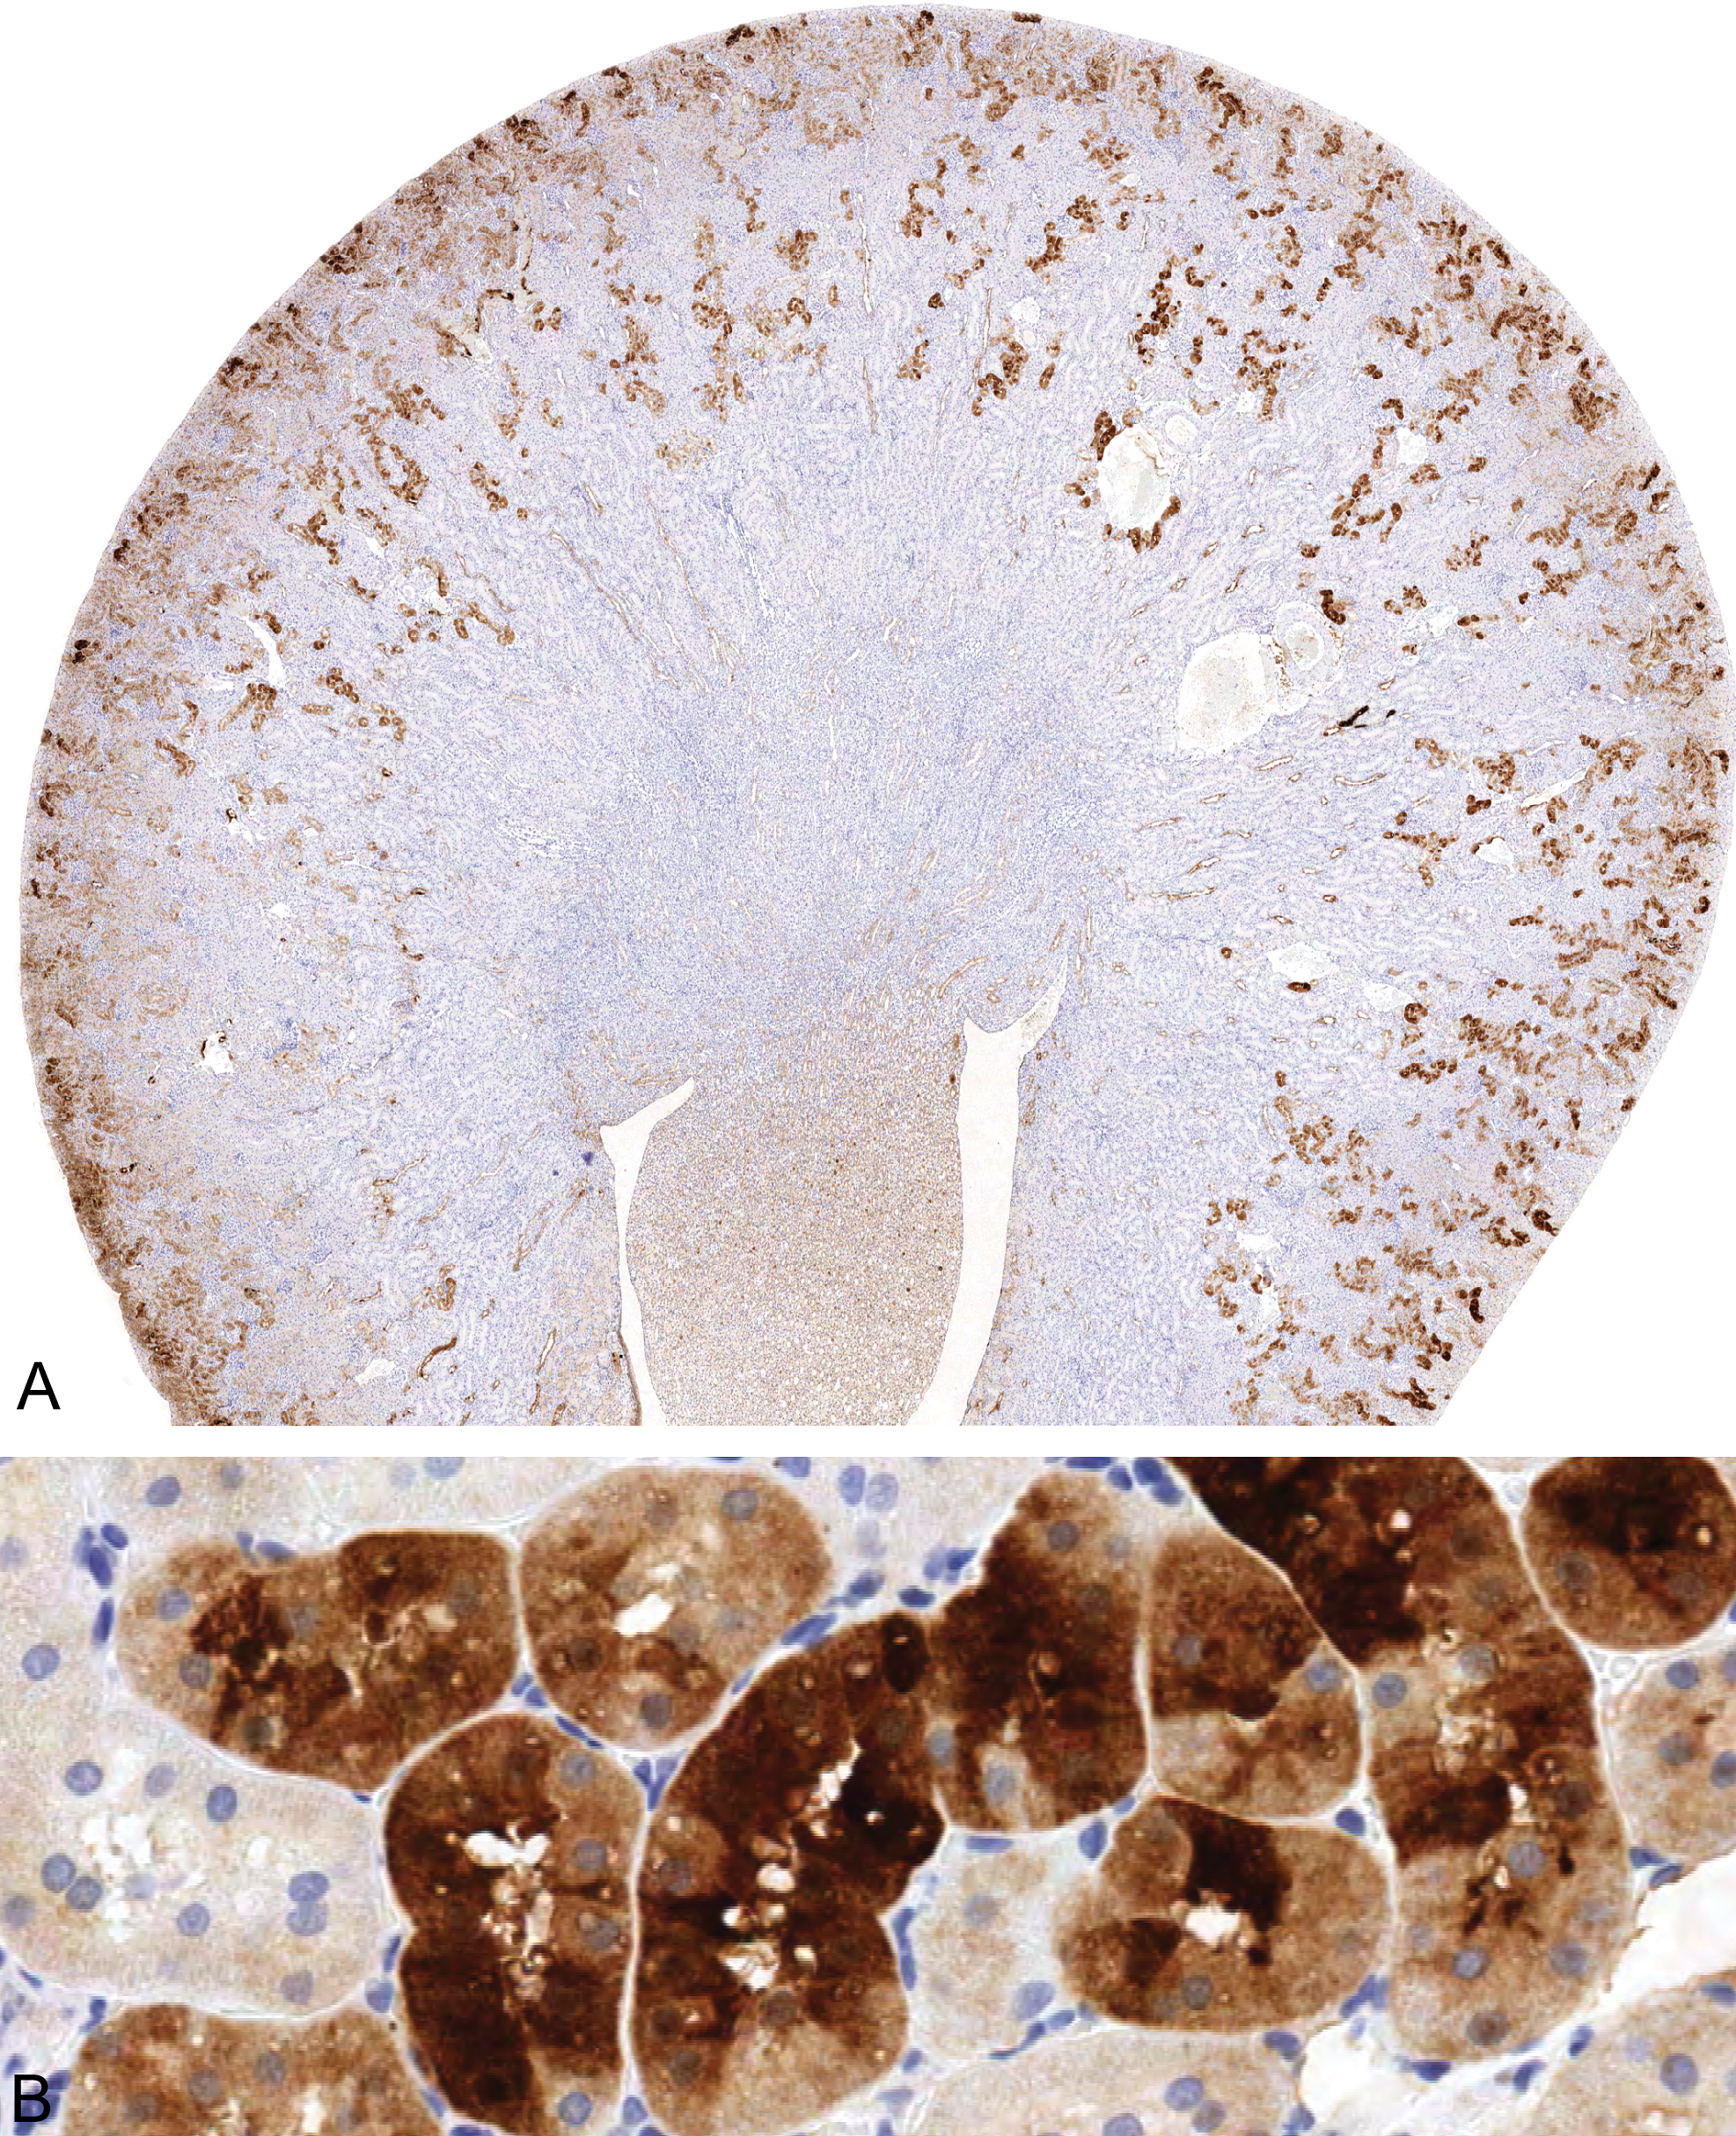
PEG immunoreactivity in kidney from rats given 100 mg/kg 10KPEG IV. There is variable but diffuse PEG staining in tubular epithelial cells throughout the renal cortex. PEG staining is not associated with epithelial cell vacuolation. Magnification = 8× (A) and 230× (B).
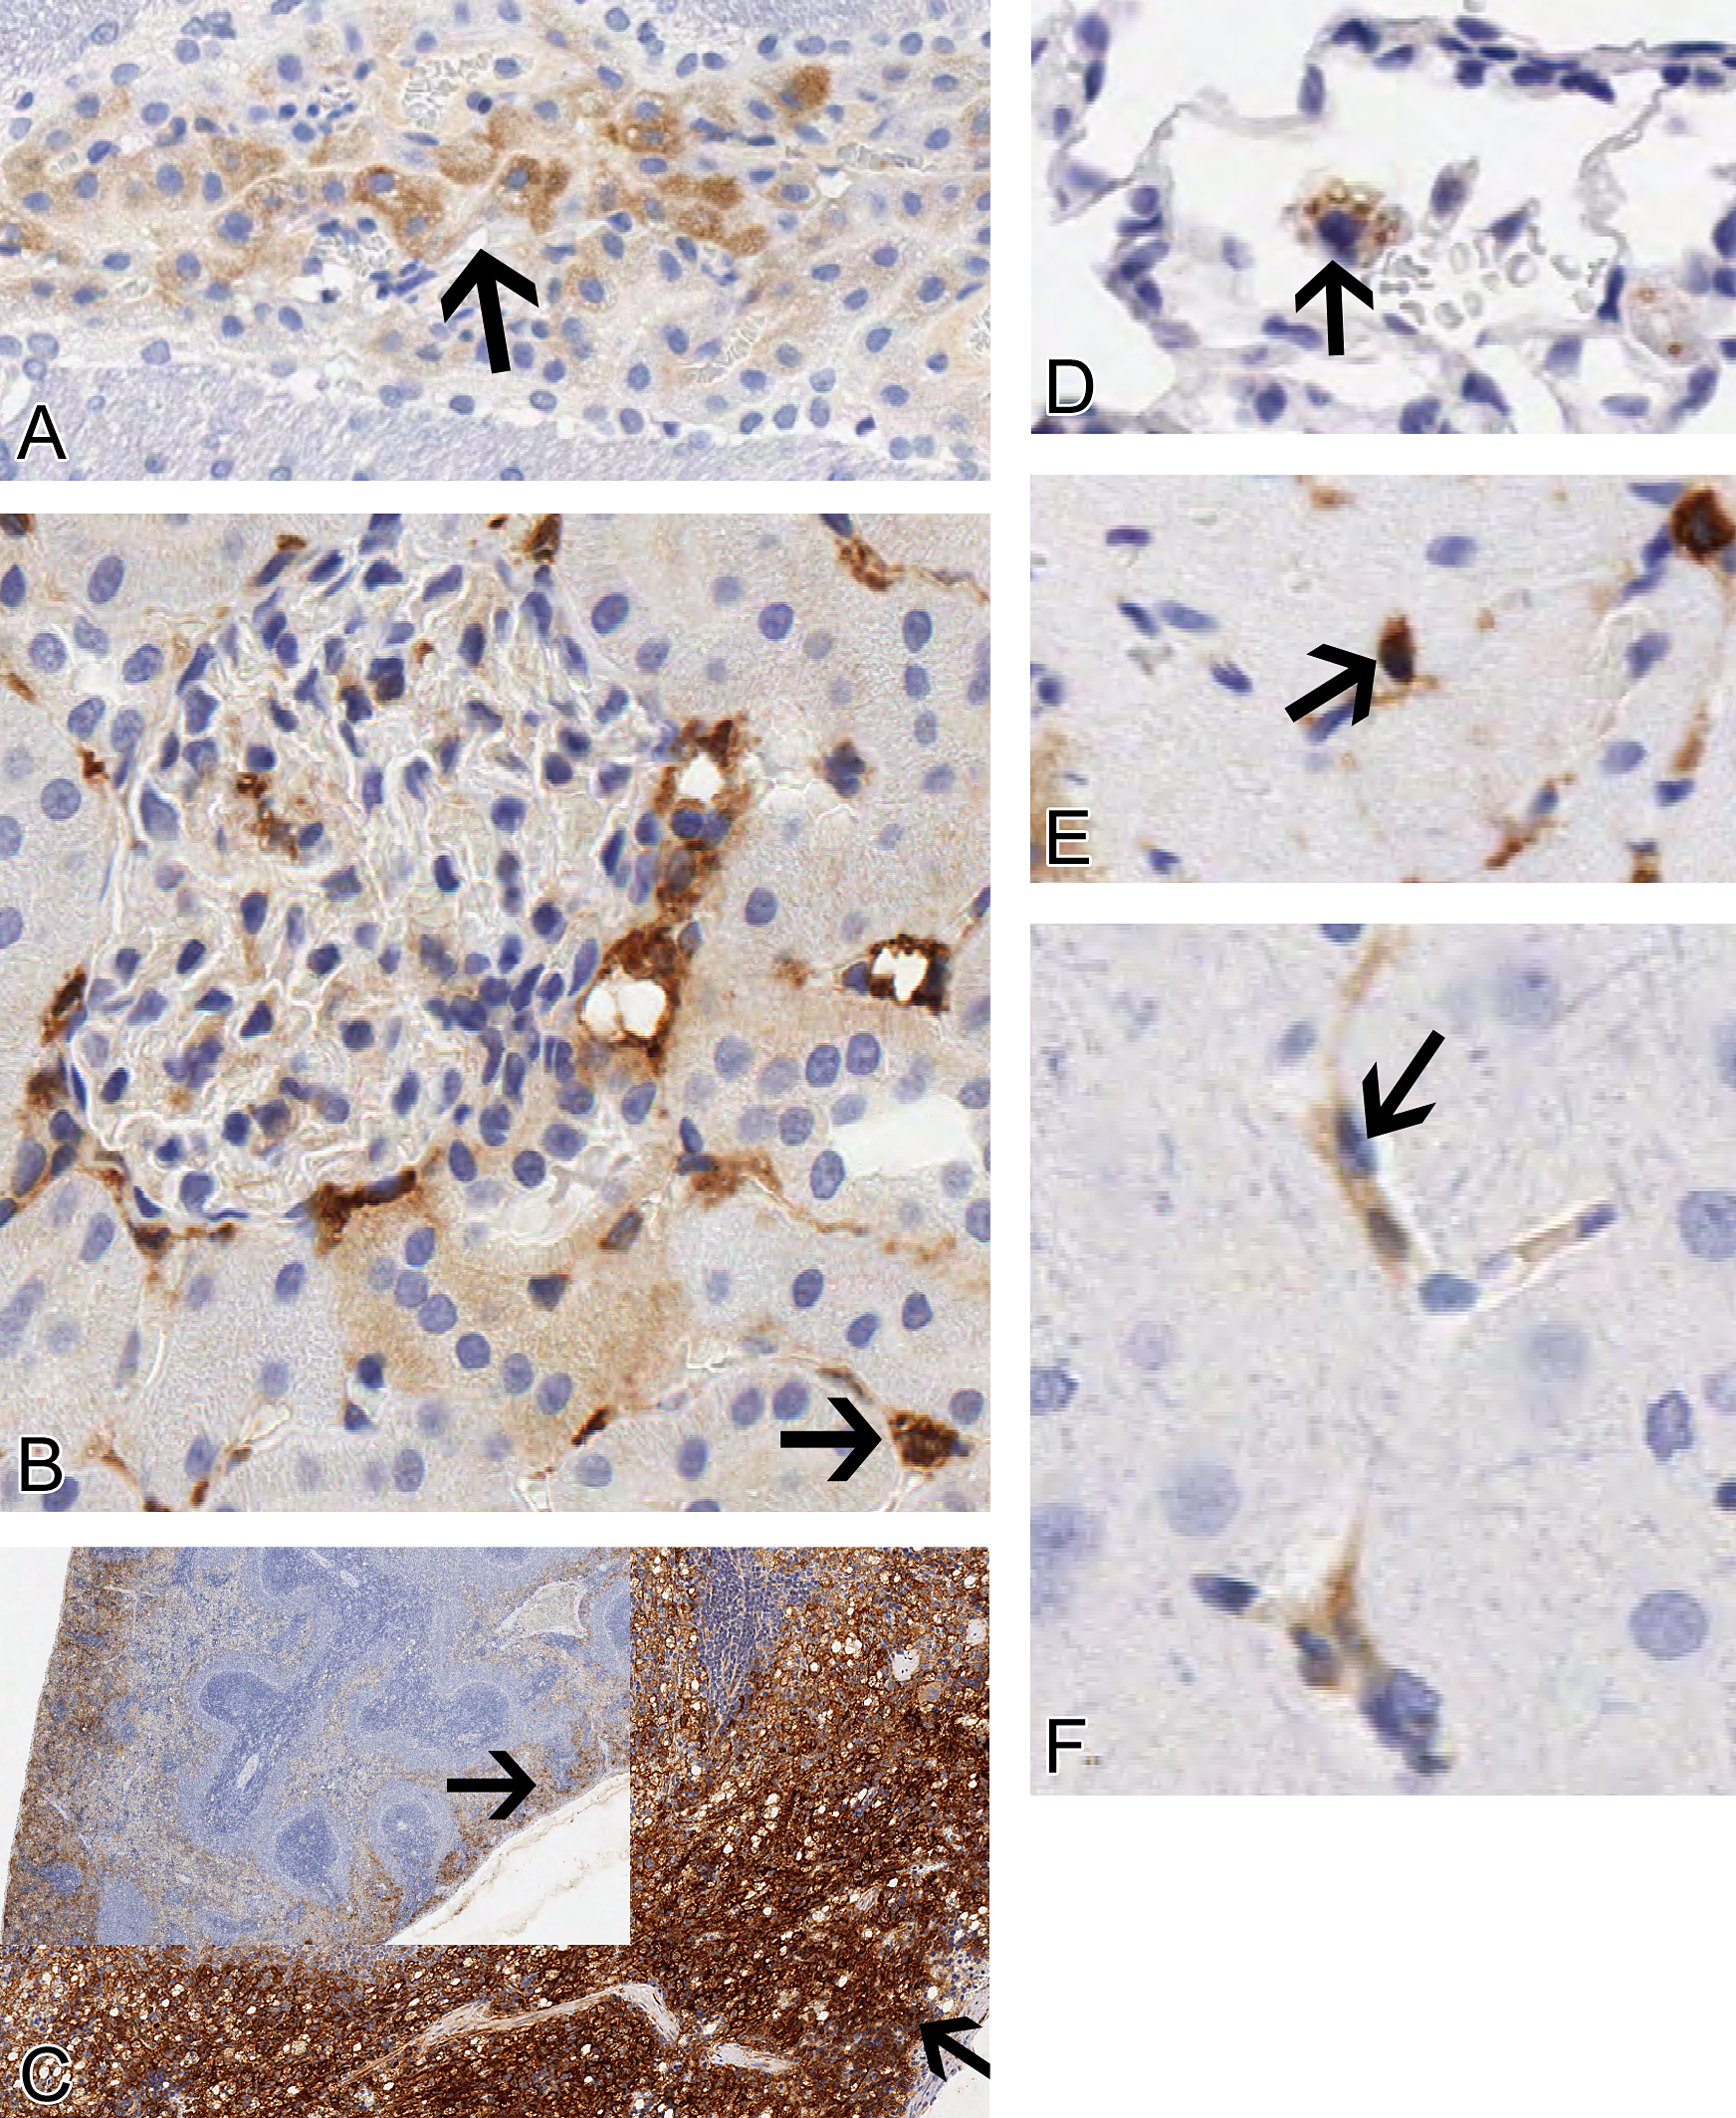
PEG immunoreactivity in choroid plexus (A, arrow), renal interstitial macrophages (arrow), tubules and glomeruli (B), macrophages in splenic red pulp (C, arrow), lung alveolar macrophages (D, arrow), epicardial macrophages (E, arrow), and cerebral capillaries (F, arrow) from rats given 100 mg/kg 40KPEG IV for 3 months. The choroid plexus epithelial cytoplasmic staining is diffuse. Renal interstitial and red pulp are strongly PEG immunoreactive. Magnification = 200× (A, B, D–F) and 2.5 (C inset) and 60× (C).
Effect of PEG molecular weight on macrophage PEG immunoreactivity in heart and liver from rats treated with 100 mg/kg IV 10KPEG, 20KPEG, or 40KPEG for 3 months.
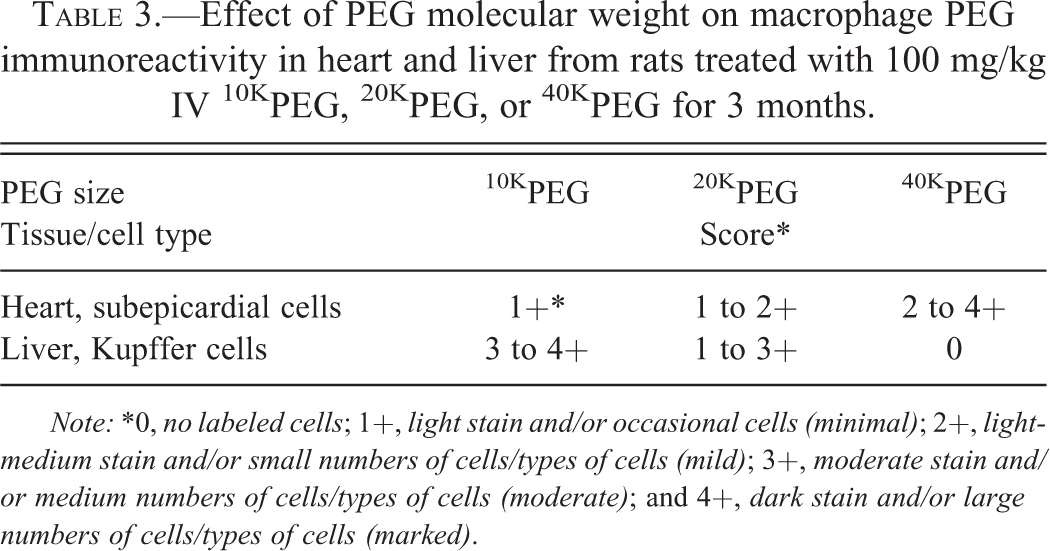
Note: *0, no labeled cells; 1+, light stain and/or occasional cells (minimal); 2+, light-medium stain and/or small numbers of cells/types of cells (mild); 3+, moderate stain and/or medium numbers of cells/types of cells (moderate); and 4+, dark stain and/or large numbers of cells/types of cells (marked).
The choroid plexus epithelium and capillaries within the renal glomeruli and cerebral cortex of 40KPEG-treated rats were PEG immunoreactive (Figure 5). Because of this labeling, we examined with detail the parenchymal side of the blood–brain barrier for PEG immunoreactivity in all rats. Anatomical sites evaluated included the frontal cortex, striatum, hippocampus, thalamus/hypothalamus, cerebellum, and medulla oblongata. There was no PEG immunoreactivity in the brain parenchyma of any of the 10KPEG-, 20KPEG-, or 40KPEG-treated rats. Areas examined included the neuropil, neurons, microglia cells, astrocytes, and oligodendrocytes. Glomeruli were labeled multifocally in 40KPEG-treated rats. The labeling was more prominent in glomeruli nearer to the capsular surface and the pattern suggested that podocyte foot processes and/or endothelial cells were affected.
We used morphometry to provide a quantitative assessment of the total PEG immunoreactivity in the kidney, lung, choroid plexus, and spleen. The percentage of positive pixel area (for kidney, choroid plexus, and spleen) or mean number of positive cells/mm2 (for lung) corresponded to the qualitative assessment. For the choroid plexus and spleen, there was an increase in mean percentage area of PEG total immunoreactivity in rats given 40KPEG rats compared to rats given 20KPEG (choroid plexus p = .0038; spleen p < .0001) or 10KPEG (choroid plexus p = .0005; spleen p < .0001; Figure 6). The increase in percentage area for both tissues was roughly proportional to the PEG molecular weight increase with the exception of the percentage strongly positive (+3) staining area for the spleen, which was disproportionally higher in 40KPEG rats (18%) compared to 20KPEG (2%) and 10KPEG (0%; Figure 6). In the choroid plexus, the increased percentage area of PEG total immunoreactivity was due to a more diffuse epithelial cytoplasmic staining pattern in 40KPEG-treated rats as compared to the punctuate pattern observed in 20KPEG- and 10KPEG-treated rats. In the spleen of 40KPEG-treated rats, the disproportionate increase in percentage area of 3+ cells was the result of intense macrophage staining in subcapsular regions. The macrophage staining throughout the red pulp of 10KPEG- and 20KPEG-treated rats was comparable in all areas of the red pulp.
Effects of PEG molecular weight on percentage pixel PEG area in choroid plexus (A), kidney (C), and spleen (D) or number of PEG positive cells/mm2 in lung (B) from rats treated with 100 mg/kg IV 10KPEG, 20KPEG, or 40KPEG for 3 months.
For the lung and kidney, the mean number of positive cells/mm2 (lung) and percentage area of PEG immunoreactivity (kidney) increased as the molecular weight of the PEG decreased from 40 kDa to 10 kDa (Figure 6). The mean number of PEG positive cells/mm2 in the lung for rats given 10KPEG was approximately 5- or 9-fold higher than rats given 20KPEG (p = .0041) or 40KPEG (p = .0010), respectively. Mean total kidney area for PEG immunoreactivity was approximately 4-fold greater in rats given 10KPEG compared to rats given 20KPEG (p < .0001) or 40KPEG (p < .0001). While the mean total area was comparable for 20KPEG- and 40KPEG-treated rats (p = .99), the cell populations stained were different. For 20KPEG, renal tubular epithelial cells were PEG immunoreactive, while for 40KPEG-treated rats, interstitial macrophages and glomeruli were the predominant PEG immunoreactive cell type (Figure 5).
We also evaluated the relative number of PEG immunoreactive Kupffer cells and subepicardial macrophages in treated groups and found that the number and/or intensity of labeling decreased in Kupffer cells but increased in subepicardial macrophages as PEG molecular weight increased (Table 3). Kupffer cells were immunoreactive frequently in 10KPEG-treated rats, less so in 20KPEG-treated rats, and were not stained in the 40KPEG-treated rats.
PEG-related Histologic Changes in Tissues from Rats Dosed with Different Molecular Weight PEGs
A summary of the histologic changes observed with PEG treatment is listed in Table 4. Some choroid plexus epithelial cells and interstitial macrophages from 40KPEG-treated rats had numerous, 2 to 4 micron, round, and discrete cytoplasmic vacuoles (Figure 7). These vacuoles were clear (unstained) with hematoxylin and eosin and were not associated with any other histologic changes in the choroid plexus or the adjacent ventricle; however, the presence of these vacuoles was associated with cytoplasmic PEG immunoreactivity (Figure 7). Within histologic sections, the vacuoles also demonstrated variable PEG immunoreactivity ranging from an absence of staining to dark staining (Figure 7). Other anatomical sites evaluated in the brain of 40KPEG-treated rats, including the frontal cortex, striatum, hippocampus, thalamus, cerebellum, and brain stem, were normal. There was no choroid plexus vacuolation or other microscopic changes in the brains of 10KPEG- or 20KPEG-treated rats.
Cytoplasmic vacuoles (arrows) are associated with variable levels of PEG immunoreactivity in the heart (A, 300×), kidney (B, 300×), choroid plexus (C, 300×), lung (D, 400× and E, 400×), and spleen (F, 200× and G, 350×) in rats given 100 mg/kg 40KPEG IV. In the epicardium, vacuoles were generally clear (A). The cortical tubule and choroid plexus had both darkly stained and clear vacuoles (B, C). Alveolar macrophage vacuoles generally had moderate to darkly staining vacuoles (D, E). Larger, clear vacuoles were easily visualized at low magnification in the splenic red pulp (F). At higher magnification, splenic macrophages also had numerous, smaller lightly stained vacuoles (G).
Summary of incidence and severity of PEG-related histologic findings in rats treated with 100 mg/kg IV 10KPEG, 20KPEG, or 40KPEG for 3 months.
*Tissues were examined for any histologic findings using standard descriptive morphologic terminology and the following semiquantitative scale for severity of the change: 1, minimal (MI); 2, slight (SL); 3, moderate (MO); 4, marked (MA); and 5, severe (SE).
**Kupffer cells in livers of 10KPEG- and 20KPEG-treated rats stained with PEG but otherwise were normal histologically.
In 40KPEG-treated rats, splenic enlargement was indicated in histologic sections by rounded capsular borders and increased prominence of the red pulp. While macrophages in the red pulp normally have some vacuolation as a result of their function in removing senescent red blood cells and other particulates, the numbers of vacuolated macrophages and the extent of vacuolation were increased in 40KPEG-treated rats (Table 4 and Figure 5). Interestingly, the effect was most prominent in the subcapsular region as demonstrated by the markedly higher level of PEG immunoreactivity in the cytoplasm (Figure 5). The level of macrophage vacuolation was not above the background observed in SD rats in 10KPEG- or 20KPEG-treated rats and PEG immunoreactivity was lower and lacked the subcapsular pattern observed in the 40KPEG-treated rats (data not shown). As for the choroid plexus, PEG immunoreactivity colocated with cytoplasmic vacuoles within splenic macrophages, although not all vacuoles were immunoreactive (Figure 7).
The renal tubule epithelium had increased vacuolation multifocally in one of five 40KPEG-treated rats (Figure 8). The vacuoles were characterized as single, 2 to 4 micron, round, discrete, and cytoplasmic and were clear (unstained) with hematoxylin and eosin. These vacuolated tubular epithelial cells were attenuated and exhibited cytoplasmic basophilia, both of these features consistent with tubular degeneration (Figure 8). While focal tubular degeneration can occur spontaneously in rats, strong PEG immunoreactivity in these degenerative tubules suggested that degeneration was related to PEG accumulation (Figure 8). In contrast, despite strong and diffuse tubular epithelial PEG immunoreactivity, renal tubule epithelial cells in 10KPEG- or 20KPEG-treated rats exhibited neither increased vacuolation nor degenerative changes (Figure 4).
Tubular degeneration associated with renal tubular epithelial vacuolation and PEG immunoreactivity in kidney in rat given 100 mg/kg 40KPEG IV. Affected tubules had rarefied, basophilic cytoplasm with vacuoles. These tubules stained strongly for PEG. Magnification = 250×.
Some alveolar macrophages and subepicardial macrophages in 40KPEG-treated rats were enlarged due to increased PEG-immunoreactive cytoplasmic vacuolation (Figure 7). Alveolar macrophages were not vacuolated in 10KPEG- or 20KPEG-treated rats (Table 4); however, increased numbers of alveolar macrophages were PEG immunoreactive in 10KPEG-treated rats (Figure 3 and Figure 6). As for the choroid plexus and spleen, PEG immunoreactivity colocated with cytoplasmic vacuoles within alveolar macrophages and subepicardial macrophages, although not all vacuoles were immunoreactive (Figure 7).
Discussion
We developed an IHC procedure to detect HMW PEG in formalin-fixed paraffin-embedded tissues and then studied the effect of varying the molecular weight of unconjugated HMW PEG (10KPEG, 20KPEG, or 40KPEG) on the cellular distribution and extent of vacuolation and other histologic changes in rats dosed intravenously for 3 months. We demonstrated that as HMW PEG molecular weight increases, the cellular distribution of HMW PEG and the pattern of HMW PEG–induced cytoplasmic vacuolation are strikingly altered in rats. As molecular weight increases, PEG immunoreactivity in renal tubules decreases dramatically but becomes increasingly more prominent in other cell populations, especially splenic macrophages and choroid plexus epithelial cells. PEG-related histologic changes were generally limited to rats dosed with 40KPEG, where PEG immunoreactivity was associated with macrophage and choroid plexus epithelial cell vacuolation and in the case of the kidney, tubular epithelial vacuolation and degeneration. These data demonstrate for the first time the effects of modifying PEG molecular weight on both the cellular distribution of immunoreactive PEG and PEG-related histologic changes. The data suggest that while the overall toxicity of HMW PEG is low, chronic dosing of biologics conjugated to HMW PEGs ≥ 40K is associated with a greater potential for adaptive changes (i.e., vacuolation) in macrophages and choroid plexus epithelial cells and for vacuolation with degeneration of renal tubular epithelial cells.
Our IHC results showed a molecular weight dependent effect on the cellular distribution of PEG in multiple cell populations. Differences in cellular distribution likely reflect a combination of molecular weight effects on PEG pharmacokinetics, access to different cell types based on physiologic filtration barriers, and the endocytic, phagocytic, and metabolic capacities of cells exposed to PEG. Molecular weight is known to affect the pharmacokinetics and tissue distribution of PEG in animals (Yamaoka, Tabata, and Ikada 1994). Higher molecular weight PEGs are retained in the blood longer while lower molecular weight PEGs have a larger volume of distribution (Yamaoka, Tabata, and Ikada 1994). The increase in half-life is most dramatic when the PEG molecular weight is greater than 30K because of a marked reduction in the ability of the PEG to be filtered through the glomerulus. Our kidney IHC was consistent with these observations. Namely, renal tubular PEG immunoreactivity was marked in 10KPEG-treated rats, intermediate in 20KPEG-treated rats, and notably lower in rats dosed with 40KPEG (Figures 3, 5, and 6). As the immunoreactivity in proximal renal tubules decreased in 40KPEG-treated rats, renal interstitial macrophage and glomerular immunoreactivity increased.
Macrophages have an important role in removing foreign material from the local tissue environment and so it is not unexpected that multiple macrophage-rich tissues were PEG immunoreactive in rats given 10KPEG, 20KPEG, or 40KPEG. Alveolar macrophages and Kupffer cells were labeled most frequently in 10KPEG-treated rats, less so in 20KPEG-treated rats and were in low numbers (alveolar macrophages) or not detected (Kupffer cells) in rats given 40KPEG. In studies using intratracheal challenge of fluorescein isothiocyanate (FITC)-labeled PEGs up to 20 kDa in size, the alveolar macrophage readily phagocytosed PEG (Gursahani et al. 2009). Kinetic analysis of the PEG-FITC uptake by alveolar macrophages suggested that increased recruitment of macrophages from the alveolar parenchyma occurred as an adaptive response to PEG challenge (Gursahani et al. 2009). Likewise, in our studies, rats given 10KPEG had increased PEG immunoreactive alveolar macrophages consistent with a comparable adaptive response of the lung to clear alveolar PEG (Table 4).
PEG uptake by rat Kupffer cells was studied previously in vitro using 125I-labeled PEG (Yamaoke et al. 1994). In those experiments, Kupffer cells readily ingested 6KPEG, 20KPEG, and 50KPEG (Yamaoke et al. 1994). However, uptake of PEG by alveolar macrophages or Kupffer cells was unaffected by PEG molecular weights ranging from 2 to as high as 50 kDa (Gursahani et al. 2009; Yamaoke et al. 1994). In contrast, we observed a molecular weight dependent level of PEG immunoreactivity in Kupffer cells and alveolar macrophages. 10KPEG-treated rats had the greatest PEG immunoreactivity in these macrophage populations (Figure 3, Table 3). These differences are likely due to the in vitro conditions of the Kupffer cell study and the intratracheal delivery approach for the alveolar macrophage study. Both approaches circumvented the capillary endothelial barrier to higher molecular weight PEG entry into the pulmonary alveolus or hepatic sinusoid. Both alveolar macrophage and Kupffer cell populations are behind endothelial barriers that are size-permissive for the passage of 10KPEG or 20KPEG (Gursahani et al. 2009).
We found that in 40KPEG-treated rats, cerebral cortical capillaries and renal glomeruli were frequently PEG immunoreactive (Figure 5). Because renal clearance is inhibited by the size of the 40KPEG, blood levels of PEG are likely higher in 40KPEG-treated rats compared with 10KPEG or 20KPEG rats. The higher circulating PEG levels allows for pinocytosis of PEG by cells like the choroid plexus epithelial cells and endothelial cells. For the cerebral capillary and renal glomerulus, it is possible that endothelial pinocytosis leads to accumulation of the PEG in the pericyte (cerebrum) or podocyte (kidney). The pericyte is a macrophage-derived cell located on the abluminal surfaces of cerebral capillaries that can govern entry of large molecules (e.g., 40KPEG) into the brain (Broadwell and Salcman 1981). The podocyte wraps around the basal lamina of the glomerular capillary endothelial cell to form a filtration slit that allows only small molecules to pass and has a high level of endocytic and catabolic activity as indicated by a large number of lysosomes (Pavenstadt, Kriz, and Kretzler 2003). We hypothesize that the staining associated with these cerebral and glomerular capillaries represents PEG accumulation within the lysosomes of pericytes and podocytes, respectively. The pericytes and podocytes may accumulate PEG as part of their role in maintaining the blood–brain and renal filtration barriers. This unique characteristic of the cerebral capillaries and the glomerular podocytes may explain why the capillary staining was observed in these areas.
For 40KPEG-treated rats, the extent of macrophage PEG immunoreactivity was reduced compared to 10KPEG or 20KPEG groups in all locations but the spleen and epicardium (Figures 5 and 6, Table 3). This is consistent with the leakiness of the splenic red pulp sinuses, which facilitates macrophage removal of senescent red blood cells or blood particulates no matter the molecular weight or size (Cesta 2006). While the splenic macrophage staining was expected for PEG-treated groups, there was a different staining pattern in the spleen of 40KPEG-treated rats compared to 10KPEG- or 20KPEG-treated rats. Namely, in 40KPEG-treated rats, the subcapsular region of the spleen was strongly PEG immunoreactive compared to the remaining red pulp macrophages (Figure 3). The intense subcapsular staining in 40KPEG-treated rats suggested that there is an increased density of macrophages in the subcapsular zone or a population of monocyte/macrophages in the rat subcapsular red pulp that is more active in PEG removal from the blood in 40KPEG-treated rats. The former is unlikely because in experiments using an antibody for rat macrophages (ED-1), the density of macrophages in rats from this study was similar throughout the red pulp (data not shown). Interestingly, in the mouse, there is a large subcapsular specific pool of reserve Ly-6Chigh monocytes that are phagocytic and respond to systemic demand in inflammation (Swirski et al. 2009). To our knowledge, this population has not been reported in the rat spleen. However, it is intriguing to speculate that a comparable population may be present in the rat spleen and be important in 40KPEG removal from the circulation.
For all three HMW PEGs in this study, we administered 100 mg/kg intravenously to approximate “high” doses evaluated in toxicology studies in our laboratory as well as by other groups testing PEGylated biologics (BLA #125160 2006; Bendele et al. 1998; Young et al. 2007; Webster et al. 2009). As expected, despite the high IV dose used in our study, the HMW PEGs were well tolerated and produced essentially no systemic toxicity. In fact, with the exception of slight alveolar histocytosis in 10KPEG-treated rats, identified histologic changes were limited to the 40KPEG group and consisted of vacuolation of multiple tissue macrophage populations, the choroid plexus epithelium, and the renal tubular epithelium (Table 4 and Figure 7). Of interest was whether the cytoplasmic vacuoles observed in these cell populations contained or were associated with PEG. PEG immunoreactivity was demonstrated in the cytoplasm of vacuolated cells; however, the vacuoles themselves had variable levels of PEG immunoreactivity. The histologic characteristics of the vacuoles were consistent with what would be expected with lysosome distention or phagolysosome accumulation. While electron microscopy to confirm the affected organelle was not done in this study, if the PEG is being taken up by lysosomes, processing might alter PEG antigenicity to the antibody used in these experiments and result in variable labeling. Alternatively, some of the vacuoles may simply not contain PEG or have PEG levels below the level of detection by the IHC procedure used in this study.
The tissue distribution and histologic characteristics observed in this study were consistent with those observed in studies conducted with HMW PEG–conjugated proteins in our laboratory (data not shown) and others (BLA #125160 2006; Bendele et al. 1998; Young et al. 2007; Webster et al. 2009), demonstrating that HMW PEGs produce vacuolar changes in tissues in the absence of conjugated protein. This does not preclude the possibility that the protein may influence the time course, incidence, and/or severity of PEG-related changes. For example, TNFbp conjugation to PEG appeared to be required for renal epithelial vacuolation in acute studies (Bendele et al. 1998). In that case, TNFbp conjugation may have facilitated PEG–TNFbp reabsorption by renal epithelial cells and accelerated the onset of PEG related vacuolation. While the investigators did not report vacuolar changes with unconjugated PEG, they dosed at lower levels and for only 4 days.
Diffuse immunoreactivity for PEG in renal tubules of 10KPEG- and 20KPEG-treated rats occurred without epithelial vacuolation or other histologic changes in the kidney (Table 4). This extends the observations made in previous studies with unconjugated PEG in which rats dosed for 4 days had no tubular vacuolation (Bendele et al. 1998). As did these investigators, we also evaluated whether large amounts of PEG in tubular epithelial cells altered renal function as reflected by plasma biomarkers (BUN and creatinine) and found no evidence of PEG-related changes in these parameters for any of the PEG groups (Table 2). This suggests that despite movement of large amounts of PEG through the renal tubular epithelium, 10KPEG and 20KPEG does not accumulate in lysosomes, produce vacuolation, or alter glomerular function because it is readily passed into filtrate and excreted in urine.
The only degenerative histologic change associated with increased PEG immunoreactivity was renal tubular degeneration in a single 40KPEG-treated rat (Figure 8). This change was minimal and multifocal, affecting only small clusters of tubules. The degenerate tubules were characterized by cytoplasmic vacuolation, basophilia, and epithelial attenuation associated with very strong PEG immunoreactivity. This suggests that some 40KPEG is able to pass the glomerular filtration barrier to be reabsorbed by tubular cells and that lysosomal accumulation of the larger PEG may adversely affect renal epithelial cellular homeostasis (Bendele et al. 1998). We have observed this change with other 40KPEGylated proteins (data not shown). In those studies as well as the study described here, there were no changes in standard measures used to assess renal function (i.e., plasma or serum BUN, creatinine). Because urine was not collected in the present study, we were unable to examine urinary markers for tubular damage such as NAG and others; however, it is very unlikely that the tubular biomarkers would be perturbed based on the focal and minimal nature of the tubular change. That said, as is the case for LMW PEGs, the kidney appears to be the primary target organ for histologic effects of HMW PEGs administered at high parental doses. While it is important to consider this observation for target patient populations at risk of impaired renal function, it is more likely that the activity of the protein conjugated to the PEG will define the tolerability and risk profile in a clinical population.
Footnotes
Acknowledgments
The authors would like to thank Charles Mahrt and Greg Hall for paper review and Jamie L. Blackbourne and Courtney Burch for assistance with animal protocol generation and study conduct.
The authors declared no potential conflicts of interest with respect to the research, authorship, and/or publication of this article.
The authors received no financial support for the research, authorship, and/or publication of this article.