
Abstract
Consistent, sensitive biomarkers of exocrine pancreatic injury (EPIJ) in animal models and humans have historically represented a poorly met need for investigators and clinicians. Experimental design: Sprague-Dawley CD/International Genetic Standard system (IGS) rats were administered cerulein or cyanohydroxybutene (CHB) to induce EPIJ. Serum samples were taken at time points between 1- and 168-hr postinjection (PI), and rats were sacrificed between 24- and 168-hr PI. Method: We investigated a series of serum-based biomarkers including amylase, lipase, pancreas-enriched microRNAs (miRs) and inflammation biomarkers compared with concurrent hematology and pancreatic histology. Results and Conclusion: Microscopic EPIJ was not associated with consistent changes in hematology or inflammation biomarkers. Increased severity scores for EPIJ correlated with increased amylase and lipase values, although severity of EPIJ did not always correlate with the magnitude of enzyme increases. Microscopic EPIJ was most severe at 24 to 48 hr; increases in miR-216a (32-fold) and miR-375 (23-fold) were present at 24 hr and, along with enzymes, were normalized by 48 hr in the cerulein study. MiRs-216a and 375 were increased by ∼800- and 500-fold, respectively, at 24 hr while miR-375 remained elevated until 72 hr in the CHB study. Impact statement: Pancreas-enriched miRs hold promise as novel serum-based biomarkers for EPIJ.
Introduction
Highly sought after by investigators and clinicians alike for many years, sensitive, specific, and consistent biomarkers of exocrine pancreatic injury (EPIJ) remain elusive. Diagnoses of EPIJ in human patients are a mixture of art and science, employing identification of risk factors and symptoms in the patient history, diagnostic imaging, and laboratory investigations including assessment of pancreatic enzymes, clinical chemistry, and hematology values (Lippi, Valentine, and Cervellin 2012). Rapid and accurate diagnosis of EPIJ at any severity level in laboratory animals species used as part of toxicology studies is also highly desirable in drug development. In addition to being sensitive and specific, ideal biomarkers would be predictive in all stages of the disease, from injury to recovery, have ease of sample collection as well as analysis, and be independent of etiology. Currently, 2 pancreatic enzymes, amylase and lipase, are frequently the cornerstones of laboratory diagnosis for EPIJ in both humans and animals, with lipase being the preferred enzyme (Smith, Southwell-Keely, and Chesher 2005; Carroll et al. 2007). Specificity with these enzymes can be an issue due to the release of activated proteases and accompanying inflammation and tissue digestion, all leading to a regionally diffuse process. In addition to the pancreas, release of serum amylase can occur from the liver, small intestines, and salivary glands, and significance of measured values can vary between species. Serum lipase release can occur also from gastric mucosa, liver, and muscle and fat cells, and due to the need for cofactors should be evaluated with serum calcium concentrations taken into consideration (Wallig and Sullivan 2013). Sensitivity can also be an issue with these serum enzyme markers, as detection may not occur prior to substantial tissue injury, and early, small releases of enzymes are often considered nondiagnostic.
MiRs are short 19- to 24-nucleotide noncoding RNA molecules that are involved in the fine tuning of gene expression at the translational level by directing the RNA-induced silencing complex (RISC) to their target mRNA/mRNAs resulting in inhibition of translation or mRNA degradation. Numerous miRs are expressed in a tissue-/organ-specific manner; are well conserved in mouse, rat, and human; are easily detectable in serum and plasma; and appear to be stable in serum or plasma. This has elicited considerable interest in miRs as sensitive and specific biomarkers for organ toxicity (Lagos-Quintana et al. 2002; http://mirnabodymap.org/index.php; Chen et al. 2008; Laterza et al. 2009; Linsen et al., 2010).
The intent of the current study was to measure putative pancreas-enriched miR/miRs in conjunction with histopathology and more traditional markers of pancreatic injury in 2 rodent models of EPIJ. MiR216a was identified as having the highest expression in pancreas versus other tissues in normal rats, and was also shown to be elevated in a rat model of
Herein, we describe 2 experiments undertaken using noninvasive models of EPIJ in rats. Using either cerulein injections (secretagogue-based model of EPIJ) or cyanohydroxybutene (CHB) injections (EPIJ of unknown mechanism but involving oxidative stress), we compared levels of serum amylase and lipase, inflammation biomarkers, changes in hematology, and levels of miRs 216a and 375 against histopathology of the exocrine pancreas. Our aims were to better understand the models regarding the time course of injury and lesion severity as it relates toxicant dosage and compare the behavior of a number of candidate biomarkers of EPIJ as a function of time postinjury.
Materials and Methods
In both studies, all procedures were in compliance with the U.S. Department of Agriculture’s (USDA) Animal Welfare Act (9 Code of Federal Regulations [CFR] Parts 1, 2, and 3); the Guide for the Care and Use of Laboratory Animals, 8th edition, (Institute for Laboratory Animal Research, The National Academies Press, Washington, DC); and the National Institutes of Health, Office of Laboratory Animal Welfare. Whenever possible, procedures in this study were designed to avoid or minimize discomfort, distress, and pain to animals.
Cerulein Study
Ninety male Sprague-Dawley CD/International Genetic Standard system (IGS) rats (Charles River Laboratories), 10 to 12 weeks of age, were randomized into 9 groups. Each animal received either 3 doses of cerulein (Sigma, C9026) or saline vehicle IP on the designated dosing day approximately 1 hr apart. At nonterminal blood collections, approximately 1.0 ml of whole blood was collected and submitted for serum separation to measure inflammation biomarkers (inflammation panel-1, Cat. No. K15179C, Meso Scale Discovery, Gaithersburg, MD), amylase, lipase, or miRNAs (Table 1). Terminal blood collections were larger and had collection for hematology parameters (hematocrit, hemoglobin, white and red blood cells, platelets, reticulocytes, and mean corpuscular volume and hemoglobin concentration) in addition to serum.
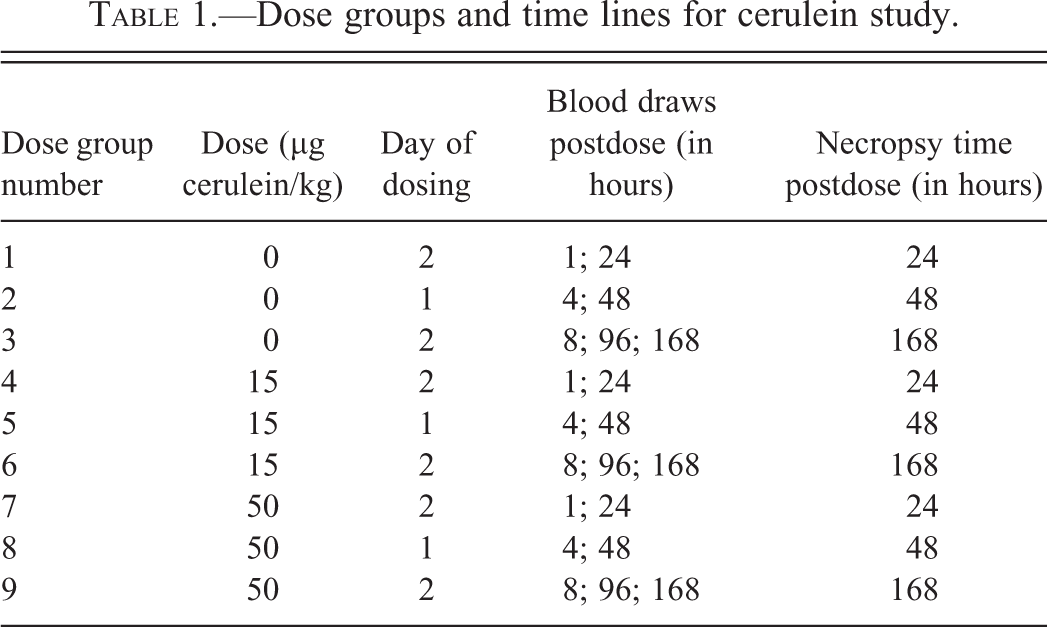
Dose groups and time lines for cerulein study.
Clinical observations were done daily before dosing and approximately 1 hr past the third dose, and daily on nondosing days. Animals were euthanized at the indicated intervals via carbon dioxide followed by cervical dislocation and exsanguination.
A gross necropsy was performed on each animal. The entire pancreas, with the common duct and attached duodenum with papilla, was dissected out, placed flat on trimming paper, and placed in 10% neutral buffered formalin for 24 hr. After routine processing, the pancreas from each euthanized animal was bisected approximately 1 cm from the duodenal papilla and both sections of the organ embedded (peritoneal surface down) in their entirety in paraffin wax, sectioned at 4 to 5 μm, and stained with hematoxylin and eosin. Pancreatic sections were examined microscopically. Microscopic findings were scored on a severity scale of 1 to 4, 1 being the most minimal change and 4 reserved for the most severe changes.
CHB Study
Seventy-two male Sprague-Dawley CD/IGS rats (Charles River Laboratories), 7 to 9 weeks of age, were randomized into 9 groups of 8 rats each. Each animal received a single, subcutaneous injection of either saline vehicle or CHB (synthesized by Chemir Analytical Services, Maryland Heights, MO) at 50 or 150 mg/kg. At nonterminal blood collections, approximately 0.5 ml of whole blood was collected under isoflurane anesthesia and submitted for serum separation to measure amylase, lipase, or miRNAs (Table 2).
Dose groups and time lines for CHB study.
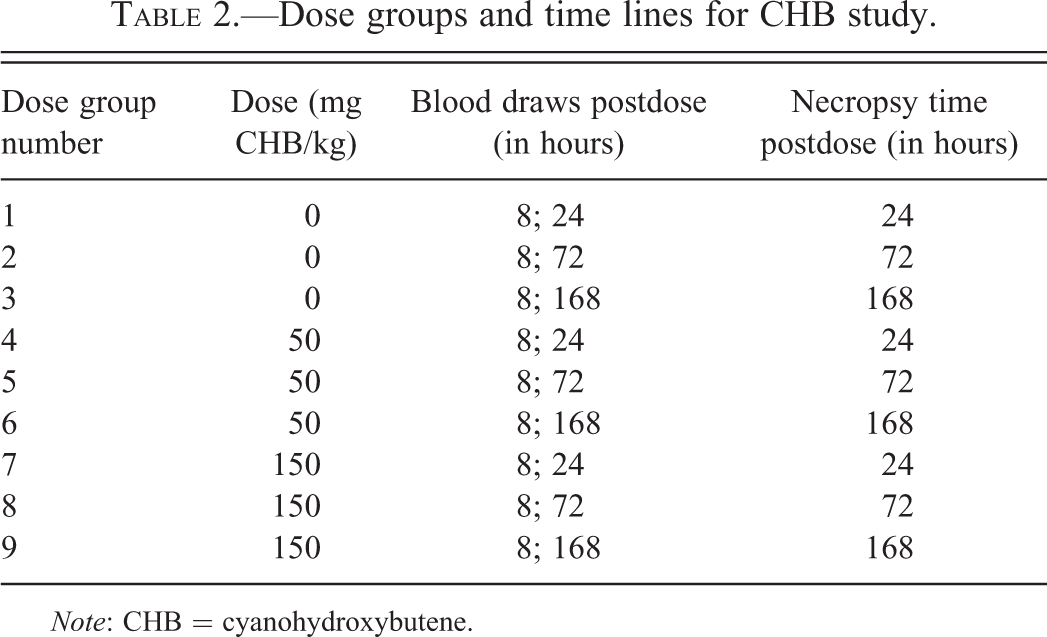
Note: CHB = cyanohydroxybutene.
Clinical observations were done before dosing and approximately 1 and 4 to 6 hr postdose, and twice daily on nondosing days, once in the morning and again in the afternoon. Animals were euthanized at the indicated intervals via carbon dioxide followed by cervical dislocation and exsanguination.
A gross necropsy was performed on each animal. Pancreata were dissected, fixed, processed, sectioned, and stained identically to the cerulein study. Sections of liver for selected animals were also obtained and prepared for microscopic examination. Pancreatic sections were examined microscopically. Microscopic findings were scored on a severity scale of 1 to 4, 1 being the most minimal change and 4 reserved for the most severe changes.
MiRNA Methods
RNA isolation: RNA was isolated using the miRNeasy Mini Kit (217004, Qiagen). The protocol for isolation of cells was followed beginning at addition of the QIAzol directly to the 250 μl serum for the cerulein samples and 100 μl of serum for the CHB samples (step 2 of the protocol). Elution was conducted with 80 μl of 95°C water.
Reverse transcription (RT): RT was executed using the TaqMan miRNA Reverse Transcription Kit (4366596, Life Technologies) exactly according to the product insert. Each RT reaction contained only 1 RT primer. Each RNA was diluted 1:10 and reverse transcribed to ensure that dilutional linearity was observed at the RT step. According to the study protocol, the cDNA was diluted 1:16 with water.
Real-time PCR: PCR reactions were prepared in a 384-well format analyzing 3 miRNAs against the sample cDNAs in triplicate and using 5 μl of cDNA into a total 20 μl reaction volume. Life Tech Real Time assays and TaqMan Universal Master Mix II (Life Technologies) were utilized for PCR. See Table 3 for assay IDs.
Analysis: The data were analyzed with RQ Manager. A manual threshold of 0.2 relative fluorescence units (RFU) was selected, and cel-mir-55 was selected as the endogenous control. All other analysis settings were selected by default. Fold change was calculated for each sample from treated animals relative to average CT for time-matched vehicle control animals. All RNA samples were analyzed at 2 dilution levels to assure confidence in our quantitative analysis of miRNA concentrations.
Assay identification.
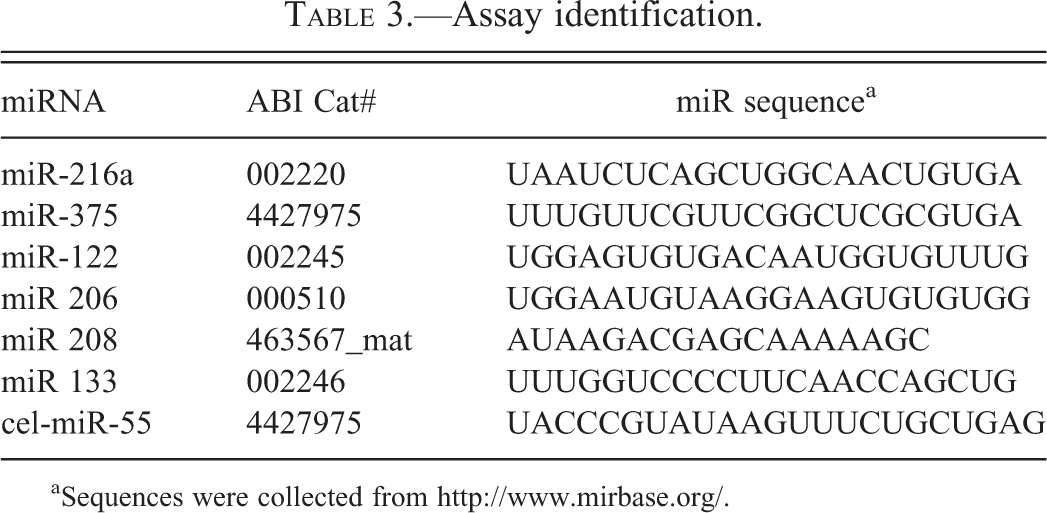
aSequences were collected from http://www.mirbase.org/.
Results
Cerulein Study
Clinical signs were noted at 50 μg/kg (group 7 only) and consisted of decreased activity, which affected 7 of 10 animals, and labored respiration and low body carriage, which were noted in a few individual animals.
There was significant variability in control animal biomarker values for all 4 inflammation biomarkers evaluated. For neutrophil gelatinase–associated lipocalin (NGAL), monocyte chemotactic protein-1 (MCP-1), and tissue inhibitor of metallopeptidase 1 (TIMP-1), the variation from the lowest value to the highest value was greater than 10-fold, and was nearly 10-fold for thrombospondin-1 (TSP-1). When all individual control values were pooled and used to evaluate individual changes in inflammation biomarkers, only increases in NGAL concentrations for 1 of the 10 animals in the 50-mg/kg dose group at the 8- and 168-hr postdose time points fell above the control range. There were no other multifold changes that appeared to have a relationship to compound administration.
Amylase and lipase generally followed the same curve, with peak values present at 4 hr, and values in the cerulein-dosed animals returning to levels similar to control animals by 48 hr (Figure 1). Hematology parameters between different time points and dosage groups were similar and therefore nondiscriminatory.
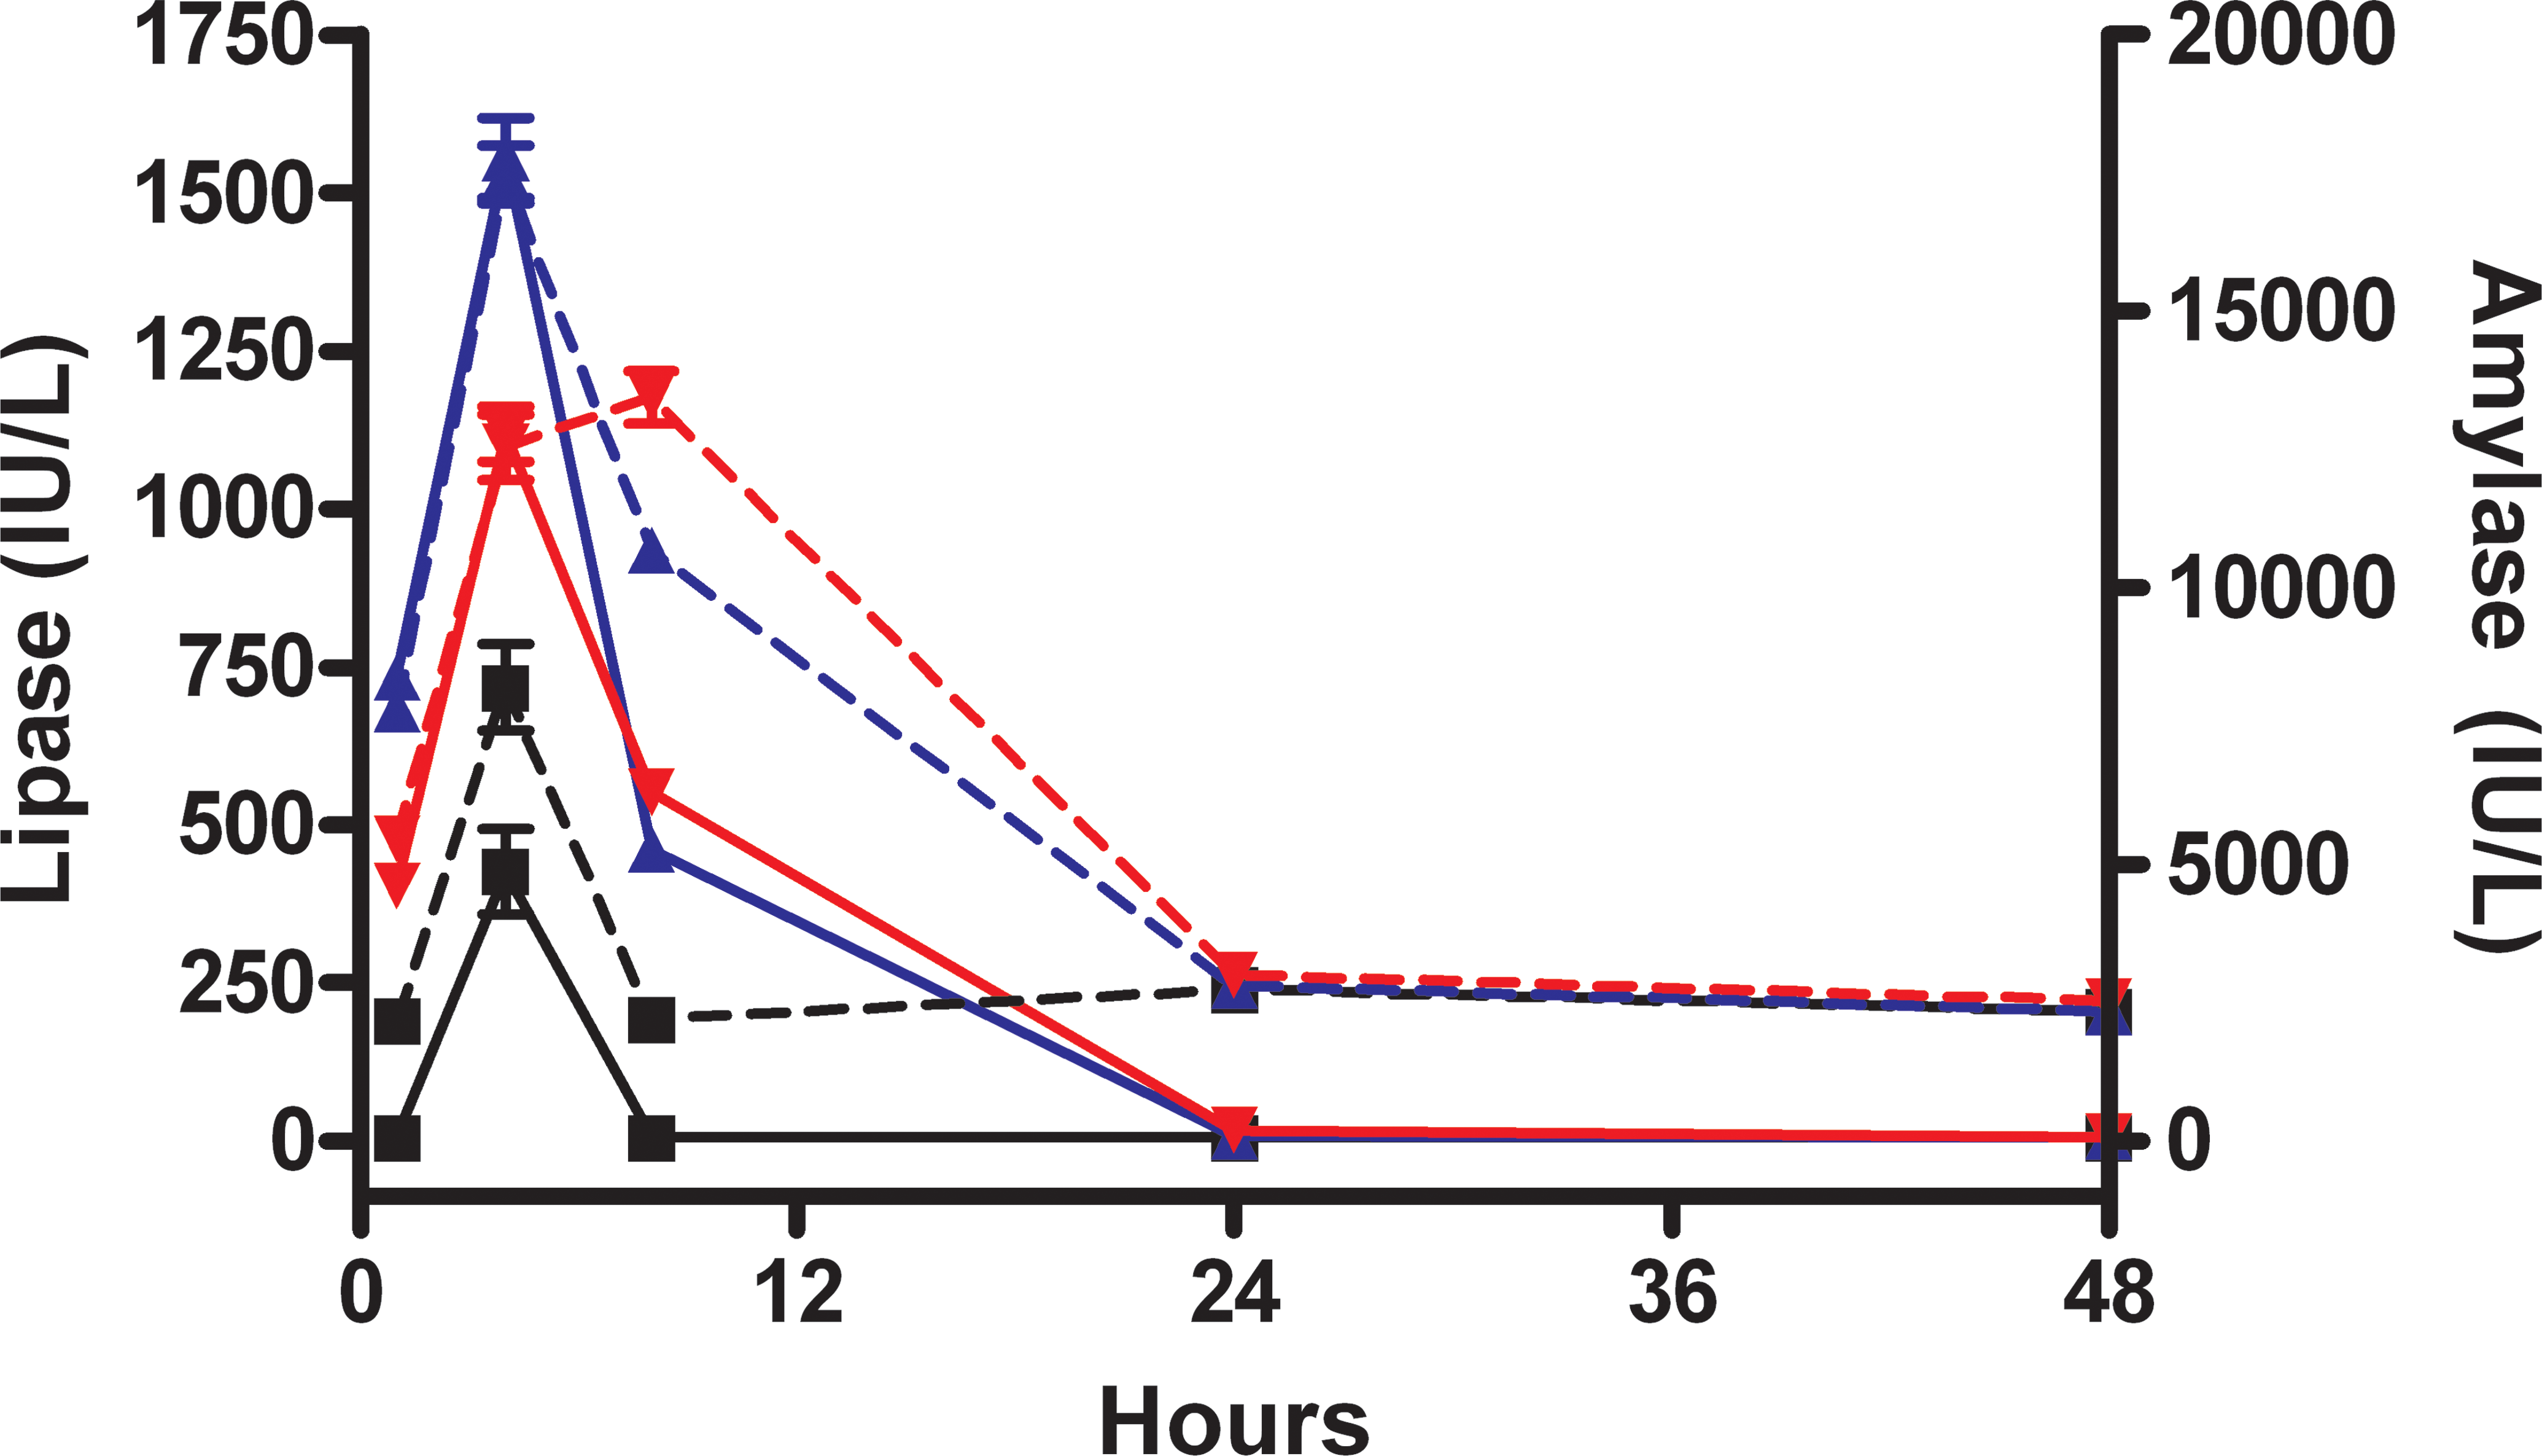
Amylase and lipase after cerulein administration. Amylase (hashed lines) and lipase (solid lines) after 3 hourly doses of cerulein at 0 µg/kg (black squares), 15 µg/kg (blue triangles), or 50 µg/kg (red inverted triangles) through 48 hr after dose administration.
Microscopic findings of interstitial edema, inflammation, and necrosis of adipocytes were most severe in animals euthanized most 24 hr after cerulein administration. Average severity scores for decreased zymogen granules, necrosis/apoptosis of acinar cells, and vacuolar degeneration of acinar cells were similar in groups euthanized 24- and 48 hr-postcerulein dosing. Inflammation was similar in groups euthanized at 48 and 168 hr, but the latter group had no vacuolar degeneration or necrosis of adipocytes in sections examined. The animals euthanized at 168-hr postdose were the only group that had pancreatic atrophy (Figures 2 and 3).
Severity scores of lesions in pancreata of rats treated with 3 consecutive hourly doses of cerulein at 0 µg/kg (hashed bars), 15 µg/kg (open bars), or 50 µg/kg (solid bars) at 24, 48, and 168 after dosing.
(A) Inflammation with lobular atrophy. Note the increased space (edema) between lobules containing inflammatory cells with the atrophied lobule in the upper center (5×). (B) Higher magnification of atrophy illustrating drop out of acini and infiltration of mononuclear cells (islet cells in upper right; 40×). (C) Apoptosis of acinar cells; arrowheads point to typical appearance (40×). (D) Vacuolar degeneration of acinar cells (10×).
Serum from rats treated with 50 μg/kg of cerulein was examined for changes in miRs-216a and 375 at 24 and 48 hr, the time points with the greatest histopathology severity scores. Both miRs were increased as compared to vehicle at 24-hr postdose while miRNA levels returned to approximately vehicle level by 48 hr. MiR-216a was increased in the serum by a greater degree than miR-375 at 24 hr, whereas only miR-375 remained elevated in rats (2 of the 10) at 48-hr postdose (Figure 4).
Cerulein biomarker data. miR-216a (black), miR-375 (red), amylase (white), and lipase (blue) at 24 hr (animals 61 to 70) and 48 hr (animals 71 to 79) in rats given three consecutive hourly doses of cerulein at 50µg/kg.
CHB Study
Mortality occurred in rats given 150 mg/kg approximately 24 hr after administration. One rat was found dead with no changes in clinical condition prior to death and another was euthanized due to signs of deteriorating condition (unkempt hair coat and dehydration) and apparent hemorrhage from the urinary tract. The cause of death or moribundity was likely due to acute hepatic necrosis (described later). Individual rats given 50 or 150 mg/kg displayed salivation, rough hair coat, and/or decreased activity within 48 hr of dosing. A trend for decreased body weights occurred in rats given CHB when compared to concurrent control animals throughout the duration of the study with correlating food consumption decreases.
Significant compound-related increases in serum lipase activity occurred in rats given 150 mg/kg compared to controls at the 8- and 24-hr time points. Minor changes in serum amylase activity were measured at 24 hr following dose administration. No changes occurred in rats given 50 mg/kg (Figure 5). There were mild elevations in blood urea nitrogen (BUN) and creatinine in a few rats given 150 mg/kg at 24 hr, but values had returned to normal at ≥72 hr. These elevations may have marginally affected amylase and lipase values in these rats at the time of measurement, but the elevations were not consistent across this dose group and not directly correlative to individual animal increases in amylase and lipase.
Amylase and lipase after cyanohydroxybutene (CHB) administration. Amylase (hashed lines) and lipase (solid lines) after treatment with CHB at 0 mg/kg (black squares), 50 mg/kg (blue triangles), or 150 mg/kg (red inverted triangles) through 72 hr after dose administration.
Dose-progressive pancreatic lesions occurred in rats administered CHB. Lesions were observed in 3 of the 8 rats given 50 mg/kg at 24-hr postdose and in 2 of the 8 rats given 50 mg/kg at 72-hr postdose. Pancreatic lesions occurred in all rats given 150 mg/kg at 24-hr postdose, in 6 of the 7 rats given 150 mg/kg examined at 72-hr postdose, and in 6 of the 7 rats given 150 mg/kg examined at 168-hr postdose. Changes consisted of interstitial edema and inflammation, cell vacuolation and degeneration, and/or necrosis. At 72-hr postdose, the severity and incidence of these changes occurred and also included lymphohistiocytic inflammation and fibroplasia with atrophy. At 168 hr following dose administration, no lesions were present among rats given 50 mg/kg; however, rats given 150 mg/kg had pronounced chronic inflammation, fibroplasia, and more extensive atrophy (Figure 6).
Severity scores of lesions in pancreata of rats treated with cyanohydroxybutene at 50 mg/kg (open bars) or 150 mg/kg (solid bars) at 24, 72, and 168 hr after dosing. Hemorrhage was observed at 72 hr in one rat treated at 150 mg/kg (not shown). All pancreata from control treated rats were normal.
Compound-related acute liver injury occurred in 3 rats given 150 mg/kg including the 2 rats that died prior to the scheduled study termination. Moderate to marked hepatocellular necrosis was present with accompanying severe increases in alanine transaminase (ALT) and aspartate transaminase (AST) activities in the third animal (24-hr postdose). Increases in serum ALT and AST activities were also evident in surviving 150-mg/kg rats at the 24-hr termination. Additionally, a few 150-mg/kg rats had compound-related adipose tissue necrosis and inflammation of epididymal fat. All other serum chemistry changes were considered incidental or background findings.
MiRs-216a, 375, and 122, along with other miRs enriched in skeletal muscle (206, 133), heart (208), and brain (124a), were measured in the serum of rats treated with 50 and 150 mg/kg of CHB (Lagos-Quintana et al. 2003; http://www.mirbase.org/). Pancreas-enriched miRs did not appear to display large increases in the 50-mg/kg treatment group at 24, 72, or 168 hr. In the 50-mg/kg group, liver related miR-122 displayed an approximate 2-fold increase in individual rats at 72 and 168 hr, but these changes were not correlative to AST/ALT measurements. In the 150-mg/kg group, miRs-216a and 375 displayed a 501- to 1,481-fold increase and a 250- to 1,519-fold increase as compared to vehicle respectively at 24 hr. MiR-216a returned to near vehicle levels at 72 and 168 hr, while miR-375 displayed increases of 5- to 24-fold at 72 hr and remained elevated in 4/7 rats at 168 hr (Figure 2). At 24 hr, rat 55 displayed microscopic liver injury and also displayed a miR-122 increase of approximately 5,000-fold while displaying AST and ALT values of 37,380 and 10,270 international unit (IU)/L, respectively. MiR-122 was also increased in rats in the 150-mg/kg group at 72 hr by approximately 2-fold in most rats, but did not display corresponding increases in AST/ALT. Rats 66, 67, 69, and 71, however, displayed both AST/ALT and miR-122 increases at 168-hr postinjection (PI). In general, all other miRs measured did not show increases above baseline, except for one 150-mg/kg CHB rat that displayed an 80-fold increase in miR-206 at 24-hr PI; skeletal muscle histopathology was not available to interrogate correlation to muscle injury (Figure 7a to c).
Cyanohydroxybutene (CHB) biomarker data. MiR-122 (black check), miR-133 (red check), miR-206 (green), miR-208 (blue check), miR-216a (black), miR-375 (red), amylase (white), and lipase (blue) in rats treated with CHB at 50 mg/kg (animals 28 to 48) or 150 mg/kg (animals 52 to 72). (A) 24 hr; (B) 72 hr; and (C) 168 hr after dosing.
Discussion
The parameters of clinical signs, hematology, and inflammation biomarkers did not have enough specificity or sensitivity to be reflective of the severity of microscopic EPIJ in either the cerulein or CHB model. Also, despite the histopathology data indicating tissue inflammation, the inflammation markers measured in the cerulein study did not increase in a correlative manner. This may be due to the nature of the injury in these models, such as a local effect lacking systemic response or the type of the cell death being primary apoptotic (Cao et al. 2007), or could be a result of nonoptimal sampling time points for measurement of these particular markers in the models. For both studies, amylase and lipase were reflective of the severity of microscopic changes at ≤24 hr, although the increase in amylase was less reflective of the magnitude of changes compared to the increase in lipase in the CHB study. At 48 hr in the cerulein study and 72 hr in the CHB study, amylase and lipase had returned to control levels in dosed animals despite persistent microscopic changes of interstitial edema, inflammation, necrosis, and degeneration, therefore making the serum enzymes less sensitive biomarkers than desired. Due to sample size limitations, serum chemistry panels including BUN and creatinine were not performed in the cerulein study, which may have been helpful in analysis of lipase and amylase levels.
Of interest in the cerulein study, 4 of the 10 group 2 (control) animals had amylase and lipase values at 4-hr PI that were similar to those for animals dosed with cerulein. In 3 of the control animals with elevated amylase and lipase the microscopic changes were restricted to the edges. Microscopic pathology in this group of control animals included interstitial edema, decreased zymogen granules, necrosis/apoptosis of acinar cells, and inflammation. The finding of inflammation in these animals may also have influenced the variability in the control range for the inflammation biomarkers. The most likely explanation for the serum enzyme and microscopic changes is mechanical trauma to the pancreas via injection of the saline into or within close proximity to the organ. Since injection location was not controlled for in the cerulein protocol, this issue should be explored in future studies by restricting IP injection to the right lower abdominal quadrant of the rats.
Cerulein is known to be an acinar cell toxicant and the difference in magnitude at 24 hr between serum miR-216a and -375 may be due to the greater miR-375 expression in islet cells than acinar cells of the pancreas, a drug-induced transcriptional increase and subsequent release into the serum, and/or by greater serum stability of miR-216a (Bravo-Egana et al. 2008). The individual animal serum miRNA responses at 24 hr were quite variable with miR-216a levels ranging from 2.8- to 90-fold as compared to vehicle with a group average of 31.7-fold above vehicle. The differences in magnitude did not appear to correlate to the histopathology severity score or amylase data on an individual animal basis, but did appear to correlate better to the lipase data (Figure 5). MiR-375 also remained elevated in select animals at the 48-hr time point in this study.
In the CHB model, amylase and lipase data correlated well with the miR changes observed in the 150-mg/kg group at 24 hr, but did not appear to correlate with the miR-375 increases at 72 or 168 hr. However, at these later time points, microscopic changes were still evident, including some single cell necrosis/degeneration, edema, and inflammation in exocrine pancreas, as well as the first evidence of fibroplasia and atrophy in exocrine pancreas. The temporal relationships of miRNAs to tissue development, neoplasia, necrosis, and modeling/remodeling are only beginning to be elucidated. In addition to the activities related to islet cell proliferation, miR-375 has been shown to be increased in pancreatic tissue of men with type 2 diabetes, especially those with amyloid deposition, considered often a more chronic type of tissue change (Zhao et al. 2010), and play a role negatively regulating cadherin-7, therefore suppressing migration and organization of chondrogenic progenitors (Song et al. 2013). Given the atrophy and subsequent fibroplastic tissue remodeling seen at the later time points in the CHB study, the persistence of miR-375 may indicate a greater association with those processes or a longer half-life of this miR. In the 150-mg/kg CHB dose group at 24 hr, rat 55 displayed both microscopic evidence of liver injury and elevated liver enzymes, and also displayed a miR-122 increase of approximately 5,000-fold. MiR-122 was also increased in rats in the 150-mg/kg group at 72 hr by approximately 2-fold in most rats, but did not display corresponding increases in AST/ALT. Rats 66, 67, 69, and 71 displayed AST/ALT increases as compared to vehicle with increases in miR-122 at 168-hr PI indicating liver injury. Therefore, liver-enriched miR-122 increases appear to correlate well with AST/ALT increases in rats in the 150-mg/kg group, supporting the published literature on miR-122 as a biomarker for liver injury.
The data from the CHB EPIJ model indicate that miRs-216a and -375 correlate well with pancreatic injury as judged by histopathology and amylase and lipase at 24-hr. MiR-375 remains elevated in the serum at 72 and 168 hr, which is not consistent with the serum enzyme biomarkers but does correlate with persistent injury and regenerative processes in the exocrine pancreas. Total miR data also support the specificity of using tissue-enriched miRs in identifying sites of injury in this model, evidenced by expected increases in pancreas- and liver-enriched miRs occurring in animals with corresponding clinical and microscopic pathology, and the lack of changes in miRs enriched in other tissues not anticipated to be affected in this model.
Data from these 2 models suggest that pancreas-enriched miRs-216a and -375 may hold promise as novel biomarkers for pancreatic injury. Further validation of these miRs as EPIJ biomarkers in rats and other nonclinical species is needed, including measuring miRs at more frequent time points, giving a range of doses of different pancreatic toxicants that elicit different grades of injury, and understanding of the temporal state of miR release to understand the predictive utility of the miRs in these models. Correlation of histopathology and other markers in different models of EPIJ may help elucidate the utility of miR216a and miR375 in this process. In addition, greater understanding of the regulation and temporal expression of miRs in normal and disease or injury states in serum and other accessible body fluids will allow us to determine their ultimate utility as clinical and nonclinical biomarkers.
Footnotes
Acknowledgments
The authors would like to thank Courtney Burch, Angela Derr, Dr. Kevin Donnelly, Tim Gartner, and Dr. April Paulman for their assistance with the study designs and reports.
The author(s) declared no potential conflicts of interest with respect to the research, authorship, and/or publication of this article.
The author(s) received no financial support for the research, authorship, and/or publication of this article.