
Abstract
Diagnosis of pancreatitis is often difficult in dogs that present with acute vomiting, anorexia, and abdominal pain, as these clinical signs may occur with a variety of other illnesses. While quantitative reference laboratory methods specific for canine pancreatic lipase are available to aid in diagnosis, results are generally not available until the next day. The objective of the current study was to validate a semiquantitative in-clinic rapid test for the measurement of canine pancreas–specific lipase (cPL) and to compare its performance to the reference lab method. Comparison of the reference method for cPL to the in-clinic assay demonstrated 96–100% agreement for canine serum samples with normal levels of cPL and 88–92% agreement for samples with elevated levels of cPL. Common interfering substances such as bilirubin, lipids, or hemoglobin had no effect on assay performance. Both within-day and day-to-day variations ranged from 10% to 20% of the calculated cPL concentration, which demonstrated a high degree of precision for the in-clinic assay. Performance of 3 lots of the in-clinic assay with the same set of canine serum samples demonstrated high assay reproducibility, with interclass correlation coefficients of ≥0.93. Results of the in-clinic cPL assay, based on both visual and calculated cPL concentrations, were consistent throughout 15 months of storage. The in-clinic test provides immediate, semiquantitative results to supplement existing pancreatitis diagnostics at the time of acute illness. Because the reference and in-clinic methods are aligned, they can be used together as an immediate aid pet-side and as a fully quantitative follow-up test at the reference laboratory.
Dogs with acute pancreatitis may present with nonspecific clinical signs, such as vomiting, anorexia, and abdominal pain, which are often associated with other types of gastrointestinal, renal, or liver diseases. 3,6 Because dogs with acute pancreatitis may be severely ill, obtaining a diagnosis and initiating immediate treatment can contribute to a more favorable outcome. An in-clinic rapid test that provides accurate, reliable results, is easy to interpret, and agrees with the quantitative reference method described in the veterinary literature could be of benefit to the practitioner in the diagnosis of pancreatitis. 4,7,8 Reference methods for the measurement of canine pancreas–specific lipase (cPL) have been available for a number of years to aid in the diagnosis of pancreatitis; however, the time required to obtain results has been incongruent with the acute, clinical needs of the patient. 7,8 The current study describes the validation and performance of a visually read, semiquantitative, in-clinic rapid test a that is based on the same enzyme-linked immunosorbent assay (ELISA) technology and monoclonal antibodies as the quantitative reference method. 4
Since pancreatic lipase is present as a continuum of concentration in the dog, a visually read result must distinguish between normal and abnormal levels, as defined by the reference method. To accomplish this, the in-clinic test incorporates a reference spot that generates a fixed color intensity regardless of the canine serum sample being tested. The reference spot color intensity is calibrated to match the sample spot color intensity of a sample containing approximately 200 μg/l cPL, as this quantitative result represents the upper limit of the normal reference interval. While values between 200 and 400 μg/l cPL are considered increased, values of 400 μg/l cPL or greater are consistent with the diagnosis of acute pancreatitis. 5 Unlike the reference spot, the color intensity of the sample spot is designed to be directly proportional to the cPL concentration present in the canine serum sample. Therefore, the results of the rapid assay are considered normal if the sample spot color intensity appears lighter than that of the reference spot. However, if the sample spot color intensity appears equal to or greater than that of the reference spot, then the results of the rapid assay are considered abnormal or elevated (Fig. 1). Given the subjective interpretation of color intensity in the sample spot relative to the reference spot, samples with cPL concentrations around the 200 μg/l cutoff could potentially be classified as either normal or abnormal.
In order to calibrate the assay, the recombinant form of the antigen (rcPL) that was developed for the reference method 1 was utilized for the present work. Briefly, the gene for canine pancreatic lipase was cloned from mitochondrial RNA that had been purified from canine pancreata. The full-length gene sequence and nucleotides for a 6-His tag were inserted into a baculovirus expression vector for protein expression in insect cells. The secreted protein was purified from culture supernatant using nickel affinity chromatography. Calibrators were prepared using purified rcPL in phosphate buffered saline (PBS; pH 7.4) containing 1% bovine serum albumin, 0.05% Tween 20, and a preservative. The calibrators were manufactured to contain 0, 100, 200, 500, and 1,000 μg/l rcPL antigen, as determined by the reference method.
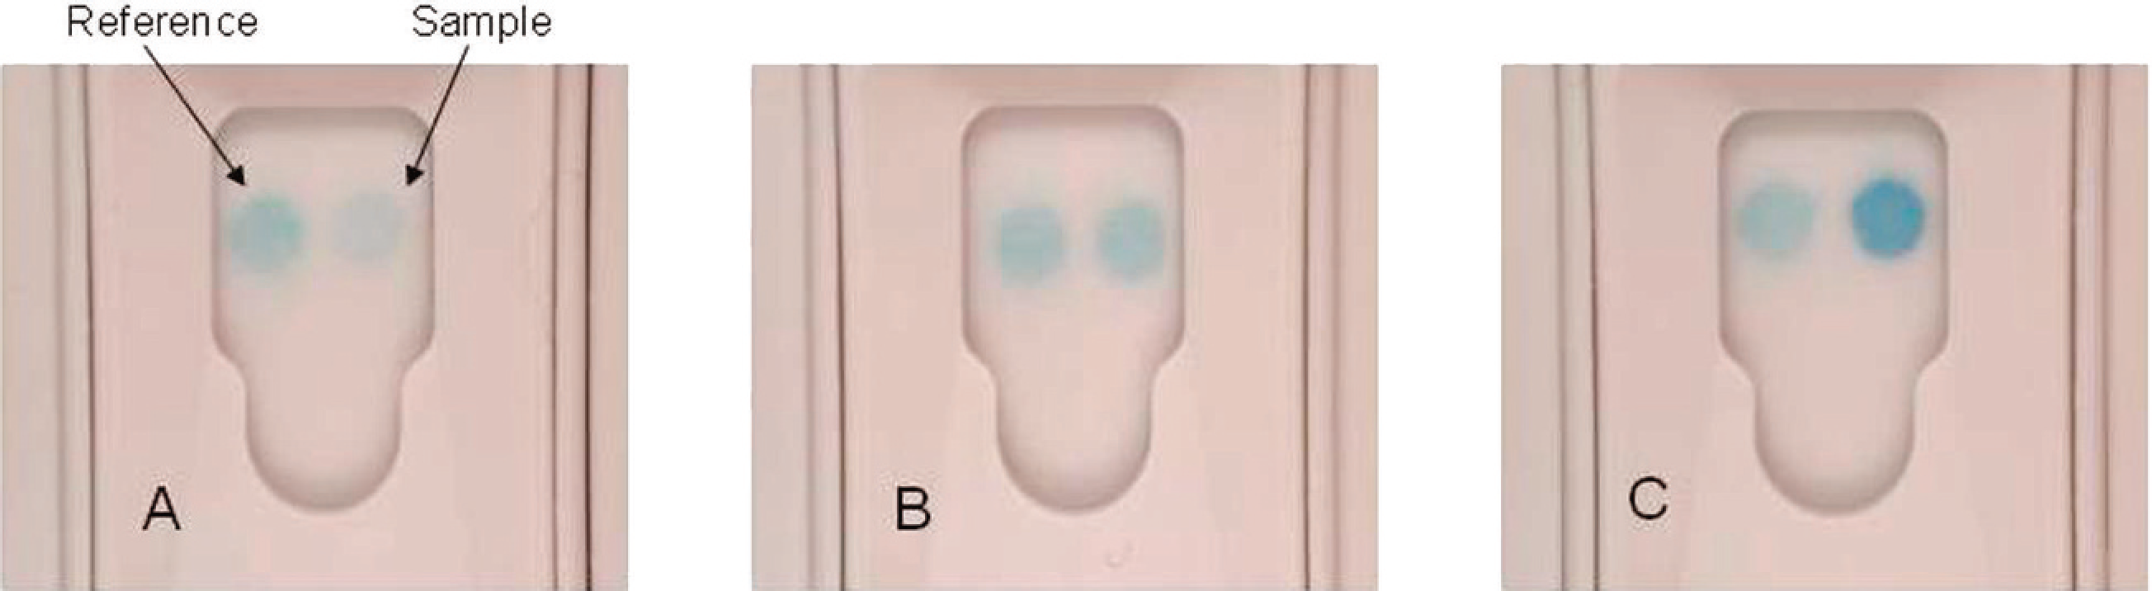
Examples of the in-clinic canine pancreas–specific lipase test results.
The in-clinic assay a uses the same 2 monoclonal antibodies to detect cPL as did the reference method that is described in the literature, one serving as a capture reagent on the solid phase and the other as a horseradish peroxidase (HRP) conjugate in the liquid phase. 1,4 The reference spot on the solid phase consists of purified chicken immunoglobulin G (IgG), which is recognized by a goat anti-chicken antiserum conjugated to HRP in the liquid phase reagents. The in-clinic assay was performed according to the manufacturer's instructions; 150 μl of canine serum is mixed with 200 μl of the liquid enzyme conjugate reagent, allowing any pancreas-specific lipase present in the canine serum to bind to the anti-cPL enzyme conjugate and to form a lipase-antibody complex. Following transfer of this mixture to the device, the mixture flows through the solid-phase support matrix and allows the lipase–antibody complex to bind to the anti-cPL sample spot on the solid phase. The goat anti-chicken enzyme conjugate present in the serum–conjugate mixture binds directly to the chicken IgG reference spot on the solid phase. When the sample and conjugate mixture reach the activation window, the device is depressed, producing a reverse flow of a wash solution followed by a substrate solution, containing 3,3′,5,5′-tetramethylbenzidine, back through the matrix. The substrate reacts with any HRP-antibody conjugate present on the solid-phase sample and reference spots to generate a blue color. Ten minutes after activation, the results are read visually.
In order to compare the qualitative results of the in-clinic assay to the quantitative results of the reference method b (performed as described elsewhere 4 ), the visual results from the in-clinic assay were converted to cPL concentrations in micrograms per liter. This was done by testing the 5 calibrators of known cPL concentration on the in-clinic assay and measuring the amount of color generated on the sample spot using a reflective densitometer. c The known cPL concentrations of the calibrators were then plotted on the X-axis against the densitometer readings on the Y-axis. The same measurements were made for the reference spot. The sample spot color intensity increases with increasing cPL concentration, while the reference spot color intensity remains constant across all cPL concentrations (Fig. 2A).
Next, the ratio of the sample spot densitometer reading to the reference spot densitometer reading was calculated. A calibration curve was constructed by plotting the known cPL concentrations of the calibrators on the X-axis against the sample spot to reference spot densitometer ratios of the calibrators on the Y-axis (Fig. 2B). A second-order polynomial trend line was fit to the calibration curve to generate a regression formula. For unknown canine serum samples, the sample spot to reference spot densitometer ratios were calculated. The ratios were then used to calculate the cPL concentrations in micrograms per liter by solving the quadratic formula using a spreadsheet. d
To determine if elevated levels of commonly occurring serum components would interfere with the visual interpretation of the in-clinic assay, the effect of bilirubin, lipid, or hemoglobin spiked into canine serum samples was evaluated. 2 Bilirubin (up to 17–19 mg/dl), e lipid (up to 7.0–7.4 optical density units at 660 nm), f and hemoglobin (up to 490–510 mg/dl) g were spiked individually in incremental concentrations into each of 3 canine serum samples with low- (<30 μg/l), mid- (200–300 μg/l), and high-range (>500 μg/l) cPL concentrations (as determined by the reference method). Each sample was also tested in the absence of interfering substances. For those samples, PBS was added in a volume equivalent to the volume of spiked interferent to compensate for dilutional effects. Each sample was tested in triplicate, and both visual results as well as the cPL concentrations in micrograms per liter were recorded. Visual interpretations and calculated cPL concentrations were unchanged relative to the control when the highest concentrations of bilirubin, lipids, or hemoglobin were tested in canine serum with low- (<30 μg/l), mid-(200–300 μg/l), and high-range (>500 μg/l) cPL concentrations (data not shown).
Precision of the in-clinic assay was determined using 5 canine serum samples with cPL concentrations of 52, 120, 337, 561, and >1,000 μg/l (as determined by the reference method). For each sample, 10 replicates were tested on each of 3 days, with both visual results and cPL concentrations recorded. Of the 150 visual results that were obtained, 149 were equivalent across all devices within and between days of testing, and the visual interpretations agreed with the corresponding reference method concentrations. One replicate of the 337 μg/l canine serum sample read visually normal on 1 test day. For each sample, the coefficient of variation (CV) was calculated for each set of 10 devices run on each of 3 days, and the CV was calculated for the 30 devices tested across the 3 days. For all 5 canine serum samples tested, within-day and day-to-day CVs of the calculated cPL concentrations were comparable (Table 1).
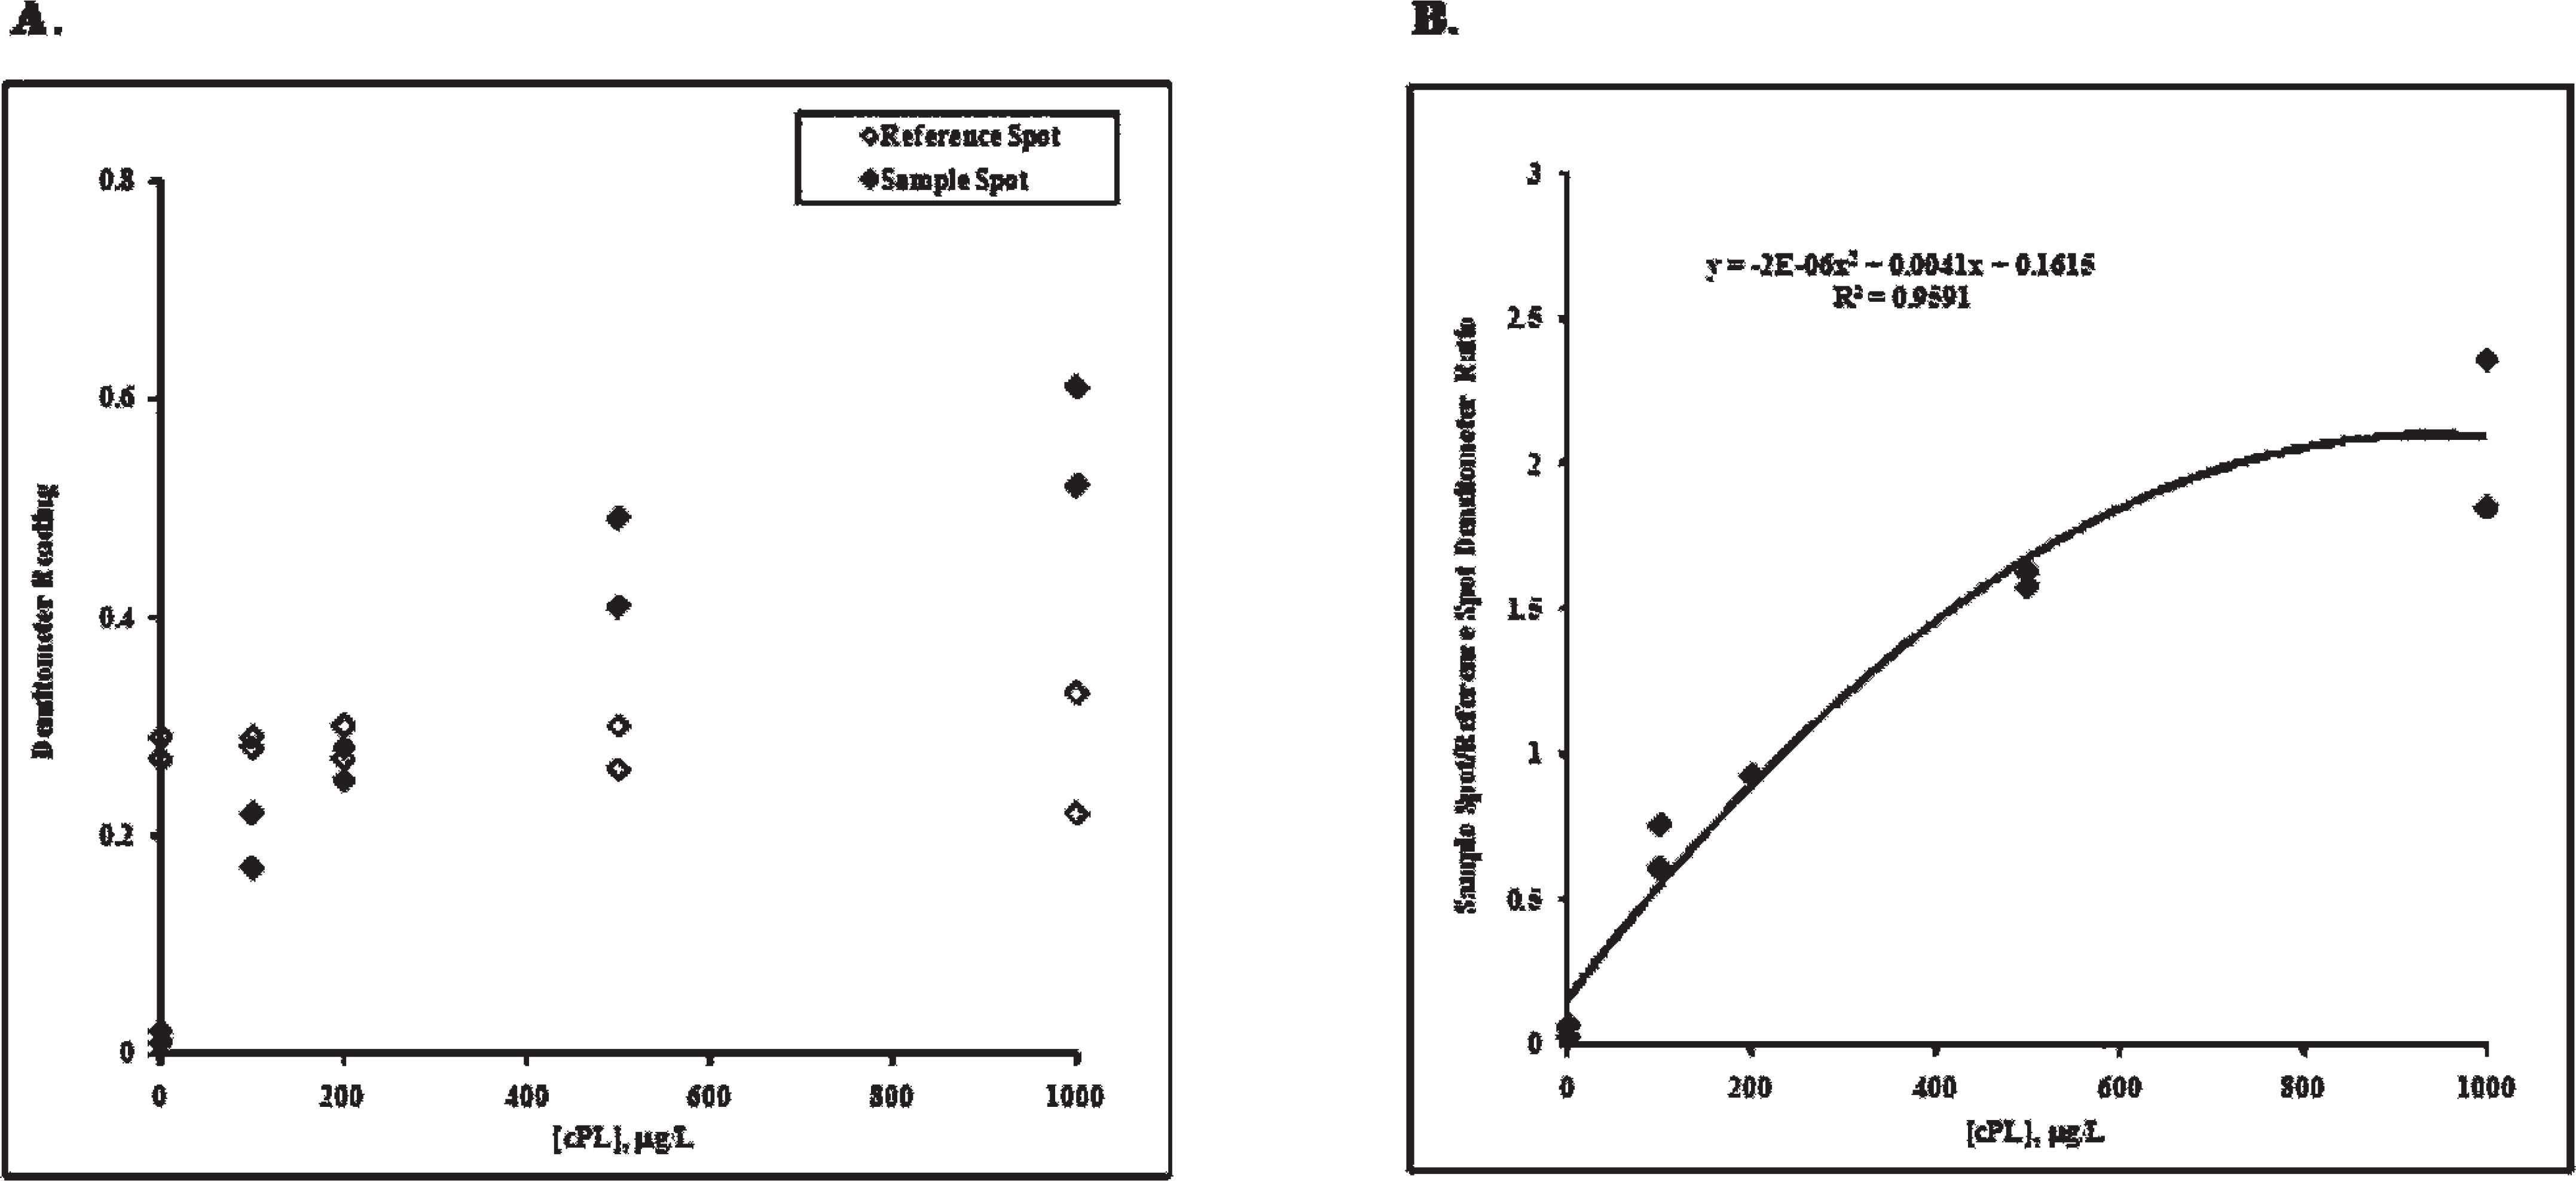
In-clinic canine pancreas–specific lipase (cPL) sample spot and reference spot densitometer readings versus cPL concentration.
To evaluate the agreement between the reference method and the in-clinic assay for cPL, a canine serum population (n = 49) was tested on both assays. The population consisted of canine serum samples with cPL concentrations equally distributed throughout the assay range. Each sample was tested in duplicate on each of 2 lots of reference method kits, with the mean of these values used as the reference result for comparison with the in-clinic assay result. The population was tested in singlet on each of 3 lots of the in-clinic assay. Comparison of visual results from the in-clinic assay to the reference method concentrations resulted in 96–100% agreement for the normal samples and 88–92% agreement for the abnormal samples (Fig. 3). Of the abnormal samples identified by the reference lab method but interpreted as visually normal on the in-clinic assay, all had calculated cPL concentrations between 203 and 270 μg/l, which is a known area of possible discrepancy due to the visual acuity between nearly identical color intensity of the sample and reference spots. One sample within this group was consistently discordant across all 3 lots of the in-clinic assay, while discordant results for the other 4 samples occurred only once per lot.
In-clinic canine pancreas–specific lipase (cPL) precision study results (10 devices per sample per day). *
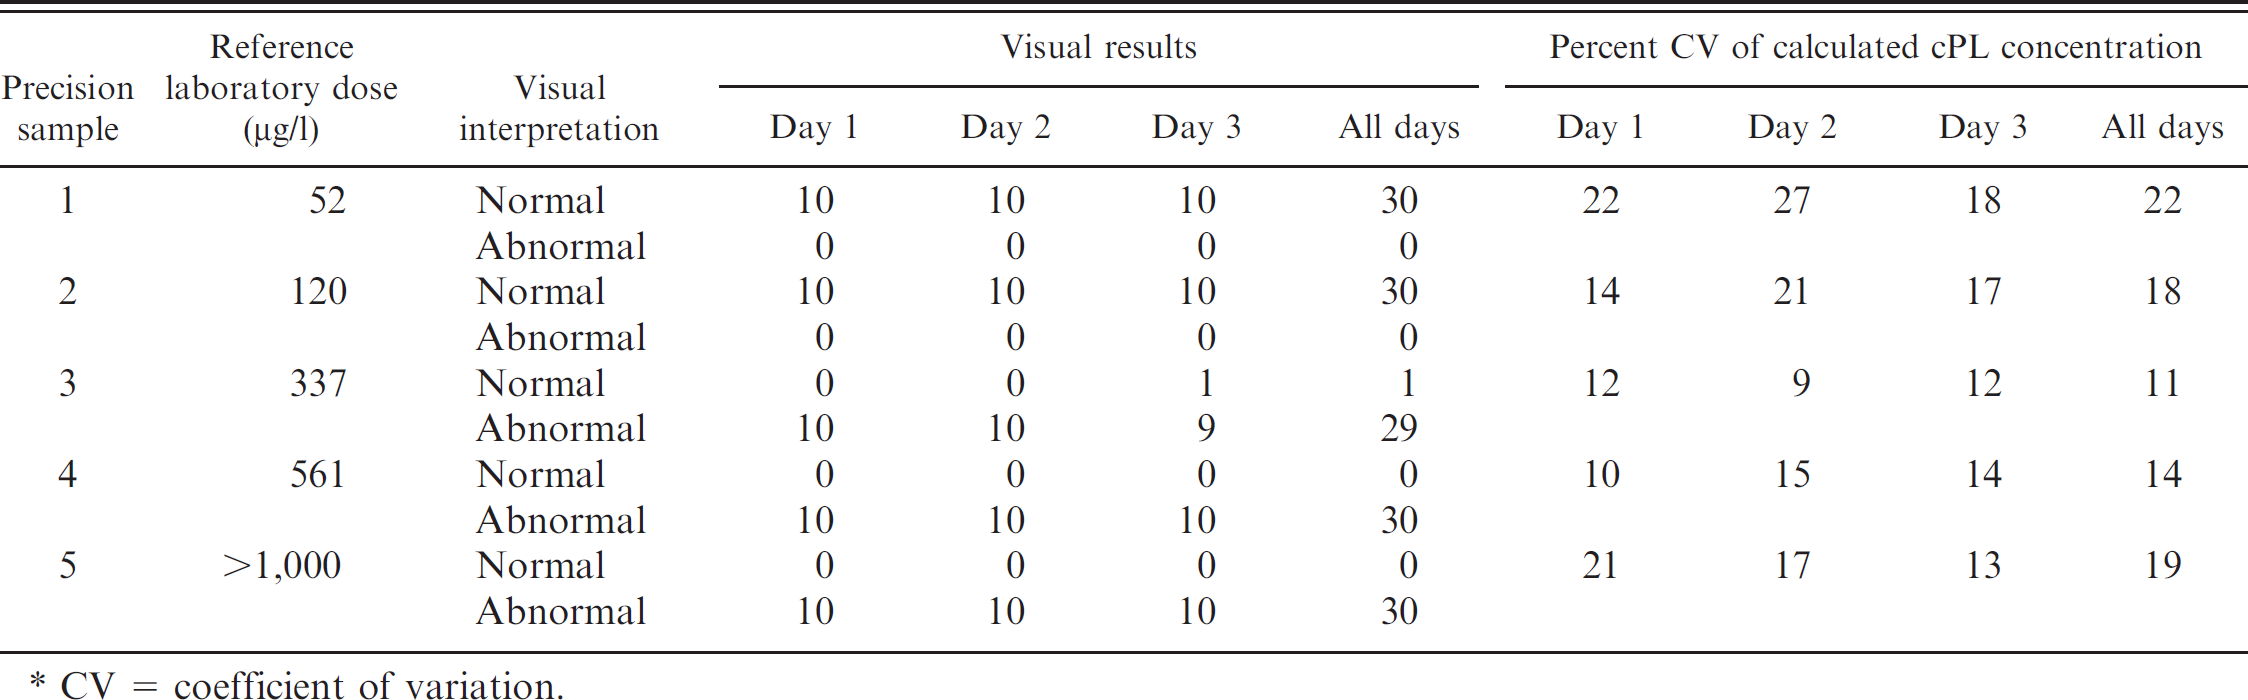
CV = coefficient of variation.
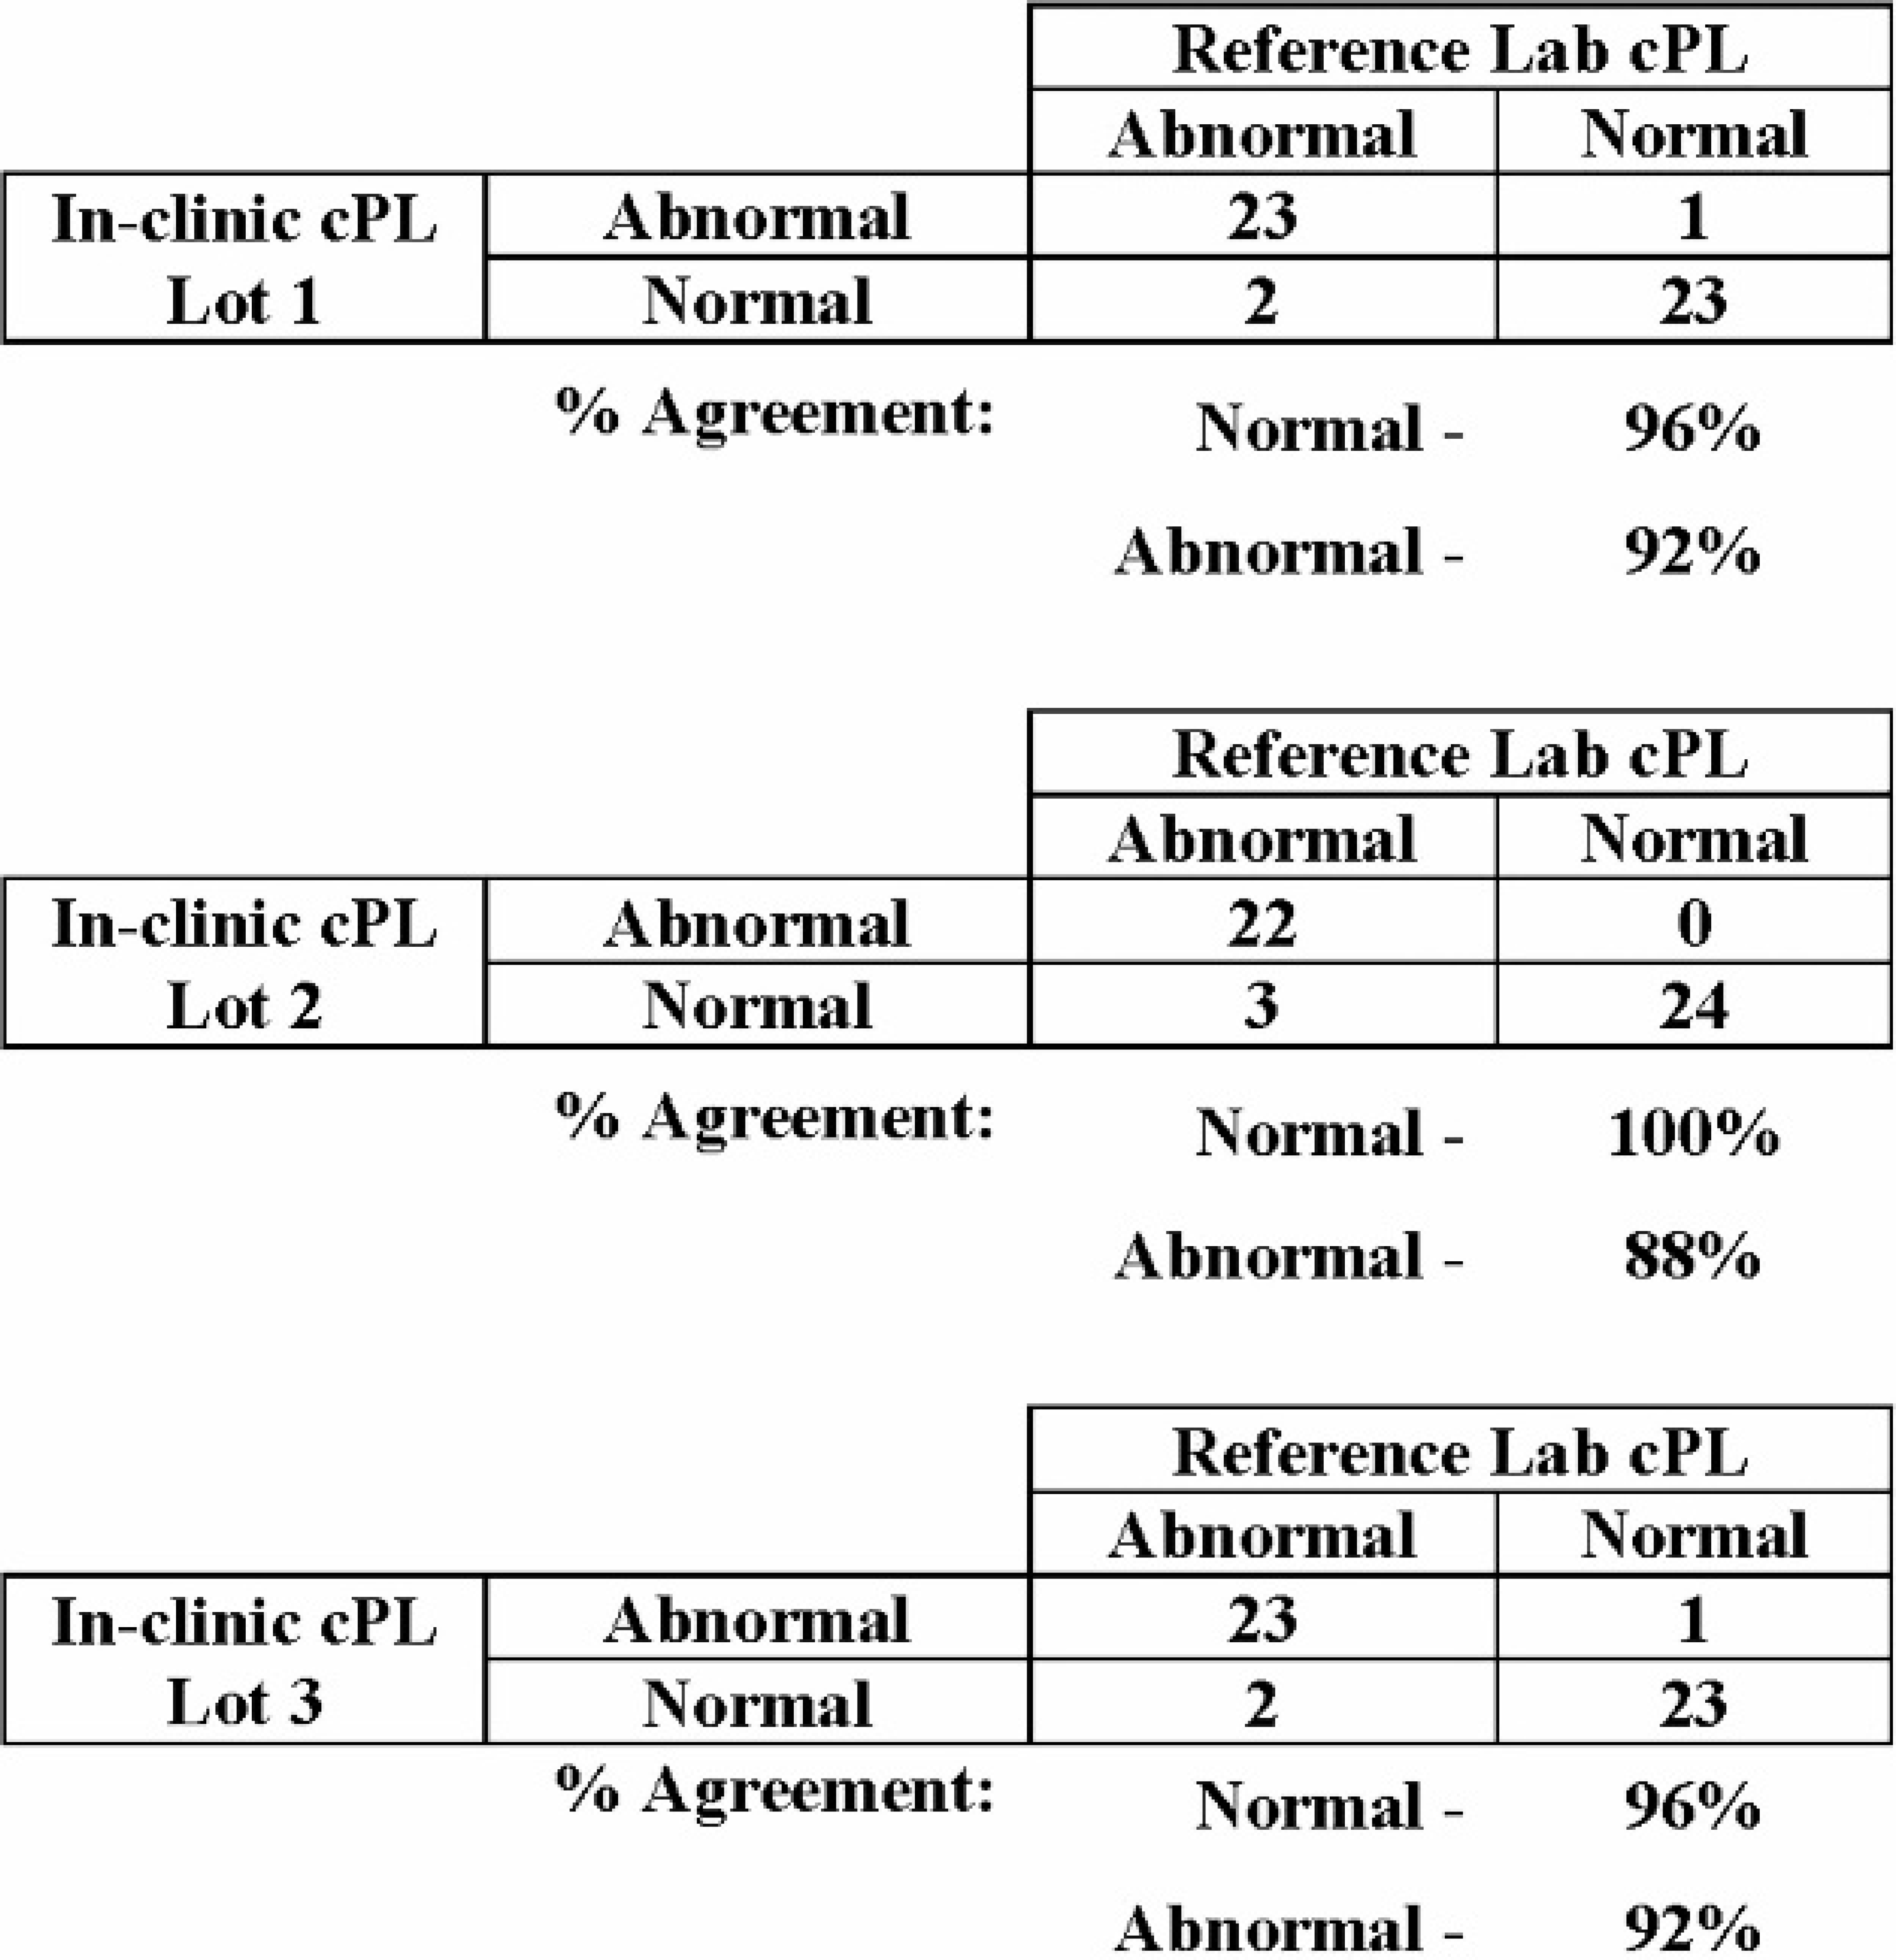
Percent agreement between in-clinic canine pancreas–specific lipase (cPL) visual results and reference laboratory cPL concentration. Comparison of visual results from each of 3 lots of the in-clinic cPL to the reference laboratory cPL concentrations for 49 canine serum samples resulted in 96–100% agreement for normal samples and 88–92% agreement for abnormal samples.
For each lot of the in-clinic assay, the calculated cPL dose values were plotted against the reference method cPL dose values. A 45° line of equality was included in the plots to assess bias. Results were distributed randomly around the 45° line, with correlation coefficients ranging from 0.920 to 0.948, indicating good agreement between the 2 test methods. A representative example for one lot is shown in Figure 4. Of the 3 samples with calculated cPL concentrations greater than 200 μg/l on the in-clinic assay, but having quantitative reference lab values less than 200 μg/l, only 1 was interpreted visually to have an abnormal level of cPL in the sample.
The same canine serum population was also used to evaluate the reproducibility of the in-clinic test. The population was tested in singlet on each of 3 lots and in duplicate on 1 lot of the rapid test. Results from multiple lots of the in-clinic assay correlated to each other, with intraclass correlation coefficients ranging from 0.930 to 0.952 and standard deviations of measurement error ranging from 30.0 to 36.4, indicating less than 7% of total variation from the measurement system (Ermer DS, Yang E-Hok R: 1997, Reliable data is an important commodity. The Standard: newsletter of the Measurement Quality Division, American Society for Quality, Winter:15–30). Results from duplicate runs within 1 lot of the in-clinic assay correlated to each other, with an intraclass correlation coefficient of 0.954 and a standard deviation of measurement error of 29.2, indicating less than 4.6% of total variation from the measurement system.
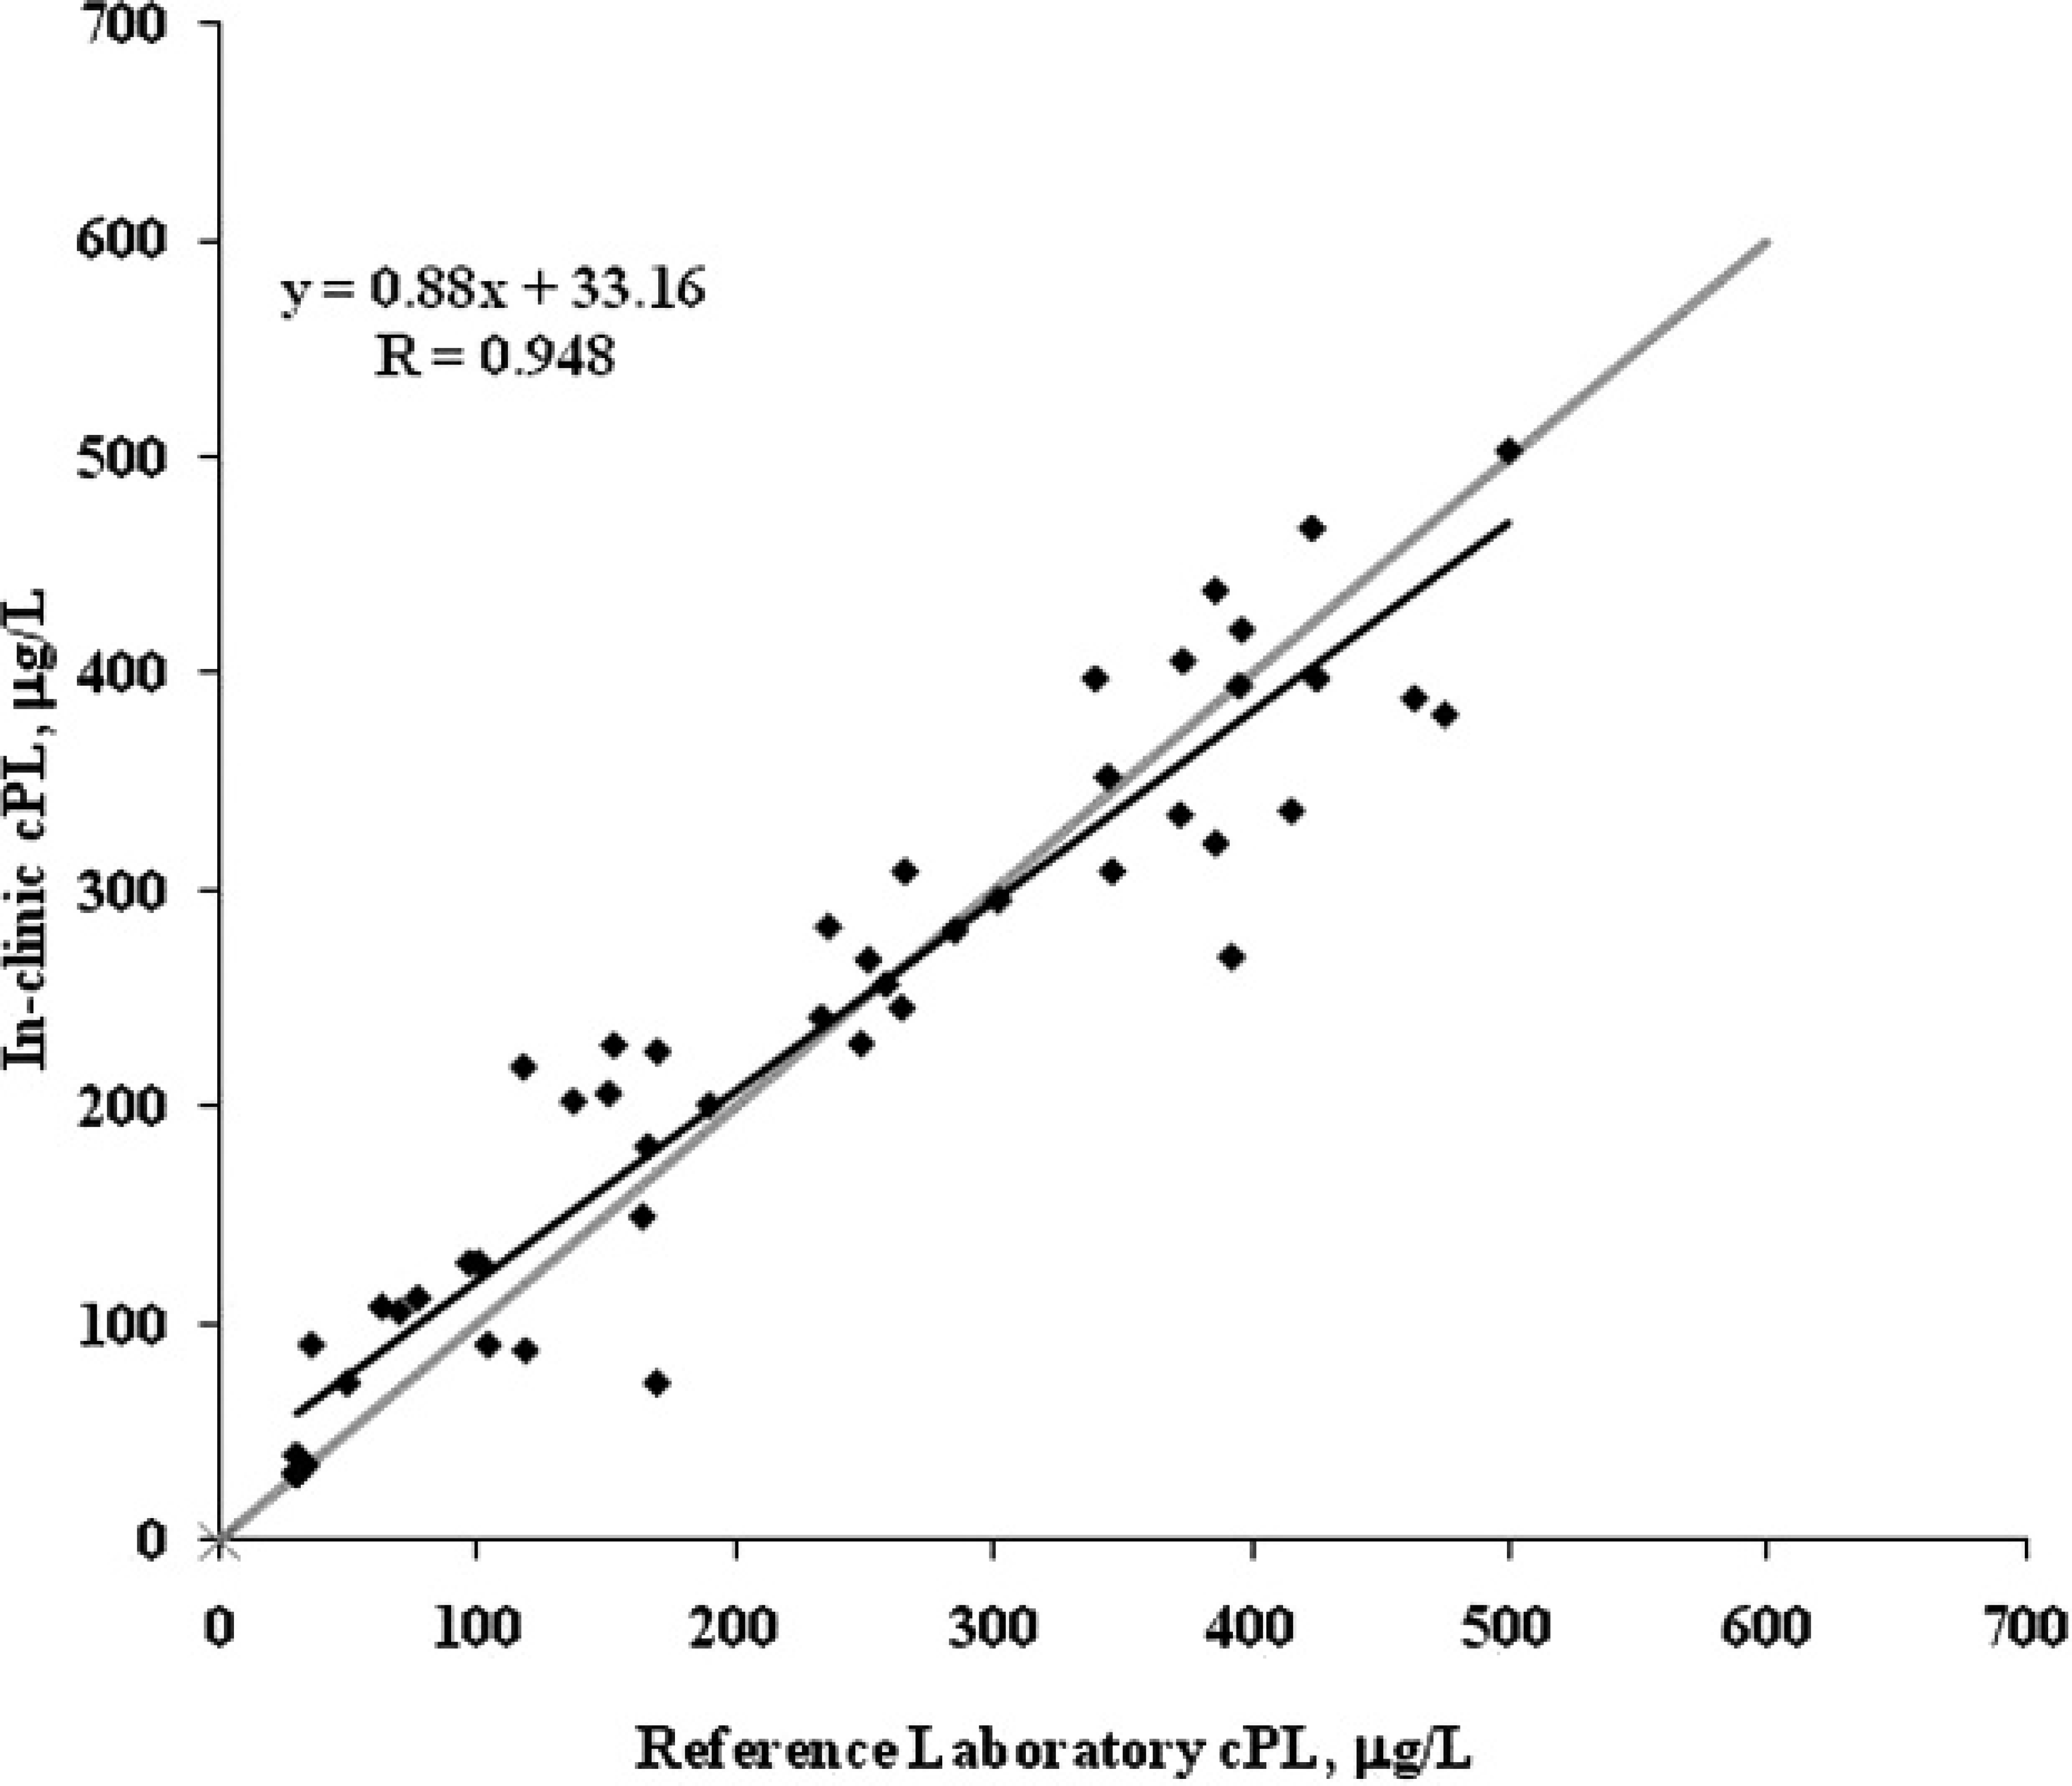
In-clinic canine pancreas–specific lipase (cPL) versus reference laboratory cPL sample correlation; n = 49 canine serum samples. The comparison between in-clinic cPL and reference laboratory cPL shows results distributed randomly around the 45° (gray) line. The trend line (black), linear equation, and correlation coefficient (R) for the samples are also shown.
The stability of the in-clinic assay at the intended storage condition of 2–7°C was evaluated by testing multiple lots at regular intervals over a period of 15 months. To establish the baseline performance, 10 replicates of the 5-calibrator standard curve and 10 replicates of 5 individual canine serum pools were tested at time zero. At 1, 2, 4, 6, 8, 10, 12, and 15 months, the calibrators and canine serum pools were tested in triplicate, and visual results were recorded. After 15 months of storage at 2–7°C, visual results were consistent with baseline results for all calibrators and canine serum pools tested (data not shown). Canine serum pools and cPL calibrators with cPL concentrations of <110 μg/l were visually normal throughout the testing. Canine serum pools and cPL calibrators with cPL concentrations of >404 μg/l were visually abnormal throughout the testing. The visual results of both the 214-μg/l canine serum pool and the 200-μg/l calibrator were split between normal and abnormal, with approximately 30% reading normal and 60% reading abnormal throughout the testing.
The validation data generated in the current study demonstrate that the visual interpretation of the in-clinic cPL test provides the practitioner with reliable information on the level (normal or abnormal) of pancreatic lipase in a canine serum sample. Of the 24 samples that measured >200 μg/l on the quantitative cPL assay, the visual interpretation on 3 lots of rapid cPL test was normal for 96–100% of the samples. Of the 25 samples that measured >200 μg/l on the reference lab cPL assay, the visual interpretation on 3 lots of the in-clinic cPL test was abnormal for 88%–92% of the samples. When 3 lots of the in-clinic assay were compared to the reference lab assay, the calculated in-clinic cPL concentrations agreed with the reference lab concentrations, and no statistical difference between the diagnostic results of 2 test methods was found.
Assessment of assay precision demonstrated that 99% of the time, the visual result was in agreement with the reference method concentration, and CVs for within-day and between-day test results were comparable. The reproducibility of the in-clinic assay was determined by testing the same 49 canine samples across 3 lots. Comparing calculated cPL concentrations from the in-clinic assay against itself (lot-to-lot and run-to-run) indicated good agreement between lots and between runs, with all intraclass correlation coefficients measuring ≥0.930. Although a small degree of variability is inherent in the assay, the overall high degree of reproducibility of the in-clinic assay helps to ensure that results are consistent and reliable.
With a cutoff value of approximately 200 μg/l, the in-clinic assay can be used as a screen for those dogs presenting with clinical signs consistent with pancreatitis. By setting the cutoff at the lower end of the indeterminate zone (200–400 μg/l) of the reference lab assay, fewer dogs with elevated cPL will be missed by the assay, as compared to a cutoff at the higher end of the range. As a screen, abnormal levels of cPL identified by the in-clinic test can be fully quantified by the reference lab ELISA to determine if the elevation is consistent with a clinical diagnosis of acute pancreatitis (>400 μg/l). 5 It should be noted, however, that when evaluating the performance of the assay around the 200-μg/l cutoff, it was found that the visual results of both the 214-μg/l canine serum pool and the 200-μg/l calibrator were split between normal and abnormal. In addition, the 5 samples determined to have abnormal levels of cPL by the quantitative reference method and normal levels of cPL based on a visual interpretation of the in-clinic method all had calculated cPL concentrations in the range of 203 to 270. Visual results for samples with cPL concentrations close to this cutoff (200 μg/l) may be more difficult to interpret because of the subjective evaluation of color intensity (see Fig. 1) and may result in greater perceived variability in assay performance.
In summary, the in-clinic cPL assay provides practitioners with a rapid, easy-to-use test for the detection of pancreas-specific lipase in dogs. The assay assists the practitioner in differentiating pancreatitis from other common causes of nonspecific clinical signs such as vomiting, abdominal pain, and anorexia. The in-clinic test has been shown to be highly reproducible and accurate, with visual results that agree with the quantitative results from the reference method. The in-clinic cPL test allows the practitioner to determine with a high degree of confidence whether the level of pancreas-specific lipase in serum is normal or abnormal and allows the practitioner to initiate additional diagnostics along with immediate treatment.
Footnotes
a.
SNAP® cPL™ Test Kit, IDEXX Laboratories Inc., West-brook, ME.
b.
Spec cPL® ELISA, IDEXX Laboratories Inc., Westbrook, ME.
c.
RCP Reflective Densitometer, Tobias Associates Inc., Ivyland, PA.
d.
Excel®, Microsoft Corp., Redmond, WA.
e.
Ditaurobilirubin, Promega Corp., Madison, WI.
f.
Intralipid, Baxter Healthcare, Deerfield, IL.
g.
Bovine hemoglobin, Sigma-Aldrich, St. Louis, MO.