
Abstract
In recent years, there has been considerable activity to identify urinary biomarkers of nephrotoxicity as noninvasive measurements with greater sensitivity and specificity than traditional biomarkers, such as serum creatinine and blood urea nitrogen. Our study aimed to use cisplatin-treated rats to evaluate the use of immunohistochemistry directed at multiple urinary biomarkers in kidney tissue. Tissue levels were compared to urinary levels of these biomarkers to demonstrate tissue specificity and sensitivity. These techniques could also be used in studies where urine samples are not available, such as retrospective studies in drug safety testing, to demonstrate the potential utility of using these biomarkers in future preclinical or clinical studies. All of the biomarkers investigated showed either an increase (kidney injury molecule [KIM-1], osteopontin [OPN], and, clusterin) or a decrease (alpha-glutathione S-transferase and trefoil factor 3) except beta 2 microglobulin (β2MG) that showed no significant changes 5 days after 1.0 mg/kg or 2.5 mg/kg cisplatin treatment. All of the biomarkers except β2MG showed utility as tissue biomarkers, but KIM-1 and OPN expression correlated closely with urinary biomarker measurements and reflect tissue damage. Future studies are needed to determine the wider application of these two markers for detecting renal toxicity following administration of other nephrotoxicants.
Introduction
The kidney is a common site for drug-induced injury and is routinely assessed during drug safety testing. Identification of drug candidates with potential safety issues early during the discovery process helps to prevent later stage attrition and the associated loss of time and investment. In the clinic, nephrotoxicity has been estimated to contribute up to 60% of all cases of acute kidney injury (AKI) in hospitalized patients, depending on the patient population and definition of AKI used (Schetz et al. 2005). Histopathological observation is considered the gold standard for diagnosing AKI but requires an invasive biopsy or is a terminal procedure when assessing whole kidneys from preclinical species. Therefore, increases in serum creatinine (Ct) and blood urea nitrogen (BUN), alongside traditional urinalysis, are typically predictors of AKI diagnosis in humans (Star 1998). These parameters are relatively insensitive and nonspecific (Bonventre et al. 2010), which makes it difficult for clinicians to diagnose injury early and intervene appropriately. Small changes in serum Ct are associated with increased risk of mortality (Chertow et al. 2005), but there is often a delay between the onset of injury and detectable increases in serum (Waikar and Bonventre 2009). In certain cancer patients, there is also secretion of Ct via the organic cation transporter 2 (OCT2; Ciarimboli et al. 2012), which further impairs the use of Ct as a biomarker of renal function.
Cisplatin is a widely used antineoplastic drug for the treatment of solid tumors. The antitumor activity is due to its ability to bind DNA and alter the secondary structure, inhibiting template function and DNA replication (Harder and Rosenberg 1970; Harder, Smith, and LeRoy 1976). However, nephrotoxicity is a well-documented adverse effect of cisplatin; this organ selectivity is thought to result from active uptake by transporters such as copper transporter 1 and OCT2 (Ishida et al. 2002; Lin et al. 2002; Ciarimboli et al. 2005). Cisplatin is also used experimentally to induce kidney damage in the proximal tubules in order to understand the mechanisms of nephrotoxicity and to identify biomarkers that have potential to translate to the clinic.
Over recent years, numerous promising biomarkers of AKI have been identified through collaborations between pharmaceutical and biotechnology industries, regulatory bodies such as the U.S. Food and Drug Administration, the European Medicines Agency (2010), and academia (Bonventre et al. 2010). Biomarkers must detect injury early (i.e., before changes are observed in serum Ct and BUN), localize the site of injury, reflect the degree of injury, and ideally be applicable to many species so that they can be used to guide drug development during preclinical safety evaluations and/or assist clinically with patient management. Noninvasive urinary biomarkers are of particular interest because urine is readily accessible and because repeated measurements can be made from individual animals/humans enabling the onset, progression, and recovery of injury to be tracked. Despite these obvious advantages of urinary biomarkers, they can only provide limited information as to where the protein originated from and can be difficult to interpret. For example, a low-urinary concentration of a biomarker (usually upregulated with damage) could indicate a healthy kidney or a complete loss of the protein with damage. Despite significant progress in identifying, validating, and utilizing urinary biomarkers in urine, there is little information for many of these on how they perform in tissue-based assays. Tissue-based biomarker assays offer the advantage that they can be carried out on retrospective samples from drug safety testing studies (or other relevant studies), where samples are usually formalin fixed, paraffin embedded, and may be archived for long periods of time. Tissue-based assays also offer the advantage that they can confirm that protein detected in urine has indeed originated from the kidney. Furthermore, they relate biomarker changes to specific sites within the kidney and particular morphological types of damage. Immunohistochemistry (IHC) assays can therefore provide complementary information to the urinary assays using corresponding antibodies.
We have previously published changes in novel urinary biomarkers following cisplatin treatment in rats (Pinches et al. 2012). The current study uses retrospective kidney samples from the same study to investigate changes in some of these proteins by IHC to determine whether these can be used to assess nephrotoxicity and to determine how well they correlate with the standard histopathology and urinary biomarker assays for the same proteins (where available). The biomarkers investigated were kidney injury molecule 1 (KIM-1), osteopontin (OPN), alpha-glutathione S-transferase (αGST), clusterin, trefoil factor 3 (TFF3), and beta 2 microglobulin (β2MG), all of which are becoming widely used as urinary biomarkers of nephrotoxicity.
Material and Method
The current study was a retrospective study using the same animals, which we have published previously (Pinches et al. 2012). All urinary data were generated in this previous study and are correlated with novel IHC data from archived formalin-fixed, paraffin-embedded kidneys in the current study.
Animals
All in vivo studies were carried out according to the Animals (Scientific Procedures) Act (1986) by UK law. Ten-week-old male Han Wistar rats were used and housed with a maximum of 5 animals per cage, subject to a 12-hr light–dark cycle. Temperature and humidity were maintained between 19°C and 23°C and between 40% and 70%, respectively. Unlimited access to RM1 (E) SQC food pellets and water was provided, except during the 6-hr urine collection period when food was temporarily withdrawn.
A total of 85 animals were randomized into 10 different experimental groups, with 5 animals per vehicle-treated group and 10 animals per cisplatin-treated group. Cis-diammineplatinum(II) dichloride (cisplatin) was purchased from Sigma (Poole, UK) and formulated in a 0.9% sodium chloride vehicle solution. On day 1, all animals received a single intraperitoneal dose of the vehicle solution or 0.1 mg/kg (low dose), 1.0 mg/kg (mid dose), or 2.5 mg/kg (high dose) of cisplatin. Doses were selected based on the results of an earlier dose range–finding study to provide pathology of low, medium, and high severity. Animals were then maintained for 5 days, 8 days, or 22 days (control and high-dose groups only). Individual 6-hr metabowl urine collections were made 4 days before dosing and 2, 4, 7, and 21 days after dosing. Following the appropriate duration of study for each group, kidneys were removed and fixed for 48 hr in 10% neutral-buffered formalin. Each kidney was dissected transversely through the papilla and embedded in paraffin.
Urinary Biomarker Analysis
Urinary biomarkers were assessed as described previously (Pinches et al. 2012). Analysis was carried out using an electrochemiluminescence-based Meso Scale Discovery (MSD) Sector Imager 6000 instrument (MSD, Gaithersburg, MD, USA). Analysis was conducted using two plate options. α-GST was assessed using the Argutus AKI test assay kit and KIM-1 and OPN using the kidney injury panel 1 assay kit (MSD), both according to the manufacturer’s instructions. Urinary and plasma Ct concentrations were measured on a Roche Modular P analyzer (Roche Diagnostics, West Surrey, UK) using the Roche Diagnostics Jaffe reaction assay kit. Levels of urinary KIM-1, OPN, and αGST were normalized against time-matched levels of urinary Ct for each animal. One-sided, two-sample t-tests were performed at the 5% significance level for each urinary biomarker and serum Ct to test for the differences between cisplatin-treated groups and day-matched vehicle controls. Differences were deemed statistically significant (at the 5% level) when p < .05.
Histopathology
Sections of 4 µm thick were cut and air-dried onto strongly adhesive slides (Leica, Germany), deparaffinized in xylene, and rehydrated to water. Tissue sections stained with hematoxylin and eosin (H&E) were examined by light microscopy and histopathological assessments made. Pathological findings were graded as 0 = no pathology, 1 = minimal, 2 = mild, 3 = moderate, or 4 = severe findings.
IHC
For IHC, 4-μm-thick tissue sections were cut and air-dried onto strongly adhesive slides, deparaffinized in xylene, and rehydrated to water. Antigen retrieval pretreatment was performed for OPN and αGST (ethylenediaminetetraacetic acid pH 8 for 2 min at 110°C) and for TFF3 and β2MG (citrate pH 6 for 2 min at 110°C) using a RHS-2 Rapid histoprocessor (Milestone, Sorisole, Italy). No antigen retrieval was required to detect either KIM-1 or clusterin. All immunostaining were carried out at room temperature using a Labvision autostainer (Labvision, Fremont, CA, USA). Incubation was perfomed with 3% H2O2 (10 min) to quench the endogenous peroxidase activity before nonspecific antibody binding was minimized using background blocker with casein (Biocare LLC, Concord, CA; 20 min). Sections were incubated for 1 hr with antibodies raised against KIM-1 (rabbit immunoglobulin G [IgG]; 1:400; R & D Systems), OPN (rabbit IgG; 1:100; IBL Co., Ltd., Japan), αGST (rabbit IgG; 1:1,000; Argutus Medical, Dublin, Ireland), clusterin (goat IgG; 1:100; R & D Systems, Abingdon, UK), TFF3 (rabbit IgG; 1:300; BIOSS Inc.), and β2MG (rabbit IgG; 1:200; Lifespan Biosciences, Seattle, WA). Immunoreactivity was detected and visualized using the X-Cell Plus Universal Polymer HRP kit or Goat HRP-Polymer kit (Biocare LLC) and liquid stable 3,3′-diaminobenzidine (DAB; Biocare LLC; 10 min) before the sections were counterstained using Carazzi’s hematoxylin (Clin Tech Ltd, Guildford, UK; 1 min). Sections were dehydrated in ethanol, cleared in xylene, and coverslips mounted on the slides using histomount (TAAB Labs, Aldermaston, UK). Rabbit and goat isotype controls (Dako, Denmark) were used as a negative control.
Image Analysis
Images of whole kidney sections were captured using a ScanScope Scanner and analyzed using ImageScope software (Aperio Technologies Incorporated, Vista, CA). Thresholds were set to detect DAB positivity, and the kidney sections analyzed to determine the proportion of positive pixels for each biomarker. Prior to statistical analysis, the proportion of positive pixels was transformed using the Arcsine transformation. One-sided, two-sample t-tests assuming unequal variances were performed at the 5% significance level to test for increases (for KIM-1 and OPN) and decreases (for αGST) in cisplatin-treated groups compared to day-matched vehicle controls. Differences were deemed statistically significant (at the 5% level) when p < .05.
Receiver Operating Characteristic (ROC) Curves
ROC curves were created to determine the performance of the biomarker (sensitivity and specificity) using Analyse-it software (Leeds, UK). For each biomarker, the area under the curve (AUC) was calculated and compared using the method described by DeLong, DeLong, and Clarke-Pearson (1988). The presence or absence of proximal tubule necrosis was used as the classifier.
Urine and IHC Data Correlations
These correlations were performed using a standard Pearson correlation method using TIBCO Spotfire® software.
Results
Representative H&E images of kidneys from vehicle-treated and 2.5 mg/kg cisplatin-treated rats are shown in Figure 1. There were no major abnormalities in kidneys from control animals at any time point (Figure 1A and B). The majority of the effects of cisplatin were seen in the S3 segment of the proximal tubule in the outer stripe of the outer medulla (OSOM) and appeared in a temporal and dose-dependent manner. At 5 days, animals treated with 1.0 mg/kg cisplatin showed substantial variation in proximal tubule (S3) necrosis. This ranged from minimal in some animals where only a few necrotic tubular epithelial cells were present in very few tubules to severe, where many cells were affected in all tubules. Animals dosed with 2.5 mg/kg cisplatin showed high incidence of severe proximal (S3) tubular necrosis with low incidence of minor proximal tubular basophilia, nuclear pleomorphism, and generally mild proximal (S3) tubular regenerative hyperplasia (Figure 1C and D). Dilatation of some distal tubules and all collecting ducts were apparent with cortical distal tubular karyomegaly and vacuolation in a minority of animals. At this time, proximal tubular (S3) regenerative hyperplasia was present at a higher incidence and severity when compared with day 5. Similar histopathological features were observed after 8 days in animals treated with 2.5 mg/kg cisplatin (Figure 1E and F). However, at 8 days, most animals also displayed mild/moderate necrotic S3 proximal tubules, tubular hyaline proteinaceous contents, and necrotic cell debris. Distal tubules and collecting ducts were basophilic, indicative of regeneration, with cortical hyaline droplet degeneration present in some animals. At corresponding time points, animals dosed with 1.0 mg/kg cisplatin showed a similar incidence in all of the above pathological features but significantly reduced severity of tissue damage by comparison with that seen in animals dosed with 2.5 mg/kg, with the exception of an absence of proximal tubule (S3) vacuolation and reduced incidence and severity of proximal tubular regenerative hyperplasia. Pathological findings in animals dosed with 0.1 mg/kg cisplatin were of low incidence and severity. It is noteworthy that at this dose, at 5 and 8 days, no proximal tubular (S3) regenerative hyperplasia was apparent. At 22 days, there was recovery from most of the histological findings (data not shown).
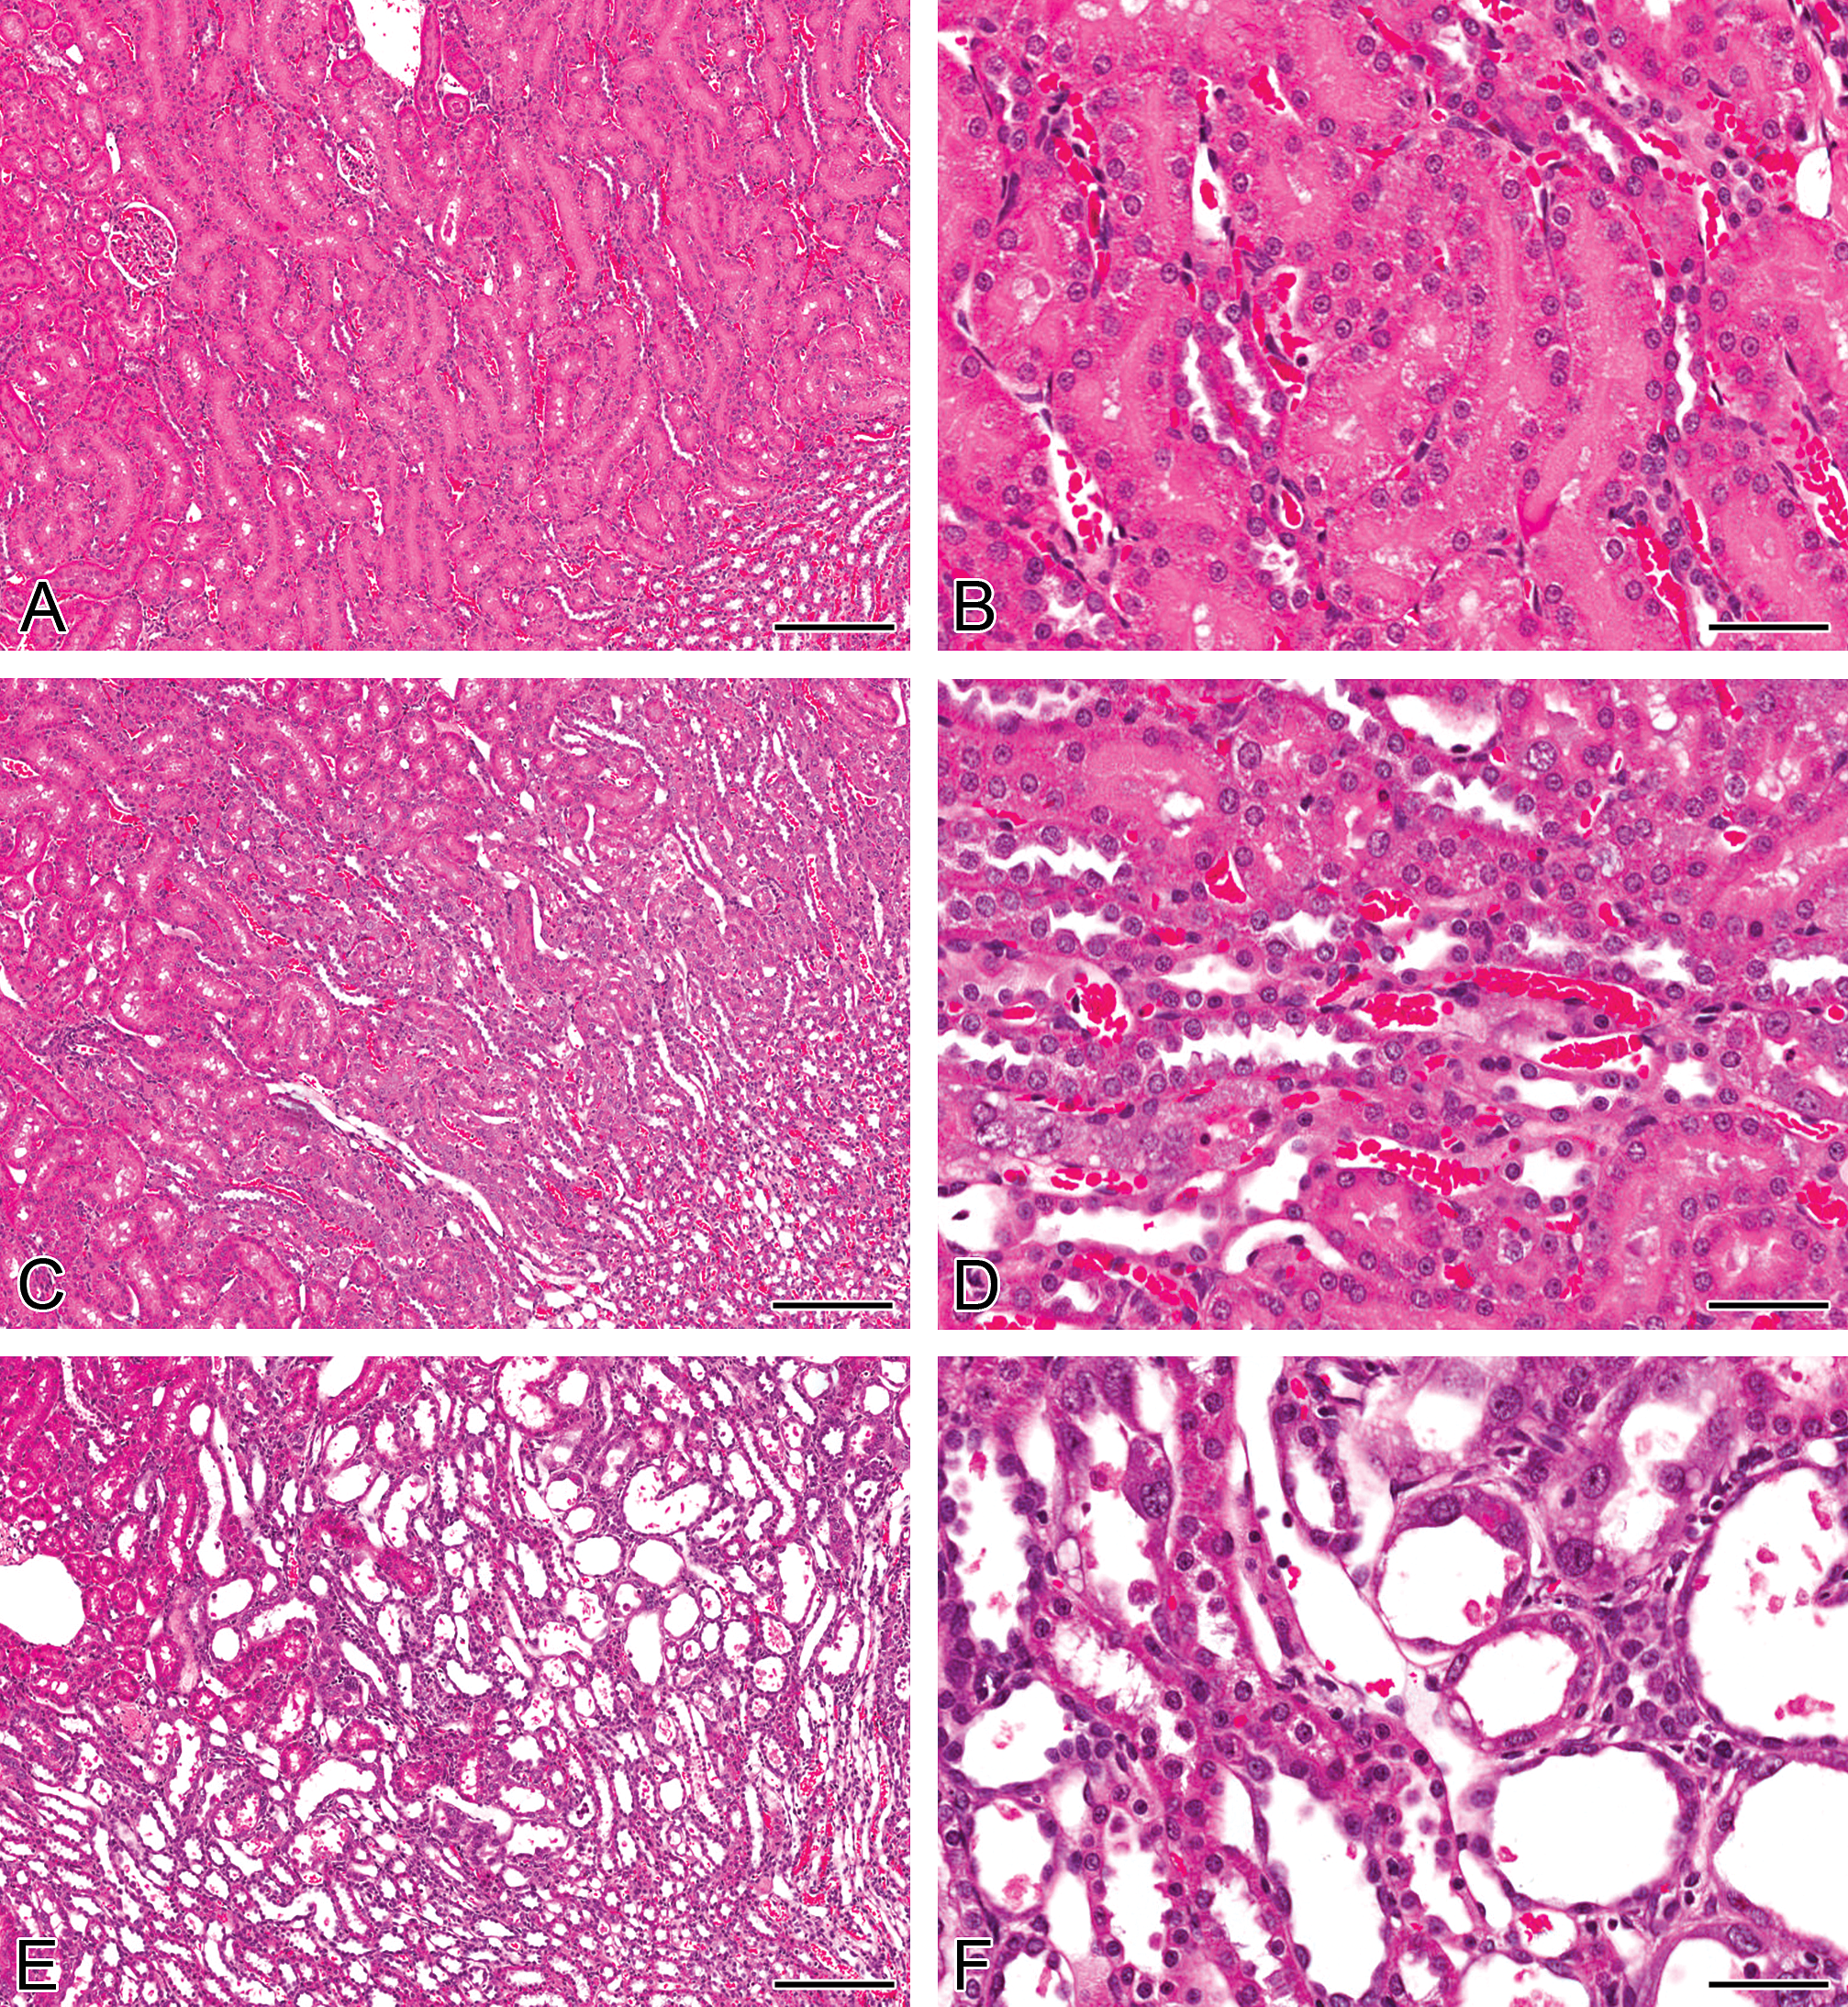
Representative H&E images of kidneys from rats treated with a single intraperitoneal dose of a vehicle (A and B) or 2.5 mg/kg cisplatin after 5 days (C and D) or 8 days (E and F). Control animal kidneys appear normal (A and B). At day 5 (C and D), the pars recta segment of the proximal tubule showed signs of tubular necrosis with some nuclear pleomorphism (karyomegaly) and mild basophilia. At day 8 (E and F), cellular necrosis and nuclear pleomorphism had greatly increased in incidence and severity. Intraluminal cellular casts were present in some tubules. There was a low severity of cortical distal tubule and collecting duct dilation and basophilia. H&E = hematoxylin and eosin. Bars = 200μm (A, C & E), 25μm (B, D & F).
KIM-1 immunoreactivity was absent in control animal kidneys except for a few kidneys where faint immunoreactivity was identified in isolated tubules (Figure 2A). Five days after cisplatin treatment, KIM-1 immunoreactivity was detected in the S3 proximal tubule brush border membranes in the OSOM on the border with the inner stripe of the outer medulla (ISOM; Figure 2B). Positive pixel analysis identified a significant increase in immunoreactivity in rats dosed with 2.5 mg/kg cisplatin compared to vehicle controls (Table 1). In the 0.1 mg/kg group, there was only the occasional positive tubule (similar to control animals). In the 1.0 mg/kg group, some animals were similar to controls, while others showed a significant proportion of positively stained S3 tubules. In the 2.5 mg/kg group, positive staining was present in both degenerative tubules and also in tubules displaying regenerative hyperplasia, although this was to a lesser extent and was generally restricted to the apical membrane of cells. Necrotic debris did not stain positive with KIM-1. Eight days after treatment, the distribution of immunoreactivity extended throughout the OSOM, with KIM-1 present on apical membranes and, to a lesser extent, in the cell cytoplasm (Figure 2C). Some intraluminal proteinaceous contents and casts also stained positive. There was a significant increase in staining in both the 1.0 mg/kg and the 2.5 mg/kg groups compared to vehicle-treated controls. Similar to day 5, positive staining was present in degenerative tubules and also tubules showing regenerative hyperplasia. At day 22, very little KIM-1 immunoreactivity was present in any dose group; there were no statistically significant changes in the amount of immunoreactivity detected (Figure 2D). This was consistent with the recovery from the kidney injury observed in H&E pathology.
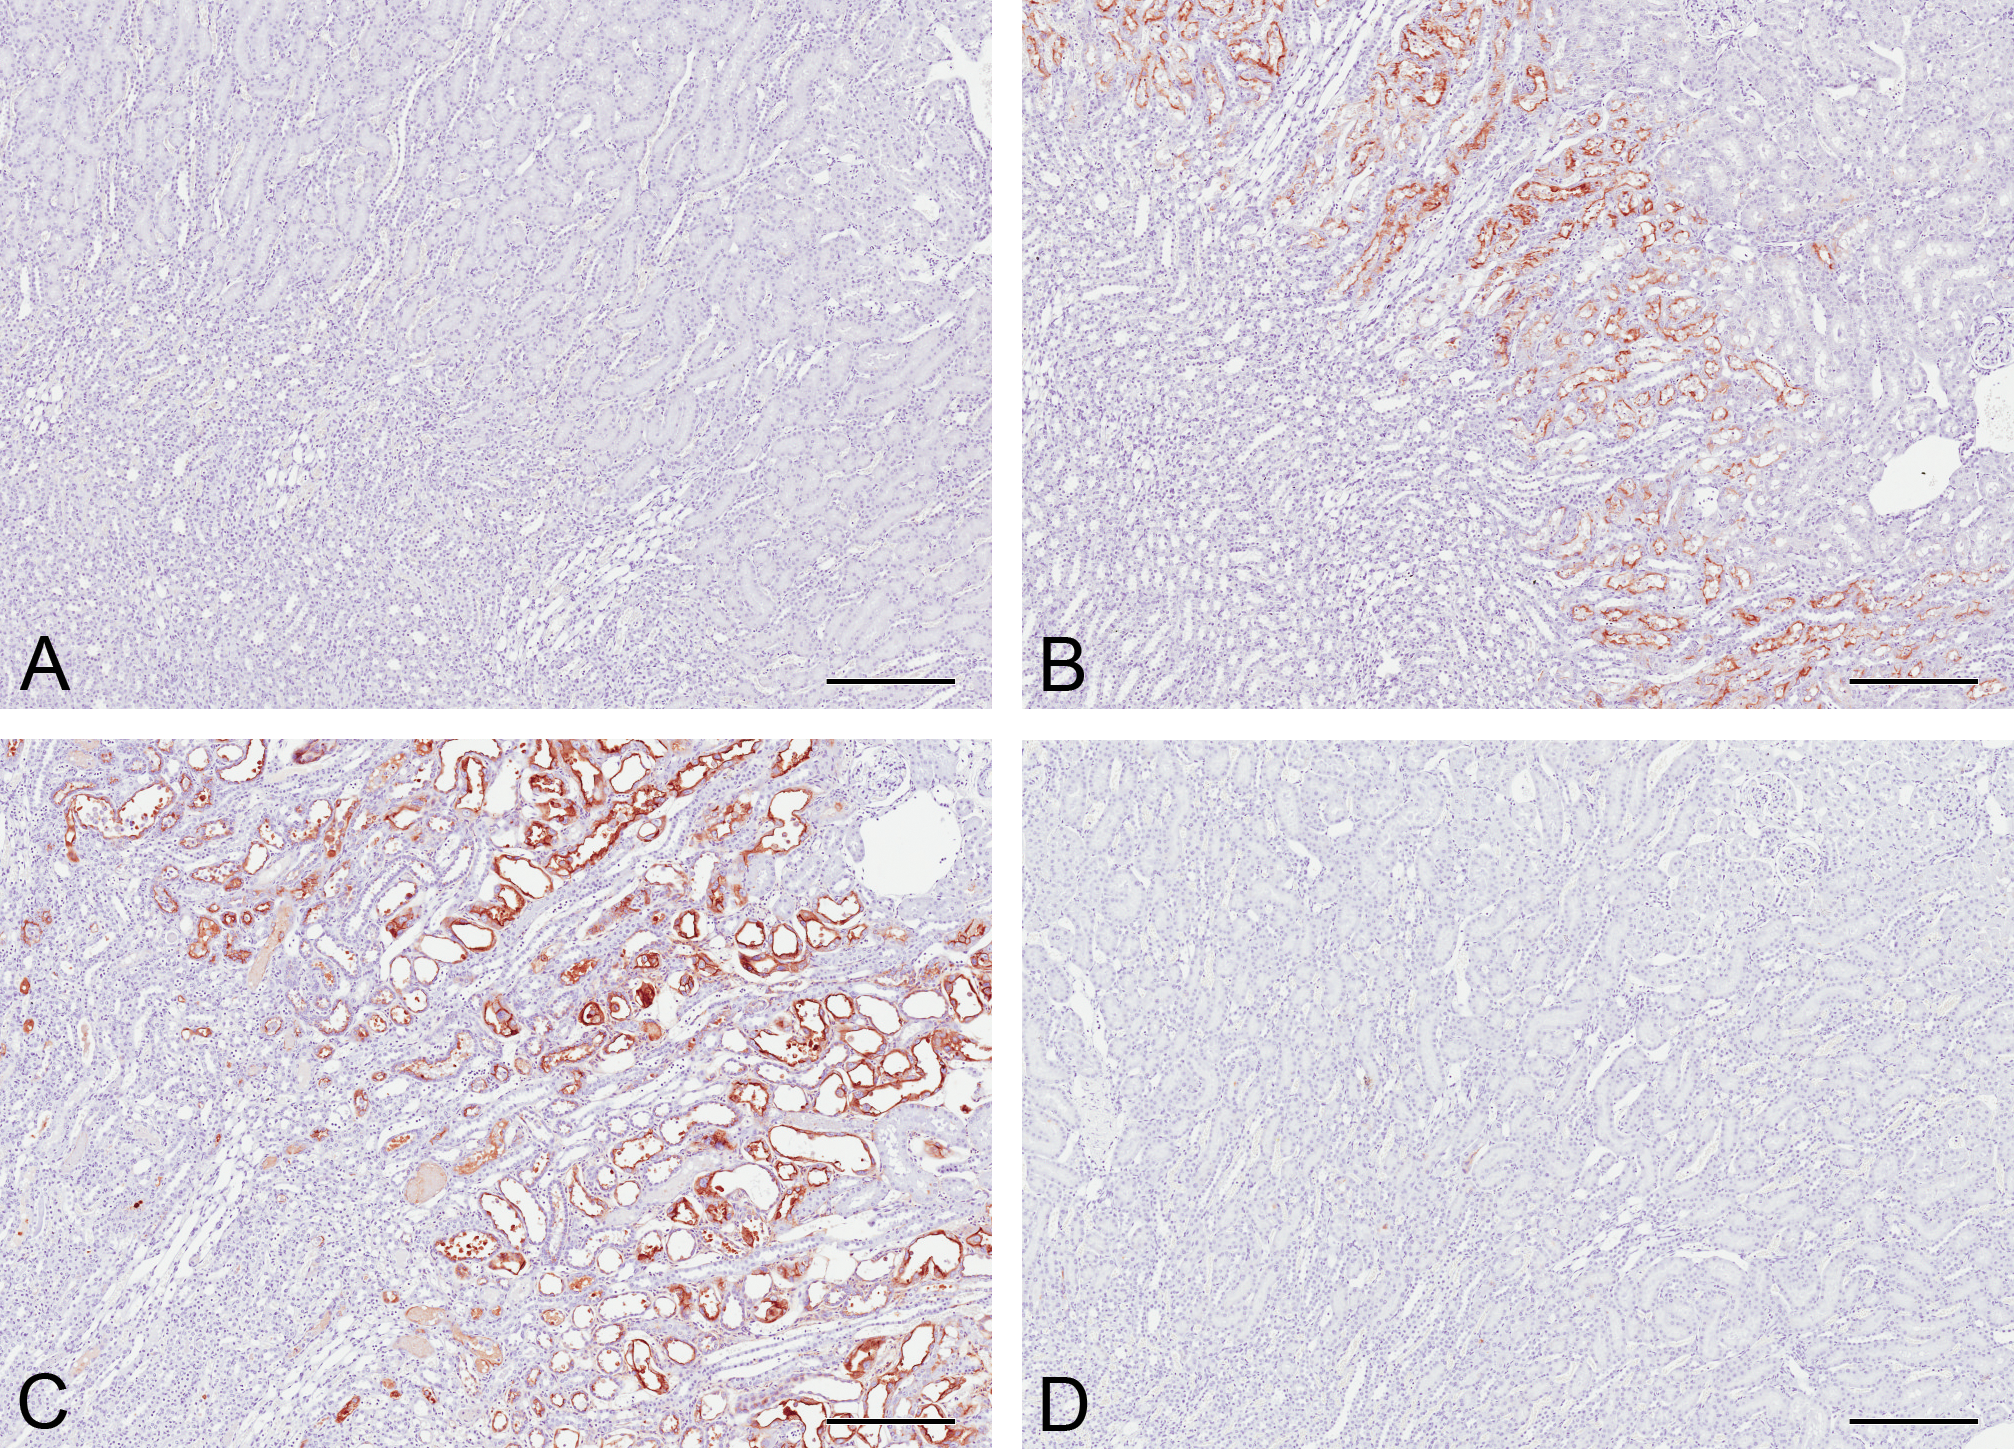
Kidney injury molecule 1 (KIM-1) immunoreactivity in the kidneys of rats treated with a single intraperitoneal dose of vehicle (A) or 2.5 mg/kg cisplatin after 5 days (B), 8 days (C), and 22 days (D). Only occasional KIM-1-positive tubules were detected in control kidneys. At day 5, KIM-1 was detected in the brush border membranes of S3 proximal tubules in the outer stripe of the outer medulla (OSOM) on the border with the inner stripe of the outer medulla. At day 8, faint KIM-1 immunoreactivity was detected in the cytoplasm of S3 proximal tubules in addition to stronger brush border immunoreactivity throughout the OSOM. Some luminal debris and proteinaceous content also stained positive. By day 22, minimal KIM-1 immunoreactivty remained. Bars = 250 μm.
Mean values for positive pixel quantification of immunohistochemistry and urinary biomarker measurements (KIM-1, osteopontin, and αGST only) in rats dosed with 0, 0.1, 1.0, or 2.5 mg/kg cisplatin over time.
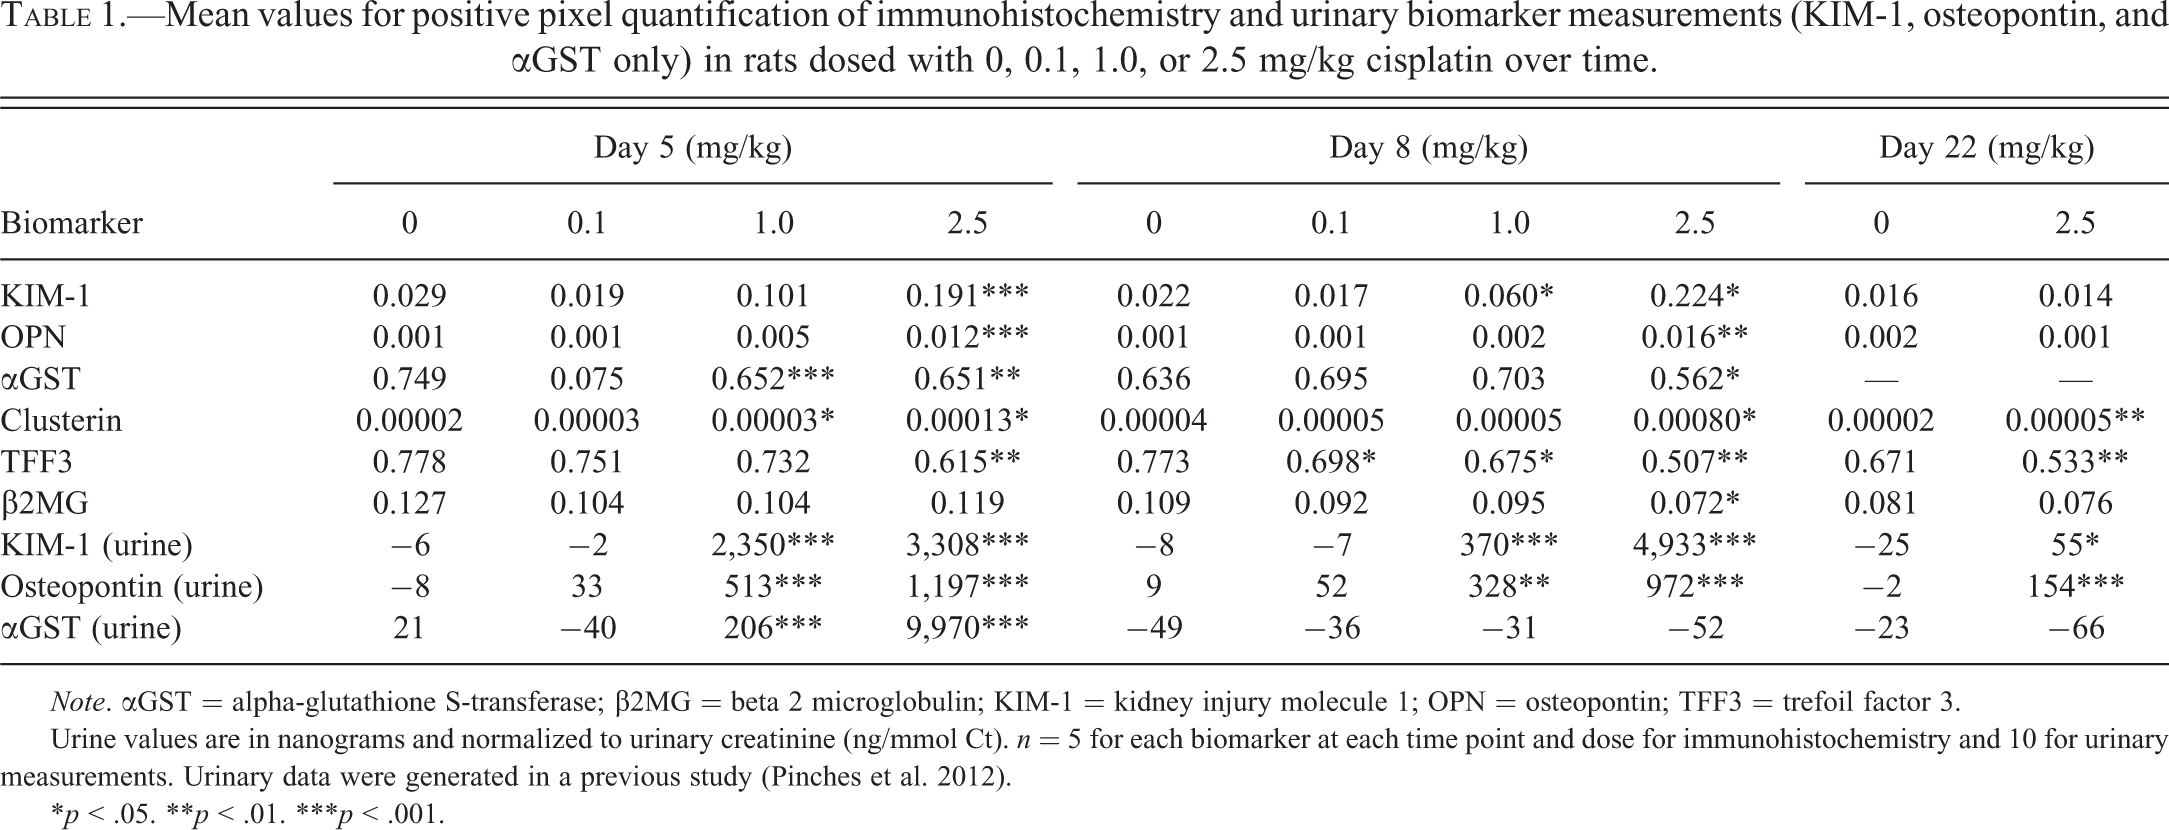
Note. αGST = alpha-glutathione S-transferase; β2MG = beta 2 microglobulin; KIM-1 = kidney injury molecule 1; OPN = osteopontin; TFF3 = trefoil factor 3.
Urine values are in nanograms and normalized to urinary creatinine (ng/mmol Ct). n = 5 for each biomarker at each time point and dose for immunohistochemistry and 10 for urinary measurements. Urinary data were generated in a previous study (Pinches et al. 2012).
*p < .05. **p < .01. ***p < .001.
In control rat kidneys, OPN was identified throughout the cytoplasm of cells in the loop of Henle, with stronger, more punctate staining found around cell nuclei (Figure 3A). At day 5, there was a significant increase in OPN immunoreactivity in rats dosed with 2.5 mg/kg cisplatin compared to vehicle controls (Figure 3B; Table 1). Immunoreactivity was increased in the loop of Henle but also became apparent in certain cell types in some cortical collecting ducts and distal tubules. There was also a very low level of cytoplasmic staining in the proximal tubules. Both the number of positive tubules and the intensity of staining increased with dose. At day 8, immunoreactivity for OPN in rats treated with 2.5 mg/kg cisplatin remained significantly increased (Figure 3C; Table 1) in the same cell types described at 5 days but with additional punctuate staining in proximal tubules. By day 22, immunoreactivity for OPN was comparable to that of controls with no significant difference (Figure 3D; Table 1). No significant increases in OPN were identified in rats treated with 1.0 mg/kg or 0.1 mg/kg cisplatin at any time point.
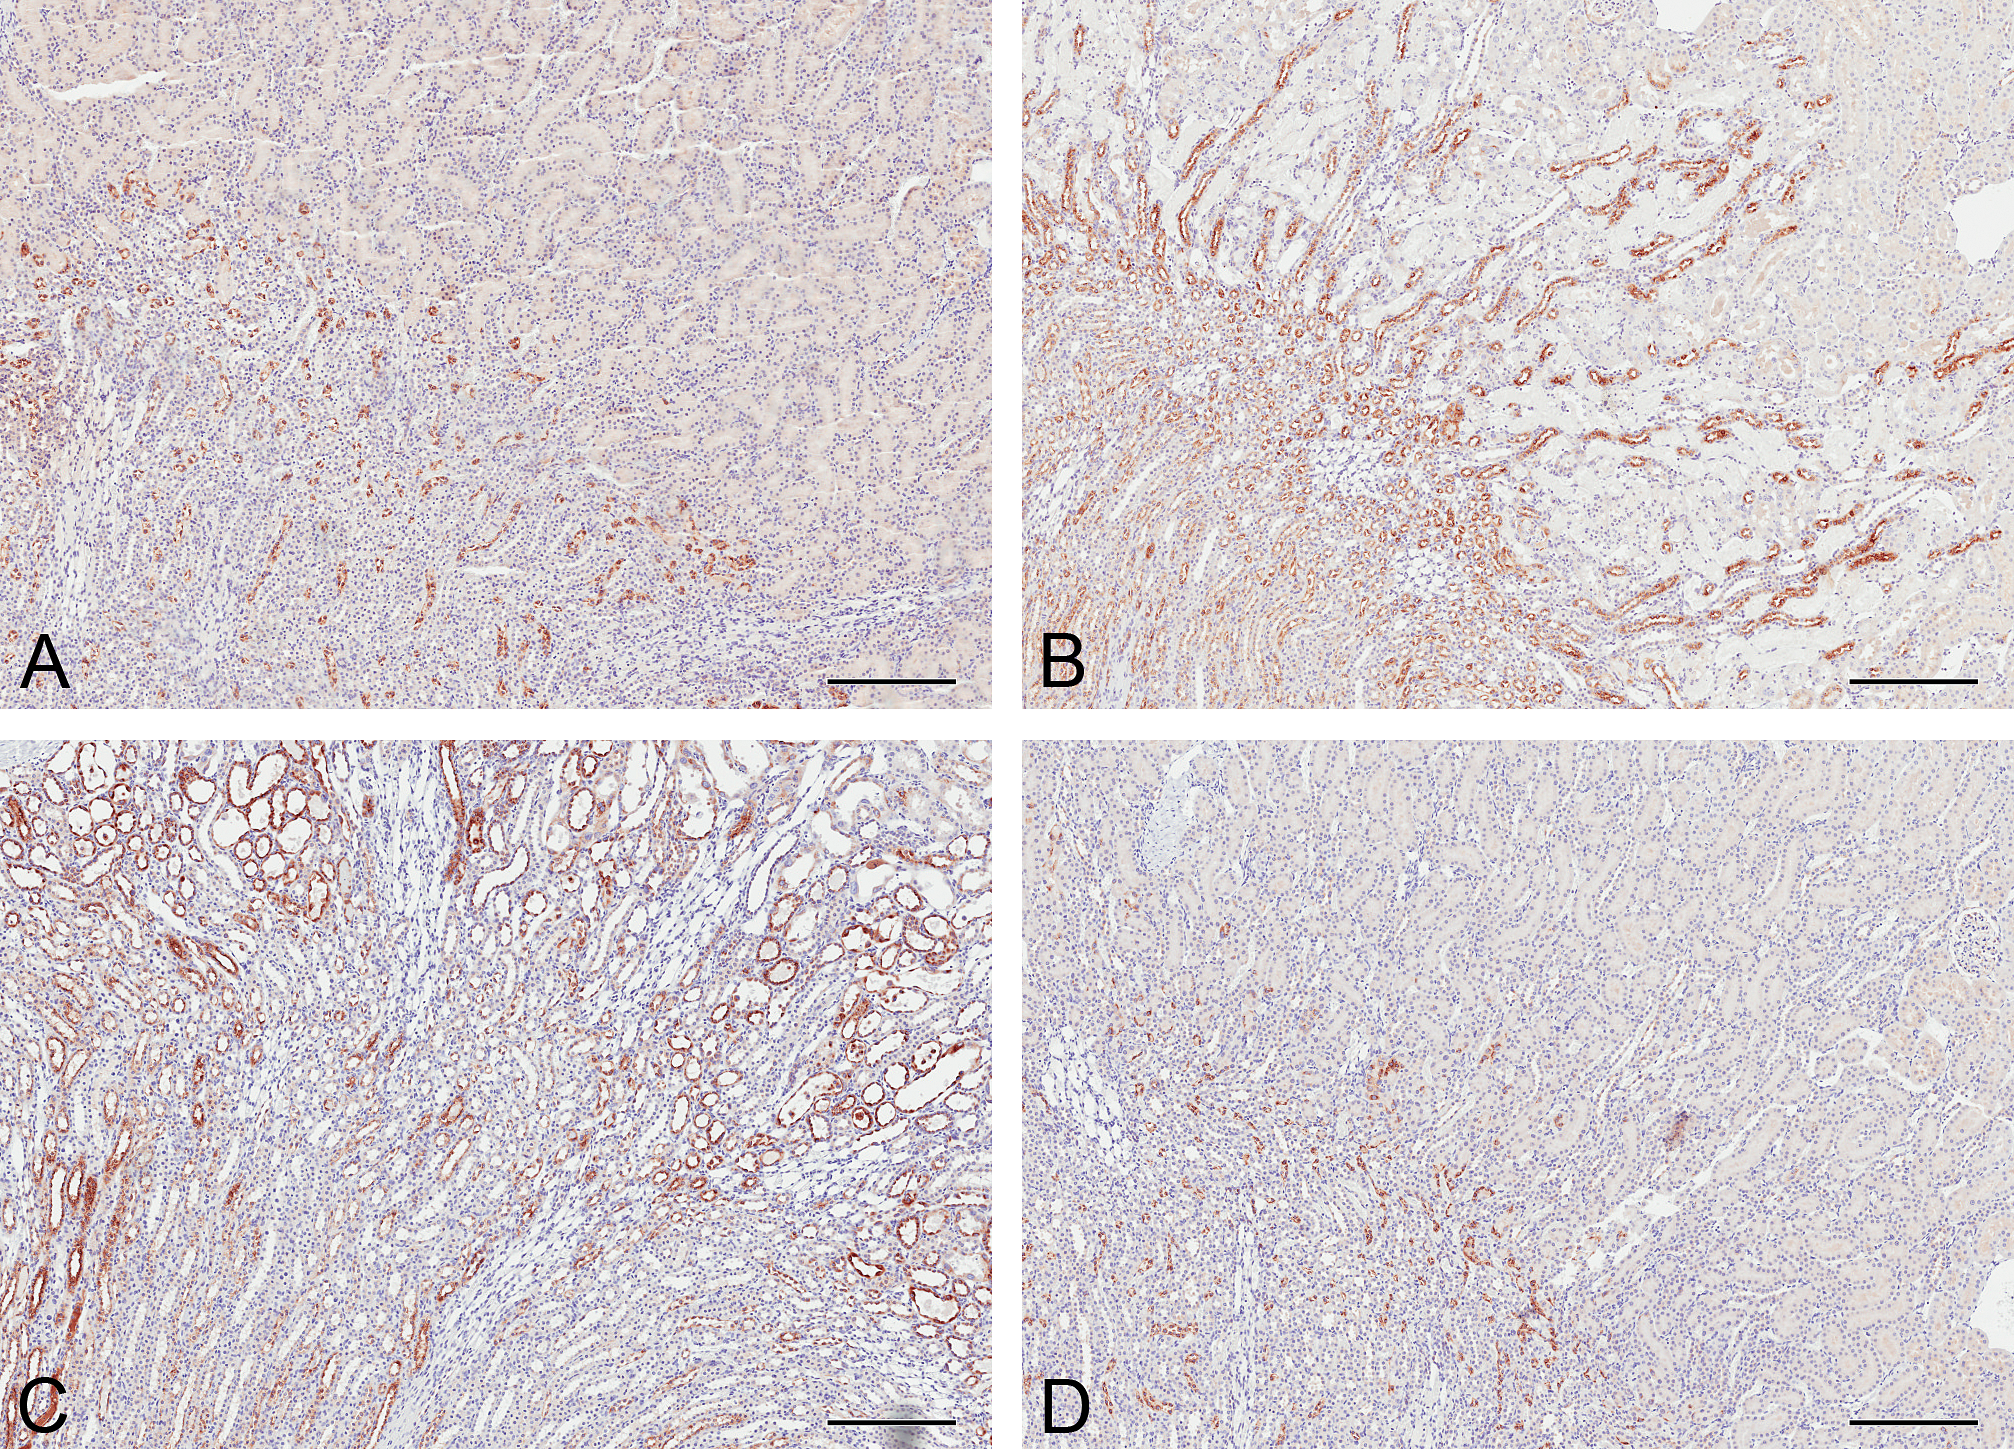
Osteopontin immunoreactivity in the kidneys of rats treated with a single intraperitoneal dose of a vehicle (A) or 2.5 mg/kg cisplatin after 5 days (B), 8 days (C), and 22 days (D). In control animals, osteopontin was confined to the loop of Henle; staining was localized to the inner stripe of the outer medulla and the inner medulla. Faint immunoreactivity was present throughout the cytoplasm, with stronger, punctate perinuclear staining. At day 5, thick and thin ascending limbs and distal tubules were positive for osteopontin (OPN). At day 8, OPN was detected in most nephron segments. At day 22, OPN immunoreactivity was comparable to that of controls. The urothelium of all rat kidneys at all time points and doses stained positive. Bars = 250 μm.
αGST immunoreactivity was present throughout the proximal tubules in control animals (Figure 4A). At day 5, there was a significant reduction in αGST immunoreactivity in animals treated with 1.0 mg/kg and 2.5 mg/kg cisplatin, particularly in the S3 segment of the proximal tubules (Figure 4B; Table 1). At day 8, immunoreactivity for αGST was very faint or absent in S3 proximal tubules in rats treated with 2.5 mg/kg cisplatin (Figure 4C; Table 1). However, while there were apparent decreases in staining intensity in some animals, no statistically significant changes were detected in lower dose groups at this time point, due to variable staining between animals (Figure 4D; Table 1).
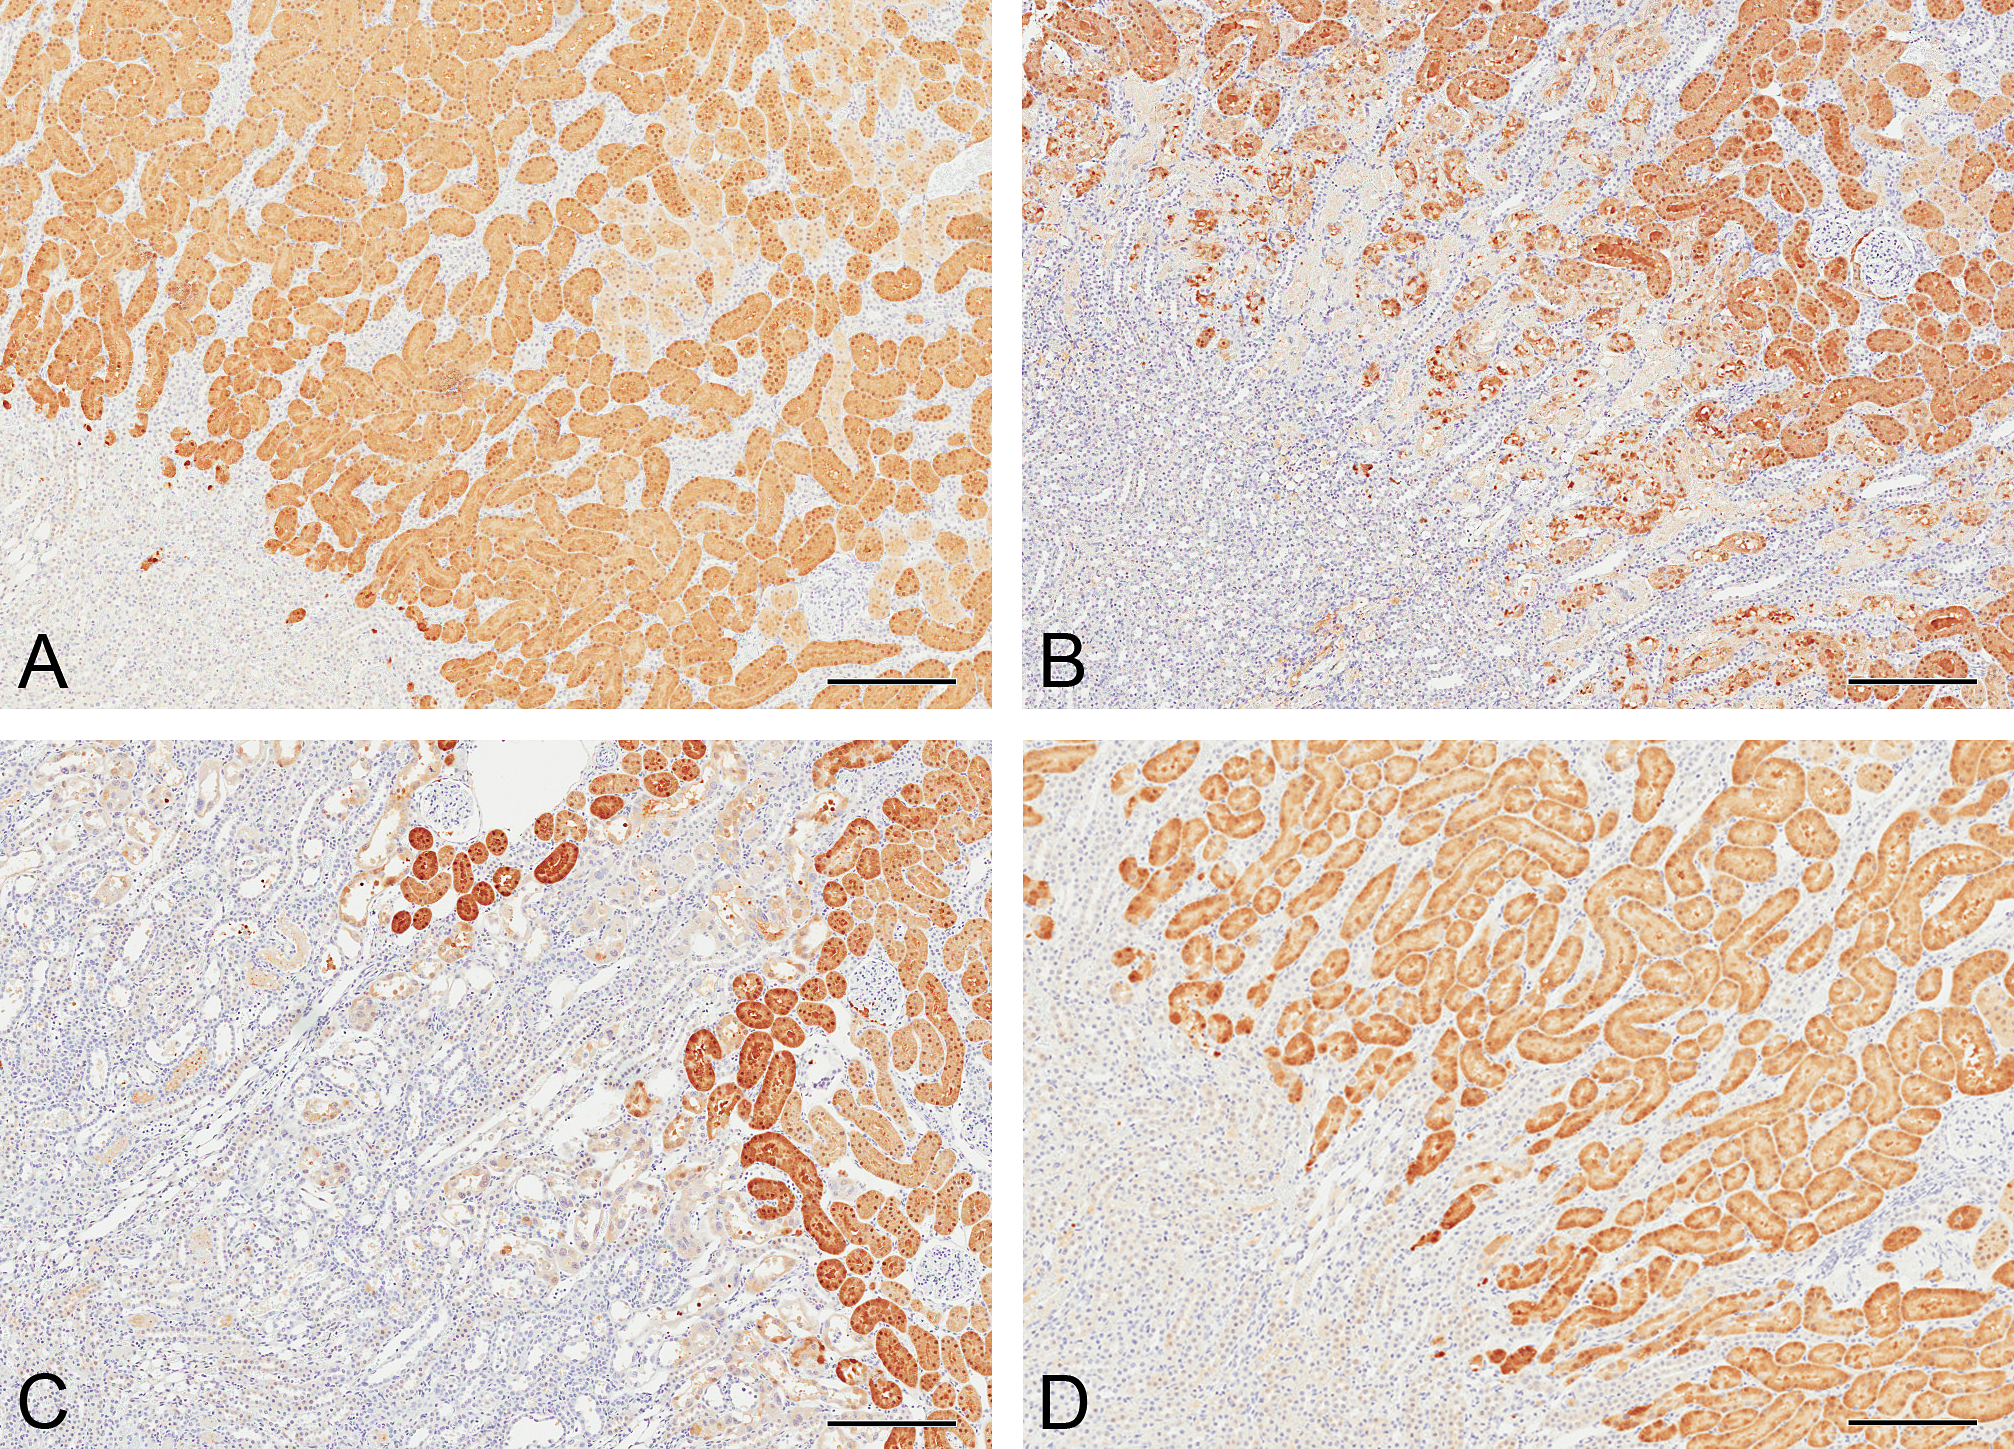
Alpha-glutathione S-transferase (αGST) immunoreactivity in the kidneys of rats treated with a single intraperitoneal dose of a vehicle (A) or 2.5 mg/kg cisplatin after 5 days (B), 8 days (C), or after 8 days when treated with 1.0 mg/kg cisplatin (D). In control animals, αGST immunoreactivity was present and was of uniform intensity in proximal tubules of the cortex and outer stripe of the outer medulla. At day 5, αGST immunoreactivity was reduced in the S3 proximal tubules, with much less uniformity. At day 8, there was little αGST immunoreactivity in S3 proximal tubules. By day 8, immunoreactivity recovered in rats treated with 1.0 mg/kg cisplatin. Bars = 250 μm.
Clusterin immunoreactivity was absent in control animals at every time point (Figure 5A). In cisplatin-treated animals at day 5, clusterin was localized to S3 proximal tubule brush border membranes in the OSOM on the border with the ISOM. Positive pixel analysis identified a significant increase in immunoreactivity in rats dosed with 1.0 mg/kg and 2.5 mg/kg cisplatin compared to vehicle-treated controls (Table 1). At day 8, minimal immunoreactivity was identified in proximal tubule cells, but intraluminal cellular casts stained very strongly, as did intraluminal proteinaceous contents (particularly in papillary collecting ducts). The staining intensity was only significantly increased compared to controls with the highest dose of cisplatin (2.5 mg/kg; Figure 5B). By day 22, the amount of clusterin immunoreactivity was reduced compared to days 5 and 8, but there remained a significantly higher amount of staining compared to control animals.
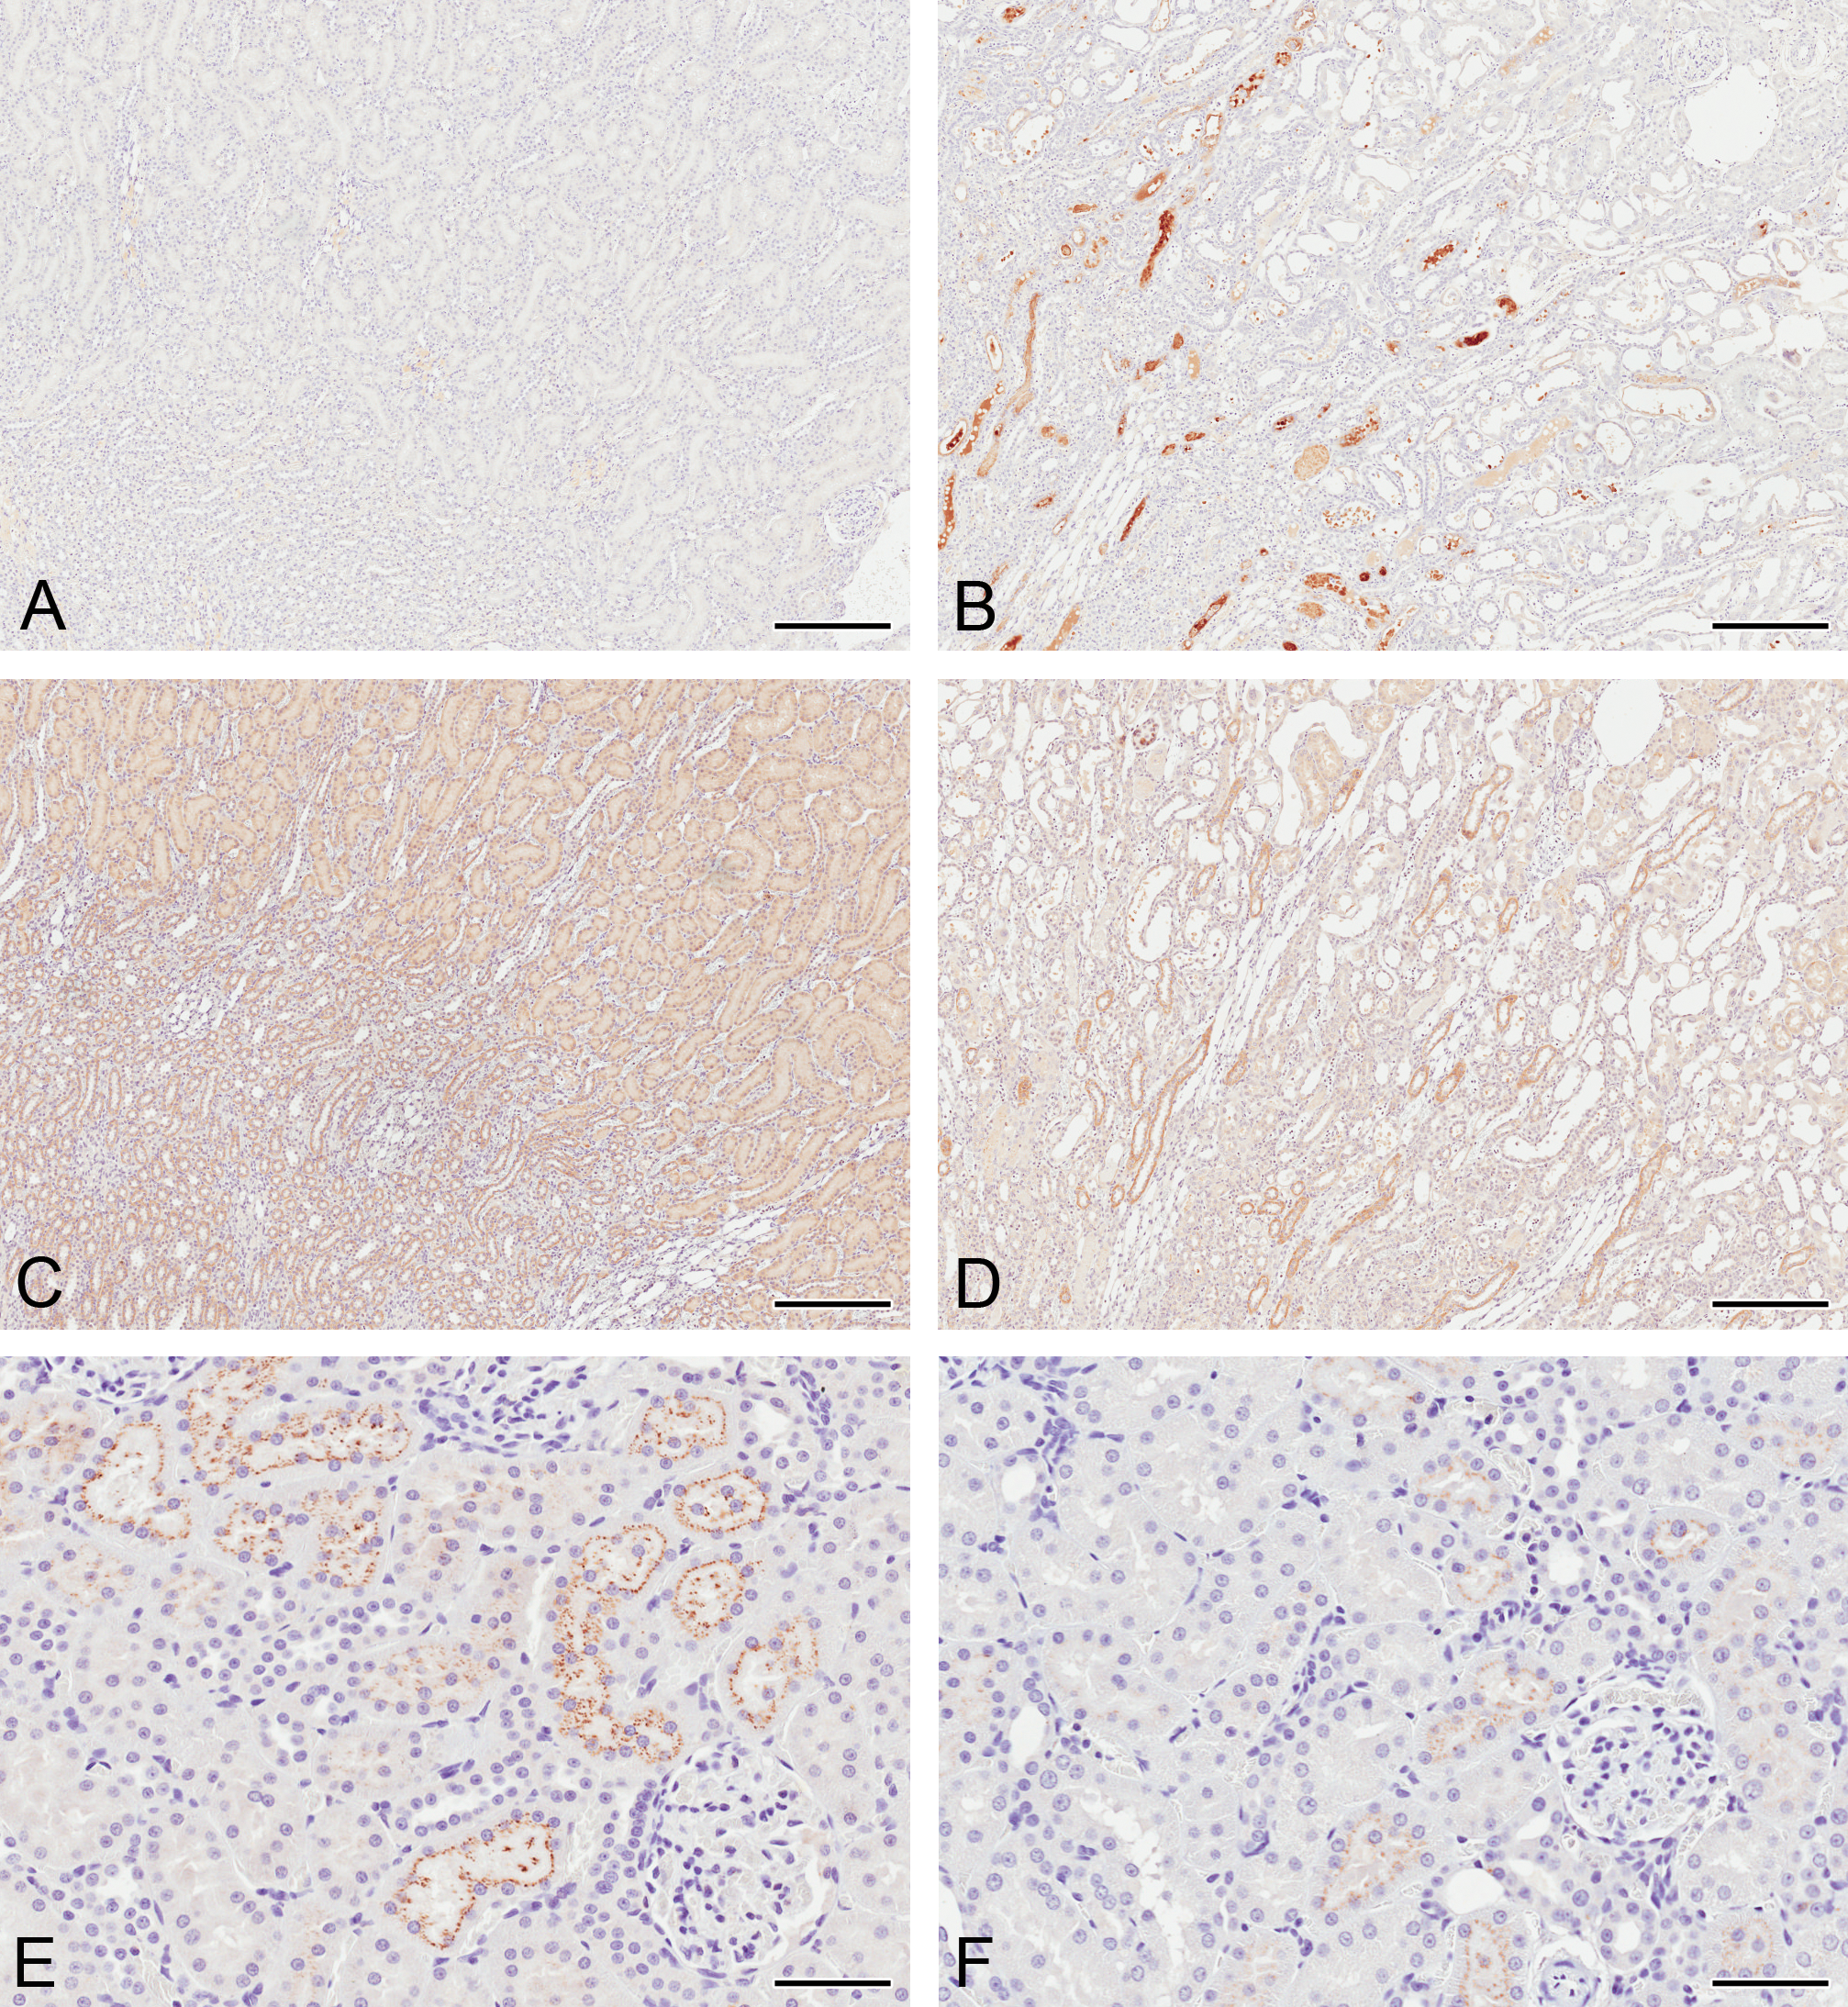
Clusterin (A and B), trefoil factor 3 (TFF3; C and D), and beta 2 microglobulin (β2MG; E and F) immunoreactivity in the kidneys of rats treated with a single intraperitoneal dose of a vehicle (A, C, and E) or 2.5 mg/kg cisplatin after 8 days (B, D, and F). Clusterin immunoreactivity had increased at day 8, whereas both TFF3 and β2MG immunoreactivity decreased in comparison to time-matched vehicle controls. Bars = 250 μm (A-D); 50 μm (E&F).
Clusterin staining at all time points was associated with degenerative cells or necrotic debris, rather than tubules displaying regenerative hyperplasia.
In control animals, immunoreactivity for TFF3 was detected in S3 proximal tubules in the OSOM and in tubules in the ISOM and inner medulla thick ascending limbs (Figure 5C). Collecting ducts were the only tubules in the cortex to stain weakly positive. At day 5, immunoreactivity in the S3 proximal tubules was decreased in animals treated with 2.5 mg/kg cisplatin (Table 1). TFF3 remained significantly lower in these high-dose animals at both 8 days (Figure 5D; Table 1) and 22 days (Table 1). Significant decreases in TFF3 immunoreactivity were also detected on day 8 in the 0.1 and 1 mg/kg cisplatin-treated animals (Table 1). TFF3 remained significantly decreased after 22 days in animals treated with 2.5 mg/kg cisplatin (Table 1).
β2MG immunoreactivity was localized to S1 proximal tubular cells in the cortex of control animals and was distributed within subapical vesicles (Figure 5E). At day 5, positive pixel analysis identified no change in immunoreactivity in rats dosed with 2.5 mg/kg cisplatin compared to vehicle (Table 1). At day 8, a significant decrease in β2MG immunoreactivity was identified in the 2.5 mg/kg cisplatin-treated group, with the subapical vesicles displaying a less ordered distribution (Figure 5F; Table 1). At day 22, staining appeared similar to that found in control animals with no change in immunoreactivity identified. No changes were detected in lower dose groups at any time point.
No immunoreactivity was detected in any of the rabbit or goat IgG isotype negative controls at any time point (not shown).
ROC curves were constructed to determine how sensitive and specific each of the biomarkers were for detecting proximal tubule necrosis (the primary histopathological change observed following cisplatin treatment; Figure 6). The AUCs (Table 2) showed that KIM-1 and OPN had the largest AUC when cisplatin-induced proximal tubule necrosis was used as a classifier.
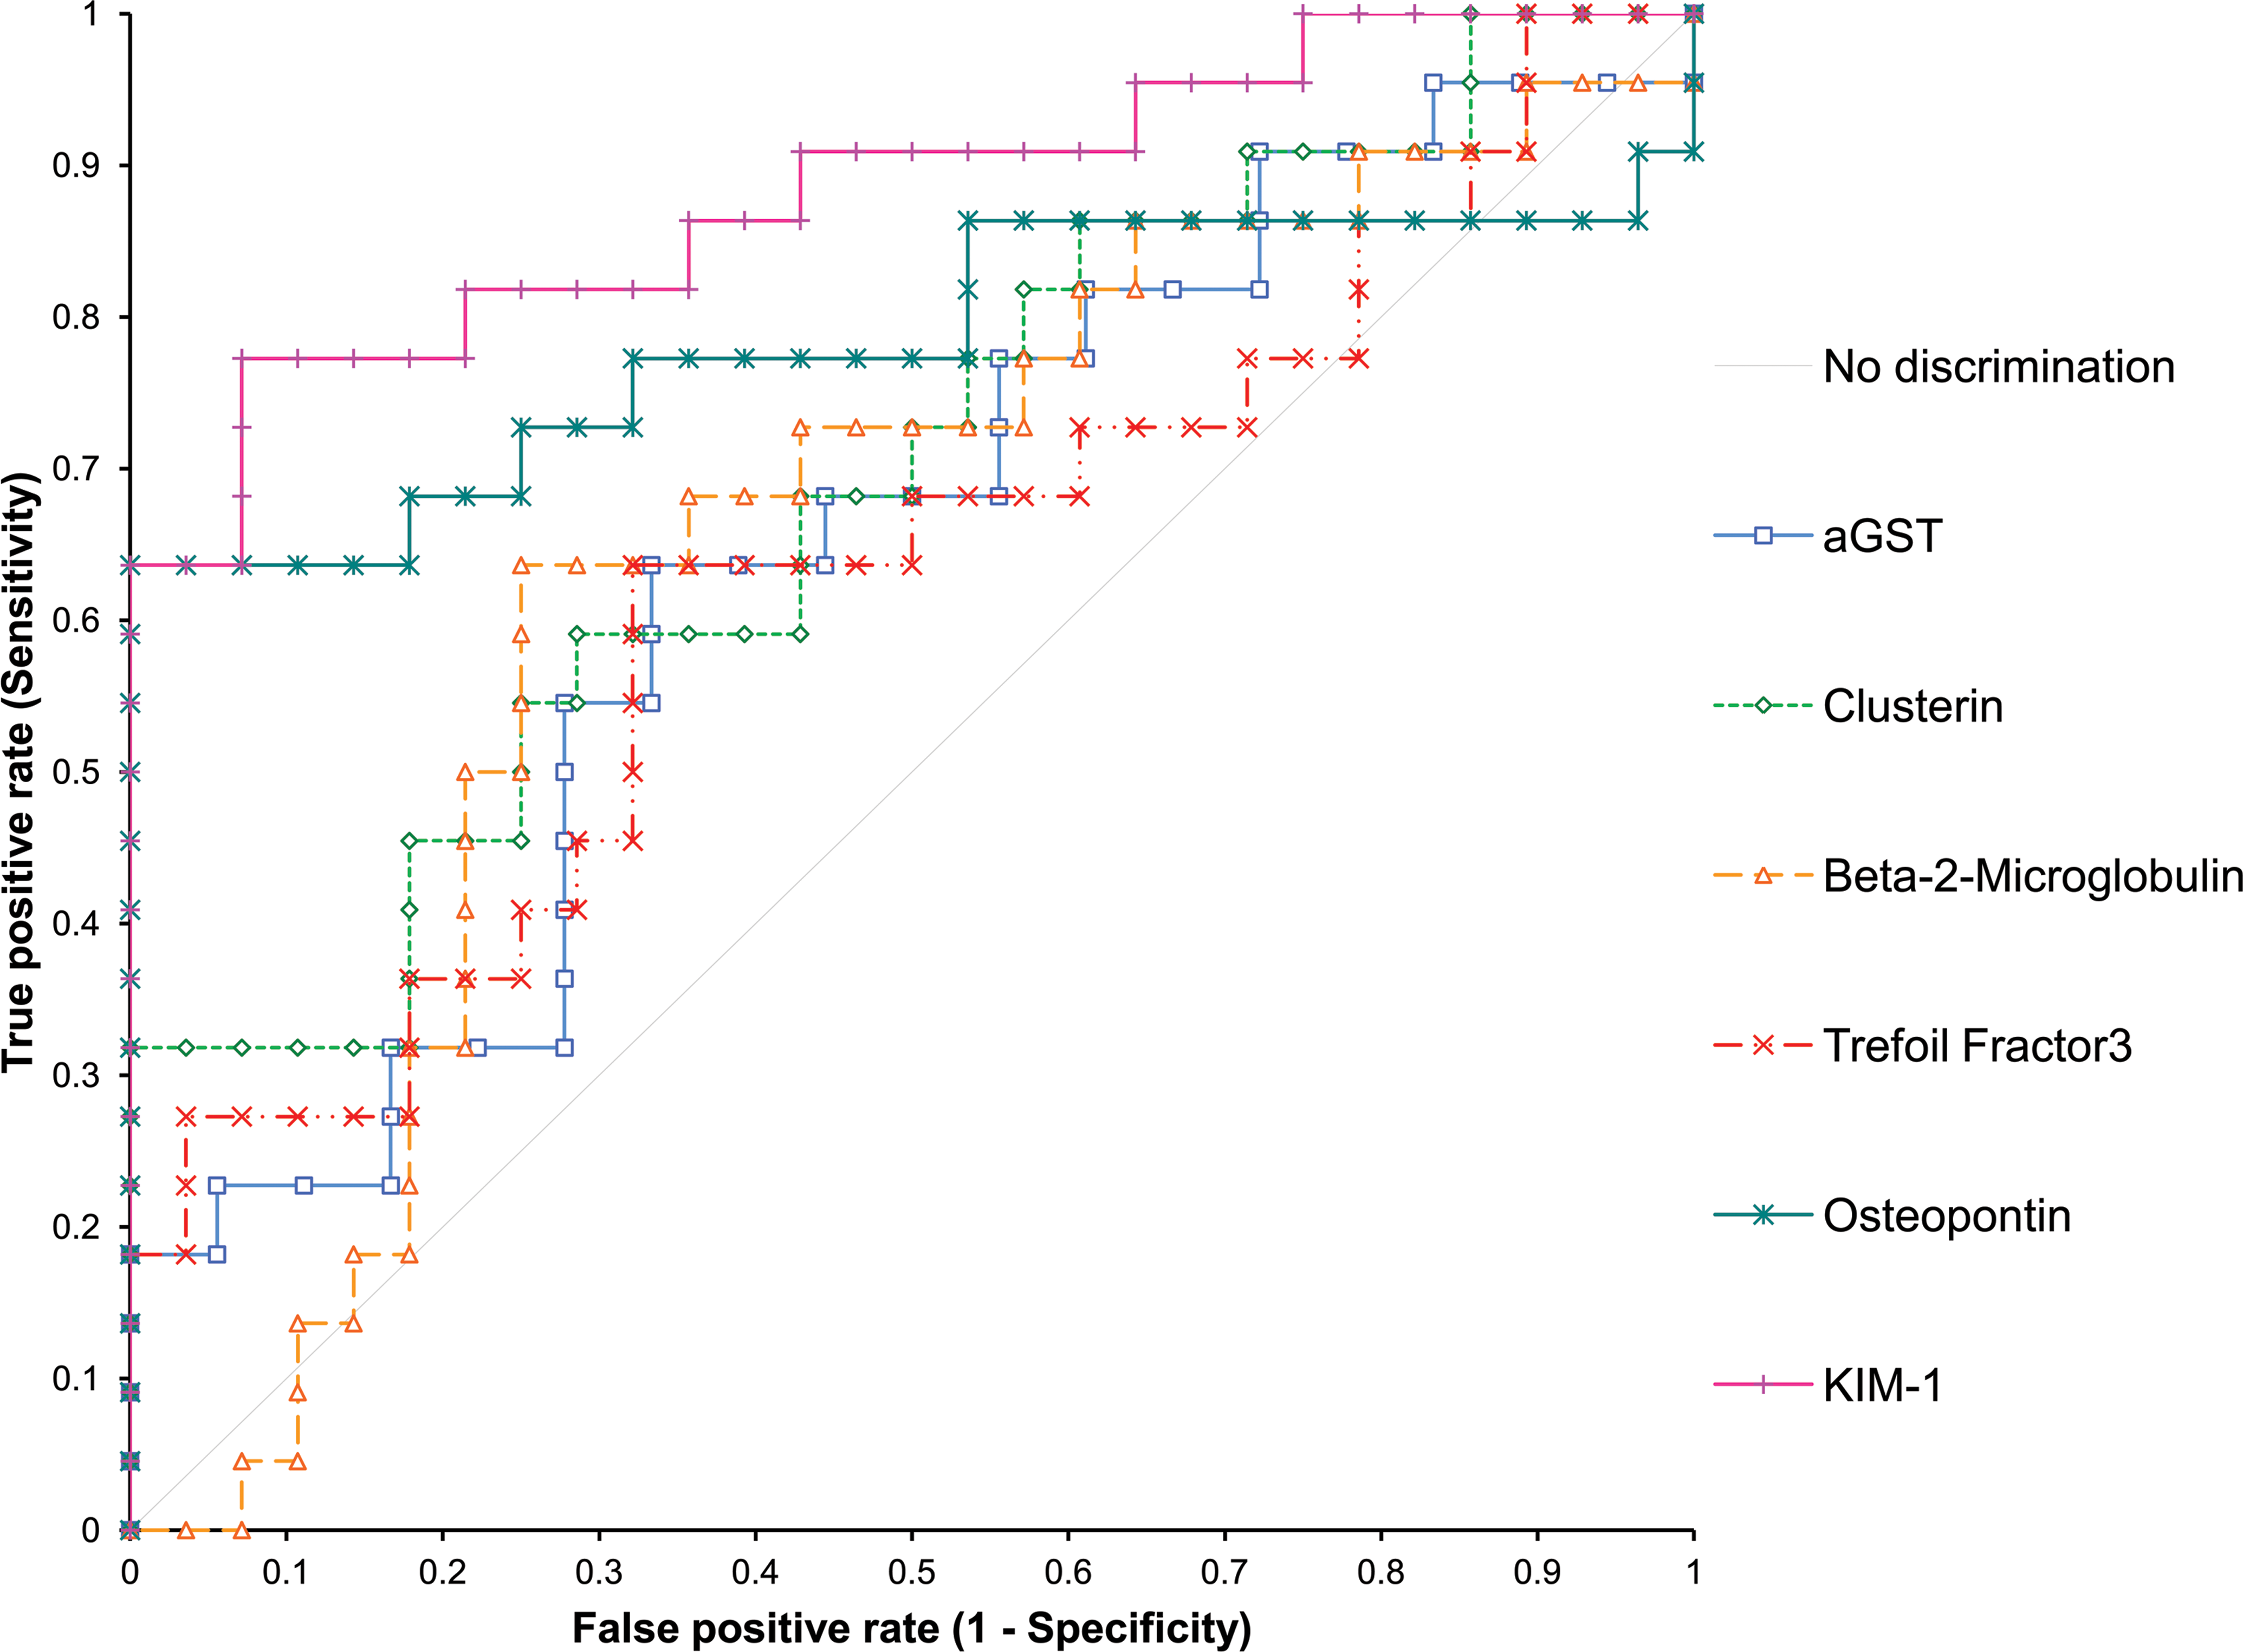
Receiver operating characteristic curves showing biomarker discrimination (sensitivity and specificity) for detecting cisplatin-induced proximal tubule necrosis, using presence or absence of this pathology as a classifier.
Area under the receiver operator characteristic curve for rats treated with 0 mg/kg, 0.1 mg/kg, 1 mg/kg, or 2.5 mg/kg cisplatin intraperitoneal and maintained for either 5, 8, or 22 days.
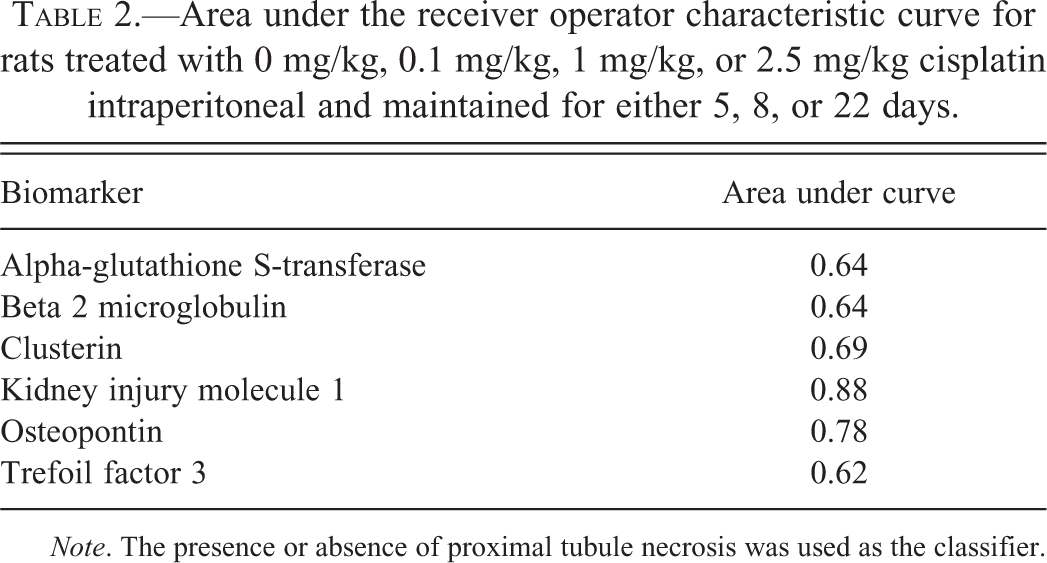
Note. The presence or absence of proximal tubule necrosis was used as the classifier.
For three of the biomarkers investigated (αGST, KIM-1, and OPN), we have previously published urinary biomarker data from the same animals (Pinches et al. 2012). There were significant increases in KIM-1 and OPN in the 1.0 mg/kg and 2.5 mg/kg groups after 5 and 8 days, and these values were greatly reduced by day 22 but were still significantly higher than control animal values (Table 1). αGST levels were increased in the 1.0 mg/kg and 2.5 mg/kg groups after 5 days only. In order to determine whether tissue biomarkers can provide the same information as urinary biomarkers when urine samples are not available, we correlated the urine and IHC data for each animal. Figure 7 shows the relationships between the tissue biomarker data and the urinary biomarker data, using the urine collection taken on the same day the animals were terminated. For both KIM-1 and OPN, the IHC positively correlated with the urine data (R 2 = .883 and .560, respectively). For αGST, there was no correlation between the two sets of data.
Correlation of urinary biomarker data with immunohistochemistry data for KIM-1 (A), osteopontin (B), and αGST (C) following cisplatin treatment. Urinary biomarker data represent the values measured on the same day that tissues were taken for immunohistochemistry. Urinary biomarker values are normalized to creatinine (Ct) and were generated in a previous study (Pinches et al. 2012). αGST = alpha-glutathione S-transferase; KIM-1 = kidney injury molecule 1. Red symbols represent 0 mg/kg cisplatin, blue symbols 0.1 mg/kg cisplatin, green 1.0 mg/kg cisplatin, and yellow 2.5 mg/kg cisplatin. The larger the circle, the greater the severity of the pathology, which was graded 0–4 for proximal tubule necrosis: 0 = no necrosis, 1 = minimal, 2 = mild, 3 = moderate, or 4 = severe.
No urine data were available to make similar correlations for clusterin, TFF3, or β2MG.
Discussion
In this study, we used a cisplatin model of nephrotoxicity to examine the expression of several relatively novel urinary biomarkers of kidney injury (KIM-1, OPN, αGST, TFF3, β2MG, and clusterin) in kidney tissue. The aim was to compare tissue levels to urinary levels of these biomarkers to demonstrate tissue specificity and sensitivity. These techniques could also be used in studies where urine samples are not available, such as retrospective studies in drug safety testing, to demonstrate the potential utility of using these biomarkers in future preclinical or clinical studies. We also assessed whether the tissue data could provide additional information that may complement assessment of nephrotoxicity made using urinary biomarkers and whether these can be used to provide the spatiotemporal description of the drug-induced damage/regeneration process.
In agreement with other groups (de Borst et al. 2007; Vinken et al. 2012), we detected low levels of KIM-1 immunoreactivity in some control rat kidneys; a finding likely to reflect low levels of naturally occurring tubular injury/regeneration. In animals dosed with cisplatin, all animals with KIM-1-positive immunoreactivity showed histopathological changes. However, there was no significant difference in KIM-1 immunoreactivity in the low-dose groups, when minimal histopathological changes were observed (over no pathology in control animals), indicating that KIM-1 immunoreactivity in tissue was not as sensitive as standard histopathology. AUCs from ROC curves indicated that KIM-1 was the most predictive of the tissue biomarkers for proximal tubule necrosis (the predominant feature of the histopathology). Significant differences in group means for tissue KIM-1 were observed in the same dose groups that showed significant changes in urinary KIM-1 as we previously reported (Pinches et al. 2012). However, individual animals showed increases in tissue KIM-1 in the mid-dose cisplatin group, when no increases in urinary KIM-1 were observed. This was in contrast to a previous study that demonstrated occasional increases in urinary KIM-1 before nephrotoxic changes were evident by histopathological evaluation (Hoffmann et al. 2010). However, the authors of this study considered that the increases may be associated with a few damaged tubules that were not evident in the particular histopathological sections examined rather than proposing that the biomarker response preceded the tubular damage. In general, we observed a high level of correlation between tissue and urinary KIM-1, suggesting that urinary KIM-1 levels are a sensitive, specific measure of renal cisplatin injury as they track spatially and temporally with tissue levels.
OPN expression was restricted to the loop of Henle in control rats, in agreement with previous observations (Hudkins et al. 1999; Persy et al. 1999). Similar to other animal models of both nephrotoxicity and renal disease, cisplatin-induced nephrotoxicity induced the expression of OPN in other parts of the kidney (Xie et al. 2001). The AUC from the ROC curve indicated that OPN was also a good predictor of proximal tubule necrosis; this may be due to the change from no immunoreactivity in proximal tubules in controls to expression in proximal tubules with treatment, an indirect effect of proximal tubule necrosis on other parts of the nephron, or may reflect pathology in other parts of the nephron that parallels the necrosis of proximal tubule. Furthermore, there was a good correlation between urinary OPN levels and kidney expression; but as with KIM-1, it was the standard histopathology that indicated the earliest signs of nephrotoxicity. OPN is expressed in a variety of tissues including bone and many epithelial tissues (Brown et al. 1992; Denhardt and Guo 1993) and is also normally detectable in urine (Hedgepeth et al. 2001). While nonrenal sources of intact OPN would be too large to be filtered at the glomerulus, it is possible that OPN fragments from nonrenal sources may become detectable in urine. Therefore, parallel detection of OPN in both kidney and urine offers the advantage of confirming that any urinary changes seen are as a consequence of changes occurring in the tissue.
Clusterin expression was not detectable in control rat kidneys but expression within the proximal tubules became evident following treatment with cisplatin, consistent with previous reports (Ishii, Sakai, and Nakamura 2007; Silkensen et al. 1997). While the ROC curves for clusterin showed some discrimination for predicting proximal tubule necrosis, the AUC was much less than that for KIM-1 or OPN.
In accordance with its role as a cytosolic protein in proximal tubule cells (Branten et al. 2000; Searchfield et al. 2010; Bauchet et al. 2011), we observed αGST immunoreactivity throughout the proximal tubule in control rat kidney. αGST was very significantly decreased in mid- and high-dose animals 5 days after cisplatin treatment; but by 8 days, there was only a significant decrease in the high-dose group. This was in contrast to several other biomarkers studied, where the IHC changes closely paralleled the standard histopathology. There was also poor correlation between the tissue and urinary αGST measurements. This largely reflected the different time course in the changes observed between the two biomarkers. Furthermore, the AUC from the ROC curve for αGST suggested that this biomarker is a poor predictor of proximal tubule necrosis. Studies with other nephrotoxins looking at urinary αGST have also shown a poor correlation between proximal tubule necrosis and αGST (Kharasch et al. 1998; Prozialecka et al. 2009). Despite these findings, our previous results indicated that urinary αGST measurements outperformed serum Ct as a biomarker for cisplatin-induced nephrotoxicity (Pinches et al. 2012).
TFF3 expression was detected in S3 proximal tubules in the OSOM, tubules in the ISOM and inner medulla, and weak staining in cortical collecting ducts, consistent with in situ hybridization studies for messenger RNA in rats (Yu et al. 2010). The expression was, however, more widespread than that shown by histochemistry using a trefoil peptide motif in a β-galactosidase fusion protein, where expression was restricted to the collecting ducts of rat kidney (Chinery et al. 1993). This may reflect the different sensitivity of the techniques used. We observed a decrease in TFF3 staining in cisplatin-treated kidneys, similar to that observed with other nephrotoxins, most likely as a result of a gene regulatory response to tubular toxicity (Yu et al. 2010). The AUC from the ROC curve showed that TFF3 was able to detect proximal tubule damage but was not as sensitive as KIM-1 or OPN. Despite being less sensitive at detecting nephrotoxicity at 5 days, TFF3 was the only biomarker to show significant change following low-dose cisplatin at 8 days. This may reflect the time taken for decreased gene expression to result in decreased protein expression.
β2MG was expressed in the S1 segment of the proximal tubules in control rats but is expressed throughout the body and is freely filtered at the glomerulus. Following filtration it is almost completely reabsorbed; so under normal conditions, it is not present in the urine. However, both glomerular and tubular toxicity have been shown to impair this process, resulting in increases of up to several 100-fold in urine. Consistent with this finding, we did not observe any changes in β2MG by IHC except a decrease in 8 days after a high dose of cisplatin. This is probably the result of extensive necrosis and associated loss of protein in the lower part of the nephron, causing a decrease in function, such as reabsorption, in the S1 segment (a noninjured part of the nephron). The AUC from the ROC curve reflects this; there is some association with proximal tubule necrosis but the sensitivity and specificity of this biomarker is less than the other biomarkers investigated.
In conclusion, this study determined that several urinary proteins currently used as biomarkers of nephrotoxicity can also be used to identify nephrotoxicity in sections of kidney tissue following cisplatin treatment in rats. These biomarkers include αGST, clusterin, KIM-1, OPN, and TFF3. β2MG was less sensitive as an immunohistochemical marker for cisplatin nephroxicity. Of the biomarkers investigated, KIM-1 and OPN were most predictive of proximal tubule necrosis and showed the greatest correlation with their corresponding urinary biomarkers. In the future, there may be wider application of these tissue markers for detecting and characterizing renal toxicity and, importantly, for bridging alterations in urinary biomarkers to histologic kidney lesions following administration of other nephrotoxicants.
Footnotes
The author(s) declared no potential conflicts of interest with respect to the research, authorship, and/or publication of this article.
The author(s) declared the following financial support for the research, authorship, and/or publication of this article: All work was funded by AstraZeneca.