
Abstract
Renal papillary necrosis (RPN) is a relatively common toxicity observed in preclinical drug safety testing. It is also observed in a variety of human diseases. RPN is difficult to diagnose without expensive scanning methods or histopathology. A noninvasive biomarker that could be detected at early stages of kidney damage would be of great value both to preclinical drug safety testing and in the clinic. An antibody raised to an unknown epitope of an antigen in rat kidney papilla was found to be specific for collecting duct cells in the kidney; this was termed renal papillary antigen 1 (RPA-1). In this study, the authors show that RPA-1 is an early biomarker of RPN in two different rat models of toxicity: 2-bromoethanamine (BEA) and N-phenylanthranilic acid (NPAA). RPA-1 can be detected in urine at early stages of toxicity and correlates well with the histopathology observed. We also characterized the biochemical properties of RPA-1 and found that the antigen is a high molecular weight membrane bound glycoprotein, with the epitope likely to be carried on an N-linked carbohydrate structure. This study demonstrates that RPA-1 is an excellent marker of RPN that can be used to detect this toxicity in preclinical safety testing.
Introduction
Nephrotoxicity is a frequent finding in preclinical drug safety testing. Whilst the majority of nephrotoxic drugs affect the proximal tubules, renal papillary necrosis is common with particular classes of drug including analgesics, nonsteroidal anti-inflammatory drugs (NSAIDS), and tyrosine kinase inhibitors (Bach and Nguyen 1998). RPN can also result from diseases such as diabetes, sickle cell disease, and pyelonephritis (Jung et al. 2006). Experimentally, compounds such as 2-bromoethanamine (BEA), propyleneimine (PI), and N-phenylanthranilic acid (NPAA) have been widely used to induce RPN in rodents (Bach and Nguyen 1998).
The pathogenesis of RPN is not fully understood; possible mechanisms include prostaglandin inhibition, changes to renal blood flow, direct cellular injury, free radical formation, and immunologic injury (Bach and Bridges 1985a, 1985b; Bach and Gregg 1988; Powell et al. 1991). Prostaglandin inhibition and reduction or redistribution of renal blood flow are the favored hypotheses, but a direct cellular effect may also be important (Sabatini 1996).
An early indication of RPN, both clinically and in experimental animals, is a loss of urinary concentrating ability leading to polyuria (Bengtsson 1962; Hardy 1970; Murray et al. 1972). Decreased glomerular filtration rate, increased blood urea nitrogen (BUN), and renal tubular acidosis have also been reported; but as with polyuria, these are not specific to RPN. In preclinical models used for drug safety testing, diagnosis of RPN is usually made by histological examination. Clinically, diagnosis can also be confirmed using intravenous urography or computed tomography methods (Jung et al. 2006). However, these methods are time-consuming, expensive, and invasive. Furthermore, they often detect damage at a late stage when the changes may be irreversible or are only observed postmortem.
A urinary biomarker that could detect early toxicological changes in RPN, which may precede histopathological findings, would be valuable in evaluating the toxicity of new compounds and also in the clinical setting. Whilst there are an increasing number of urinary biomarkers that show promise for detecting early damage to the proximal nephron (Ferguson, Vaidya, and Bonventre 2008), few biomarkers have been discovered that detect damage to the distal nephron. Also, many of these are markers of regeneration rather than injury. Recently, the L1 cell adhesion molecule was shown to be redistributed from the basolateral membrane of collecting duct cells in normal kidney to the apical membranes of collecting duct cells, thick ascending limbs, and distal tubules in patients with acute tubular necrosis (Allory et al. 2008). This was accompanied by an increase of its soluble form in urine, although the tubular source of this is unknown. Falkenberg et al. (1996) looked more specifically for biomarkers of RPN. They raised antibodies by injecting mice with material prepared from rat kidney papilla or urine from rats treated with papillary toxins. Antibodies were chosen based on their selectivity for collecting ducts using immunofluorescence. RPA-1 (mouse IgG monoclonal Pap X 5C10 derived from rat kidney papilla) was an antibody found to selectively recognize collecting ducts of rat kidney. Further work by the same group showed that the amount of the antigen increased in urine following treatment with the papillary toxins BEA, propyleneimine, and indomethacin (Hildebrand et al. 1999). The aims of the current study were to demonstrate that RPA-1 is an early preclinical urinary biomarker of RPN and to characterize the biochemical properties of the molecule.
Methods
In Vivo RPN Studies
NPAA and BEA were purchased from Sigma (Poole, UK). Both studies were carried out using male Wistar rats with starting weights between 220 and 290g. For the NPAA study 60 animals were randomized into 4 equal groups and dosed by oral gavage. Groups 1-4 received vehicle only (control), 50 mg/kg/day (low dose), 350 mg/kg/day (mid-dose) or 500 mg/kg/day (high dose) NPAA, respectively. Animals were dosed daily for 14 days before being sent to necropsy on day 15. Urine samples were collected 4 days before dosing and 4, 6, 8, and 15 days after dosing. All samples were collected in metabolism cages on ice for 18h overnight.
For the BEA study, 20 animals were randomized into 4 equal groups and dosed by a single intraperitoneal injection. Groups 1-4 received vehicle only (control), 25mg/kg (low dose), 50mg/kg (mid-dose), or 100mg/kg (high dose) BEA, respectively. Necropsies were carried out on the 15th day after starting treatment. Urine samples were taken 4 days before the start of treatment and 3, 5, and 11 days after starting treatment. All samples were collected in metabolism cages on ice for 18h overnight.
Immunohistochemistry
Kidneys were fixed for 24 to 48h in 10% neutral-buffered formalin, embedded in paraffin, and 4μm sections were cut. Tissue microarrays were constructed on glass slides using a previously described method (Kononen et al. 1998). Sections and tissue microarrays were de-waxed using xylene and rehydrated using 100% and 95% ethanol. Endogenous peroxidase activity was blocked with 3% (aq) hydrogen peroxide for 10min. Immunostaining was carried out using a Labvision autostainer (Labvision, Fremont, USA). Nonspecific binding of the antibody was prevented by incubating slides with 10% normal goat serum (1:20, DAKO, Glostrup, Denmark) for 20min. Slides were incubated with RPA-1 antibody for 1h at room temperature. HRP labeled goat antimouse IgG secondary antibody (DAKO Envision + System-HRP) was added for 30min at room temperature, and peroxidase was then visualized with diamino benzidine (DAB, DAKO Envision kit) applied for 10min at room temperature. Sections were counterstained using hematoxylin (Carazzi’s) for 1min before dehydrating in 95% and 100% ethanol, clearing in xylene, and mounting using Hystomount (TAAB Labs, Aldermaston, UK). Image capturing of the slides was carried out using a Scanscope® scanner (Aperio Technologies Incorporated, Vista, USA).
Immunogold and Immunogold Silver Microscopy
Formalin-fixed, partially dehydrated kidneys were processed and embedded in L.R.White resin (Agar Scientific, Stansted, UK) using the cold catalytic method. Immunostaining of ultrathin sections for electron microscopy was carried out using an indirect immunocolloidal gold detection method. Briefly, sections were incubated with RPA-1 antibody (1:50) or mouse IgG (0.02mg/ml, negative control) for 1h at 20°C. Sections were then incubated with antimouse IgG immunogold conjugate (10nm particle size, Sigma) diluted 1:50 for 60min. Counterstaining was carried out for 1min in a 1% (w/v) uranyl acetate solution and in a 50% (v/v) lead citrate solution for 30s. Silver enhancement for light microscopy was achieved by treating sections with BBI Life Sciences (Cardiff, UK) silver kit until silver grain development was visualized (~10min). Semithin sections were counterstained with Carazzi’s hematoxylin for light microscopy. Ultra-thin sections were observed in the Hitachi H7100 transmission electron microscope.
RPA-1 ELISA
A commercial RPA-1 ELISA (Biotrin International, Dublin, Ireland) was run according to the manufacturers' instructions on a Triturus analyser (Grifols, Los Angeles, USA). Briefly, rat urine collected in a stabilizer supplied with the kit was diluted 1:50 in sample diluent and 100μl was used for the assay. Calibrators and diluted samples were added in duplicate to the microassay plate, and this was incubated at room temperature for 1h with shaking. One hundred μl conjugate was added per well and the plate incubated again for 1h at room temperature with shaking. One hundred μl substrate was then added for exactly 15min at room temperature. The reaction was stopped by adding 100μl stop solution, and the plates were read at 450nm.
The sensitivity of the assay was determined by adding two standard deviations from the mean optical density value of twenty zero standard replicates and calculating the corresponding concentration using the standard curve. This calculated sensitivity was 0.78U/L. The imprecision of the assay was calculated by analyzing twenty replicates of pooled rat urine and assessing the mean, SD, and coefficient of variation percentage. Expected values in the rat were assessed by preparing a series (n = 21) of control rat urine and diluting 1:25 as per kit instructions.
Western Blotting
Tissue samples were homogenized in RIPA buffer (New England Biolabs, Hitchin, UK) containing Halt protease inhibitors (Pierce, Rockford, USA) using a Polytron (Kinematica, Bohemia, NY, USA) homogenizer and centrifuged at 10,000 x g for 5min to remove insoluble debris. Control kidney samples were used for experiments aimed at identifying the biochemical nature of RPA-1 since these were more plentiful and the absolute amount of RPA-1 in the kidney is not thought to change with RPN. Ten μg of each sample was electrophoresed on NuPage® 10% BisTris polyacrylamide gels (Invitrogen, Paisley, UK). Gels were transferred to nitrocellulose membrane and stained with Ponceau S to confirm even loading of wells. Membranes were then blocked in 10% low-fat dried milk in tris-buffered saline containing 0.1% Tween (TBS-T) for 1h at room temperature. RPA-1 antibody was added at a concentration of 1:500 in 5% milk/TBS-T for 1h at room temperature. An HRP-conjugated antimouse secondary antibody (Pierce) was added at a concentration of 1:30,000 in 5% milk/TBS-T before detection of immunoreactivity with ECLplus (GE Healthcare, Little Chalfont, UK).
Digestion of proteoglycans was carried out using either heparinase or chondroitinase ABC (Sigma). For heparanase, either 0.5 or 1 unit of enzyme was added per 100μg kidney homogenate, and for chondroitinase ABC, 0.35 or 35 milli units were added per 100μg kidney homogenate. Incubations were carried out at 20°C or 37°C for 2h or 24h.
Trypsin digestion of protein samples was carried out by incubating kidney homogenate with a variety of trypsin (Sigma) concentrations 0.000016mg/ml–0.25mg/ml) overnight at room temperature. Samples were then run on a 16% tricine gel (Invitrogen).
Immunoprecipitation
RPA-1 antibody was covalently linked to ultralink hydrazide beads (Pierce). Beads were then incubated with rat kidney papilla homogenate or concentrated rat urine for 6h at room temperature with agitation. Urine from high-dose NPAA-treated animals was used for immunoprecipitation to ensure a high level of RPA-1. Control papilla material was used since significant amounts of RPA-1 are present in control animals and there is a more abundant supply of this tissue. Beads were washed in order to remove nonspecifically adsorbed components. Bound proteins were removed from the beads by boiling in RIPA buffer (see above) containing 4x LDS sample buffer (Invitrogen) for 10min.
Peptide Library Screening
Ph.D.-7 and Ph.D.-7C7 phage display peptide library kits (New England Biolabs) were screened against the RPA-1 antibody. The RPA-1 antibody was captured on protein A Dynal (GE Healthcare) beads or coated onto Immuntubes (Nunc, Roskilde, Denmark) at a concentration of 10μg/ml. The beads or tubes were incubated with either the cyclic or linear libraries for 2h at room temperature. After washing, bound peptides were eluted using triethylamine 100mM pH11. Five ml of TG1 bacteria (OD0.5) were infected with the eluates and grown overnight at 30°C with shaking. Bacteria were removed by centrifugation and phage purified by polyethylene glycol precipitation. Prepared phage were used for the next round of panning. After 3 rounds of panning, phage were used to infect E. coli. Infected cells were transferred to a culture tube containing 45°C agarose top, vortexed briefly, and poured onto a prewarmed LB/IPTG/Xgal plate. Plaques were grown overnight at 30°C. 10 plaques (blue colonies only) were picked and transferred into 1ml ER2738 culture medium, shaken at 30°C for 5h, centrifuged, and PEG precipitated. DNA was isolated by the periodate method and sequenced using the 96gIII primer.
RPA-1 Purification
Partial purification of RPA-1 was carried out based on a method used for purification of mucins (Sheehan et al. 1999). In brief, kidney papillary extract or concentrated urine samples were subject to 6M guanidine hydrochloride/cesium chloride isopycnic density gradient centrifugation, performed at a starting density of 1.4 g/ml at 40,000 rpm in a Beckman SW55 rotor for 48h at 15°C. The final density of fractions was calculated by weighing 0.5ml of each fraction. Fractions were electrophoresed on 0.7% (w/v) agarose gels before being transferred to nitrocellulose membrane using a vacuum blotter (VacuGene XL, GE Healthcare). RPA-1 positive fractions from cesium chloride density gradient centrifugation were separated by size-exclusion chromatography using an Akta Prime (GE Healthcare) sephacryl 300 (150ml) size-exclusion column equilibrated in 6M guanidine hydrochloride. Fractions were tested for the presence of carbohydrates using periodic acid-Schiff (PAS) reagent and antigenic response against RPA-1. RPA-1 positive fractions were either separated further by electrophoresis or passed through a nitrocellulose membrane by vacuum blotting. Proteins were then tryptically digested off the membrane and used for mass spectrometry analysis.
Mass Spectrometry
Mass spectrometry methods are described in detail in the Supplementary Methods (available at http://www.tpx.sagepub.com/supplemental). Briefly, membrane bands were excised from the nitrocellulose and reduced with DTT and alkylated with iodoacetamide. Samples were digested in trypsin overnight at 37°C. Samples then underwent strong cation exchange followed by reverse phase chromatography using the Dionex nanoflow system (GenTech Scientific Incorporated, New York, USA) with direct infusion into a 4000 Qtrap (Applied Biosystems, Warrington, UK) mass spectrometer.
Gel bands of interest were digested in trypsin overnight at 37°C before being chromatographed using a Dionex nanoflow system using a reversed phase gradient. The eluent was either added to matrix on a MALDI target plate and analyzed using a 4700 Proteomics Analyser (Applied Biosystems) or directly infused into a Qtof (Micromass Limited, Manchester, UK) mass spectrometer.
The data files generated were searched against a nonredundant human, mouse, and rat database using Mascot Daemon. The data searches from the MSMS analyses were compared, and a unified hit list with confidence levels was assembled. The assignment was based on the quality of the data, but a number of other factors were also considered: the expected mass of the protein, the number of peptides identified, and the number of sequenced peptides and the quality of that sequence data. Three levels of confidence were assigned: 3, high confidence; 2, medium confidence; and 1, low confidence.
Results
Histopathological Findings
H&E-stained kidney sections were used to examine any pathology present in the study animals (Figure 1 ). Minimal to moderate changes were observed in the kidneys of rats treated with NPAA (Figure 1B and 1F). These included increased interstitial matrix in the papilla, papillary congestion/ hemorrhage, cortical tubular protein casts, focal cortico-medullary interstitial nephritis, papillary necrosis, papillary collecting tubule hypertrophy, cortico-medullary and cortical collecting tubule dilation and cortico-medullary collecting tubular basophilia. Changes leading up to papillary necrosis were therefore associated with collecting tubule injury in both the cortex and papilla with progression to papillary necrosis in 8 out of 15 rats at day 15.
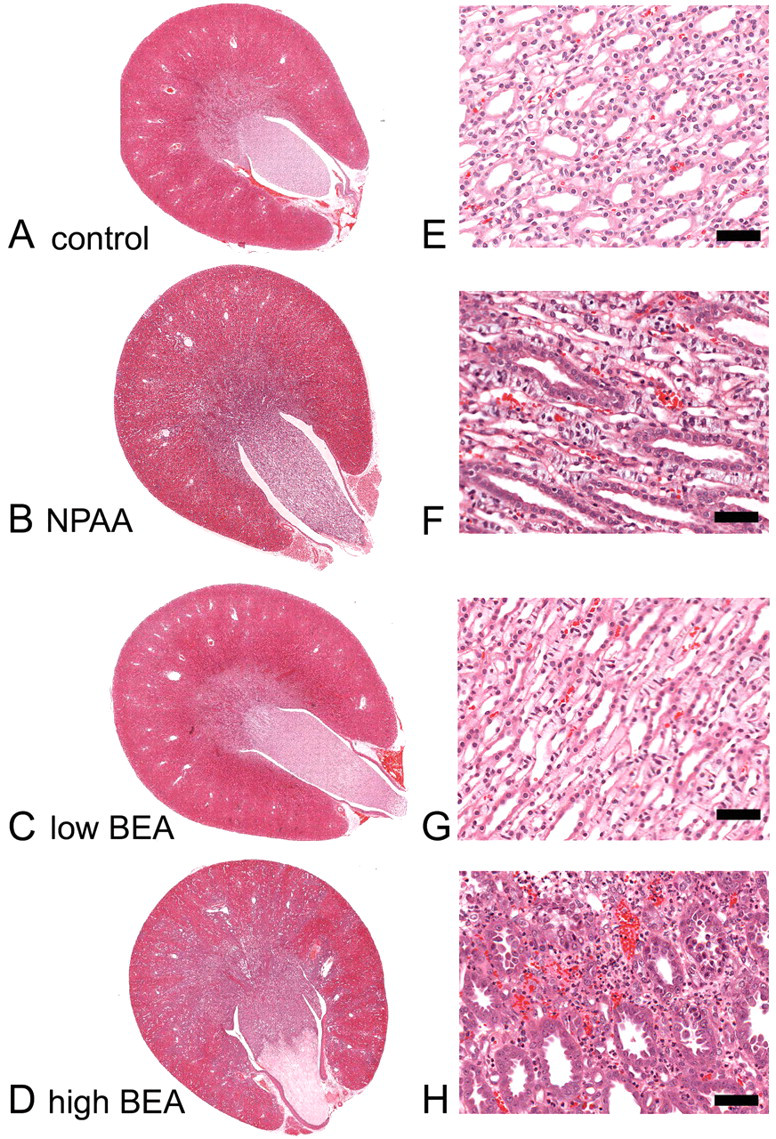
H&E staining of a representative whole rat kidney section taken at low magnification (A-D) and a higher magnification picture taken at the mid-papilla level (E-H). A and E are from a control rat, B and F from an NPAA (700 mg/kg) treated rat, C and G from a low-dose (25 mg/kg) BEA-treated rat and D and H from a high-dose (100 mg/kg) BEA-treated rat. Scale bar = 50 μm.
The degree of treatment-related pathology seen on day 15 after a single intraperitoneal dose of BEA was more consistent and severe than seen with NPAA (Figure 1C-H). Findings were similar to those described above for NPAA-treated animals but were mainly moderate to severe and were dose-dependent. Papillary necrosis was observed in 3 out of 5 low-dose BEA animals, 3 out of 5 mid-dose animals, and 4 out of 5 high-dose animals. Papillary necrosis was absent in control rats.
Immunohistochemistry
Immunohistochemistry revealed that the RPA-1 antibody selectively recognized collecting ducts in the cortex, medulla, and papilla in both treated and untreated animals, in both principal and intercalated cells (Figure 2A and 2E). Other nephron segments were negative for RPA-1 immunoreactivity. In treated animals the area of RPA-1 immunoreactivity was increased although the tubules were also dilated (Figure 2B-D and 2F-H). The necrotic tip of the papillae of more severely affected kidneys stained intensely and RPA-1 positive material could be seen in the lumen of tubules (Figure 2H). Using immunogold silver light microscopy and immunogold electron microscopy, RPA-1 immunoreactivity was clearly shown to be associated with the apical membrane of collecting duct cells and, to a lesser extent, at the basolateral membrane and associated with vesicular structures in the cytoplasm (Figure 3). Rat control tissue microarrays were immunostained to test for any tissue cross-reactivity of RPA-1 antibody. Most tissues tested were negative (adrenal, aorta, brain, caecum, colon, cornea, duodenum, harderian gland, heart, ileum, lens, liver, lung, mesenteric lymph node, muscle, ovary, pancreas, pituitary, prostate, rectum, retina, seminal vesicles, skin, spleen, stomach, sublingual gland, submaxillary gland, testis, thymus, thyroid, uterus); only sperm in the epididymis were positive (see Supplementary Figure 1). Species cross-reactivity was also tested for RPA-1 against mouse, dog, and human on formalin fixed tissue microarrays. Human and dog were both negative. Whilst the kidney was negative in mouse, semen and large intestine showed positive staining (not shown).
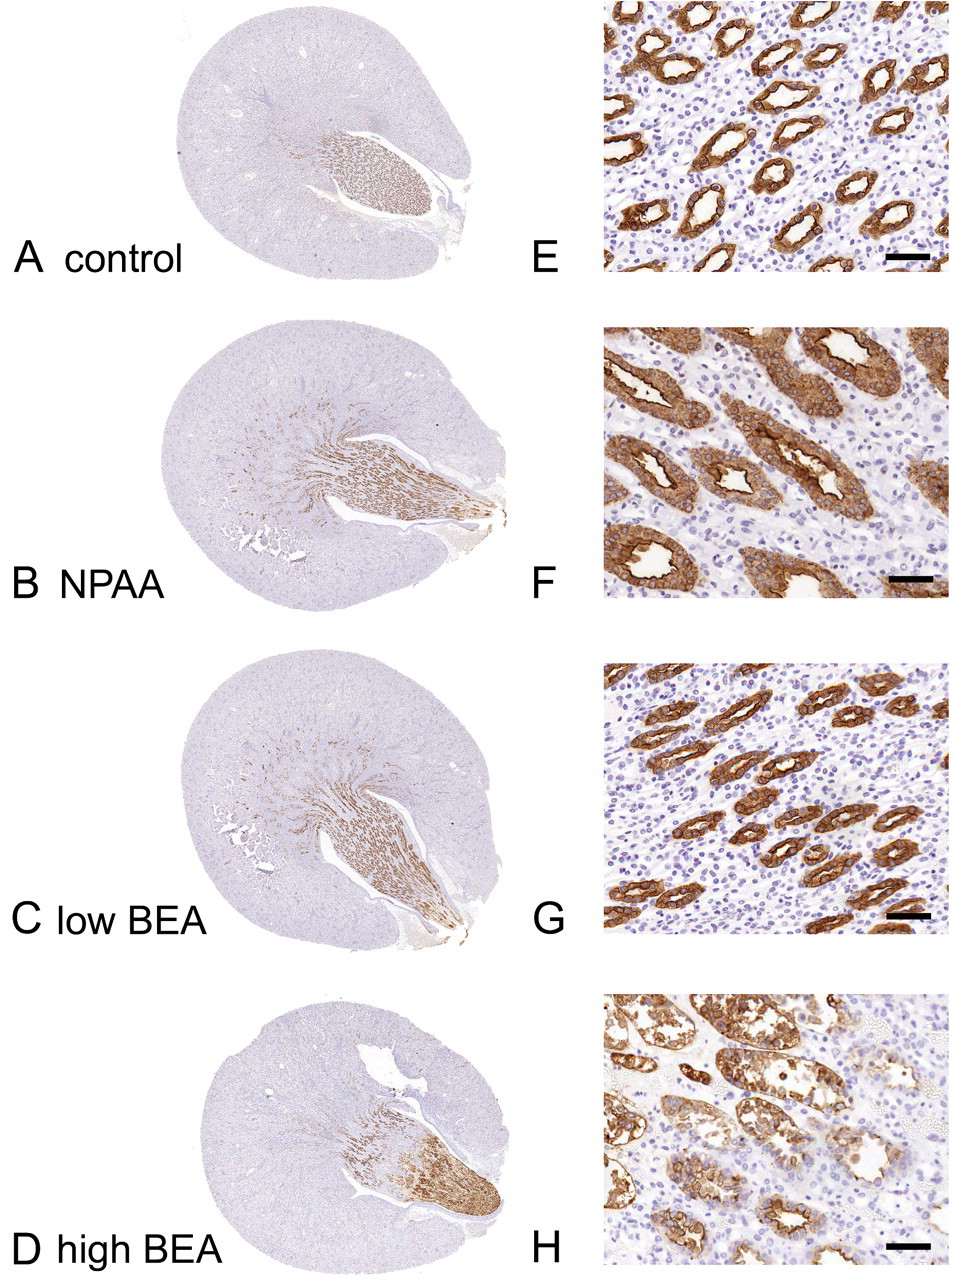
RPA-1 immunohistochemistry on a representative whole rat kidney section taken at low magnification (A-D) and a higher- magnification picture taken at the mid-papilla level (E-H). A and E are from a control rat, B and F from a NPAA (700 mg/kg)- treated rat, C and G from a low-dose (25 mg/kg) BEA- treated rat, and D and H from a high-dose (100 mg/kg) BEA- treated rat. Scale bar = 50 μm.
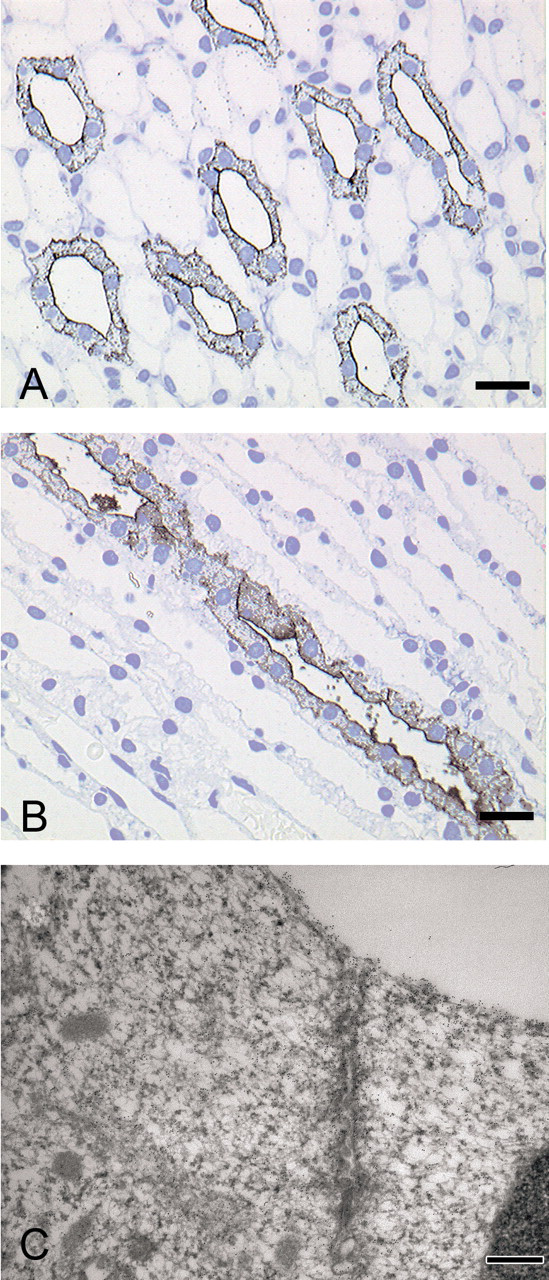
Immunogold silver with the RPA-1 antibody on a transverse section taken from the tip of the rat kidney papilla (A) and a longitudinal section further up the papilla toward the medulla (B). Immunogold electron microscopy with the RPA-1 antibody (C) on a section of tissue taken at the apical membrane of a collecting duct cell in the rat kidney papilla. Scale bar = 50 μm.
ELISA
Using an ELISA assay, we determined the expression of RPA-1 in control rats and rats treated with a single intraperitoneal dose of BEA (Figure 4A) and repeat oral daily doses of NPAA (Figure 4B). Four days before treatment with BEA, all animals had a low level of RPA-1 present in the urine and there was no significant difference between any of the groups. Three days following treatment, there was a large increase in the amount of RPA-1 present in the urine of all 3 treatment groups (approximately tenfold increase). In all 3 dose groups RPA-1 levels were statistically significantly higher than the control, where the expression was similar to that before dosing. Five days after BEA dosing, the RPA-1 values for each group were similar to those at 3 days, and the expression in all 3 dose groups remained significantly higher than the controls. Eleven days after dosing, the mean of each dose group remained higher than that of the control group, but these were not statistically significant compared with the controls. This suggests that urinary RPA-1 levels reflect recovery after injury. This was supported by a subsequent study where RPA-1 levels peaked 5 days following a single injection of BEA and returned to control levels in 11/12 animals after 29 days, at which time there was minimal pathology except where the papilla tip had been lost (unpublished data). In the NPAA study there was also a significant increase in the amount of RPA-1 present in the urine of animals from the mid- and high-dose animals after 4, 6, 8, and 15 days of dosing. The low-dose group was not significantly different than the controls (Figure 4B). The highest RPA-1 values were obtained after 4 days of NPAA treatment, indicating that increased urinary RPA-1 is an early change. Histopathology was not carried out until 8 days after treatment, so it is not possible to assess whether this preceded RPN. However, the histopathological changes seen after 15 days were more severe than those at day 8, indicating that the highest urinary RPA-1 levels occur before the most severe injury is observed.
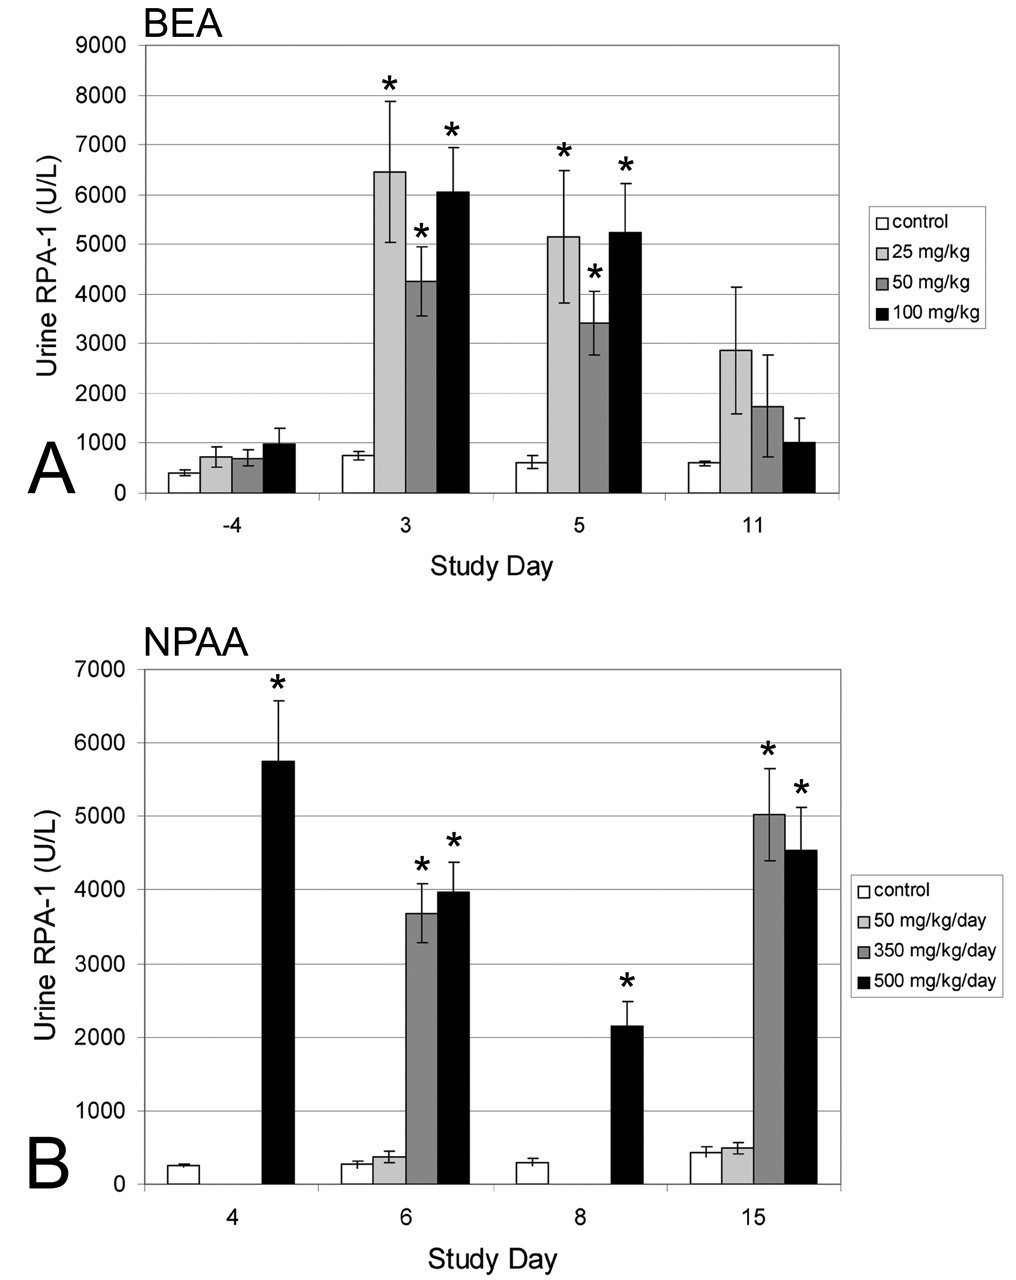
ELISA data for RPA-1 expression in rat urine from control animals or animals treated with BEA (A) or NPAA (B). Data are mean ± SEM (n = 5 for NPAA study and n = 13-15 for BEA study), * indicates value is statistically significant (p < .05, Shirley’s test) from the corresponding control animal value.
For the NPAA study, RPA-1 ELISA values for each animal (regardless of dose group) were plotted against the severity of RPN (graded 0-4; Figure 5 ). Animals that did not show RPN were further divided into those treated with vehicle and those treated with NPAA. All the vehicle-treated animals had low RPA-1 values, and an arbitrary cutoff value was set at the top of this range of values. All animals with RPN had RPA-1 values above this cutoff value. However, some NPAA-treated animals that did not display RPN also displayed high RPA-1 values, above the cutoff value.
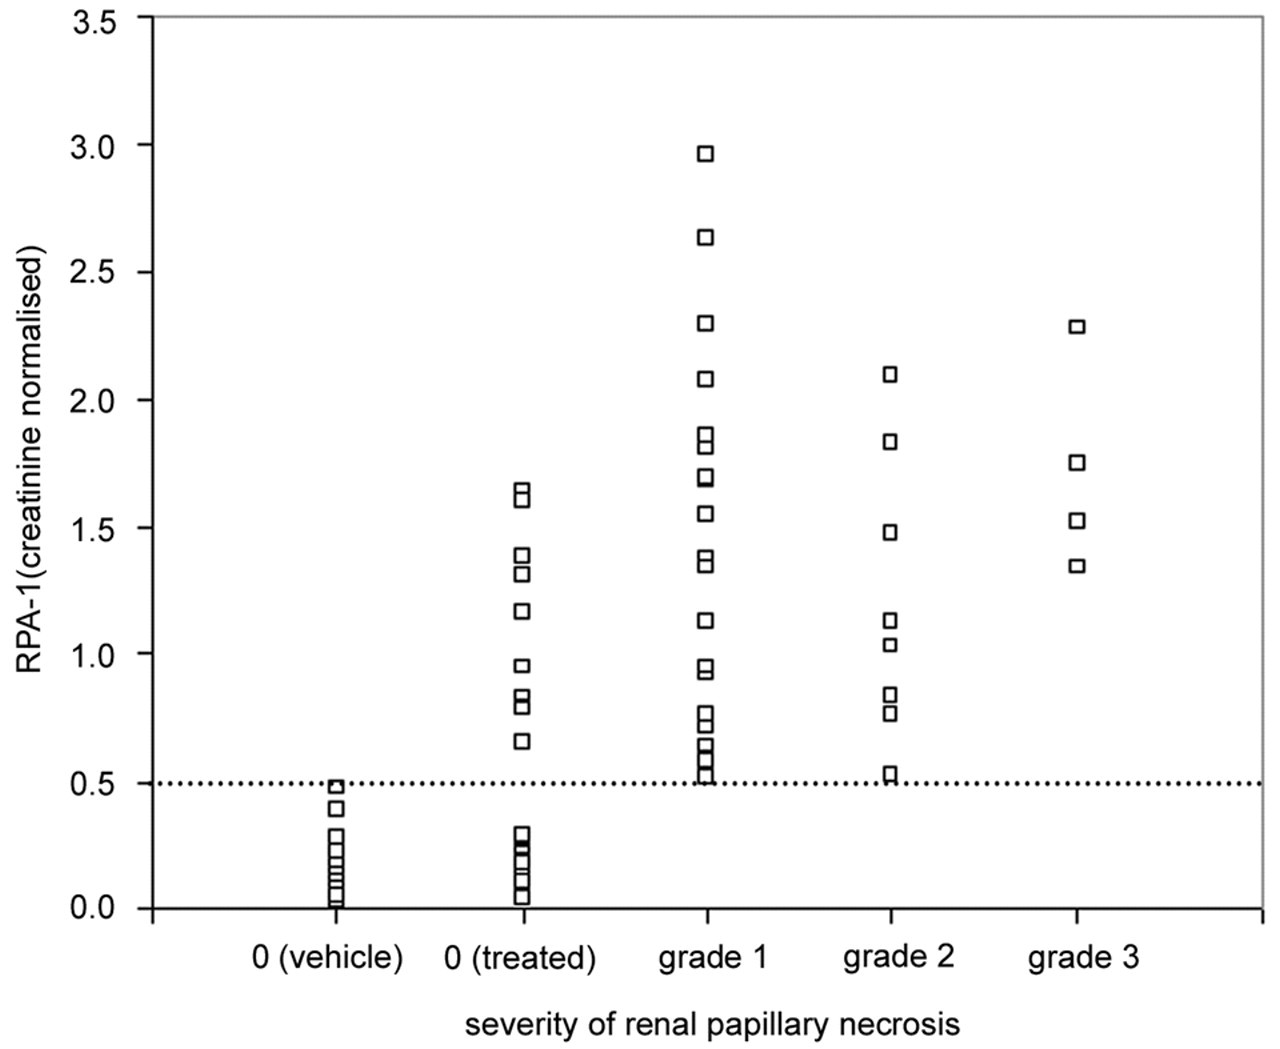
Data to show the correlation between RPA-1 levels in urine measured by ELISA and severity of renal papillary necrosis observed with NPAA. RPA-1 data is normalized to urine creatinine. Renal papillary necrosis is scored from grade 0-3 (none, minimal, mild, and moderate damage, respectively).
Western Blotting
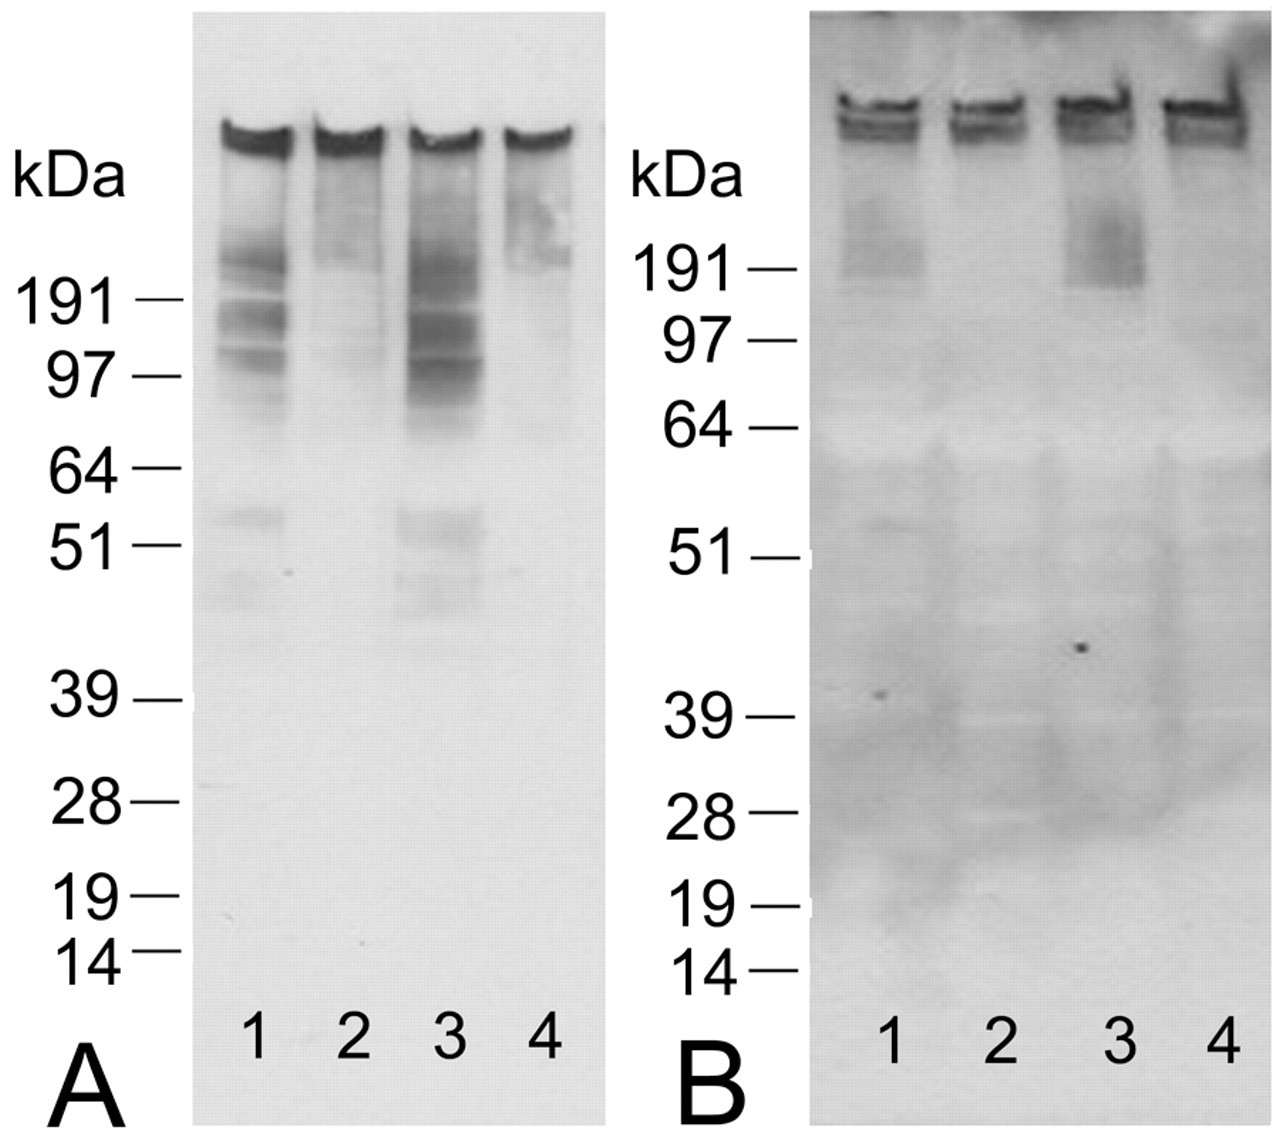
Initially the RPA-1 antibody was tested by western blotting using control rat kidney papilla homogenate (Figure 6A). These showed high molecular weight diffuse immunoreactivity from approximately 100kDa upward in size. Two regions of greater intensity staining could be detected, one at the origin of the gel and the other above the highest molecular weight marker, estimated to be 400-500kDa. Isotype controls were negative except for a faint band just below the 51kDa marker. This pattern of immunoreactivity was not altered under strong reducing conditions. Western blotting on control rat urine also showed high molecular weight immunoreactivity (Figure 6B). Two prominent bands were observed: one at the origin of the gel and the other slightly below this. Longer exposures of film also revealed fainter, diffuse staining from about 100kDa upward. Similar to tissue, this pattern of immunoreactivity was not altered under strong reducing conditions. Isotype controls showed a diffuse band at approximately 28kDa in urine (corresponding to the region where major urinary proteins are very abundantly expressed) and a faint band just below the 64kDa marker with longer exposures of film.
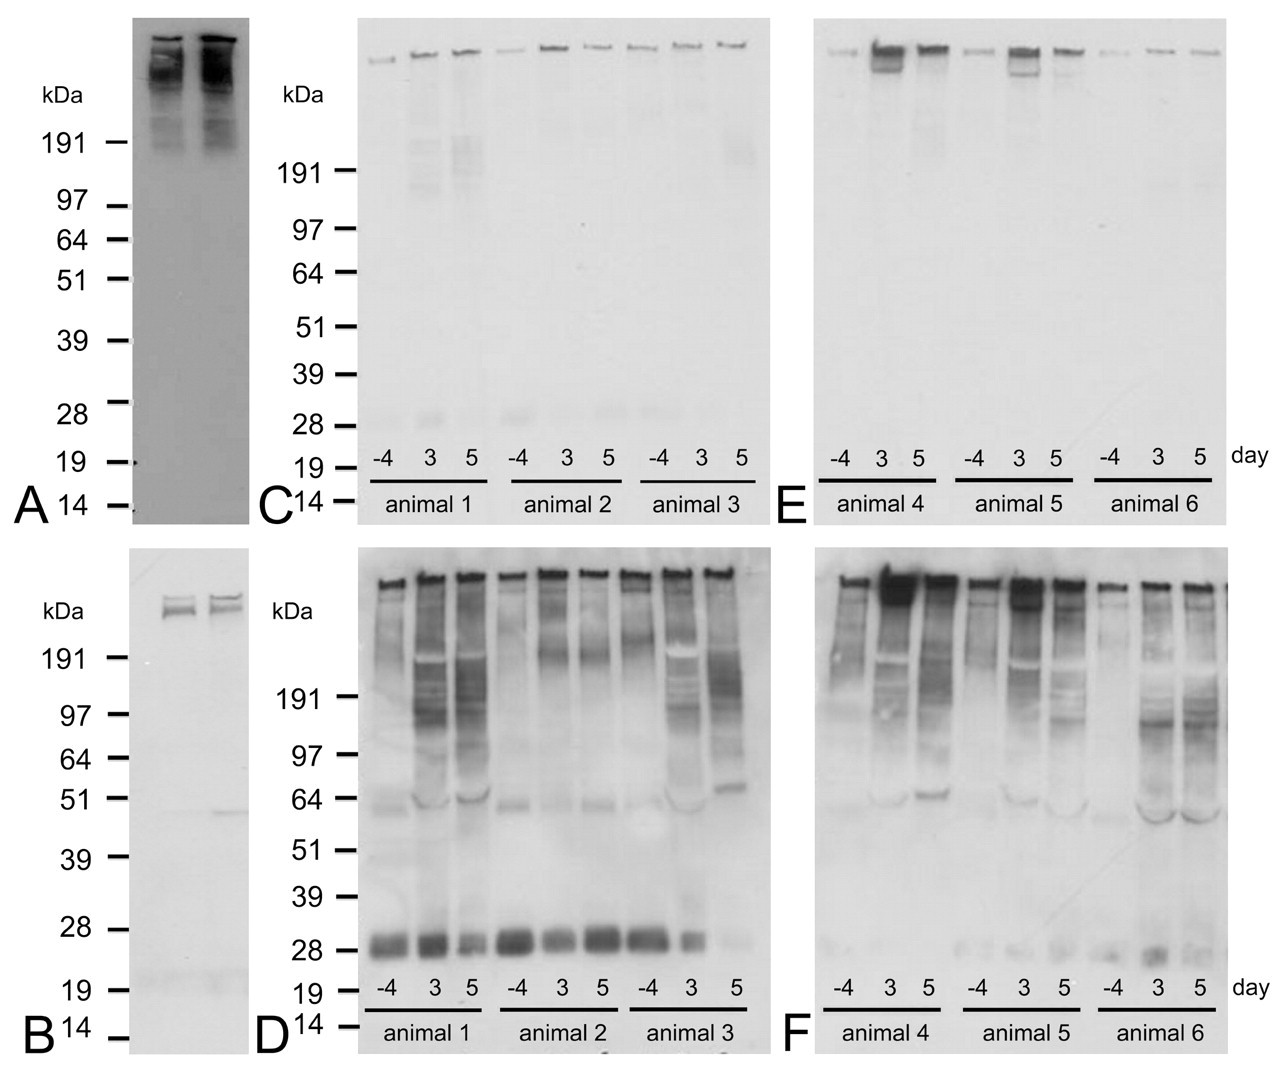
Western blots on control rat urine (A) and control rat kidney papilla homogenate (B). Lane 1 is a nonreduced sample and lane 2 is a reduced sample. Pictures C-F show western blots for urine samples taken from mid-dose (C and D, animals 1-3) or high-dose (100 mg/kg) BEA treated rats (E and F, animals 4-6) 4 days before treatment and 3 and 5 days after treatment. Pictures D and F are longer exposures of the same film shown in C and E, respectively. Bands at approximately 28kDa and 64kDa are nonspecific and were the only bands to appear in the negative control.
The expression of RPA-1 in different tissues was also investigated by western blotting (see Supplementary Figure 2). Similar to the tissue microarrays, most tissues tested were negative for RPA-1. Also in agreement with the tissue microarrays, there was strong immunoreactivity in the epididymis. Weak immunoreactivity at the origin of the gel was detected in ileum and a diffuse signal was detected at about 100kDa in spleen.
Immunoreactivity was then investigated in urine from rats that had been treated with BEA. In the mid-dose BEA group there was an increase in the amount of immunoreactivity after 3 and 5 days, compared with the predose urine (Figure 6C and 6D). The increase in immunoreactivity was observed at the origin of the gel and also in the lower molecular weight region. The biggest increase was seen in animals 1 and 3, which also showed more severe papillary necrosis compared with animal 2. In the high-dose group there was also an increase in immunoreactivity 3 and 5 days after dosing (Figure 6E and 6F). Similar to the mid-dose group, the increase was observed for all the different regions of immunoreactivity. The most significant changes were in animals 4 and 5, although all animals exhibited papillary necrosis of a similar severity. The western blot data were generally in good agreement with the ELISA data, at both the group and individual animal level.
Immunoprecipitation
Western blotting showed an enrichment of the RPA-1 antigen in the immunoprecipitated material from kidney; however, Coomassie and silver stained gels did not show any distinct protein bands in the corresponding regions of the gel (data not shown). There were several faint bands within the region corresponding to the immunoreactivity and these were cut out of the gel and the protein extracted for mass spectrometry. The proteins identified are shown in Table 1 . Immunoprecipitated material from urine also showed an enrichment of the RPA-1 signal. In urine a band could be detected on the silver stained gel and a very faint band on the Coomassie gel. However, mass spectrometry analysis failed to identify any proteins in these samples.
Proteins identified from immunoprecipitation of rat kidney papilla with the RPA-1 antibody.
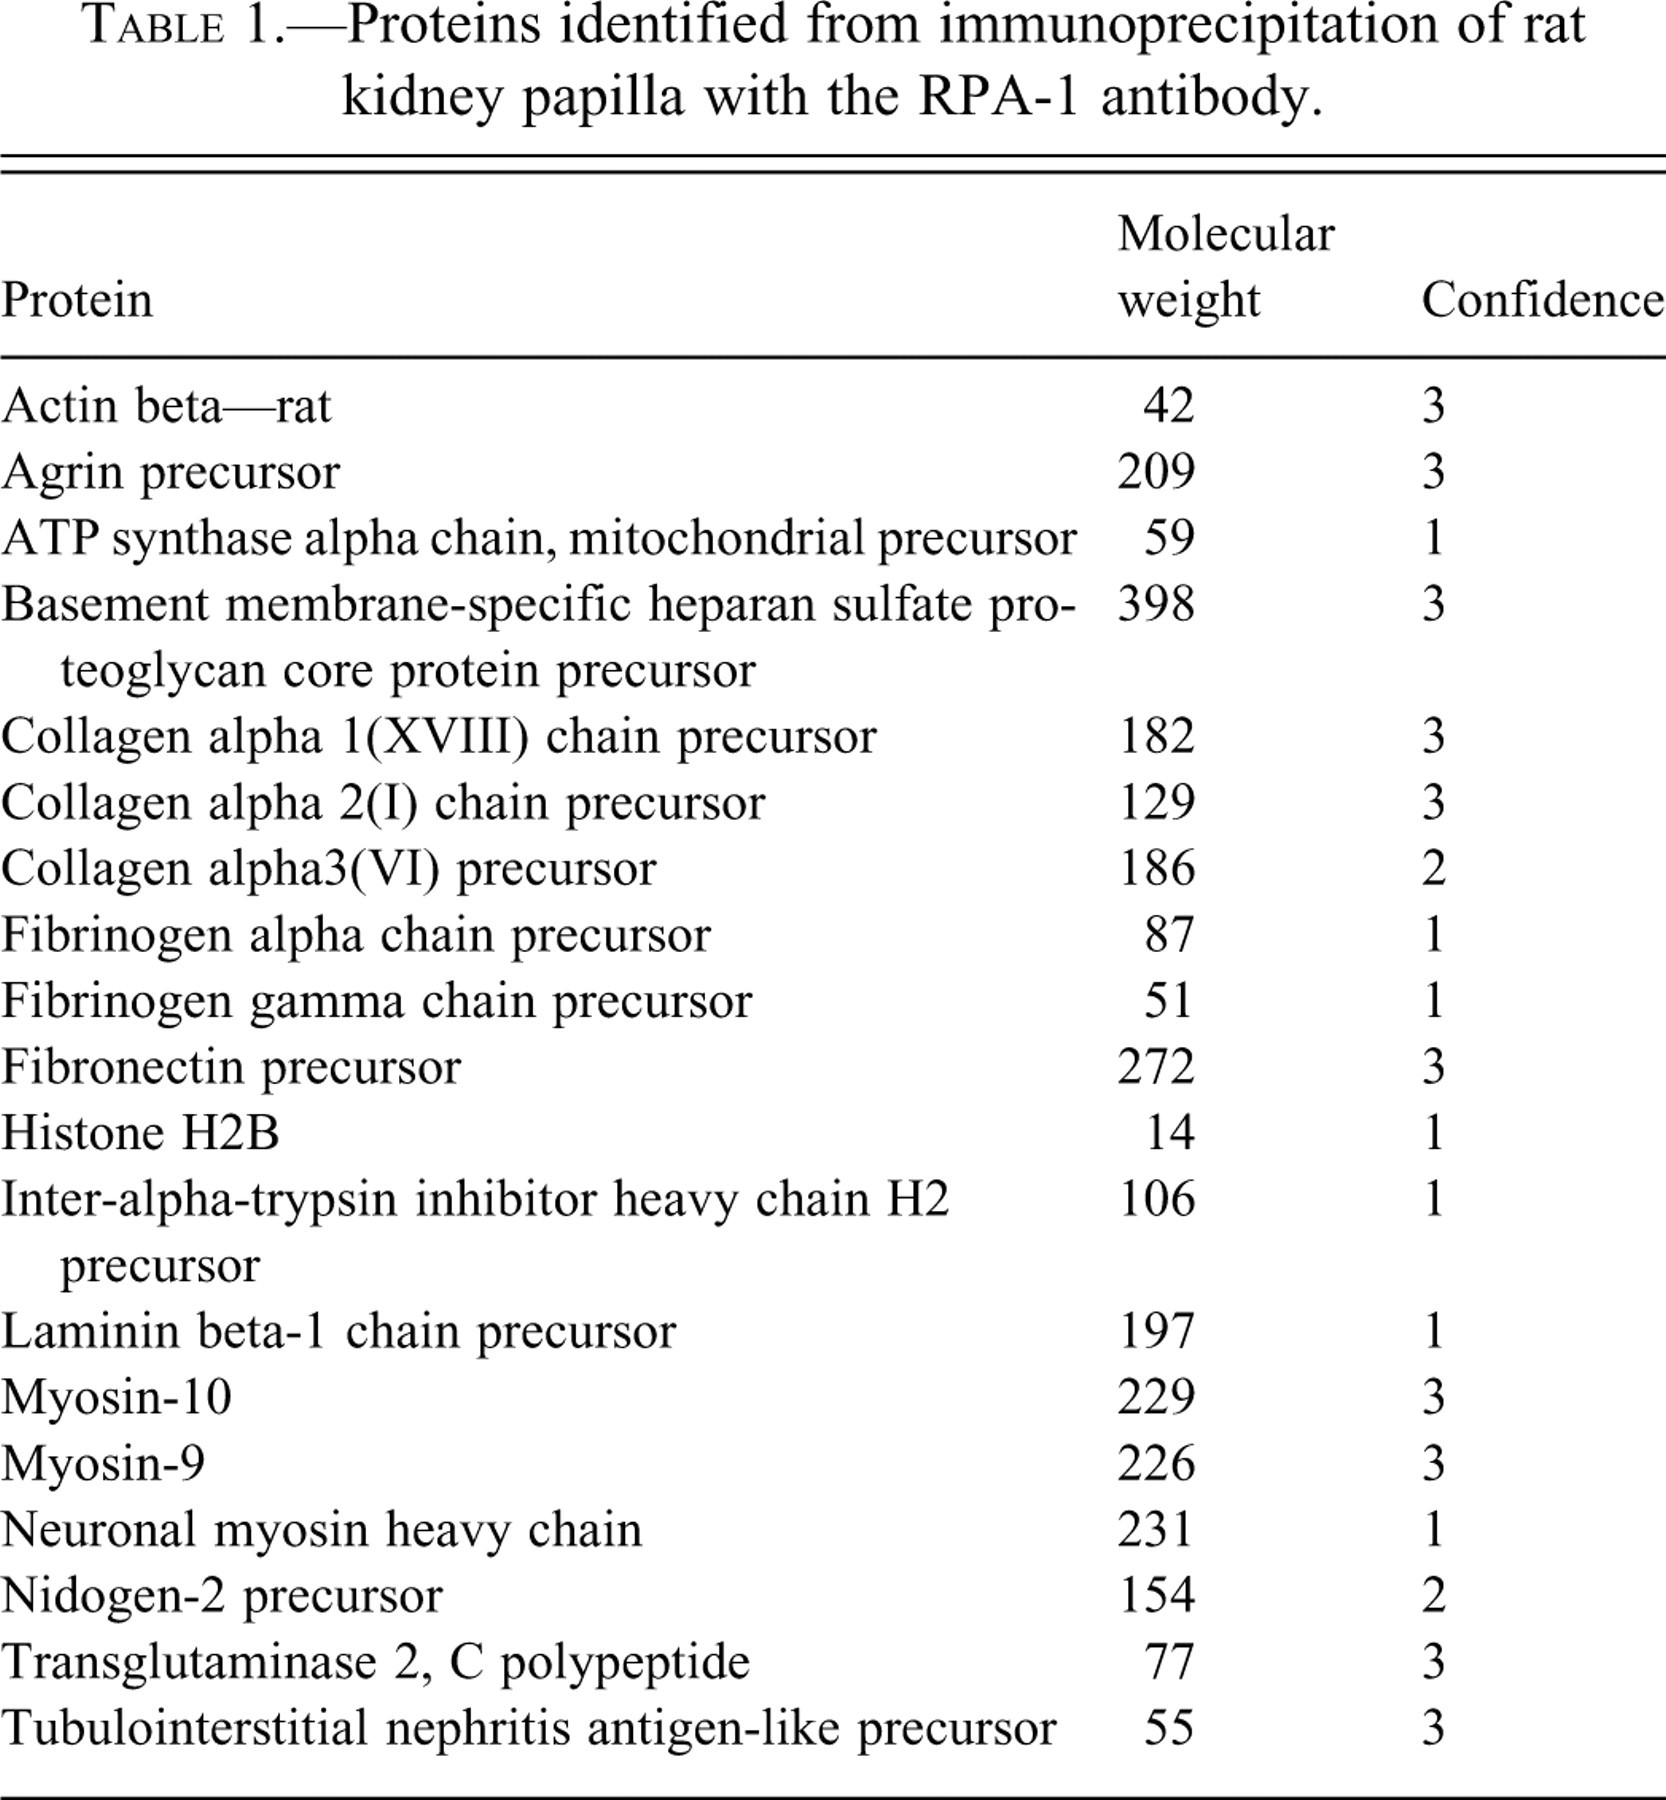
None of the proteins identified from kidney were known to possess the same collecting duct cell specificity as RPA-1. One of the proteins identified from several bands was heparan sulphate proteoglycan (HSPG), also known as perlecan. Perlecan was investigated further because of it being a large proteglycan. However, this protein is not collecting duct specific and is usually expressed predominantly on the basolateral membrane. Removal of glycans using either heparanase or chondroitinase ABC had no effect on the molecular weight of RPA-1 (assessed by western blotting), suggesting the identity of RPA-1 was unlikely to be a proteoglycan such as perlecan.
Deglycosylation
We further investigated whether the high molecular weight diffuse pattern of immunoreactivity with RPA-1 was due to heavy glycosylation. Different deglycosylation enzymes were tested either alone or in combination to investigate the effect on RPA-1 immunoreactivity by western blotting (Figure 7 ). Treatment of both papilla and urine samples with N-glycanase resulted in a significant reduction in the lower molecular weight immunoreactivity. At the concentrations tested, there was no obvious effect on the higher molecular weight immunoreactivity. No new lower molecular weight bands were evident after deglycosylation. There was no additive effect with any of the enzymes used to remove O-glycans.
Western blot data for deglycosylation of rat kidney papilla samples (A) or rat urine samples (B). Lane 1 represents a control sample, lane 2 a sample treated with N-glycanase (0.1 mU/ml), lane 3 a sample treated with O-glycanase (0.025 mU/ml), and lane 4 a sample treated with a combination of N-glycanase (0.1 mU/ml), O-glycanase (0.025 mU/ml), β(1-4) galactosidase (0.04 mU/ml) and β-N-acetylglucosaminidase (0.8 mU/ml). All samples were incubated overnight at room temperature.
Trypsin Digestion
Because N-glycanase abolished immunoreactivity rather than shifting the immunoreactivity to a lower molecular weight, we investigated whether the antigen recognized by RPA-1 may be carbohydrate rather than protein. Treatment of rat kidney homogenates with trypsin did not produce any RPA-1 positive bands with a lower molecular weight. Increasing trypsin concentrations resulted in a concentration-dependent loss of the RPA-1 signal rather than a shift in the molecular weight (data not shown). These data suggest that a protein component is also needed for antigen recognition by the RPA-1 antibody.
Purification of RPA-1
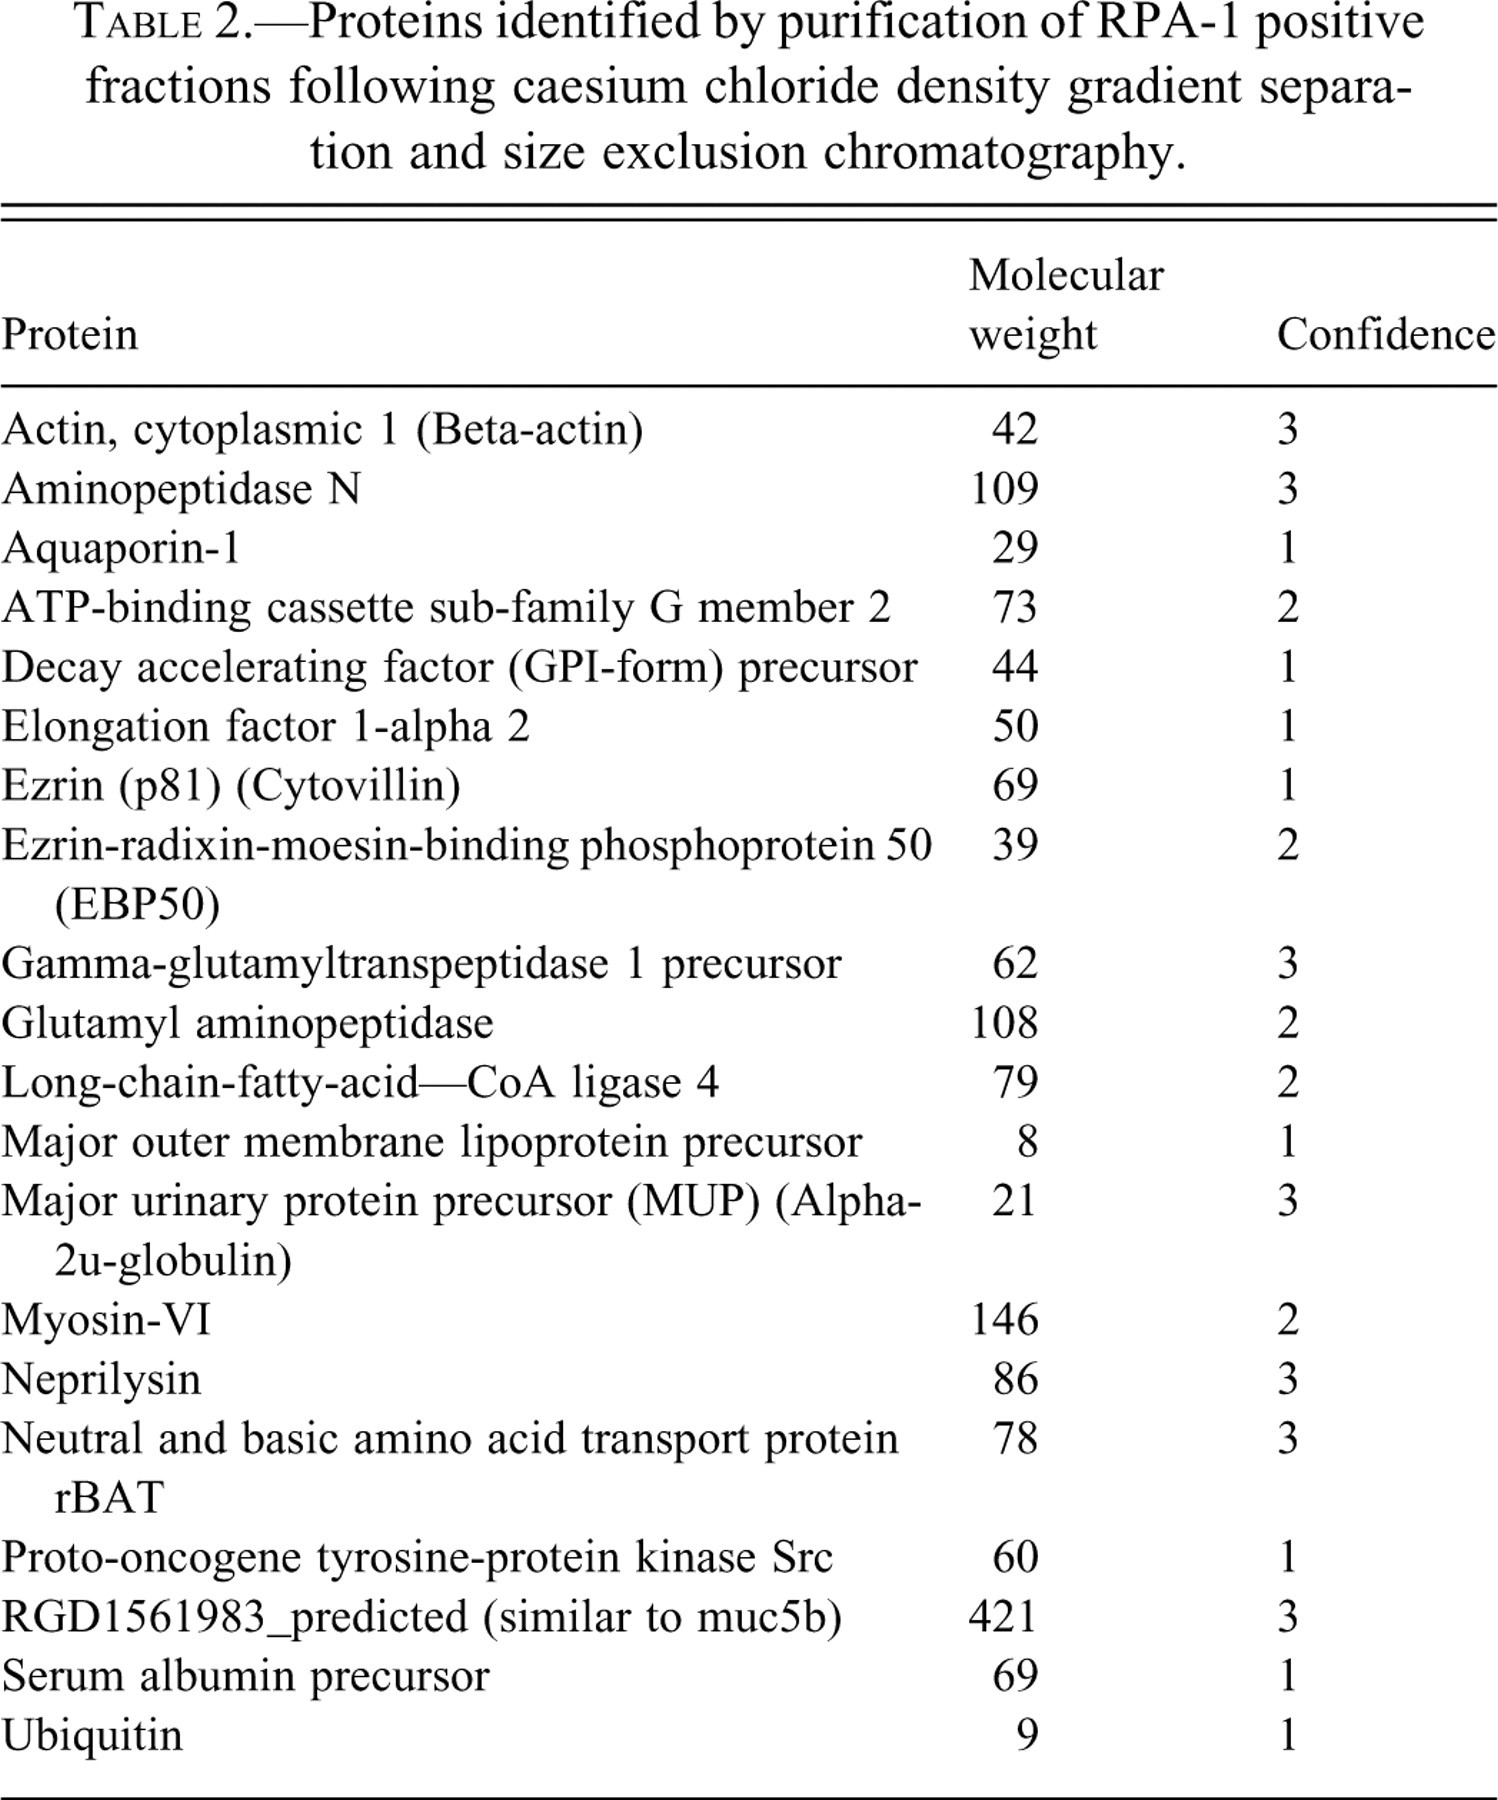
Agarose gel electrophoresis and size exclusion chromatography were successfully used to partially purify RPA-1. Following cesium chloride density centrifugation, agarose gels showed that RPA-1 was present in fractions ranging from densities of 1.28mg/ml to 1.40mg/ml in papilla and 1.35mg/ml to 1.38mg/ml in urine (Figure 8A and 8B). The RPA-1 positive fractions were separated by size exclusion chromatography. Figure 8C shows the optical density of slot-blotted fractions probed with RPA-1 antibody or stained with PAS. In urine the PAS signal was too weak to analyze; however, in tissue PAS staining revealed two distinct populations of RPA-1 positive fractions: the less dense fractions were PAS negative, whereas the more dense fractions were PAS positive. These fractions were either purified further by electrophoresis or passed through a nitrocellulose membrane, before digestion for mass spectrometry. A list of proteins identified is shown in Table 2. Similar to the proteins identified in Table 1, none of these were known to be collecting duct specific or of the right molecular weight.
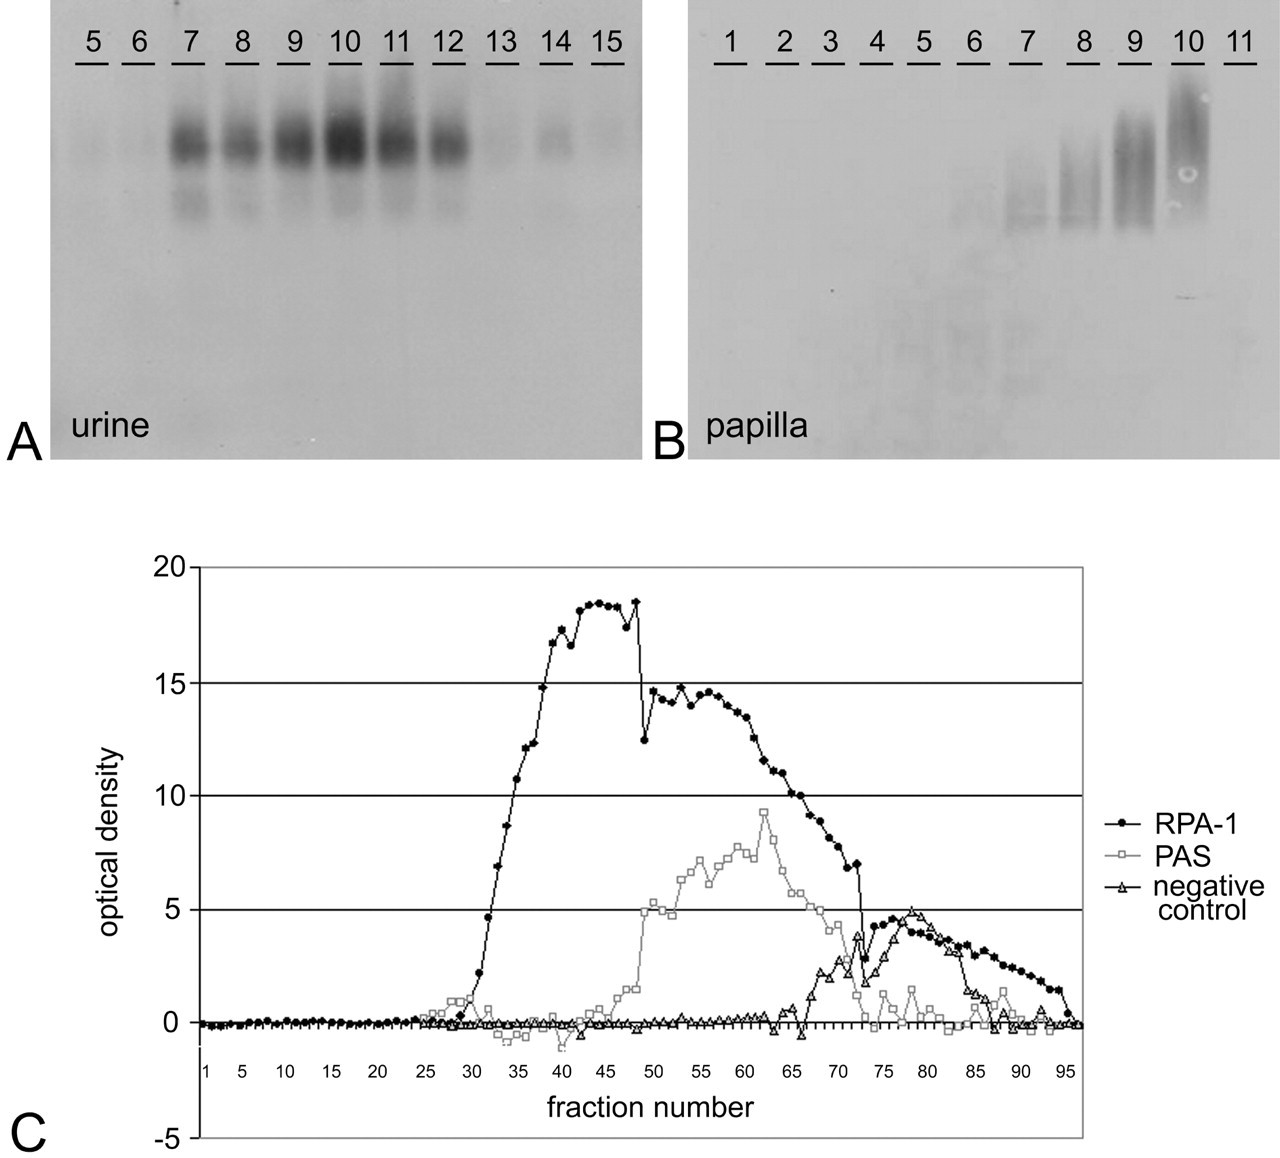
Western blots with RPA-1 from 0.7% agarose gels on fractions of rat urine (A) or kidney papilla homogenate (B) after separation using cesium chloride density centrifugation. Below (C), graph of fractions following size exclusion chromatography of kidney papilla homogenate against optical density of signal obtained from RPA-1 or PAS slot blots.
Proteins identified by purification of RPA-1 positive fractions following caesium chloride density gradient separation and size exclusion chromatography.
Phage Display Library Screening
Another approach used to try to identify RPA-1 was to screen the antibody against a peptide phage display library. Three rounds of panning and amplification were carried out using 2 different libraries (one library containing cyclic peptides and the other linear peptides). Twenty phage colonies were picked and sequenced; however, all the phage were empty plasmids (not shown). This suggested that the epitope may be nonlinear or nonprotein.
Discussion
This study clearly shows that RPA-1 is an early preclinical marker of RPN; two different model toxins were used and large increases in signal were obtained, both by western blotting and ELISA. High values for RPA-1 were obtained in some animals that did not display RPN; however, these animals displayed histological changes such as increased interstitial matrix and hypertrophy of collecting ducts (Wang et al. 2006) that lead to RPN, whereas all the vehicle-treated animals showed low RPA-1 values. This suggests either that RPA-1 is an early marker for RPN, or it is a marker of collecting duct damage that is a feature of RPN. The data also highlights the fact that whilst histopathology is used as the gold standard for determining kidney damage, it has the limitation that it can only be carried out at one time point. A urinary biomarker, however, can be repeatedly measured and therefore would be of great value, particularly if it detects early damage that may be reversible. There are currently no other biomarkers specifically for RPN; therefore we cannot compare the performance of RPA-1 to any other urinary markers. RPA-1 does appear to be specific for toxins that induce RPN as we did not see changes with other nephrotoxins (cisplatin–2.5 mg/kg, proximal tubule toxicant and cyclosporine A–40 mg/kg/day, distal tubule toxicant) by western blotting. This is in agreement with a recent study using cisplatin (Gautier et al. 2007) that showed only slight increases in RPA-1 by ELISA with the highest dose of cisplatin. The authors suggested this was due to concomitant lesions of the collecting ducts in the cortical region of the kidney with the high dose of cisplatin.
RPA-1 antibody did not appear to cross-react with mouse or human kidney on formalin-fixed, paraffin-embedded tissue. This was disappointing as it prevents RPA-1 being used in more extensive preclinical and clinical drug safety testing. However, we have recently been investigating other antibody clones that were produced in a similar way to RPA-1 and show similar molecular properties. These clones have shown good species cross-reactivity, and it is hoped that these antibodies can be developed as pan-species collecting duct biomarkers.
We also extensively investigated the molecular properties of RPA-1 and have discovered some key biochemical characteristics. Immunohistochemistry confirmed previous observations (Falkenberg et al. 1996) that RPA-1 is found specifically in collecting duct cells within rat kidney. In contrast to a recent study, RPA-1 was not expressed in proximal tubules of the kidney (Zhang et al. 2008), although the staining in that study may be nonspecific because it was weak and isotype controls also showed some positive staining (Zhang, Shaw, and Goering 2008). Strong immunoreactivity in proximal tubules has been observed in female rats but only in 24-week-old animals, suggesting that RPA-1 may be under hormonal regulation (Falkenberg et al. 1996). The membranous localization of the antigen would explain the presence of RPA-1 in normal urine because there is physiological shedding of the tubule membranes (De Broe et al. 1977). Regarding the tissue specificity, RPA-1 is most likely to have come from the kidney because there is no expression in the majority of tissues. It is possible that some immunoreactivity detected in urine comes from semen in male rats because there was positive immunoreactivity found in sperm in the epididymis. However, in a different study, RPA-1 values in female urine were not significantly different than males, suggesting that the kidney is the primary source of antigen.
These studies revealed some defining biochemical properties of RPA-1. It is a heterogeneous molecule with some species being very large in size (in the mega Dalton range, shown by size exclusion chromatography). RPA-1 is a glycoprotein, and the actual epitope recognized by the RPA-1 antibody is likely to be carbohydrate in nature, forming part of an N-linked glycoprotein. Collecting duct-specific proteins of high molecular weight and unknown identity have been described previously in rabbit kidney (Bachmann, Gilbert, and Minuth 1987; Gilbert, Minuth, and Bachmann 1987; Minuth and Gilbert 1988). Similarly, specific sugars recognized by Dolichos biflorus agglutinin (DBA), a lectin specific to terminal alpha-N-acetylgalactosamine residue (Etzler and Kabat 1970), are known to be expressed by collecting duct cells (Watanabe et al. 1981). Screening of the RPA-1 antibody against a library of phage display peptides did not result in the selection of peptides with any consensus sequence. This suggests that the epitope may be nonlinear or would support the hypothesis that the epitope is, at least in part, carbohydrate.
Several different approaches were taken to purify RPA-1, but this was difficult because RPA-1 is of low abundance and it binds irreversibly to many matrices (Falkenberg et al. 1996). The majority of proteins identified from tryptic digests of partially purified RPA-1 did not show any specificity for kidney. Furthermore, none were obvious candidates for being RPA-1 based on their molecular weights and lack of specific expression in collecting ducts in the kidney. However, it is possible that some of these proteins form a complex that is specific to collecting ducts. Many of the proteins identified were from high molecular weight gel bands despite being much smaller in molecular weight. This suggests they may be associated with other proteins, be multimers of themselves, or possess large post-translational modifications. RPA-1 must either be a homo-multimer or contain a repeating epitope because the ELISA uses the same antibody for capture and detection. However, any multimer or complex must be very stable because we were unable to reduce it to component proteins with strong reducing conditions. Complexes resistant to reducing conditions have been described by others (Casadevall et al. 1991; Salier et al. 1996; Zimmer et al. 1999). Falkenberg et al. (1996) suggested that RPA-1 might form a complex with Tamm-Horsfall (uromodulin) protein in urine, which could account for the high molecular weight. However, RPA-1 obtained from kidney is a similar molecular weight to that in urine, and Tamm-Horsfall protein is not localized in collecting ducts (Hoyer, Sisson, and Vernier 1979). It is possible that RPA-1 becomes associated with Tamm-Horsfall protein during sample preparation, when material from the distal tubules comes into contact with material from the collecting ducts. If this were the case, we would expect Tamm-Horsfall protein to have been identified by mass spectrometry carried out on RPA-1 positive samples; however, this did not occur. Peptides were identified by mass spectrometry that could not be matched to any protein in the databases. Thus, it is possible that RPA-1 has been identified in these experiments but at the current time we are unable to obtain the identity because of a lack of information available to us.
Because the exact molecular identity of the biomarker was not determined, it is not possible to assess whether RPA-1 can provide mechanistic information regarding distal and papillary injury. However, it is predominantly a large membrane bound glycoprotein, and we have no evidence for any up-regulation of protein expression within the kidney following treatment with papillary toxins. Therefore it is likely that the increases in urine represent increased shedding of the epithelial cell membranes; this is particularly marked when there is frank necrosis. However, increases in RPA-1 are observed at time points that precede the pathology. It is not certain whether this reflects “leakage” of cytoplasmic RPA-1 or whether there is increased shedding of membranous RPA-1. The changes observed in RPN are very abrupt and show a very distinct transition between the necrotic tip and adjacent degenerative cells. In some animals hypertrophic collecting ducts and cells with early nuclear pleiomorphism can be observed above the necrotic tip. Occasional cells that displayed morphological features of apoptosis were present, but we did not look specifically for apoptotic changes, for example, by caspase 3 immunohistochemistry.
In summary, RPA-1 shows great utility as a preclinical urinary biomarker that could be used to detect early RPN in drug safety assessment. It is largely kidney specific and appears in urine early after damage, at a stage where RPN is not present histopathologically and is potentially reversible. It will also be of great interest to evaluate RPA-1 in metabolic diseases such as diabetes (with or without nephropathy) and ischemic renal injury, which are known to cause RPN and may be more chronic insults. Whilst the identity of RPA-1 is currently unknown, new, emerging technologies and further development of rat bioinformatics databases are necessary to determine the exact identity of the molecule. This would enable us to identify the human equivalent of RPA-1, which would be extremely valuable in early diagnosis of kidney failure following drug treatment.
Footnotes
Argutus Medical Limited, formerly Biotrin International Limited, has an exclusive license agreement with CIRES GmbH to commercialize the RPA-1 antibody.
Acknowledgments
This project is sponsored by a grant from the UK DTI-TSB Technology Programme (grant K0508E to GRB and DR). The authors would like to thank Biotrin International (now Argutus Medical) for the gift of RPA-1 antibody, Dr. David Thornton at the University of Manchester for advice on purification of RPA-1, Alison Bigley at AstraZeneca for assistance with electron microscopy, and Ian Hardern at AstraZeneca for assistance with size exclusion chromatography.