
Abstract
We recently reported results that erythropoiesis-stimulating agent (ESA)–related thrombotic toxicities in preclinical species were not solely dependent on a high hematocrit (HCT) but also associated with increased ESA dose level, dose frequency, and dosing duration. In this article, we conclude that sequelae of an increased magnitude of ESA-stimulated erythropoiesis potentially contributed to thrombosis in the highest ESA dose groups. The results were obtained from two investigative studies we conducted in Sprague-Dawley rats administered a low (no thrombotic toxicities) or high (with thrombotic toxicities) dose level of a hyperglycosylated analog of recombinant human erythropoietin (AMG 114), 3 times weekly for up to 9 days or for 1 month. Despite similarly increased HCT at both dose levels, animals in the high-dose group had an increased magnitude of erythropoiesis measured by spleen weights, splenic erythropoiesis, and circulating reticulocytes. Resulting prothrombotic risk factors identified predominantly or uniquely in the high-dose group were higher numbers of immature reticulocytes and nucleated red blood cells in circulation, severe functional iron deficiency, and increased intravascular destruction of iron-deficient reticulocyte/red blood cells. No thrombotic events were detected in rats dosed up to 9 days suggesting a sustained high HCT is a requisite cofactor for development of ESA-related thrombotic toxicities.
Introduction
Erythropoiesis-stimulating agents (ESAs) are a class of therapeutics that increase red cell mass by increasing erythropoiesis in hematopoietic organs (Elliott, Pham, and Macdougall 2008). These drugs replace or supplement endogenous erythropoietin (EPO), the glycoprotein hormone responsible for maintaining an appropriate circulating red cell mass that delivers sufficient levels of oxygen to all tissues in the body (Kendall 2001).
We recently reported results from a retrospective analysis we conducted on study data obtained from a subset of preclinical toxicology studies with approved ESAs that reported sporadic occurrences of mortality or thrombotic events in rats, Beagle dogs, or cynomolgus monkeys (Andrews et al. 2013). All animals with mortality or thrombotic events had an extremely high hematocrit (HCT); the expected pharmacodynamic response from repeated dosing with ESAs. The causality of the ESA-related toxicities was historically attributed to the animal’s high HCT. However, a similarly high HCT was achieved in the lower dose groups of animals in these same studies, but no toxicities were reported challenging a high HCT as the sole causality in thrombosis. We directly tested the relationship between high HCT and ESA-related thrombotic toxicities by comparing the incidence of ESA-related thrombotic toxicities in rats administered a hyperglycosylated analog of recombinant human erythropoietin (rHu-EPO), AMG 114, at a higher dose level and increased dose frequency, to the incidence in lower dose groups with less frequent dosing. The results showed that ESA-related thrombotic toxicities were associated with increased dose level and dose frequency and were not solely dependent on a high HCT.
The purpose of this investigation was to identify the procoagulant factors present predominantly in the high-dose group of AMG 114–dosed rats with thrombotic toxicities compared to the low-dose group with no thrombotic toxicity, when both dose groups produced a similar maximal rise in HCT. By examining early time points in a 9-day study before an appreciable rise in HCT has occurred (6 hr through day 9), dose-related changes could be dissociated from effects of the accompanying high HCT present after 1 month of repeated dosing.
Material and Method
Investigative Studies with AMG 114 in Rats
Two investigative studies were conducted in rats administered an experimental hyperglycosylated analog of rHu-EPO (AMG 114) 3 times weekly, for up to 9 days or for 1 month, respectively. The low- and high-dose levels and dosing frequency were selected based on results from a prior study where a similarly increased HCT was achieved at both dose levels, but microscopic thrombotic toxicities were identified only in the high-dose group of animals after 1 month of dosing (data not shown).
Test Article
AMG 114 was stored at −70°C. The vehicle was 20 mM sodium phosphate, 140 mM sodium chloride, and 0.005% polysorbate 80, pH 6.2. Test and control article vials were stored at 2° to 8°C and used within 1 week of opening. Dose preparations were prepared on each day of dosing, stored at 2° to 8°C and allowed to equilibrate to approximate room temperature before dosing.
Test Animals
Male Crl:CD(SD) rats were cared for in accordance with the Guide for the Care and Use of Laboratory Animals, 8th ed. (National Research Council 2011) at an Association for Assessment and Accreditation of Laboratory Animal Care International, internationally accredited facility and determined to be specific pathogen free for Kilham Rat Virus, Rat Coronavirus/Sialodacryoadentitis Virus, Rat Parvovirus, Rat Minute Virus, Helicobacter species, pinworms, and fur mites. All research protocols were approved by the Charles River Laboratories Institutional Animal Care and Use Committee. At initiation of treatment, the animals were at least 8 weeks old and their body weights ranged from 350 to 400 g. Animals had ad libitum access to pelleted feed (Certified Rodent Diet #2016C, Harlan Teklad) and purified municipal tap water via automatic watering system. Animals were maintained on a 12:12 hr light–dark cycle in rooms at 18° to 26°C and 30 to 70% relative humidity. Animals were provided with cage-enrichment devices.
Experimental Conduct
Peer review of the clinical and anatomic pathology interpretations were conducted at Amgen. In both studies, animals were randomized into groups based on body weight and dosed with vehicle, or a 1.0 or 500 µg/kg/dose level of AMG 114, intravenous (IV), 3 times weekly for up to 9 days or for 1 month. The IV route was chosen to maximize exposure and minimize antibody response. Each animal was observed regularly for mortality, abnormalities, and signs of pain or distress, including 2 hr after each dose. Body weights were taken at least once during the predose phase, on the day prior to dose administration and prior to the animals scheduled necropsy. Ten animals per group were euthanized via exsanguination from the abdominal aorta/vena cava under deep isoflurane anesthesia and necropsied in the 9-day study at 6 (day 1), 24 (day 2), or 48 (day 3) hr post the 1st dose, 48 hr after the 2nd dose (day 5), or 48 hr after the 4th dose (day 9) and in the 1-month study at 24 hr after the 13th dose (day 30). All tissues from any animal that was found dead or euthanized at an unscheduled interval were also examined microscopically.
Clinical Pathology
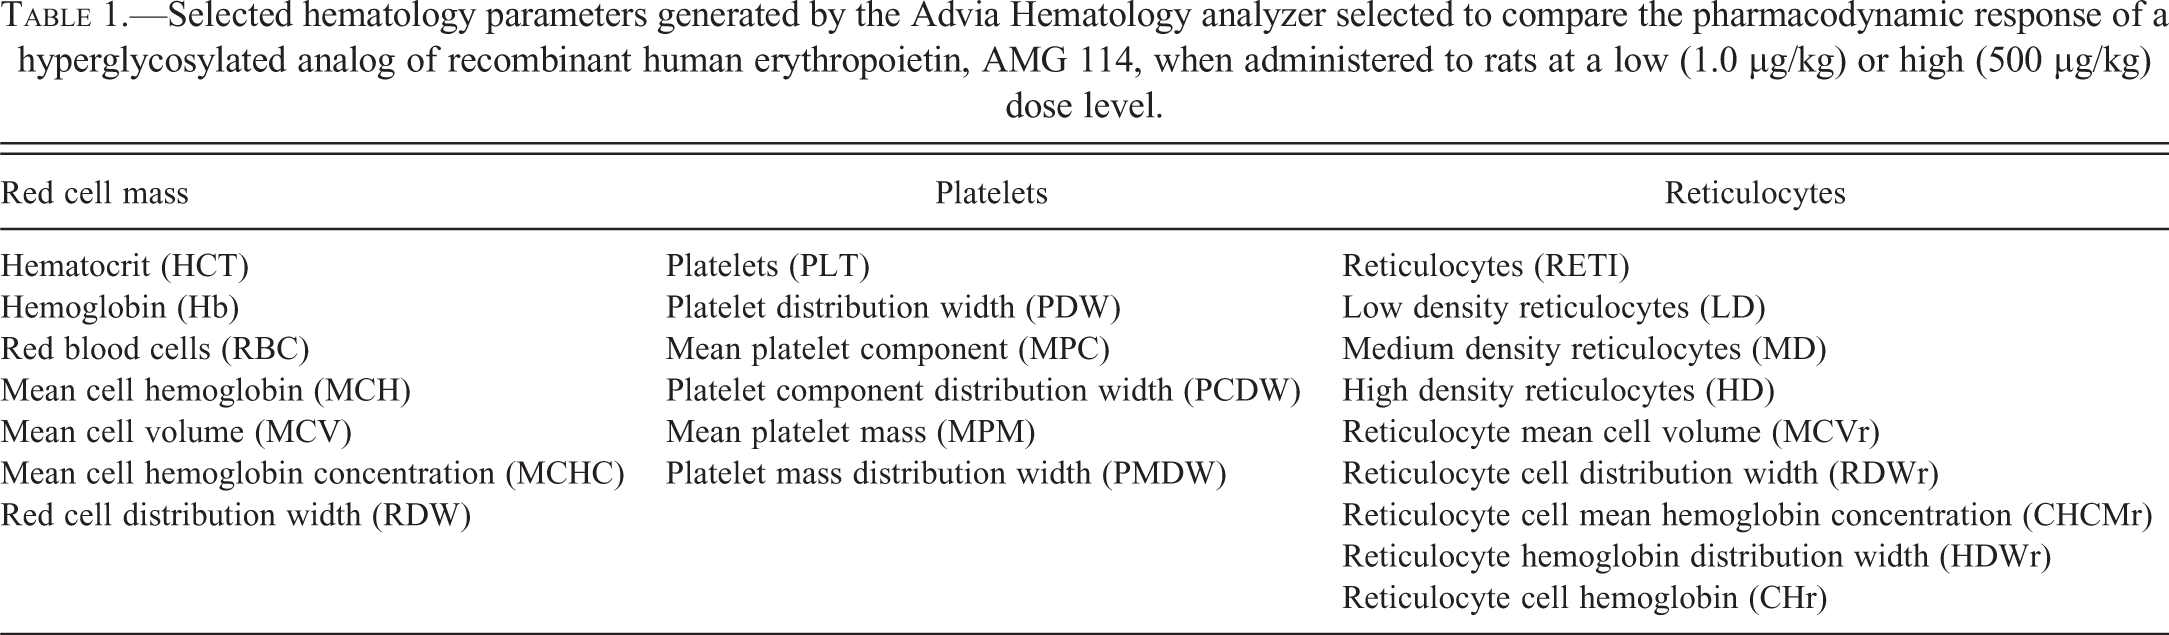
Blood was collected by syringe from the jugular vein and placed into potassium ethylenediaminetetraacetic acid (EDTA) anticoagulated tubes or tubes without anticoagulant from all animals immediately prior to necropsy. All animals in the 1-month study had an additional in-life blood collection on day 15. Blood was also collected from the vena cava of all animals during necropsy and placed into tubes without anticoagulant. Time points selected for evaluation reflected critical junctures in development of the ESA-driven erythropoietic response (9-day study) and during a sustained high HCT in the 1-month study. For hematology, EDTA-anticoagulated blood was analyzed by the Advia 2120 Hematology Analyzer (Siemens Healthcare Diagnostics, Deerfield, IL). The subset of hematology end points included for analysis in this investigation is listed in Table 1. The maturity of the circulating reticulocyte subpopulations was assessed based on Advia generated data that subdivided reticulocytes according to high (high-density reticulocytes [HD]), medium (medium density reticulocytes [MD]), and low (low-density reticulocytes [LD]) ribonucleic acid (RNA) content (density), corresponding to young (HD), middle aged (MD), and old (LD) reticulocytes. During our original assessment of the 1-month data set, high numbers of microcytic, hypochromic red blood cells (RBCs) were found to fall outside the volume/hemoglobin concentration analysis grid on the Advia Hematology analyzer, falsely elevating platelet (PLT) counts and mean platelet volume (MPV) by their inclusion in the PLT analysis region. After identification of this interference, raw Advia data from the 9-day investigative study were corrected by shifting the refractive index range allocated to large PLTs downward (1.35–1.40 to 1.33–1.372). The cluster analysis was applied to the reticulocyte scattergram allowing the RBC/reticulocyte and PLT regions to be defined by fixed values. Only PLTs and derived PLT and reticulocyte parameters were significantly different after re-gating. Absolute reticulocytes were slightly underestimated due to the artifact, but the difference was not statistically or clinically significant after the correction was applied. The raw Advia data from the 1-month study were not available for correction of PLTs or derived PLT and reticulocyte end points. A peripheral blood smear was prepared for each animal, stained with Wright’s stain, and reviewed for the presence of nucleated red blood cells (nRBC), microcytic and/or hypochromic cells, evidence of red cell fragmentation (i.e., schistocytes, hemoglobin [Hb] crystals, spherocytes) or oxidative injury (blister cells, keratocytes, eccentrocytes), and estimation of PLT numbers (decreased, increased, or normal). If sufficient serum was available, animals were assayed for iron (serum iron) and unbound iron-binding capacity (UIBC) as a surrogate for transferrin on the Roche Modular Analytics System (Hoffmann-La Roche, Basel, Switzerland). Total iron-binding capacity (TIBC) and the percentage of transferrin saturation (TSAT) were calculated from measured values. Measurement of serum haptoglobin was performed on an aliquot of serum stored at −80°C and shipped on dry ice for analysis at Myriad Rules Based Medicine (Austin, Texas).
Selected hematology parameters generated by the Advia Hematology analyzer selected to compare the pharmacodynamic response of a hyperglycosylated analog of recombinant human erythropoietin, AMG 114, when administered to rats at a low (1.0 µg/kg) or high (500 µg/kg) dose level.
Anatomic Pathology
Animals were fasted overnight prior to the scheduled necropsy with the exception of the 6-hr postdose necropsy animals in the 9-day study, which were fasted for at least 6 hr. Organ weights were obtained for brain, heart, liver, kidney, and spleen. A standard full set of tissues including heart valves was obtained from all animals, preserved in 10% neutral-buffered formalin, embedded in paraffin, sectioned, and stained with hematoxylin and eosin (H&E). Sections of spleen, kidney, and liver were also stained with Perls stain for iron. The H&E-stained tissue slides from control and treated animals of target organs identified as ESA-related (heart/heart valve, stomach, kidney, spleen, and bone/bone marrow from femur and sternum); in addition to liver, lung with large bronchi, duodenum, jejunum, ileum, and mesenteric vessels were reviewed microscopically for the presence of a thrombus or indirect evidence of a thrombotic event such as an infarct and/or combinations of findings such as focal necrosis, fibrosis, inflammation, and hemorrhage. Heart valves were evaluated specifically for evidence of an ESA-related valvulopathy characterized by varying degrees of endothelial/stromal hyperplasia, inflammation, and hemorrhage (Andrews et al. 2013). The glandular portion of the stomach was also evaluated for evidence of necrosis/erosion/ulceration; a lesion also associated previously with ESA administration in rats (Andrews et al. 2013). Increased erythropoiesis in the spleen and bone marrow was estimated microscopically by an experienced pathologist (RB) using a 3-grade scale (Table 2). The severity was graded according to the approximate area percentage of hematopoietic cells within spleen or bone marrow sections that was increased above control animal tissues (Figure 1). The results were expressed as a group mean severity score calculated by converting the assigned severity grade into a numerical value and determining the group mean value. Iron content in the Perls stained spleen, liver, and kidney was qualitatively assessed by microscopically estimating the amount of positive (blue) staining iron present in tissues. Due to considerable variability in splenic iron content observed in control and AMG 114–treated animals, splenic iron content was further characterized microscopically using a 3-grade scale based on the amount of positive stain present in the Perls stained spleen sections (Table 2; Figure 2). Results of the histologic evaluation were reported as group mean severity score as described above.
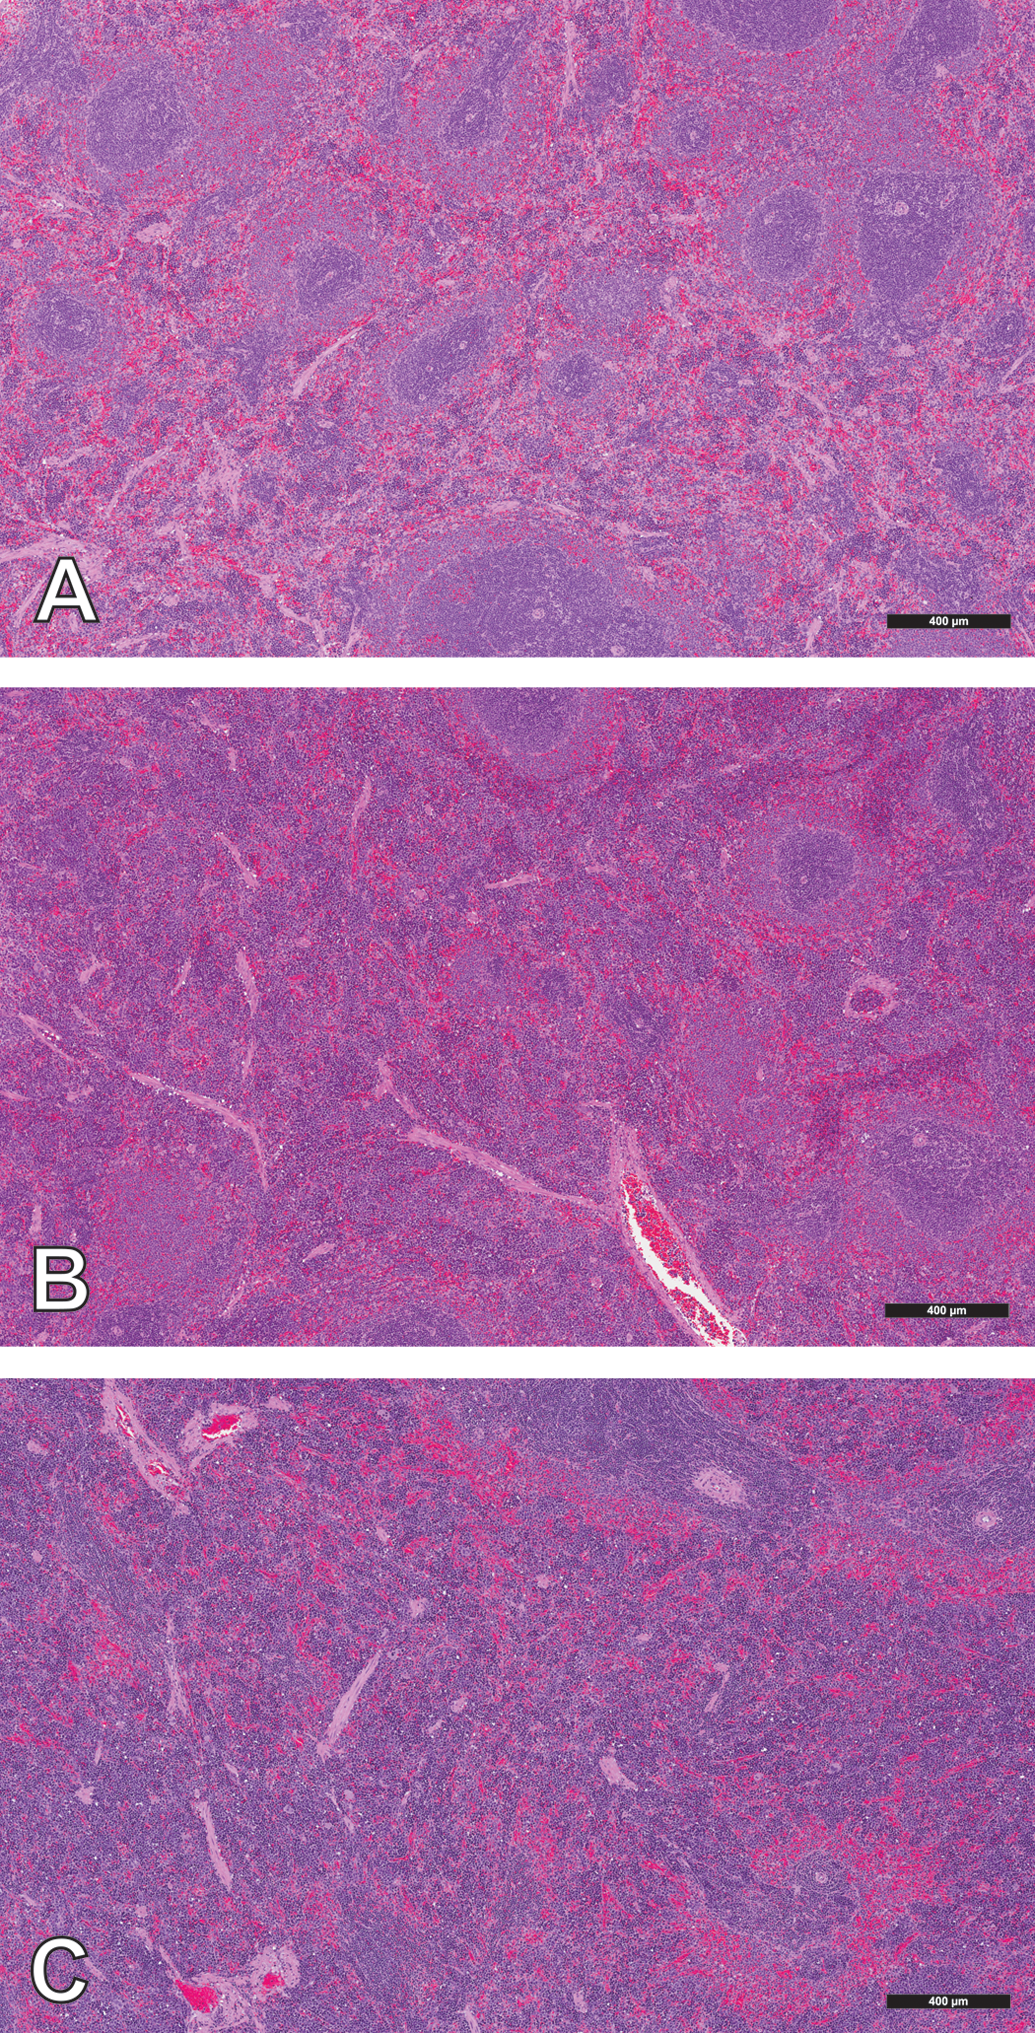
Representative photomicrographs of increased splenic erythropoiesis in Sprague-Dawley rats administered a hyperglycosylated analog of recombinant human erythropoietin, AMG 114. The amount of splenic tissue with active erythropoiesis increased above control animals was estimated microscopically and assigned a grade corresponding to (A) minimal/mild, 10 to 40% increased above controls; (B) moderate, 41 to 60% increased above controls; and (C) severe, >60% increased above controls. All tissues are stained with H&E. Grade 0; no increase compared with controls (<10% increase) not shown. H&E = hematoxylin and eosin.
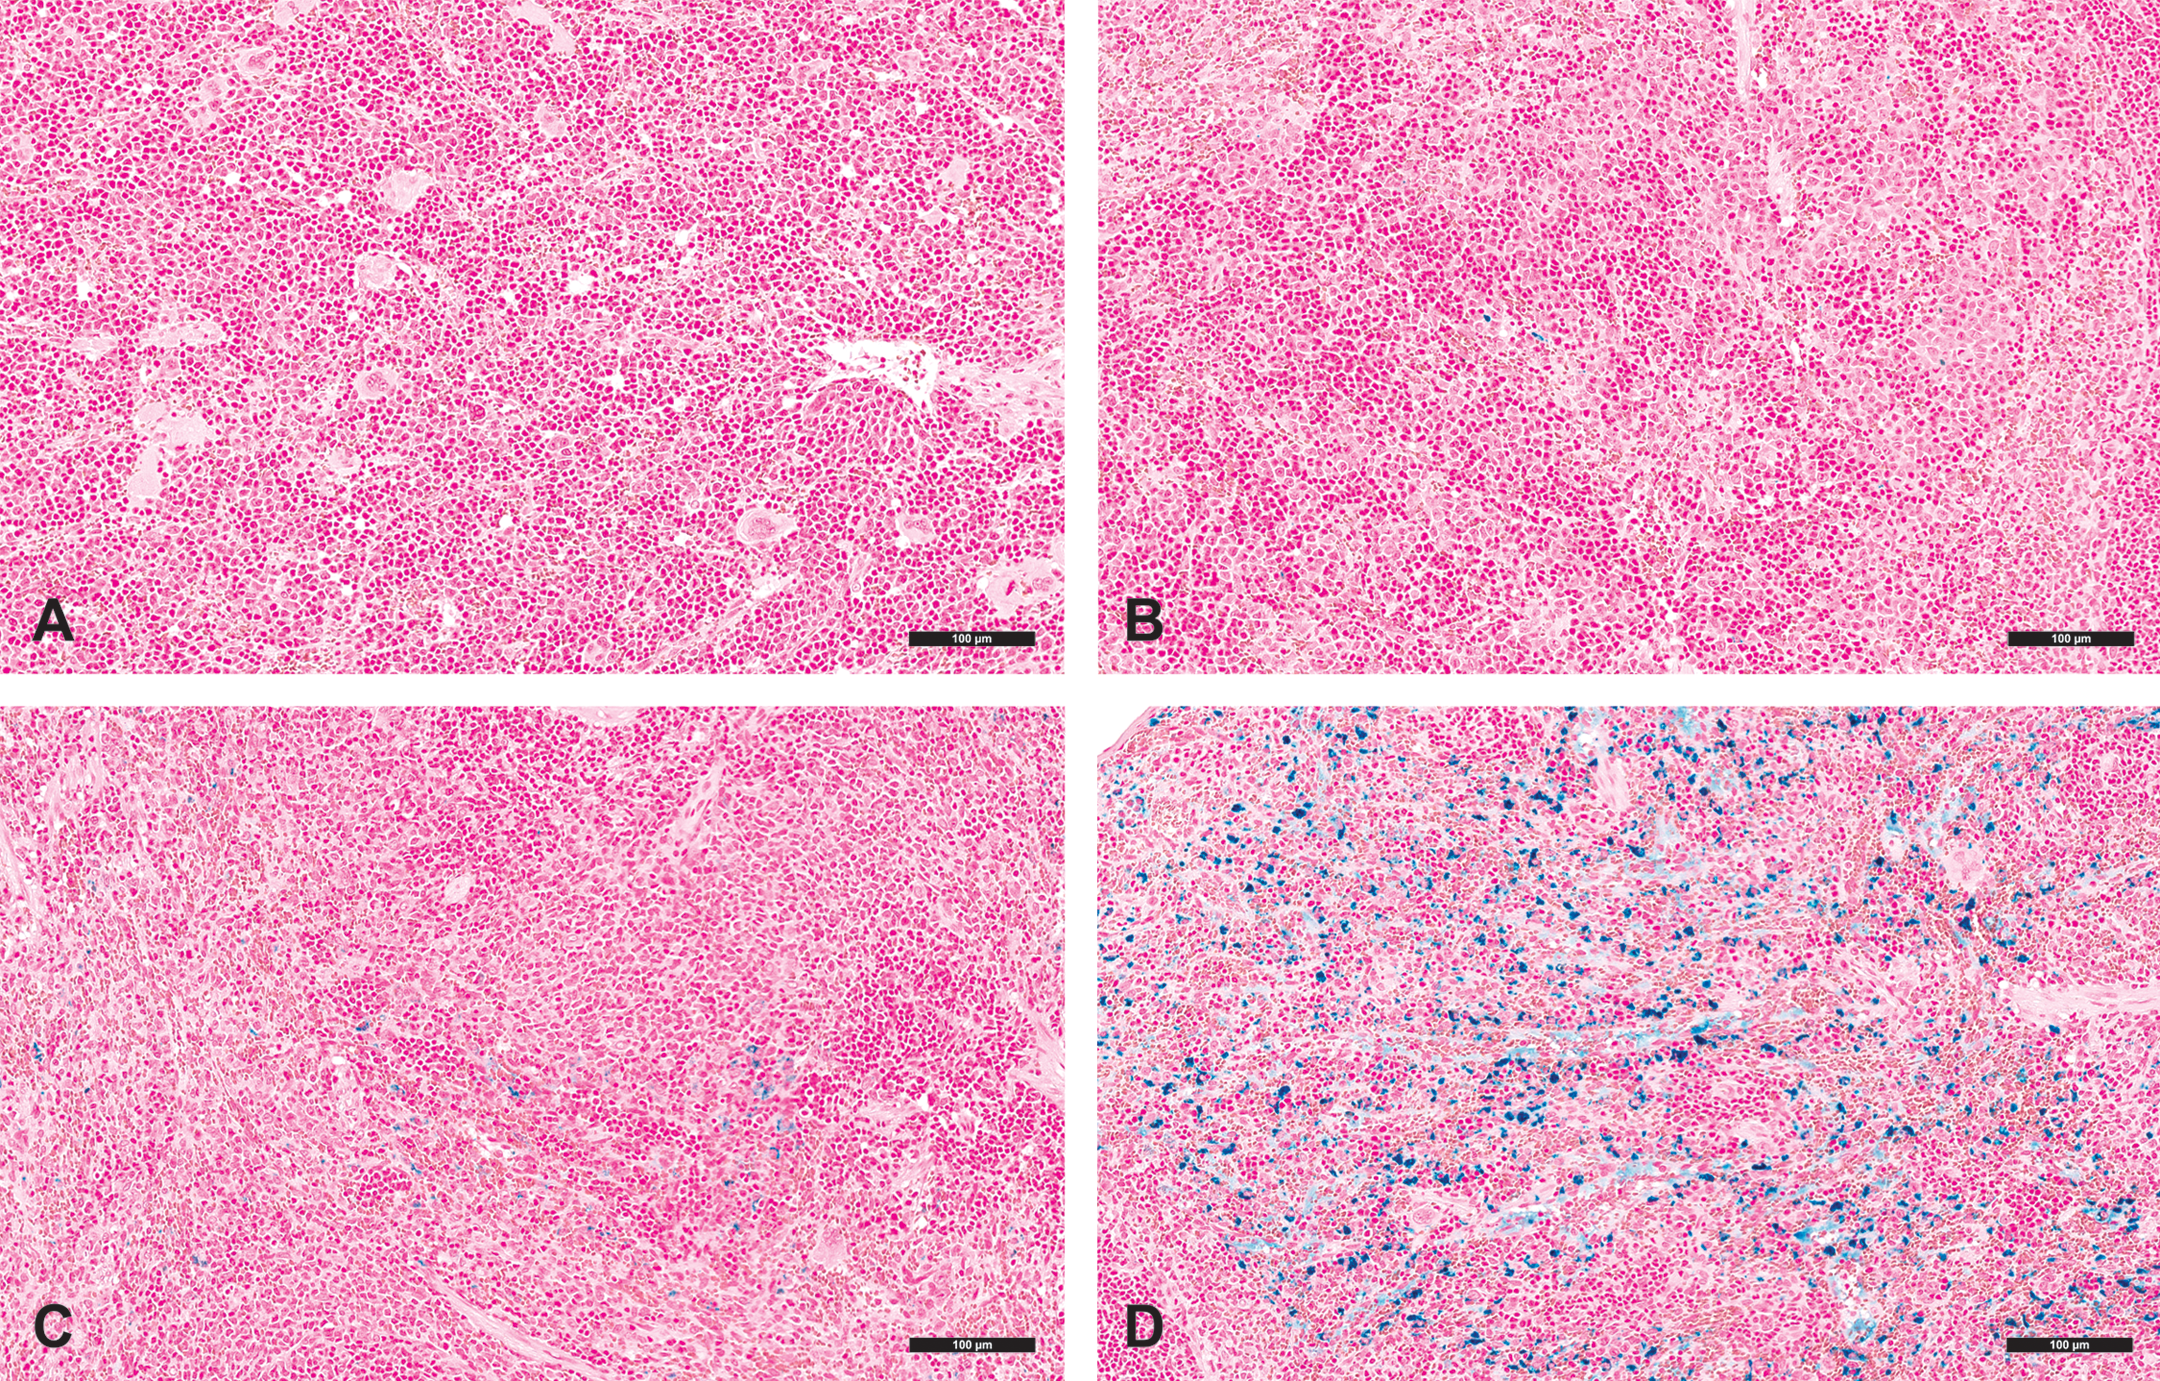
Representative photomicrographs of spleens from Sprague-Dawley rats containing variable amounts of Perls stained (positive) iron corresponding to severity grades of (A) grade 0, absent; (B) grade 1, scant; (C) grade 2, normal; and (D) grade 3, increased.
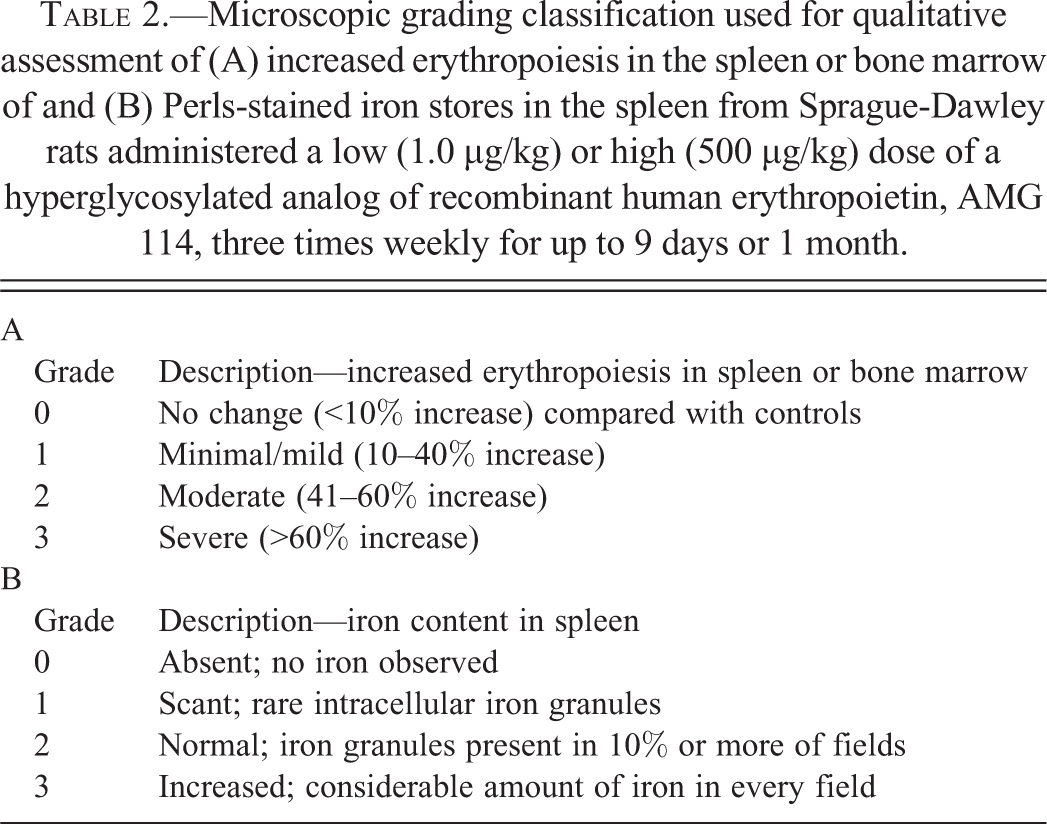
Microscopic grading classification used for qualitative assessment of (A) increased erythropoiesis in the spleen or bone marrow of and (B) Perls-stained iron stores in the spleen from Sprague-Dawley rats administered a low (1.0 µg/kg) or high (500 µg/kg) dose of a hyperglycosylated analog of recombinant human erythropoietin, AMG 114, three times weekly for up to 9 days or 1 month.
Statistical Analysis
A one-way (dose or time) or two-way (dose as a function of time) analysis of variance was used to identify statistically significant study-related differences in response variables obtained from animals in the 9-day or 1-month study. Pairwise t-tests were performed to compare the two dosed groups to the vehicle control, and to each other, at each time point. Log or square root transformation was applied to the some data points to satisfy assumptions of homogenous variance and normality. Adjustments (Dunnet’s or Tukey’s) were applied for multiple comparisons. Spleen weight was expressed as ratio to brain weight when included for analysis. HCT was used as a surrogate for red cell mass for graphing purposes since substituting Hb or RBC for HCT in the graph yielded equivalent results due to similar kinetics exhibited by these components during accelerated erythropoiesis over time (data not shown).
Results
Difference in the Pharmacodynamic Response of AMG 114 Dosed at a Low (1.0 µg/kg) or High (500 µg/kg) Dose Level
Increased Erythropoiesis in Hematopoietic Organs
AMG 114 administration stimulated splenic erythropoiesis in all rats, but the incidence and magnitude of increase was higher and the onset more rapid in the high- compared to the low-dose group (Figure 3). At 48 hr after a single dose, spleens from all 10 rats in the high-dose group had increased extramedullary erythropoiesis graded histologically with a severity score of moderate or severe, compared to a severity score of minimal/mild assigned to only 5 of the 10 rats in the low-dose group. Animals in the high-dose group maintained a similarly high severity grade of splenic erythropoiesis throughout the study. The severity grade of splenic erythropoiesis in the low-dose group increased more gradually over time, peaked at day 9, declined at day 30, and did not exceed a severity score above moderate in any individual animal.
Increased erythropoiesis in the spleen and bone marrow of Sprague-Dawley rats dosed with a low (1.0 µg/kg) or high (500 µg/kg) dose level of a hyperglycosylated analog of recombinant human erythropoietin, AMG 114, three times weekly for up to 1 month. Increased erythropoiesis is graphed over time and expressed by the mean histologic severity score (left y-axis, bar graph) calculated for n = 10 animals/group. The lines denote concurrently increased spleen weight expressed as the spleen-to-brain weight ratio (right y-axis). (Inset) Increased mean histologic bone marrow erythropoiesis severity score. Mean histologic severity scores were determined by calculating the group mean individual animal severity scores converted to a numerical value.
Spleen to brain weight ratios served as a further biomarker for the amount of expanded mass of erythropoietic tissue stimulated by AMG 114 (Figure 3). In the high-dose group, splenic weight was first increased at 48 hr and continued to increase throughout the 30-day dosing period. In contrast, splenic weights in the low-dose group were only increased slightly above control animal values at day 9, reflecting a lower stimulation of erythropoietic tissue compared to the high-dose group.
Increased bone marrow erythropoiesis above basal levels were observed in both dose groups of animals at day 5 and increased incidence and severity in the high- compared to the low-dose group of animals at this time point (Figure 3, inset). At day 9, the severity of increased bone marrow erythropoiesis was similar between dose groups indicating that the maximum capacity for expanded erythropoiesis by the bone marrow had been reached in both dose groups of animals. At day 30, the severity scores decreased at both dose levels but remained increased in the high- compared to the low-dose group.
Response in Peripheral Blood
nRBCs
Unique to the high-dose group were low numbers of nRBCs morphologically consistent with rubricytes and metarubricytes identified in the peripheral blood smears prepared on days 9, 16, and 30.
Reticulocytes
The kinetic response of reticulocytes to AMG 114 administration was similar at both dose levels and occurred in two phases; increased at 24 hr through day 9, followed by a gradual decline at later time points at day 15 and day 30 (Figure 4). The magnitude of the reticulocyte response was greater in the high- versus the low-dose group from 48 hr through day 9. Peak reticulocytes (day 9) were nearly 2-fold higher in the high- versus the low-dose group and remained increased to a greater degree at days 16 and 30 when reticulocytes decreased in both dose groups. Increased reticulocytes generally correlated with increased spleen weight in the high-dose group as a measure of increased erythropoietic activity (Figure 5). However, this relationship reached a plateau beyond which spleen weights increased with no correlative increase in reticulocytes. Reticulocytes in animals with the highest spleen weights were often slightly decreased compared to peak reticulocyte values achieved in animals with lower spleen weights. Increased reticulocytes in the low-dose group were generally unaccompanied by increased spleen weights except at day 9 when minimally increased spleen weights were recorded.
The pharmacodynamic response in rats administered a low (1.0 µg/kg) or high (500 µg/kg) dose level of a hyperglycosylated analog of recombinant human erythropoietin, AMG 114, three times weekly for up to 9 days and for 1 month. The hematocrit rate of rise was similar between the 2 dose groups despite a dose-dependent increase in reticulocytes that occurred 48 hr after a single dose of AMG 114 through day 9 and then decreased to day 30. *Difference from control animals, p < .05. ‡Difference between low (1.0 µg/kg) and high (500 µg/kg) dose group, p < .05.
Increased spleen weights generally correlated with higher reticulocytes as a measure of increased erythropoiesis n rats administered a low (1.0 µg/kg) or high (500 µg/kg) dose level of a hyperglycosylated analog of recombinant human erythropoietin, AMG 114. The increased reticulocytes reached a plateau phase where increased spleen weights did not correlate with any further increases in reticulocytes. Animals with the highest spleen weights often had submaximal reticulocyte values.
The kinetics of circulating reticulocyte subpopulations (defined by maturity) in response to AMG 114 administration were similar between dose groups characterized by an initial increase in the most immature reticulocyte fraction (HD) at 24 hr after a single dose, accompanied by increased proportions of more mature reticulocytes (MD and LD reticulocytes) as tissue erythropoiesis increased at day 5 onward (Figure 6). Dose-related differences were observed mainly in the HD reticulocyte subpopulations which were increased to a greater magnitude, and comprised the largest subpopulation of reticulocytes, in the high- versus the low-dose group at 24 hr through day 9. The minimally increased HD reticulocytes in the high-dose group at 6 hr after a single dose of AMG 114 was considered of uncertain relationship to treatment due to the minor magnitude of change (37% above vehicle control) but may represent a rapid, biologically relevant increase in this high-dose group. Increased HD reticulocytes appeared to reach maximum at day 5 in the high-dose group, but continued to increase between day 5 and day 9 in the low-dose group. Increases in the more mature reticulocyte subpopulations (MD and LD reticulocytes) were generally equivalent between the high- and low-dose groups at day 5 and only minimally greater in the high- compared to the low-dose group at day 9, despite the large difference in spleen weight at the same time point.
Reticulocyte subpopulations in rats dosed with a low (1.0 µg/kg) or high (500 µg/kg) dose level of a hyperglycosylated analog of recombinant human erythropoietin, AMG 114, three times weekly for 9 days. Higher reticulocyte density is correlated with increased immaturity of the reticulocyte population. *Denotes p value <.001 increase (*) or decrease (**) in corresponding reticulocyte subpopulation between the AMG 114 low- and high-dose groups.
Reticulocyte size (reticulocyte mean cell volume [MCVr]) and Hb content (reticulocyte cellular hemoglobin content [CHr]) increased during the early reticulocyte response (24 and 48 hr) and then decreased at subsequent time points (day 5 and day 9) in both dose groups (Figure 7). Reticulocytes were larger and contained more Hb in the high- versus the low-dose group at their peak size, 48 hr after a single dose of AMG 114. At subsequent time points, MCVr and CHr decreased in both dose groups, but with a much greater magnitude of change in the high- versus low-dose groups. The reticulocyte parameters in the high-dose group were indicative of smaller (MCVr) and less hemoglobinized (CHr) cells compared to reticulocytes in the low-dose group at day 9. The mean reticulocyte population Hb concentration (reticulocyte mean cell hemoglobin concentration [CHCMr]) decreased similarly in both dosed groups at 24 hr, but was decreased in the high- versus the low-dose group at subsequent time points.
Alterations in reticulocyte (A) and red blood cell (B) size, hemoglobin content, and hemoglobin concentration that occurred over time in rats dosed with a low (1.0 µg/kg) or high (500 µg/kg) dose level of a hyperglycosylated analog of recombinant human erythropoietin, AMG 114 three time weekly for 9 days (reticulocytes) or 1 month (red blood cells). For reticulocytes (A): MCVr = reticulocyte mean cell volume, CHr = reticulocyte cellular hemoglobin concentration, CHCMr = reticulocyte mean cell hemoglobin concentration. For red blood cell population (B): MCV = mean cell volume, MCHC = mean cell hemoglobin concentration, MCH = mean cell hemoglobin
Red Cell Mass
HCT was minimally increased in the high-dose group only, 24 and 48 hr after a single dose of AMG 114 and increased in both dose groups at all subsequent time points (Figure 4). The increased HCT at 24 and 48 hr in the high-dose group could not be fully accounted for by increased reticulocytes that were not commensurately increased between these 2 time points. At later time points, HCT achieved was slightly higher in the high- (range 0.7–3.6%) versus the low-dose group, but the differences were minor and not considered sufficient alone to explain differences in thrombotic toxicities. There was overlap in HCT achieved by individual animals between the low- and high-dose groups at the same time points.
Both AMG 114–dosed groups of animals had larger (increased mean cell volume [MCV]) and less hemoglobinized (decreased mean cell hemoglobin [MCH]) RBCs in response to increased erythropoiesis (Figure 7). RBCs were larger at 48 hr through day 30 in the high- versus the low-dose group, but only became less hemoglobinized at days 16 and 30. RBC size (MCV) and MCH decreased in both groups at day 15 reflecting the maturation of smaller and less hemoglobinized reticulocytes. The magnitude of decrease was similar between dose groups and RBCs remained larger but only slightly less hemoglobinized in the high- versus the low-dose group at the end of the study. The mean Hb content of the RBC population (mean cell hemoglobin concentration [MCHC]) was decreased in the high- compared to the low-dose group at 48 hr through day 30 reflecting the overall increased RBC size and decreased Hb content between the two different populations of RBCs.
AMG 114–related Pathobiology and Toxicities
Ferrokinetics/Functional Iron Deficiency
The kinetics of total body iron depletion differed between dose groups. Splenic iron content decreased in the high-dose group as early as 24 hr on an individual animal basis (data not shown) and 48 hr on a group mean basis after a single dose of AMG 114 and then depleted progressively at all later time points (Figure 8). Serum biomarkers of iron status reflected a gradual depletion of available iron stores (decreased serum iron) and inability to meet demands for increased iron transport (increased UIBC) similarly at 48 hr and also progressed with increased severity through day 9 (Figure 8). A functional manifestation of total body iron depletion was the progressive and severe decreased reticulocyte size and Hb content measured at day 5 and day 9. In contrast, splenic iron content and serum biomarkers of iron status in the low-dose group remained generally comparable to vehicle controls through day 5, despite increased and effective erythropoiesis measured in the spleen and by increased circulating reticulocytes. However, decreased reticulocyte size and Hb concentration at day 5 suggested total body iron stores were depleted to an extent that erythropoiesis was iron restricted following a similar kinetics displayed by the high-dose group. At day 9, serum biomarkers of iron status in the low-dose group abruptly changed to mirror the level of depletion achieved more rapidly and gradually in the high-dose group. At the same time point, the magnitude of splenic iron depletion and decreased reticulocyte size and Hb content was much less severe in the low- compared to the high-dose group over the 9-day study duration (Figure 8). Hypochromic and microcytic RBCs that matured from iron-deficient reticulocytes were identified in the peripheral blood smears at day 9 in the high-dose group and with increasing severity at day 15 and day 30. These changes were identified in peripheral blood smears from animals in the low-dose group, but detected initially later (day 15) and with less severity compared to the high-dose group at day 15 and day 30.
Ferrokinetics of rats administered a low (1.0 µg/kg) or high (500 µg/kg) dose of a hyperglycosylated analog of recombinant human erythropoietin, AMG 114, three times weekly for up to 9 days or 1 month. (A) Histologic assessment of splenic iron depletion in AMG 114–dosed rats. Group mean splenic iron content decreased at 48 hr (24 hr on an individual animal basis) in the high-dose group and day 9 in the low-dose group. By day 30, splenic iron was near undetectable in both dose groups. Individual animal iron content was graded by estimating the percentage of Perls-stained positive iron granules in splenic tissue at 4× magnification as described in Table 2 (panel B). If negative at 4× magnification, spleens were further assessed at 20–40× magnification for animals assigned a grade 1 (scant) or grade 0 (absent) severity score. Group mean severity score was determined by converting severity grade to a numerical value and calculating the group mean. Serum biomarkers of iron status in control and AMG 114–dosed animals up to day 9 are depicted as box and whisker plots for (B) serum iron and (C) UIBC. Whiskers represent minimum and maximum values. Serum biomarkers of iron depletion (decreased serum iron, increased UIBC) supported a gradual depletion over time in the high-dose group compared to an abrupt decrease at day 9 in the low-dose group. Insufficient serum volume was available to evaluate iron parameters at day 30. UIBC = unbound iron-binding capacity.
Increased RBC Turnover
The magnitude of increased reticulocytes did not translate into a proportionally increased HCT in the high-dose group at day 5 and all remaining time points consistent with decreased reticulocyte/RBC life span from intravascular and extravascular hemolysis secondary to functional iron deficiency (Figure 4). Additionally, the larger size (MCV) and similar Hb content (MCH, MCHC) of the surviving RBC population in the high- compared to the low-dose group at day 30, indicate that the majority of the smaller, less hemoglobinized iron-deficient reticulocytes/RBCs made at time points after 48 hr did not survive in sufficient numbers to alter the RBC population parameters. Evidence for intravascular hemolysis as a mechanism of reticulocyte/RBC removal was detected in the high, but not in the low-dose group initially at day 9 and with increasing severity at day 30, when fragments of RBCs were observed in peripheral blood smears and serum haptoglobin concurrently decreased (Figure 9). Extravascular hemolysis was also likely contributing to reticulocyte/RBC destruction although there was no consistently identified microscopic evidence for enhanced phagocytic activity by macrophages in the spleen or liver of animals in the high-dose group.
Representative photomicrographs of the monolayer (A) or body (B) portions of a peripheral blood smear from a Sprague-Dawley rat dosed at 500 µg/kg, 3 times weekly for 1 month with a hyperglycosylated analog of recombinant human erythropoietin, AMG 114. Sustained and accelerated erythropoiesis resulted in functional iron deficiency. Characteristic microcytic, hypochromic red blood cells (RBCs) were present at day 9. RBC morphologic abnormalities including RBC fragments (schistocytes, spherocytes) and oxidative membrane injury (blister cells) are also present. (C) Serum haptoglobin decreased in high-dose animals at day 9 and day 30 due to intravascular hemolysis. Data were log transformed due to variance. Whiskers represent minimum and maximum values.
Platelets
Mildly increased PLTs and MPV were identified in the high-dose group only, at day 5 and day 9 (20% and 30% above control), which correlated with the onset and progression of increased iron deficiency in this dose group (Figure 10). Automated counts of PLTs and PLT parameters at day 16 and day 30 were not reliable due to an analytical discrepancy made by the Advia Hematology analyzer that counted microcytic, hypochromic reticulocytes/RBCs as PLTs. Minor alterations in PLT parameters indicative of PLT activation (mean platelet component [MPC], mean platelet mass [MPM], and platelet component distribution width [PCDW]) were inconsistently identified in both dose groups when measured up to day 9 (data not shown).
Increased platelets and mean platelet volume correlated with decreased total iron body stores in rats dosed with a high (500 µg/kg) dose level of a hyperglycosylated analog of recombinant human erythropoietin, AMG 114, three times weekly.
ESA-related Toxicities
There was no mortality and no evidence of thrombotic toxicities in target tissues of any animals in the 9-day investigative study. Microscopic thrombotic toxicities including a valvulopathy, thrombotic event, and/or erosion in the glandular region of the stomach occurred in animals in the high-dose group on day 30. Of the 10 high-dose animals, 3 had a valvulopathy ± thrombus involving the left atrioventricular valve. One animal had a thrombotic event associated with osteolysis/necrosis of the femur and 1 animal had an erosion in the glandular region of the stomach suggestive of an infarct based on prior experience. In a correlative analysis, individual animals in the high-dose group with ESA-related thrombotic toxicities were not found to have any outlier end point values associated with increased erythropoiesis, associated pathology, or comorbidity such as infection to distinguish them from the remaining animals in their respective dose group with no thrombosis.
Discussion
We recently reported results from a retrospective analysis showing that sporadic mortality or thrombotic events reported in a subset of preclinical toxicology studies with structurally different ESAs were not solely related to the accompanying high HCT. Increased ESA dose level, dose frequency, and dosing duration along with high HCT was associated with an increased incidence of thrombotic toxicities. The mechanisms that contributed to thrombosis in animals administered repeated suprapharmacologic doses of an ESA were pursued using data obtained from a 9-day (6 hr through day 9) and a 1-month study (day 16 and day 30) in Sprague-Dawley rats administered a hyperglycosylated analog of rHu-EPO, AMG 114, 3 times weekly at a low, maximum pharmacologic (1.0 µg/kg) or high, suprapharmacologic (500 µg/kg) dose level. Similarly high HCTs were achieved in both dosed groups, but thrombotic toxicities occurred only in animals belonging to the high-dose group.
In the 1-month study, dose-related factors with prothrombotic potential identified more predominantly in the high- compared to the low-dose group were sequelae associated with a higher magnitude of accelerated erythropoiesis including the severe state of functional iron deficiency. However, the relative contributions of these processes to thrombosis were confounded by the concurrently high HCT present in both dose groups after repeated dosing for 1 month. Several rodent models of polycythemia or anemia utilized to investigate AMG 114-mediated biologic effects dissociated from high HCT failed due to multiple confounding factors that impacted data interpretation and/or for technical reasons. Therefore, these relationships were evaluated prior to an established high HCT (>20% above controls) in the 9-day study where we found the same prothrombotic factors present either unique to, or with increased severity, in the high- compared to the low-dose group, as early as after a single dose of AMG 114.
The results from our prior retrospective analysis suggested a high HCT was a predisposing factor, but not the sole causality, for ESA-related thrombotic toxicities in preclinical toxicology studies at least 1 month in duration (Andrews et al. 2013). The role of high HCT as a predisposing factor was inferred since thrombotic toxicities were only identified in animals with a high HCT. The presence of thrombotic toxicities in animals from the AMG 114 high-dose group at day 30, but not at day 9 or any prior time point when co-contributing prothrombotic risk factors were present in the absence of a high HCT, would support this conclusion. However, AMG 114 administration could not be dissociated from erythropoiesis in our investigative studies. The contribution conferred by increased HCT in the AMG 114-dosed rats was likely to overlap between dose groups since HCT was similar at all time points measured. Any minimally increased HCT values in the high- compared to the low-dose group in both studies were minor (range 0.7–3.6%) and considered of insufficient magnitude to influence thrombosis preferentially in the high-dose group alone. Thrombosis associated with HCT level (normal, increased, or decreased) is a clinically inconsistent association in preclinical models and patient populations suggesting a variety of host factors are more influential in establishing a prothrombotic microenvironment that HCT level (Fullmer and Miller 2009; Bogdanova et al. 2007). Polycythemia is a well-recognized contributing risk factor for thrombosis (Tefferi 2012) but does not consistently translate into a thrombotic event in preclinical species dosed with structurally different ESAs (Andrews et al. 2013) or in a variety of polycythemic animal models created by different techniques (Simonson et al. 2012; Shibata et al. 2003; Barbui and Finazzi 1997). Mechanisms such as increased RBC deformability and increased nitric oxide production have been demonstrated to naturally compensate for the increased blood viscosity conferred by the high HCT (Ruschitzka et al. 2000; Vogel et al. 2003). The relative contributions to thrombosis imparted by the sustained high HCT in ESA-dosed animals may be related to the altered physical properties of polycythemic blood (Allen and Patterson 1995; Fedde et al. 1996). Elements circulating within blood interact with the endothelial cell surface via a gel-like layer (glycocalyx or endothelial surface layer [ESL]) that serves to minimize unnecessary cell-to-cell communication with the vasculature during homeostasis. In EPO-overexpressing mice (tg6) with HCTs of ∼85%, the glycocalyx/ESL was found to be nearly abolished due to compression caused by the increased HCT (Ruschitzka et al. 2000). It is possible that in ESA-dosed animals with a chronically high HCT, thinning of the ESL permits prothrombotic factors present in higher concentrations in the high- compared to the low-dose groups, to come in closer proximity to the vessel wall, activating endothelial cells, and converting the vascular interface to a more thrombogenic state (Kwaan and Bongu 1999). It does not explain the sporadic nature of the thrombotic events in the small fraction of affected individual animals within the highest ESA dose groups but does provide a common predisposing mechanism for dose-related prothrombotic factors to gain greater access to vascular endothelial cells.
Increased erythropoiesis that translates into an increased circulating red cell mass is the biologic effect of ESA administration. However, in preclinical species administered supra-pharmacologic doses of ESAs in the context of a toxicology study, increased red cell mass is the result of effective stress erythropoiesis; a process that differs from basal erythropoiesis on a molecular and tissue level (Socolovsky M, 2007; Paulson RF et al. 2011). Stress erythropoiesis is carried out in multiple hematopoietic organs and proceeds at a rate and degree associated with the concentration of EPO increased over basal levels that are required for homeostatic erythropoiesis. Endogenously produced EPO at levels sufficiently increased to trigger stress erythropoiesis are directly transcribed following activation of the transcription factor, hypoxia-inducible factor-1 in response to decreased tissue oxygen tension from hypoxia, blood loss, or anemia (Bozzini et al. 2005; Jelkmann 2011; Semenza 2009). Administration of rHu-EPO to normal animals increases EPO levels above basal levels activating stress erythropoietic pathways as well (Bozzini et al. 1994; Elliott, Pham, and Macdougall 2008). In rats, the spleen is more important than bone marrow in effective EPO-mediated stress erythropoiesis (Peschle C et al. 1977; Ou LC et al. 1980). The increased spleen weights and higher severity score of increased splenic erythropoiesis in the high- compared to the low-dose group was therefore an expected dose–response relationship. On a cellular level, splenic stress erythropoiesis has been studied in a variety of mouse models and found associated with increased mobilization and migration of hematopoietic precursors from bone marrow to the spleen (Broudy et al. 1996; Hara and Ogawa 1976). In the spleen, immature progenitor cells and a wider range of erythroid precursors differentiated into EPO-responsive stress erythroid progenitors through rapidly increased levels of bone morphometric protein-4 produced by splenic macrophages (Lenox, Perry, and Paulson 2005; Millot et al. 2010). These activities were shown to preferentially expand the splenic erythroid precursor population and suppress the apoptotic rate of the developing erythroid series through increased signaling from increased numbers of EPO receptors (EPO-R) engaged and activated by higher EPO concentrations (De Maria et al. 1999; Koulnis et al. 2011). While not demonstrated directly to occur in rats, a similar mechanism is likely present. Therefore, on a molecular, cellular, and tissue level, animals in the AMG 114 high- compared to the low-dose group had a higher burden for cell trafficking, increased protein synthesis, and erythroid cell expansion associated with the dose-related increased magnitude of stress erythropoiesis. However, it is unclear whether these processes surrounding increased splenic erythropoiesis directly influenced thrombosis in the high-dose group.
During stress erythropoiesis, increased numbers of reticulocytes as well as subpopulations of increasingly immature stress reticulocytes within are released proportional to the increased concentration of EPO (Al-Huniti et al. 2005; Bugelski et al. 2008; Major et al. 1994; Wiczling and Krzyzanski 2008; Wiczling, Ait-Oudhia, and Krzyzanski 2009). Overall, newly released “stress” reticulocytes are more prothrombotic than reticulocytes produced during basal erythropoiesis. They are generally larger, less deformable, and more adhesive in circulation (Chasis et al. 1989; Waugh et al. 1997; Patel et al. 1985). Increasingly immature subpopulations of stress reticulocytes display a more severe phenotype associated with these same attributes and are also more fragile in circulation (Wiczling and Krzyzanski 2008; Wiczling, Ait-Oudhia, and Krzyzanski 2009). Due to prolonged maturation times in circulation (2–3 days) associated with their immaturity (Frei et al. 2008; Papayannopoulou and Finch 1975; Al-Huniti et al. 2005), there is increased potential for endothelial cell interaction. Animals in the AMG 114 high-dose group had consistently increased numbers and a greater proportion of the most immature reticulocyte fraction (HD) in circulation when maturity was determined by RNA density (Buttarello et al. 2002). At later time points in the study, higher numbers of HD reticulocyte alone accounted for differences in total reticulocyte numbers between dose groups. The iron-deficient stress reticulocytes produced at later time points in the study impart an additional prothrombotic burden being less deformable and more rigid than iron-replete stress reticulocytes (Yip et al. 1983). In general, stress reticulocytes have been associated with an increased risk of thrombosis when numbers are increased relative to a decreased red cell mass during severe anemia (Baskurt, Levi, and Andac 1991) and in disease states such as sickle cell anemia and Chuvash polycythemia (Brittain et al. 2008; Gee and Platt 1995; Kato et al. 2005; Thachil 2008; Gordeuk et al. 2004). Consistently higher numbers of increasingly immature and iron-deficient stress reticulocytes in the AMG 114 high-dose group would similarly present higher numbers of more prothrombotic reticulocytes to the vasculature while in circulation. This prothrombotic influence would be greatly decreased in the AMG 114 low-dose group with lower numbers of less immature reticulocytes in circulation.
Increased concentrations of blood microparticles have been associated with increased thrombotic events by providing additional surface area for thrombus generation (Owens and Mackman 2011). During maturation to an erythrocyte, significant reticulocyte membrane remodeling and loss of cellular components occurs in the bone marrow, spleen, and in circulation (Chasis et al. 1989; Liu et al., 2010). Stress reticulocytes require more extensive surface remodeling for maturation into erythrocytes, which is carried out preferentially in the spleen and also in circulation (Ganzoni 1969; Come, Shohet, and Robinson 1972; Shattil and Cooper 1972). Increased circulating lipid fragments, exosomes, and cytoplasmic multivesicular bodies were demonstrated in humans and animals stimulated with rHu-EPO that originated from remodeling of a stress reticulocyte population (Brugnara et al. 1993; Pan et al. 1985; Come, Shohet, and Robinson 1972). In addition to increased concentrations of small blood microparticles in circulation, membrane fragments large enough to be identified by the light microscope were present in peripheral blood smears from animals in the AMG 114 high-dose group (Figure 9). These larger fragments are presumed to originate from increasing numbers of fragile iron-deficient reticulocytes/RBCs in circulation and can additionally serve to directly activate endothelial cells. The higher circulating burden of microparticles and membrane fragments in the high- compared to the low-dose group is likely to be an important risk factor for thrombosis in AMG 114 high-dosed animals especially during sustained polycythemia.
The greater magnitude of erythropoiesis in the AMG 114 high-dose group did not translate into a comparatively higher increased red cell mass when compared to the low-dose group (Figure 3). This suggests decreased reticulocyte and RBC life span are associated with higher ESA dose levels. Several studies in humans and animals have demonstrated a markedly shortened life span of “stress” reticulocytes induced by a variety of hypoxic states (i.e., high altitude, chemically induced hemolytic anemia, phlebotomy) or rHu-EPO administration compared to the life span of a normal reticulocyte produced during basal erythropoiesis (Card and Valberg 1967; Wiczling and Krzyzanski 2008; Robinson and Koeppel 1971). Additionally, increasing immaturity of stress reticulocyte populations associated with increasing EPO levels correlates directly with increasingly shortened reticulocyte life spans (Stryckmans et al. 1968). In rats stimulated with rHu-EPO, this loss was determined to be as much as 80% of the most immature reticulocyte fraction (Wiczling, Ait-Oudhia, and Krzyzanski 2009). Reticulocytes produced during iron-restricted erythropoiesis have an even shorter half-life in circulation than iron-replete stress reticulocytes (Choi and Pai 2001; Come, Shohet, and Robinson 1974). When iron restricted reticulocytes were transfused into normal rats, the conversion to bilirubin averaged 47.3% compared to 1.7% with normal reticulocytes (Robinson and Koeppel 1971). Erythrocytes that matured from reticulocytes produced during conditions of severe erythropoietic stress also had decreased half-lives compared to erythrocytes derived from reticulocytes produced under basal erythropoiesis or a milder erythropoietic stress (Stryckmans et al. 1968). Similar to reticulocytes, iron-deficient mature RBCs had the shortest life span of all and demonstrated increased susceptibility to intravascular and extravascular hemolysis (Signorini et al. 1995) resulting in a 15-fold decreased life span in circulation compared to RBCs maturing from iron-replete stress reticulocytes (Robinson and Koeppel 1971; Wiczling, Ait-Oudhia, and Krzyzanski 2009). The prothrombotic consequence of turning over significant numbers of reticulocyte/RBCs can be related to the mechanism of their removal. Intravascular hemolysis appeared to be the predominant mechanism for shortened reticulocyte/RBC life span in the AMG 114 high-dose group likely due to the predominance of iron-depleted reticulocytes produced during sustained iron-deficient erythropoiesis. Intracellular depletion of iron-dependent free radical enzyme scavenging systems permits lipid peroxidation and protein oxidation of the iron-deficient cell (Nagababu et al. 2008) increasing the risk of shearing from hemodynamic forces in circulation (Ferrali et al. 1990, 1992; Keene and Jandl 1965). The ensuing intravascular hemolysis of increasingly iron-deficient reticulocytes/RBCs would result in the release of redox-active iron and heme into the bloodstream from hemolyzed erythrocytes; both factors which increased the extent of vascular injury in a mouse model (Woollard et al. 2009). Free heme was also associated with increased levels of extracellular arginase that decreased nitric oxide–mediated regulation of the vasculature and inappropriately activated hemostatic pathways (Kato and Taylor 2010). At day 9, intravascular hemolysis had increased to a level in the AMG 114 high-dose group that innate scavenging systems for heme and iron were overwhelmed (Figure 9). Extravascular hemolysis was also likely to be involved in removal as membrane damage from the unmanaged intracellular oxidative stress in iron-deficient reticulocytes/RBCs is an attractive marker for removal by resident macrophages (Ferrali et al. 1990, 1992; Keene and Jandl 1965). However, microscopic evidence of enhanced extravascular erythrophagocytosis by macrophages in the spleen, liver, or bone marrow was not consistently identified in animals of either AMG 114 dose group. While likely to be involved, activity may actually be lower than anticipated as a pathway of reticulocyte/RBC removal in the spleen of the AMG 114 rats with shortened RBC life spans (Millot et al. 2010). Splenectomy did not alter the marked turnover of stress (Robinson and Tsong 1970) or iron-deficient RBCs in EPO-dosed rats (Robinson and Koeppel 1971). And in EPO-overexpressing mice, increased splenic size was determined to result from increased erythropoiesis and not enhanced erythrophagocytosis which had shifted to macrophages in the liver (Bogdanova et al. 2007). While some degree of increased reticulocyte/RBC turnover was likely present in the AMG 114 low-dose group resulting from iron-restricted erythropoiesis, intravascular and extravascular routes of eliminations remained at a level undetected by serum or microscopic biomarkers indicative of hemolysis. In contrast, intravascular hemolysis was a prominent mechanism for removal of large numbers of reticulocyte/RBCs produced in the AMG 114 high-dose group and imparted an additional prothrombotic risk either below the limit of detection or not present in animals belonging to the AMG 114 low-dose group.
Increased PLTs, MPV, and enhanced PLT activation have been suggested as contributing factors associated with ESA-related thrombosis (Franchini et al. 2008; Dahl, Henry, and Coyne 2008; Nagai et al. 2005; Greisenegger et al. 2004; Braekkan et al. 2010; Chu et al. 2010), despite the lack of a clear clinical correlation (Buss et al. 1994; Bleeker and Hogan 2011) or consistency as a finding in rodents (Grossi et al. 1989; Yonemura et al. 1992; McDonald, Clift, and Cottrell 1992; Suzuki et al. 2002; Lindenblatt et al. 2007) or humans administered rHu-EPO (Zirkman et al. 1993; Stohlawetz et al. 2000; Malyszko et al. 1996). Internal Amgen data and other published literature dispute direct EPO binding to megakaryocytes (Fraser, Lin, and Berridge 1988; Fraser et al. 1989), but it is generally acknowledged there is no functional consequence. Iron deficiency (reactive thrombocytosis) secondary to effective erythropoiesis (Dan 2005; Streja et al. 2008) has been put forth as potential mechanisms for ESA-related thrombocytosis. Increased MPV alone has been considered a biomarker for thrombosis since in vivo and in vitro experiments suggest that large PLTs are more likely to aggregate and are hyperresponsive and activated in circulation (Endler et al. 2002; Huczek et al. 2005). Animals in the AMG 114 high-dose group only had increased PLTs and MPV at day 5 through day 9. Prior to the correction introduced into the raw hematology data, PLT counts generated by the Advia Hematology Analyzer were >2,000,000 µl in most high-dose group animals. Failure to correct for the high numbers of microcytic/hypochromic reticulocytes/RBCs in circulation counted as PLTs has potential impact on misinterpretation of treatment-related findings reported in the literature and in ESA preclinical toxicology studies. Increased PLTs and MPV secondary to increasing functional iron deficiency is a plausible mechanism in the AMG 114 high-dose group and demonstrated in rHu-EPO dosed rats (Loo and Beguin 1999). Like thrombocytosis, increased MPV and PLT activation are established risk factors for thrombosis. The combination of increased PLTs and PLT size in the high-dose group may represent an additional prothrombotic risk factor for AMG 114 high-dosed rats although most animals on an individual basis had values that were within normal variability.
Prothrombotic factors discussed thus far in AMG 114–dosed animals have originated from ESA’s direct effect on erythroid cells. Minor alterations in the AMG 114 high-dose group consisting of minimally increased HD (most immature) reticulocytes at 6 hr and minimally increased HCT at 24/48 hr could not be attributed to increased erythropoiesis in our Sprague-Dawley rats. These minor increases in HCT have also been reported in normal healthy volunteers administered rHu-EPO unrelated to erythropoiesis (Lundby et al. 2007). Increasing HCT/Hb by non-erythroid mechanisms would logically impart a distinct survival advantage since effective erythropoiesis requires time and even small increases in HCT have been shown to increase oxygenation to the tissues (Sarelius and Sinclair 1981). The physiologic consequences of rHu-EPO outside erythropoiesis remains speculative as the published literature around the presence and functionality of EPO-R on non-erythroid cells remains contradictory (Arcasoy 2008; Sinclair et al. 2010; Swift et al. 2010; Beleslin-Cokic et al. 2004; Ogunshola et al. 2006; Lindenblatt et al. 2007; Borawski and Mysiwiec 2002; Pawlak, Pawlak, and Mysliwiec 2007).
In conclusion, the results from these investigative studies in Sprague-Dawley rats demonstrate an increased magnitude of erythroid expansion and accelerated erythropoietic rate in the high- compared to the low-dose group of AMG 114–dosed Sprague-Dawley rats, despite similar HCTs achieved at all time points evaluated. Our data indicate that prothrombotic consequences originating from the sequelae of accelerated erythropoiesis were present earlier and with increased severity in the high-dose group of animals. The extremely high HCT achieved in animals in repeat dose ESA toxicology studies was a required cofactor in the development of AMG 114–thrombotic toxicities since no microscopic abnormalities were identified in target tissues of either dose group after 9 days of 3 times weekly dosing, before a high HCT had been established.
Footnotes
Acknowledgments
The authors offer special thanks to Amgen colleagues Diane Duryea, Gwenyth Van, Barbara Felder, Steve Kaufman, David Cordover, and Dave Hill (Pathology), Guang Chen (Biostatistics), and Graham Molineux (Oncology Research) for their generous technical support and invaluable scientific expertise involved in study design, as well as execution and interpretation of many results within this article. The authors also wish to acknowledge the contributions of consultant David Zelmanov for his knowledge and problem-solving skills regarding the Advia Hematology analyzer. We additionally thank the toxicologists, animal research scientists, and pathologists at Covance Laboratories involved in the investigative study for their collaboration and expertise.
The authors are all employees of Amgen, Inc.
Amgen, Inc. sponsored the retrospective analysis and preclinical investigative studies conducted with AMG 114 reported in this manuscript. Amgen, Inc. manufactures and markets epoetin alfa and darbepoietin alfa and manufactured AMG 114 for investigative purposes only.