
Abstract
Cardiovascular safety signals in nonclinical studies remain among the main reasons for drug attrition during pharmaceutical research and development. Drug-induced changes can be functional and/or associated with morphological alterations in the normal heart histology. It is therefore crucial to understand the normal variations in histology to discriminate test article–related changes from background lesions. Rodent progressive cardiomyopathy is probably the most commonly encountered change in control animals of nonclinical toxicity studies. A multisite study mimicking standard short-term toxicity studies using young male Sprague-Dawley rats was performed to better characterize this finding. Using an enhanced sectioning method for this research study, it was observed that the incidence of background cardiomyopathy was 100%. The vast majority of the microscopic findings were inflammatory in nature, with associated necrotic changes (defined as necrosis/inflammatory cell infiltrate) and these changes were mainly located in the myocardium of the mid region of the ventricles (the left side being predominantly affected). The monitored environmental factors in this study (multiple facilities, study duration, handling) did not have an effect on the incidence or severity of the spontaneous cardiomyopathy. In addition, cardiac-specific serum troponin levels were measured and were within the published control range.
Keywords
Introduction
Rodent progressive cardiomyopathy (PCM) is a commonly encountered background change in regulatory toxicity studies. It affects strains of rats and mice with varying incidence and severity, and the change tends to become more common with increasing age. Usually, males are more affected than females (Fairweather 1967; Burek 1978).
The early lesion in younger rats is usually composed of one or more scattered foci of mononuclear cells (mainly macrophages with some lymphocytes, rarely neutrophils), with occasional degenerated or necrotic cardiomyocytes (Jokinen et al. 2005, 2011). Published reports describe this predominantly in the papillary muscle and the subendocardial areas (Ruben et al. 2000; Greaves 2011), though it is also found in the left ventricle and septum (Jokinen et al. 2011). This supports the hypothesis that this change could be the consequence of local vascular dysfunction, as these areas have a higher blood flow or oxygen requirement, and thus are most at risk for ischemia. Studies in hypertensive rats support this hypothesis. It has been shown that hypertensive rats developed vascular diseases predominantly located in the cardiac microvasculature (Yamori and Okomoto 1976). Feeding regimen is also believed to have a role, as Sprague-Dawley (SD) and Wistar rats on a restricted diet have a lower incidence of PCM (Kemi et al. 2000). SD rats have been widely used for toxicology studies (Keenan et al. 2010), yet experience suggests that this strain has a higher background incidence of PCM in young animals compared to other strains. The incidence and characteristics of PCM in younger SD rats can be highly variable in controls from standard toxicology studies of short duration (7–28 days) used to support initial human clinical studies of drugs.
Multiple synonyms have been used to characterize this background change. The most frequently used include a single term such as cardiomyopathy, inflammatory cell infiltrates, or a combination of terms such as degeneration/necrosis or degeneration/inflammation. According to a recent industry survey by Keenan et al. (2010), most companies use a combination of terms to describe the finding. There is, however, no consistency in terminology between companies (or even within companies). Acute cardiac necrosis associated with drug-induced cardiac muscle injury may have overlapping morphology with features of PCM; therefore, incidence, spatial distribution, biomarkers, dose response, and toxicokinetics become important as weight of evidence to distinguish drug effects from spontaneous disease in these early studies. This issue has been responsible for some regulatory concerns and questions (Keenan et al. 2010). Resolution of regulatory concerns generally occurred by providing historical data or by providing further characterization of the finding.
Cardiac troponin (cTnI) has become a more commonly used serum biomarker to assess myocardial injury in nonclinical toxicology studies and is considered a translational biomarker (Berridge 2009; O’Brien et al. 2006; O’Brien 2008; Walker 2006). Troponin I is part of the troponin complex that regulates actin–myosin interactions. Briefly, troponins are globular proteins that are part of the striated muscle contractile filament system and play a role in the complex contraction–relaxation cycle of striated myofibrils. The actin–myosin interactions are blocked by the troponin complex in the absence of calcium. Troponin I has two isoforms, one specific for skeletal muscle and one for cardiac muscle. cTnI, present only in the cardiac muscle, is therefore specific for cellular damage in the heart (Wallace et al. 2004; O’Brien et al. 2006). This abundant cardiac protein is not detected in significant levels in plasma of healthy individuals and is released predominantly during ongoing cardiac damage (irrespective of whether the injury is acute [therefore timing critical] or progressive; Wallace et al. 2004). Increased cTnI concentrations in the serum or plasma are now accepted as the gold standard biochemical marker in man for the diagnosis of myocardial damage and is the preferred biomarker for myocardial infarction as declared by the American College of Cardiology and the European Society of Cardiology since 2000 (Braundwal et al. 2000). Investigative studies with isoproterenol-induced acute myocardial injury in the Hanover Wistar rat have demonstrated that elevations of cTnI (and cTnT) can correlate with the presence of morphological myocardial injury but not necessarily the severity of change, as maximal elevations in cTnI changes can precede maximal microscopic lesion scores (Clements et al. 2010; York et al. 2007). Observations made on internal GlaxoSmithKline (GSK) studies have shown that the biological variation of serum cTnI is greater in male control SD rats, suggesting a potential association with the greater background incidence of PCM in male rats (Fairweather 1967; Burek 1978).
The morphology, spatial distribution, and temporal development of cardiomyopathy need to be investigated further in the context of common toxicity study designs to better understand the disease and its potential correlation with cTnI.
To better characterize PCM in young SD rats and the biologic and environmental variability that impacts common pharmaceutical nonclinical toxicology practice, we developed a common study design conducted within the same time frame at multiple GSK safety assessment sites using standard methods and the same vendor-sourced genetically defined animals applied to regulatory studies. The study design incorporated features expected to answer six key hypotheses.
Hypothesis 1: Step sectioning of the majority of the heart in young rats will reveal a 100% incidence of PCM.
Hypothesis 2: The standard toxicologic pathology sectioning paradigm for the rodent heart adequately represents the incidence and/or severity of PCM in that population.
Hypothesis 3: The incidence and severity of rodent PCM are similar among all GSK safety assessment sites.
Hypothesis 4: The incidence and severity of PCM is affected by the stress associated with handling.
Hypothesis 5: PCM lesions are most common in the left ventricular, subendocardial, and apical regions of the heart.
Hypothesis 6: The detectable level of serum cTnI correlates with the incidence and/or size of “acute” necrotic area.
Material and Methods
Study Design
This study was reviewed and conducted in accordance with all applicable regulatory and GSK policies associated with the ethical care, welfare, and treatment of laboratory animals.
Study design simulated the standard nonclinical studies of 7-, 14-, and 28-day durations. Three GSK safety assessment sites, in the United Kingdom, United States, and Italy (referred to as GSK 1, GSK 2, and GSK 3), followed the same study design using a similar relative time frame (January 2010–March 2010), and standard local practices and procedures. Study-oriented handling procedures that were considered to have a possible impact on background cardiomyopathy were included. The rats were provided by the local breeding facilities of the same commercial supplier (Charles River Laboratories: Raleigh NC, Margate, Kent, UK, Saint-Germain sur l’Arbresle, France). The Crl:CD(SD) rat was chosen following the results of a recent industry survey indicating that this strain was still the most commonly used by the majority of respondents (Keenan et al. 2010). The study included males only as they are considered to have a higher incidence of PCM than females (Fairweather 1967; Burek 1978).
Following acclimation to the vivarium (minimum 1 week), rats (10–11 weeks old) were allocated in groups as follows (10 males per group per site): The first group simulated a 7-day study with only a pretest and a terminal blood sampling (group 1). The second group simulated a 14-day study with only a pretest and a terminal blood sampling and day 14 overnight urine collection requiring movement to metabolism cages (group 2). The third group simulated a 28-day study with only a pretest and a terminal blood sampling and day 28 overnight urine collection requiring movement to metabolism cages (group 3). The fourth group simulated a standard 28-day study with repeated blood sampling (pretest and days 1, 8, 15, 22, and terminal) and day 28 overnight urine collection requiring movement to metabolism cages (group 4).
The animals were given 0.5% w/v hydroxypropylmethylcellulose (HPMC) K15M and 0.1% Tween 80 by oral gavage as this is a common vehicle and route of administration used in preclinical studies. They were fed ad libitum and were group-housed to reflect the industry-wide common procedure (Keenan et al. 2010) using plastic solid bottom cages (Tecniplast©, Type IV, floor area 1,820 cm2) with wood chip bedding (3 or 4 animals per cage). Overnight fasting preceded all terminal blood collections.
Clinical Observations and Body Weights
Clinical observations (cage observations) were performed daily during the pretreatment period, then twice daily and on the day of necropsy. In addition, a full clinical examination with associated handling was performed on pretest (day 8) and day 10 for group 2 animals and pretest (day 8) and days 10 and 27 for groups 3 and 4 animals.
Animals were weighed once during the pretreatment period and then twice weekly during the study.
Clinical Pathology
On pretest day 7, for all groups and for the interim collections (group 4), blood (0.6 ml) was collected from the tail vein into tubes without anticoagulant for serum. At necropsy, under anesthesia, blood (2 ml) was collected from the abdominal vena cava into tubes without anticoagulant for serum. Samples were centrifuged at 2,000 g for 5 min and serum was frozen at −80°C until analysis within days.
cTnI analysis was carried out at every GSK site on the Bayer Centaur CP chemiluminescence analyzer using the TnI-Ultra commercial assay. The TnI-Ultra commercial assay is a 3-site sandwich immunoassay using direct chemiluminometric technology qualified in-house for use in rats. An ancillary reagent was included to reduce nonspecific binding. The Binary Lite reagent included a polyclonal goat antitroponin I antibody labeled with acridinium ester and 2 biotinylated mouse monoclonal antitroponin I antibodies. The solid phase reagent was magnetic latex particles conjugated with streptavidin. The assay range was 0.006 to 50 µg/l, 0.006 µg/l being the lowest detectable level of cTnI; therefore, values below this level are reported as <0.006 µg/l. Quality control samples supplied by Siemens and an in-house rat pool were used to assess assay performance and were considered acceptable.
Terminal Procedures
At the end of the dosing phase, and following an overnight fast, animals were deeply anesthetized with isoflurane and then euthanized by exsanguination via abdominal vasculature. Terminal body weight, brain, and heart weights were recorded. Intact hearts were collected and preserved in 10% neutral buffered formalin (NBF) for histology.
Histology
Following fixation in 10% NBF for 24 hr, hearts were transferred to 70% ethanol (in order to support optimal conditions for potential immunohistochemistry) for 27, 20, and 5 days (± 2 days) for animals killed on days 8, 15, and 29, respectively, before tissue processing. Unique cardiac sectioning methods were developed for this study to allow evaluation of spatial distribution of PCM lesions. A 1- to 2-mm thick longitudinal section was trimmed from the ventricles (one side only; from base to apex) to facilitate proper orientation for embedding and microtomy (Figure 1). The remaining heart was placed in a megacassette and paraffin-embedded, the cut surface down. Longitudinal sectioning, allowing for topographic characterization, was chosen as the most frequently used pattern in the industry.
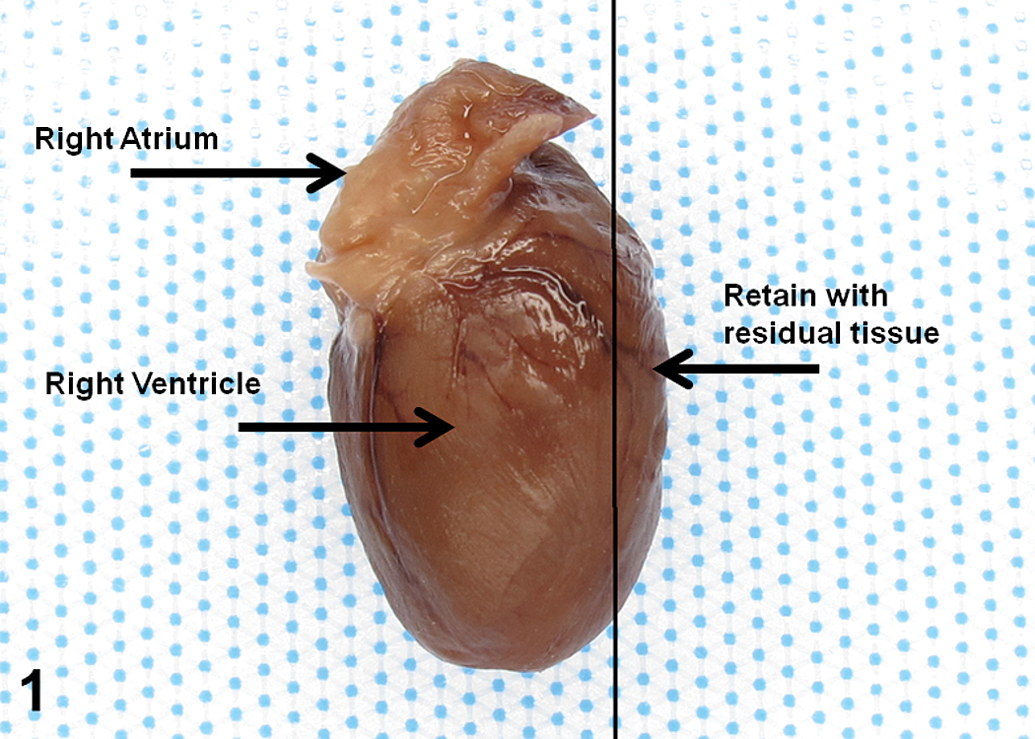
Heart trimming.
To characterize spatial distribution of PCM, a step-sectioning approach was chosen to produce 10 sections per animal. Five adjacent sections were produced every 300 µm, one of which was stained with H&E. During the histopathologic evaluation, one of these 10 sections was recorded as “standard” by the study pathologist (Figure 2). Criteria for identifying the standard section, consistent with routine study procedures, were the presence of the 4 chambers, presence of papillary muscle, and presence of both atrioventricular valves. Each slide was digitally scanned using the Spectrum© system and read using Aperio©.
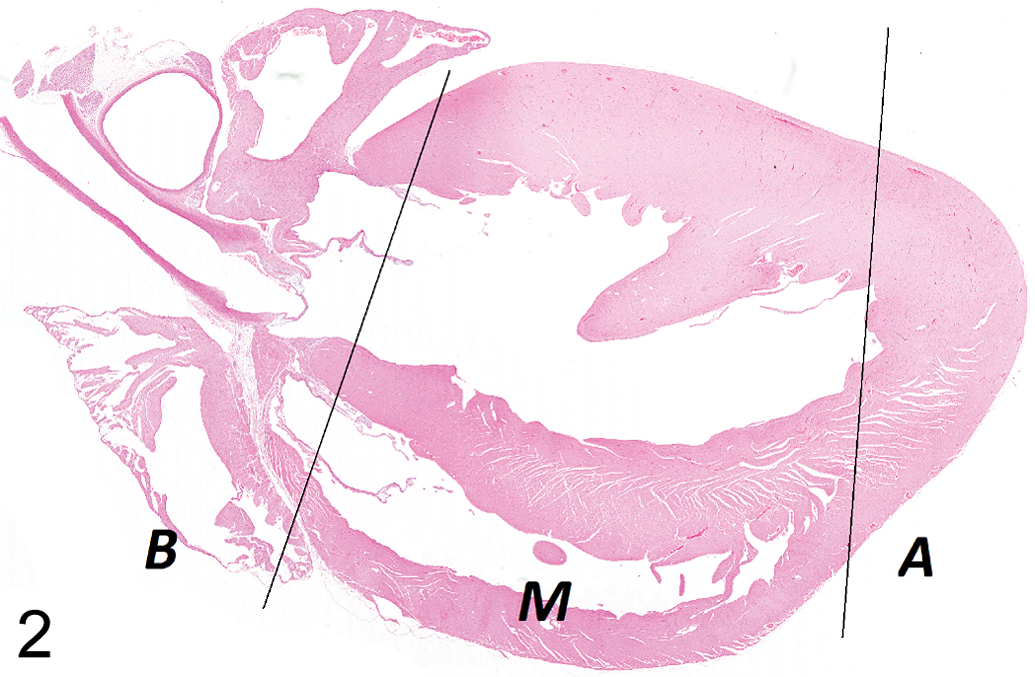
Example of the standard section with delineation of the major areas. B = base, M = mid region, A = apex (original magnification 1×).
Recording of Histopathology Data and Statistical Analysis
No threshold for morphologic changes was applied; all lesions consistent with the earliest stages of PCM were classified. Each study was individually evaluated by a study pathologist (FC, RH, or BB) using predetermined criteria established by reviewing a subset of provisional findings.
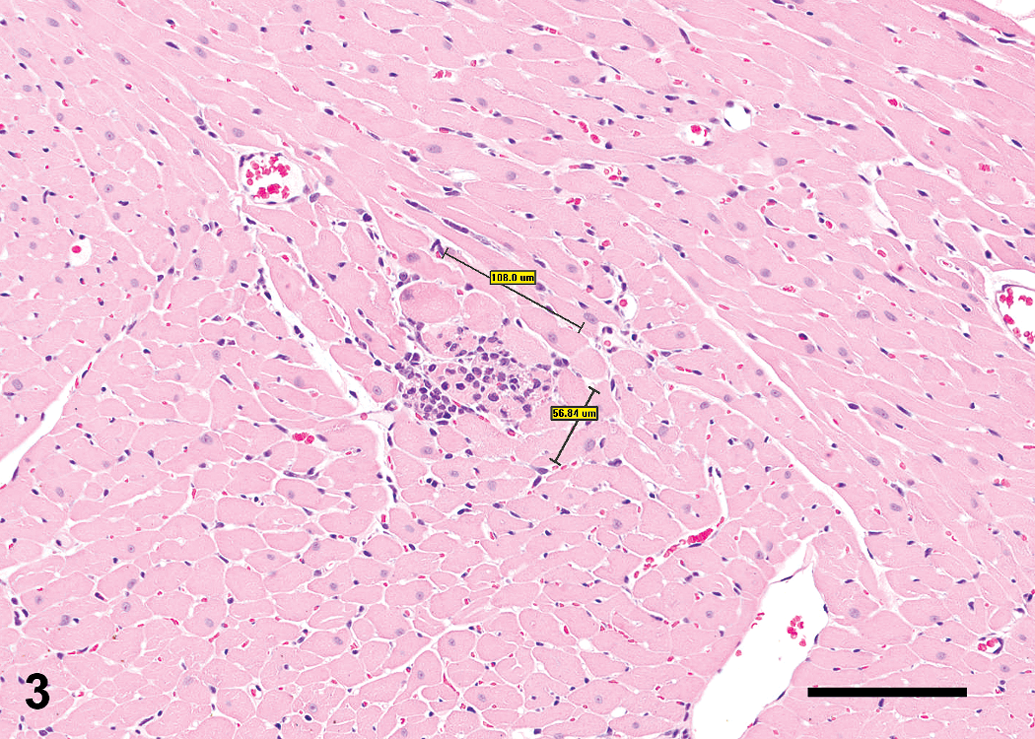
Three microscopic diagnoses were used (Table 1):
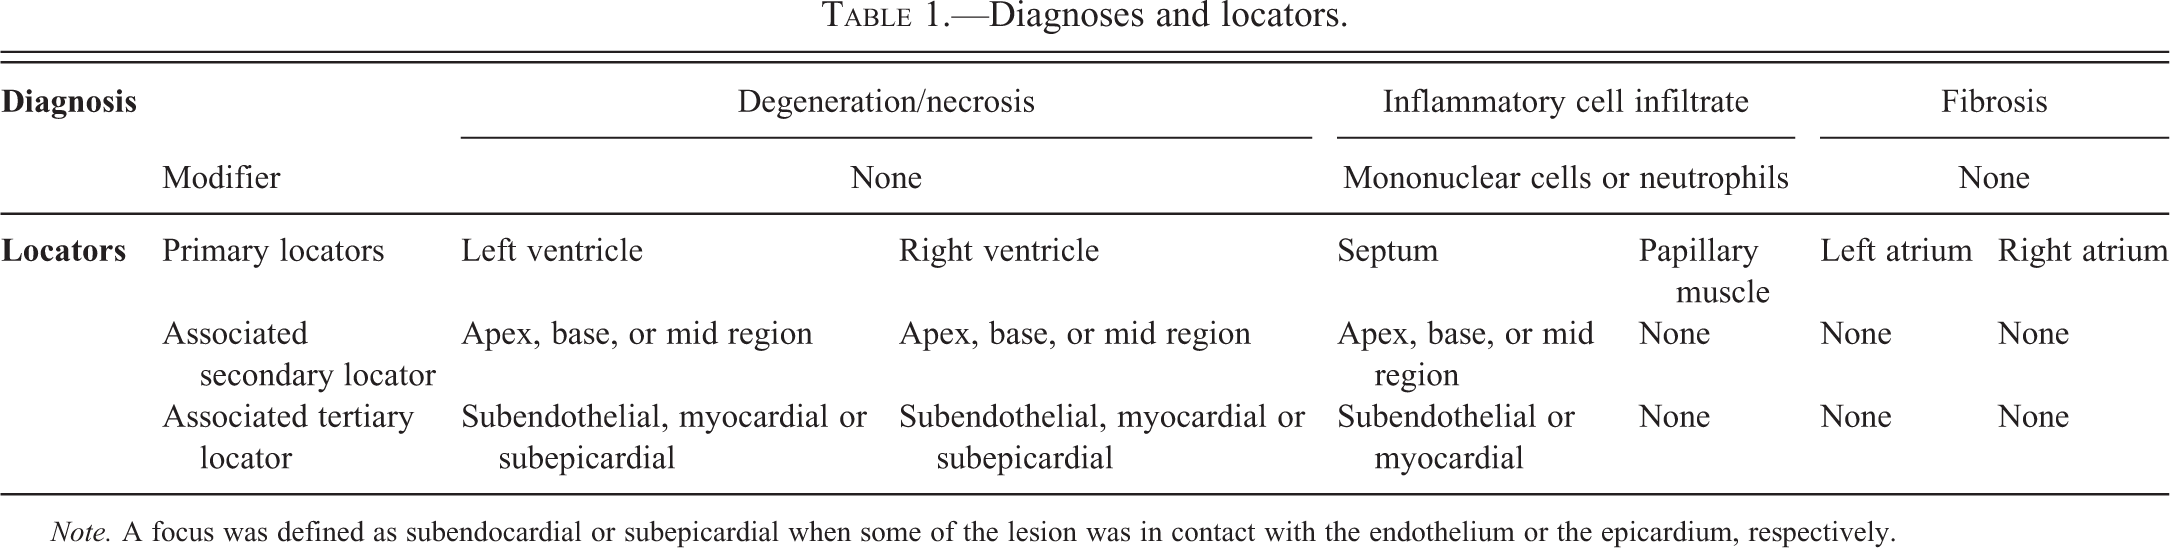
Degeneration/necrosis was used for degenerate/necrotic cells in which cellular debris was clearly visible (Figures 3 and 4). Artifactual hypereosinophilic staining of myofibers was not included in this diagnosis.
Inflammatory cell infiltrate was used for the cellular component excluding cardiomyocyte cellular material (Figure 5). The major cell type was added as a modifier.
Fibrosis was used when clear increased interstitial collagen deposit was present. The primary diagnosis represented the predominant change (>50% of the lesion area) and was followed by additional diagnoses when warranted to account for secondary features. The site of the lesion was recorded using 3 locators (Table 1). The section comparable to GSK’s routine standard section was recorded.
Diagnoses and locators.
Note. A focus was defined as subendocardial or subepicardial when some of the lesion was in contact with the endothelium or the epicardium, respectively.
Lesion mainly necrotic in nature with measurement—“Lines” method (unit: micrometer (µm)). The area had to be calculated (bar: 100 µm).
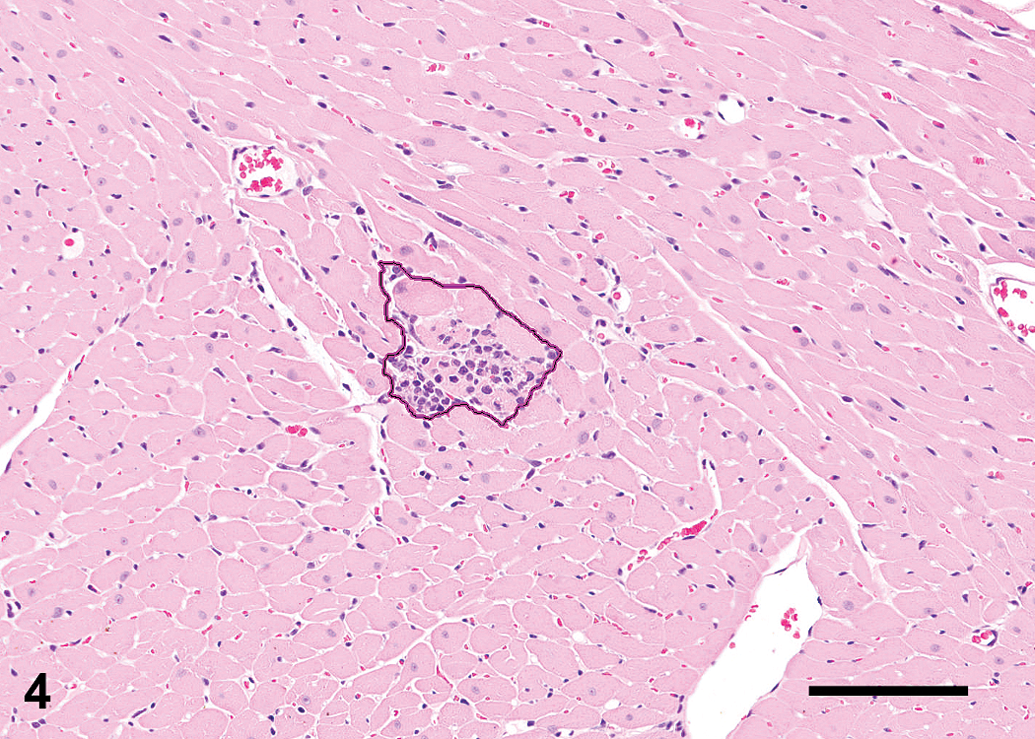
Lesion mainly necrotic in nature with measurement—“Circle” method. The area is automatically calculated by Aperio (bar: 100 µm).
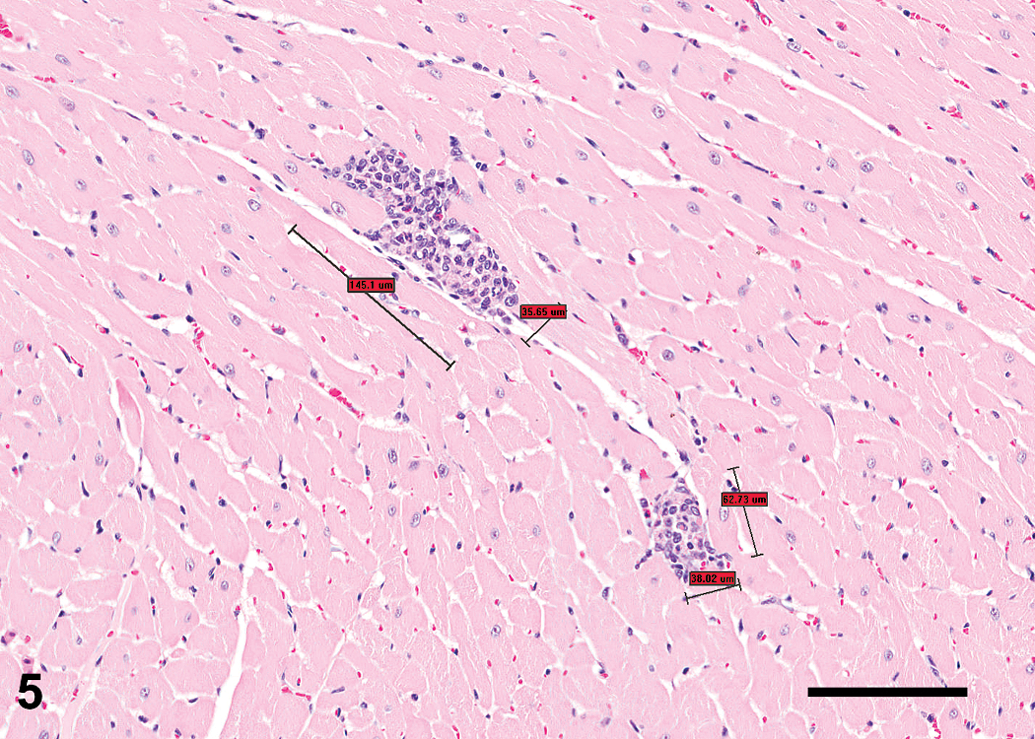
Lesion mainly inflammatory in nature with measurement, unit µm (bar: 100 µm).
Lesion foci from each section were annotated and measured using Aperio to calculate the total number of lesions and the total area of the lesions. The relative percentage of necrosis was added as determined by the pathologists to allow the calculation of the necrotic area. All data were recorded in Excel© spreadsheets. A peer review of 20% of the slides (review of both diagnoses and area determination/% necrosis %) was performed (FC, RH, BB, AHE).
The Excel spreadsheets generated during the reading process were used to create SAS (Statistical Analysis Software©) data sets for the analysis.
Proc MIXED (MIXED procedure of SAS/STAT, 2008) in SAS was used to perform the analysis of the total number of lesions per animal, total lesion area per animal, total necrotic focus area per animal, and total necrotic focus area per animal/total lesion area per animal data. The data for the total number of lesions per animal, total lesion area per animal, and the total necrotic focus area per animal were log transformed prior to performing the statistical analysis due to the heterogeneity of the variances among the groups.
The differences between the groups within sites and the differences between the sites within groups were assessed via Tukey’s multiple comparison test using Proc MIXED (MIXED Procedure of SAS/STAT, 2008) in SAS. Tukey’s test compares all groups with each other while controlling the error rate for the multiple comparisons. The analyses were performed separately for the standard and nonstandard sections.
Proc CORR (CORR Procedure of SAS/STAT, 2009) in SAS was used to perform the correlation analysis of the cTnI data versus the total necrotic focus area and total lesion area data, and also the correlation analysis of the total lesion area per animal data (standard vs. nonstandard sections). All of the cTnI data, total necrotic focus area data, and total lesion area data were rank transformed prior to the Spearman rank-correlation statistic being calculated. Proc CORR computes the Spearman correlation by ranking the data and using the ranks in the Pearson product–moment correlation formula. In case of ties, the averaged ranks are used.
The statistical analysis was performed using SAS, Version 9.2, SAS Institute Inc (2002–2008). The box plots were generated using SAS JMP, Version 8, SAS Institute Inc. (2009).
Results
There were no macroscopic observations and no noteworthy heart weight (absolute or relative to body weight) differences between the groups or the 3 test sites (data not shown).
To determine the individual lesion size, two measuring methods were evaluated (see Figures 3 and 4). The first method (line) consisted of drawing 2 perpendicular lines to measure the length and the width of the lesion. The area was then calculated using Excel. The second method (circle) consisted of drawing a line that would follow the lesion contour, the area being measured automatically by the Aperio software.
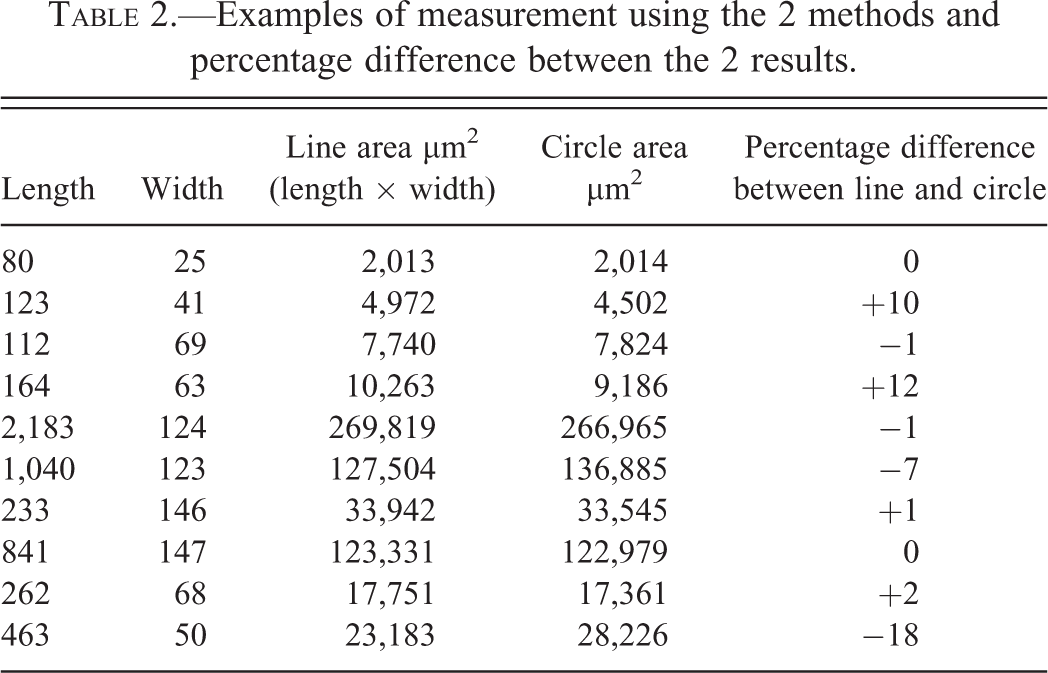
The difference between the two methods was usually small (Table 2). Since the circle method was more time-consuming, the line method was applied.
Hypothesis 1: Step sectioning of the heart in rodents will reveal 100% incidence of PCM.
Examples of measurement using the 2 methods and percentage difference between the 2 results.
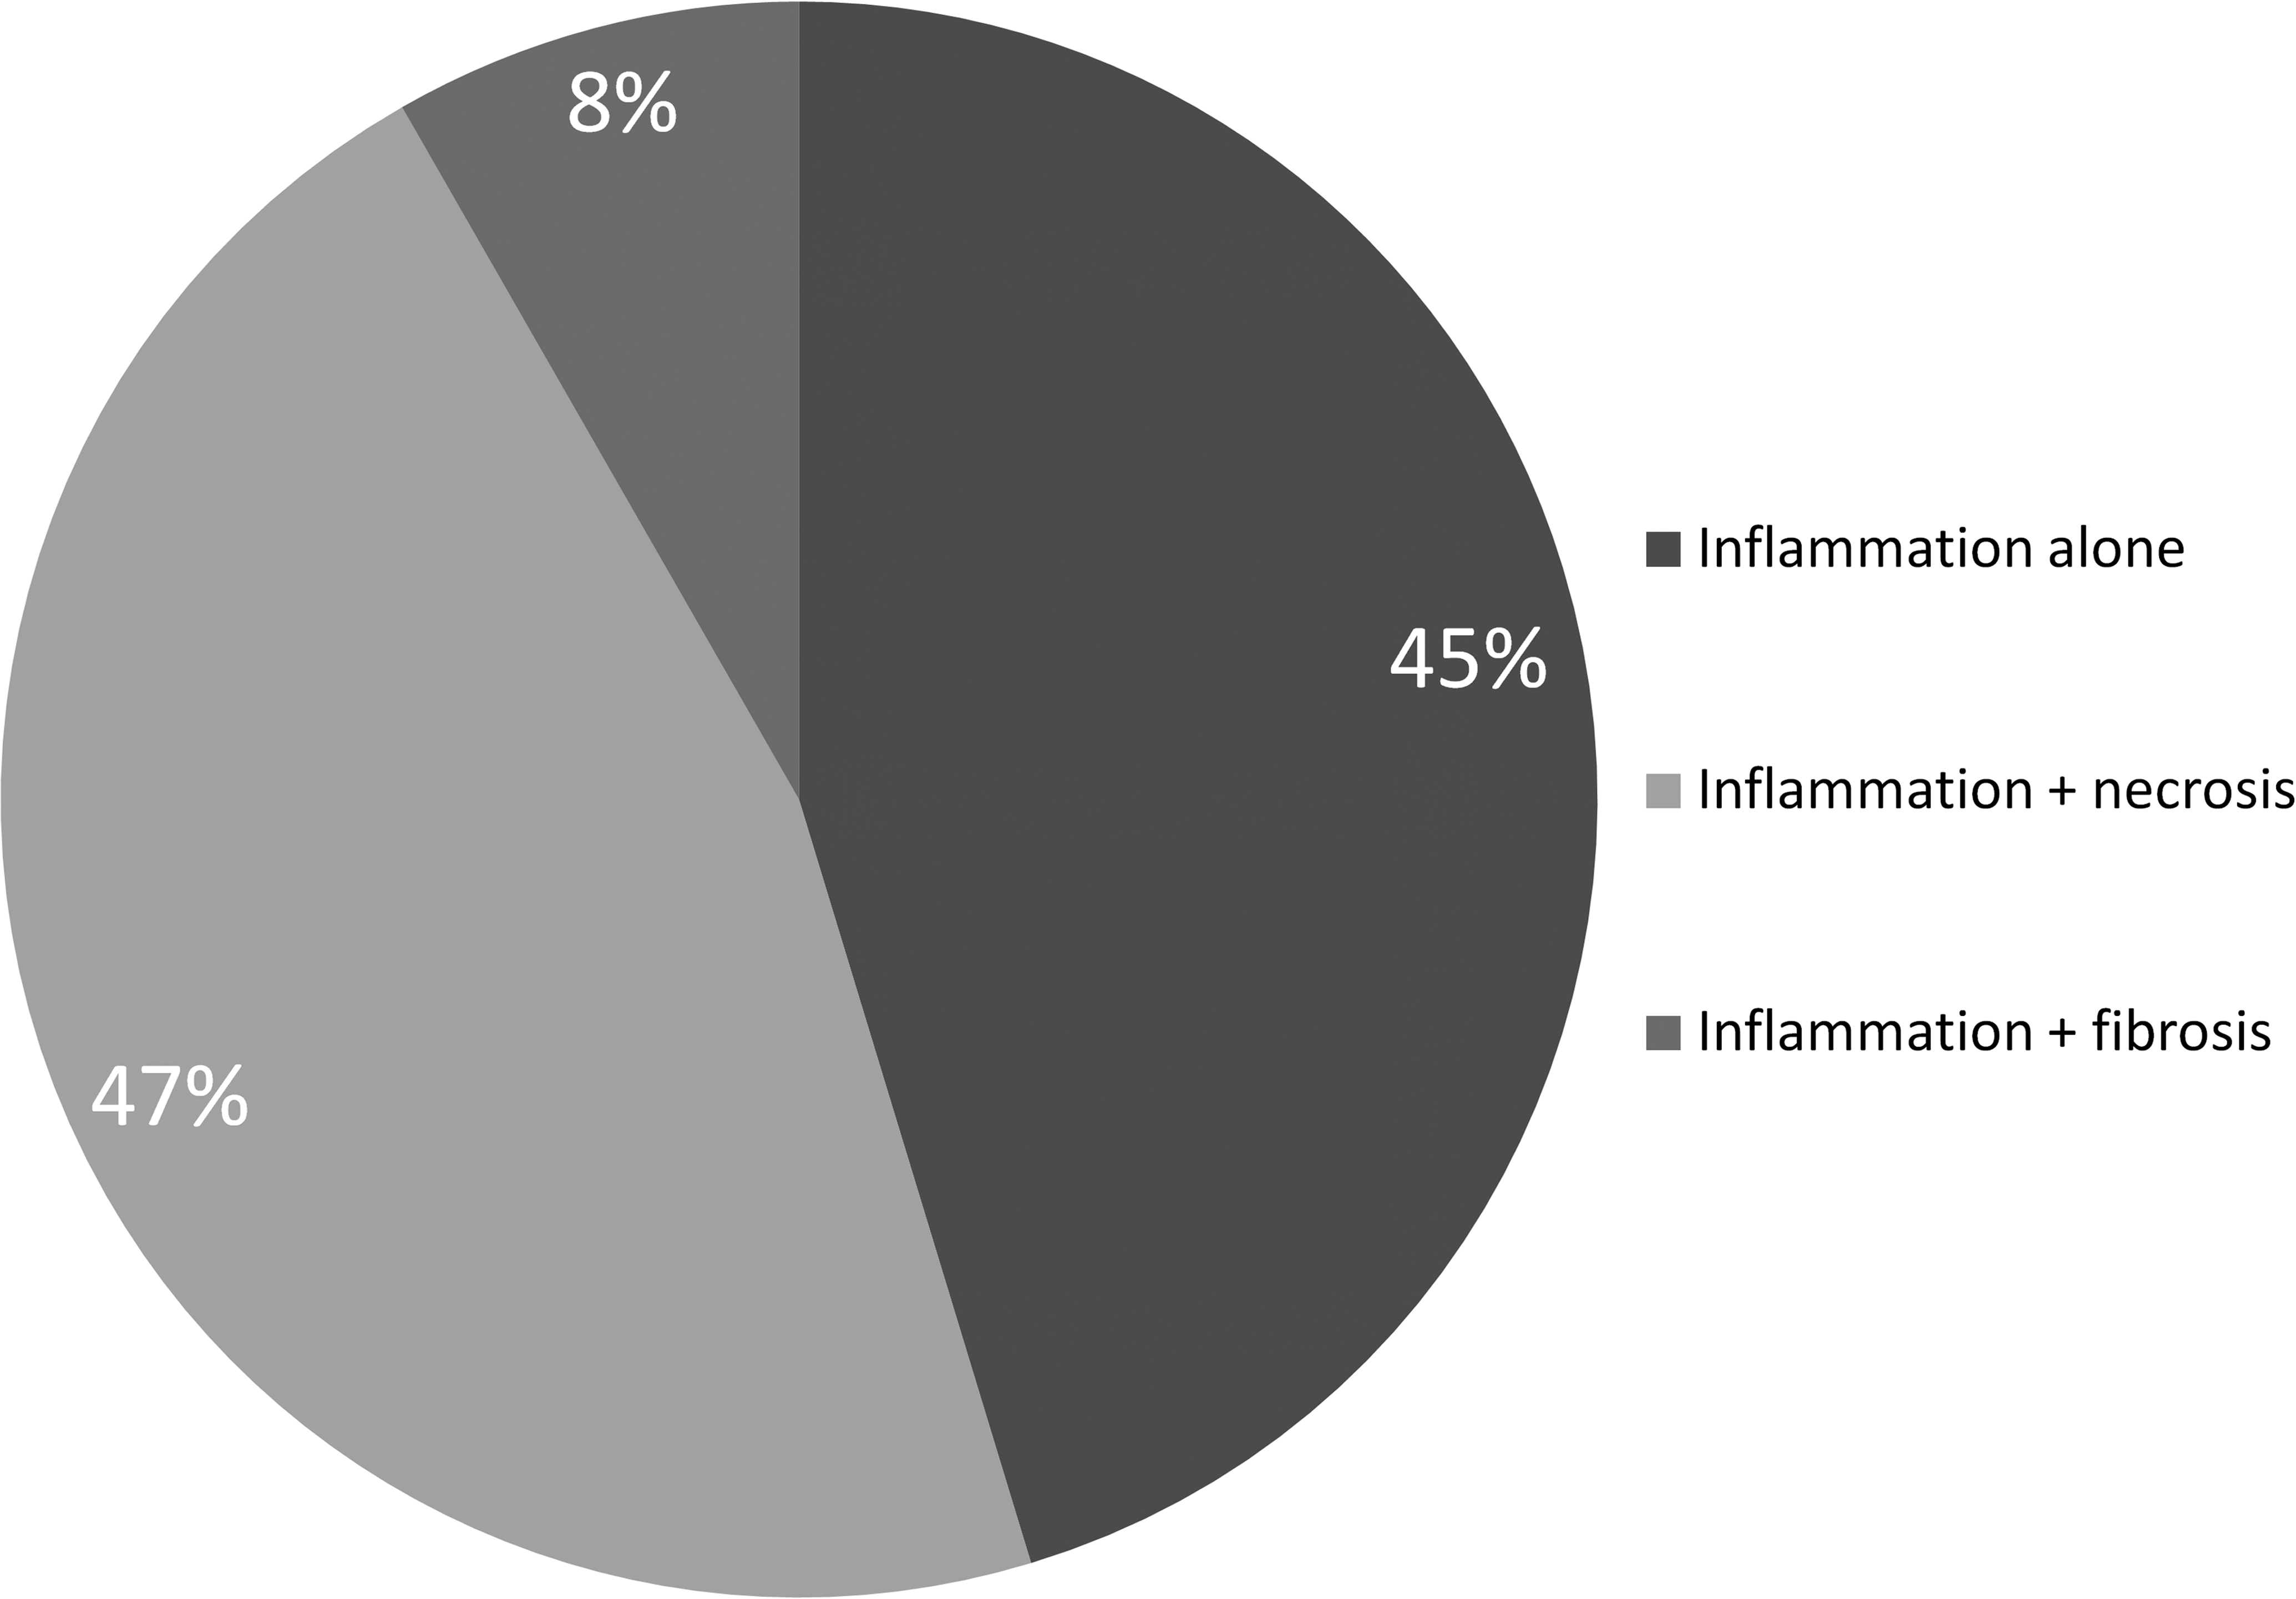
All the animals had at least one lesion in one or more sections. The average number of lesions per animal over all 10 sections was 14.7. The most frequent primary diagnosis was inflammatory cell infiltrate (i.e., 62% of all the lesions had inflammatory cell infiltrate as the primary diagnosis; Figure 6). The cellular infiltrate (modifier) was composed of mononuclear cells in the vast majority of cases. Neutrophilic infiltrates were only sporadically encountered. This inflammatory cell infiltration occurred alone (without a secondary diagnosis) in roughly half the foci or was associated with necrosis for the other half of the foci (Figure 7). Fibrosis was a far less common finding. Necrosis as the primary diagnosis was the second most common change (i.e., 29% of all the lesions had necrosis as the primary diagnosis) and was almost always associated with inflammatory cell infiltrate (99%).
Hypothesis 2: The standard sectioning paradigm represents the incidence and/or severity of PCM in that population.
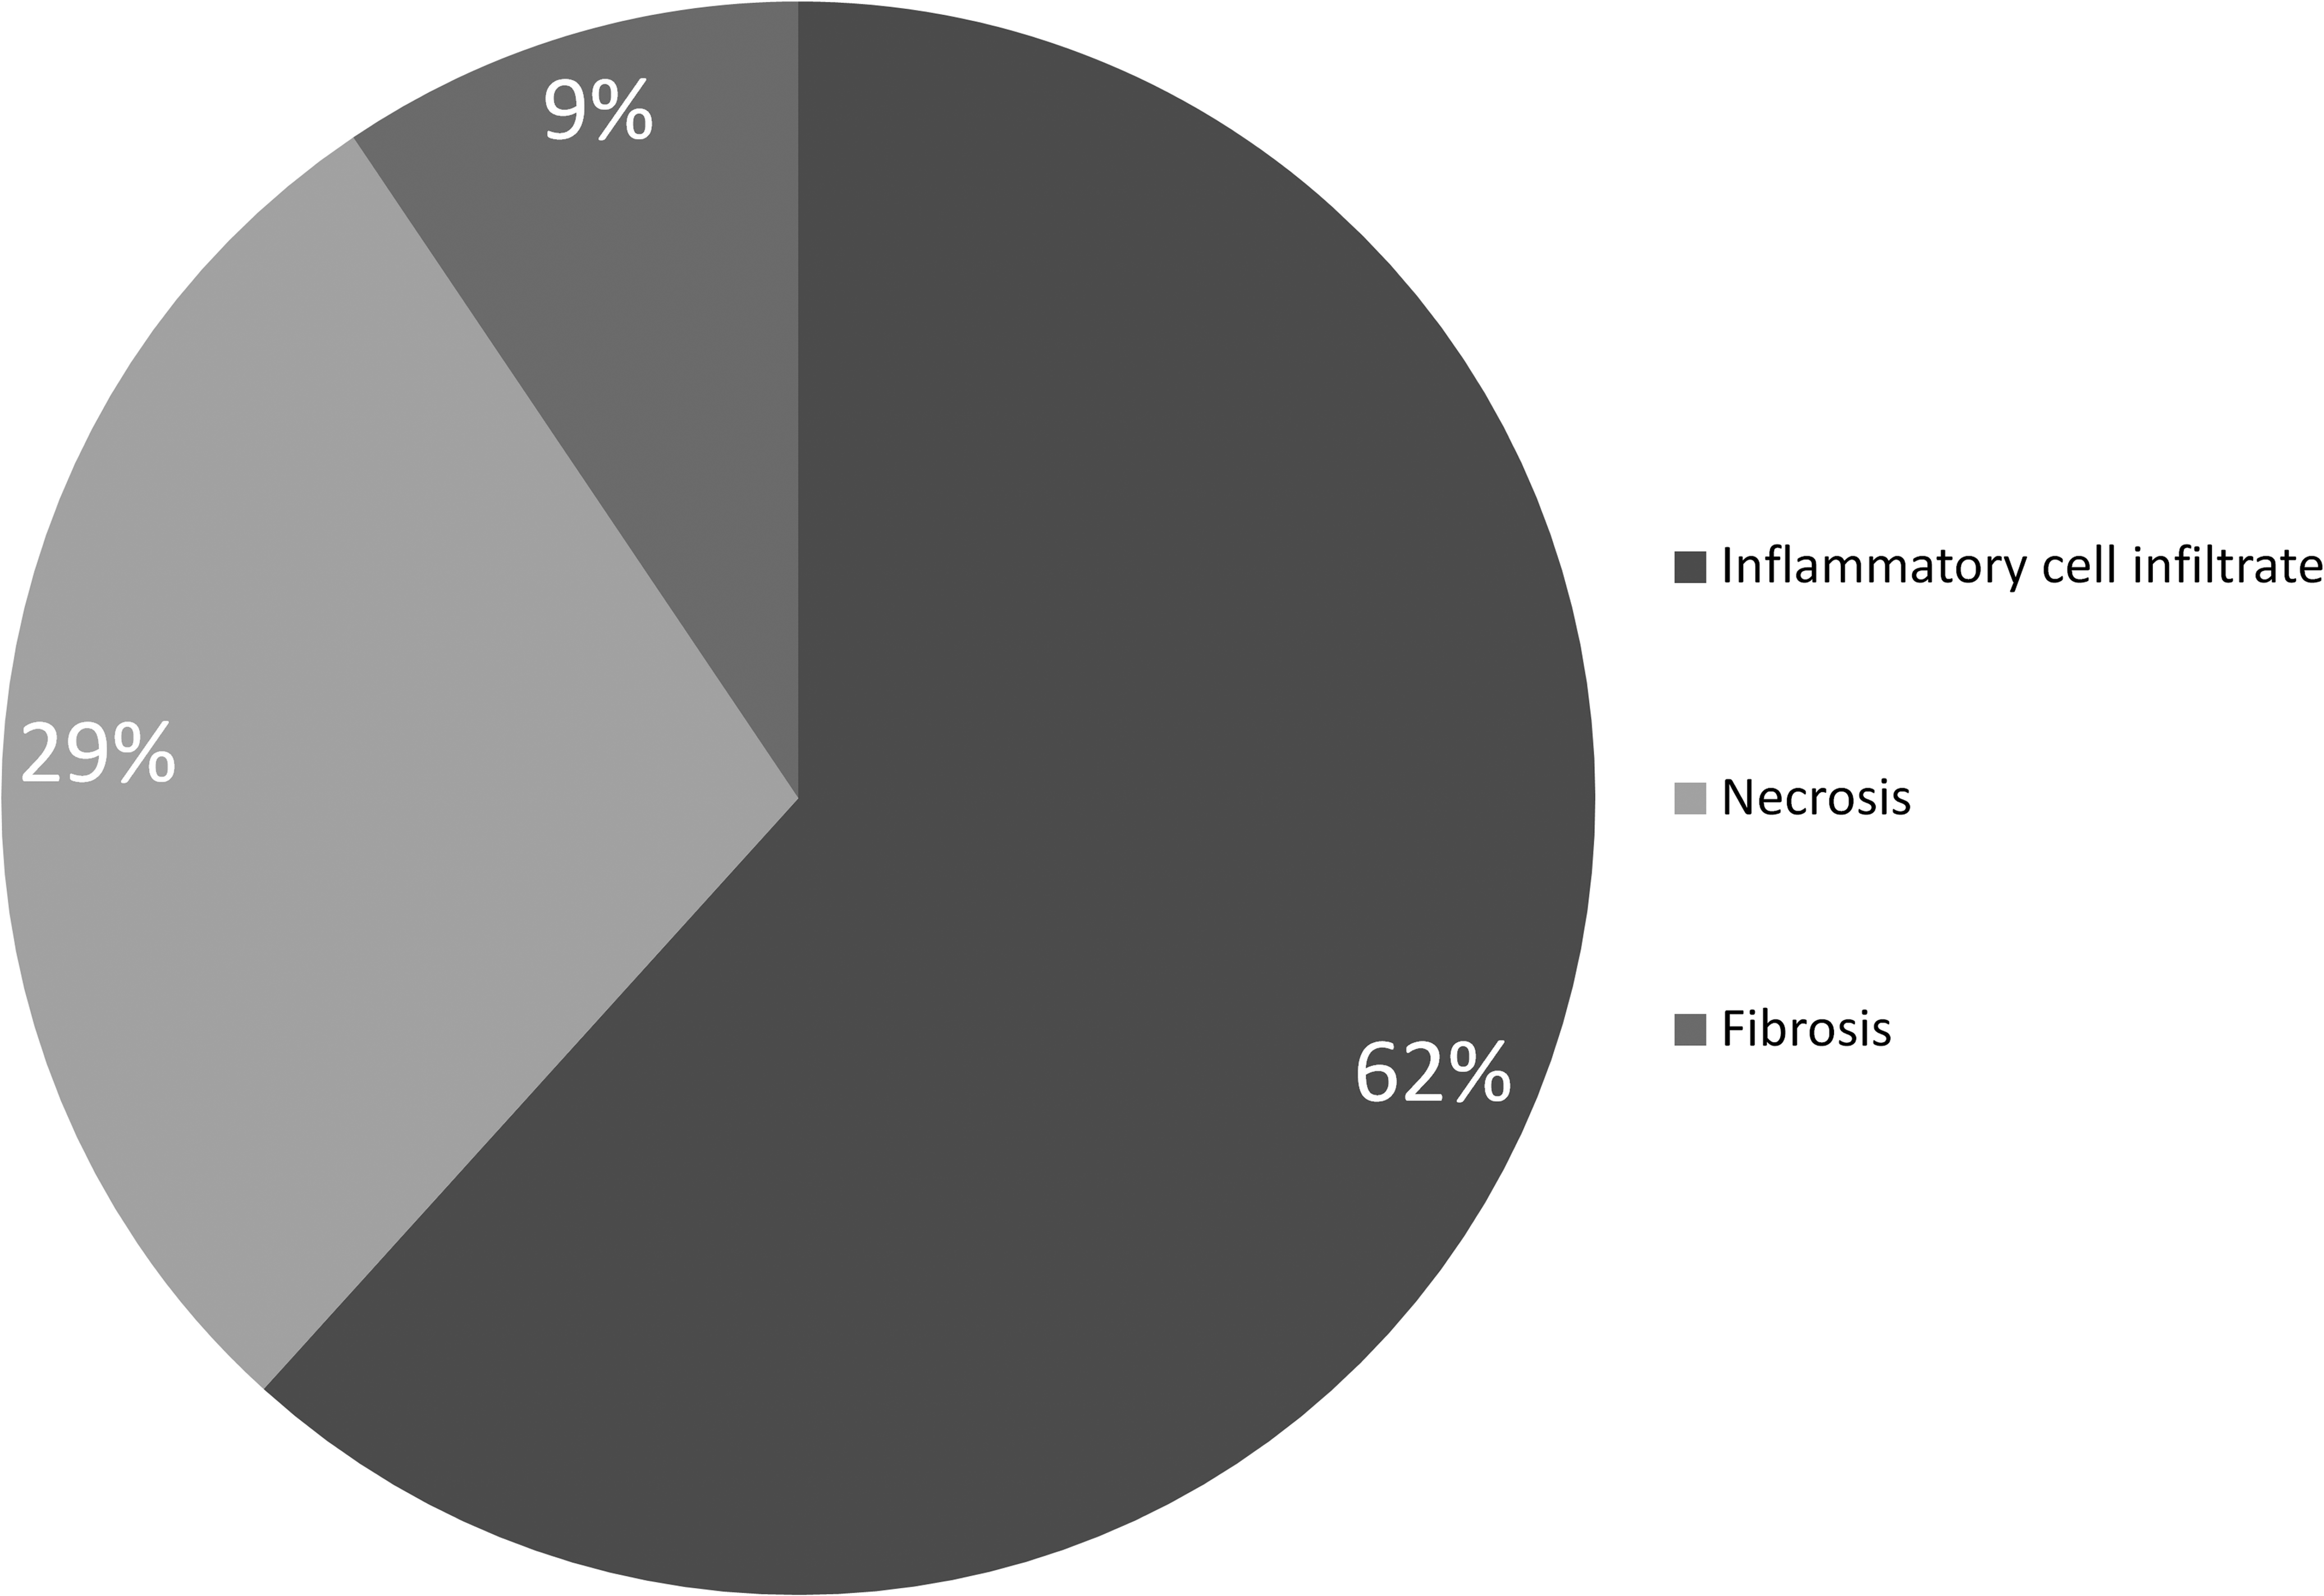
Relative proportion of the inflammatory cell infiltrate, necrosis, and fibrosis as primary diagnosis, all studies taken together (% of lesions).
Relative proportion of the secondary diagnosis following the inflammatory cell infiltrate, all studies taken together (% of secondary diagnosis).
To evaluate if the “standard” section was representative of lesion occurrence in the 10-step sections, we first evaluated the total number of animals without a lesion on the standard section that had at least one lesion on the 10 sections (Table 3).
Number of animals with at least one lesion over 10 step sections versus the number of animals with at least one lesion in the standard section.
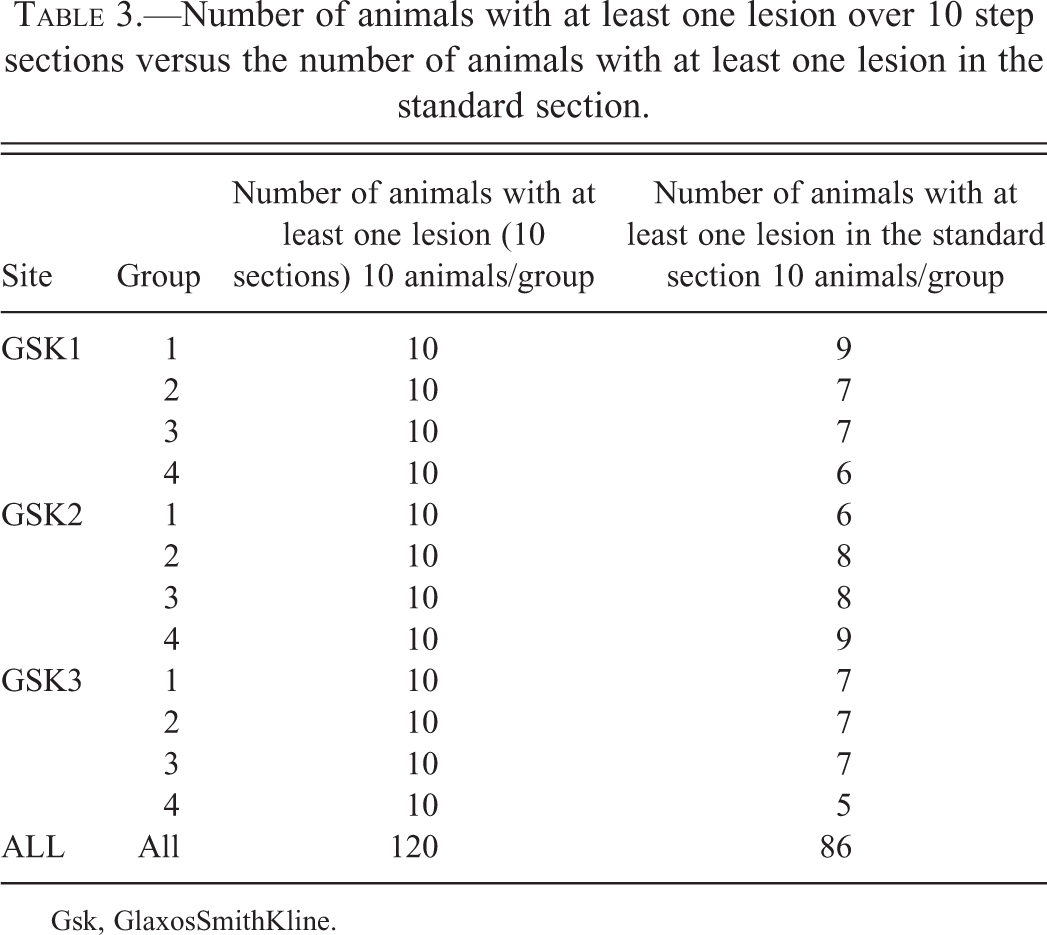
Gsk, GlaxosSmithKline.
This number was variable, ranging from 5 to 9 per group (average 7.16); however, the standard section was a representative surrogate for all step sections in 72% of all animals. The overall representation of PCM was identifiable in all groups using the standard section. Moreover, positive correlation was observed when comparing the ranked total lesion area per animal (standard section) to the ranked total lesion area per animal (10 sections) as shown in Figure 8.
Hypothesis 3: The incidence and severity of rodent PCM are equal among all GSK safety assessment sites.
Hypothesis 4: The incidence and severity of PCM is affected by the stress associated with handling.
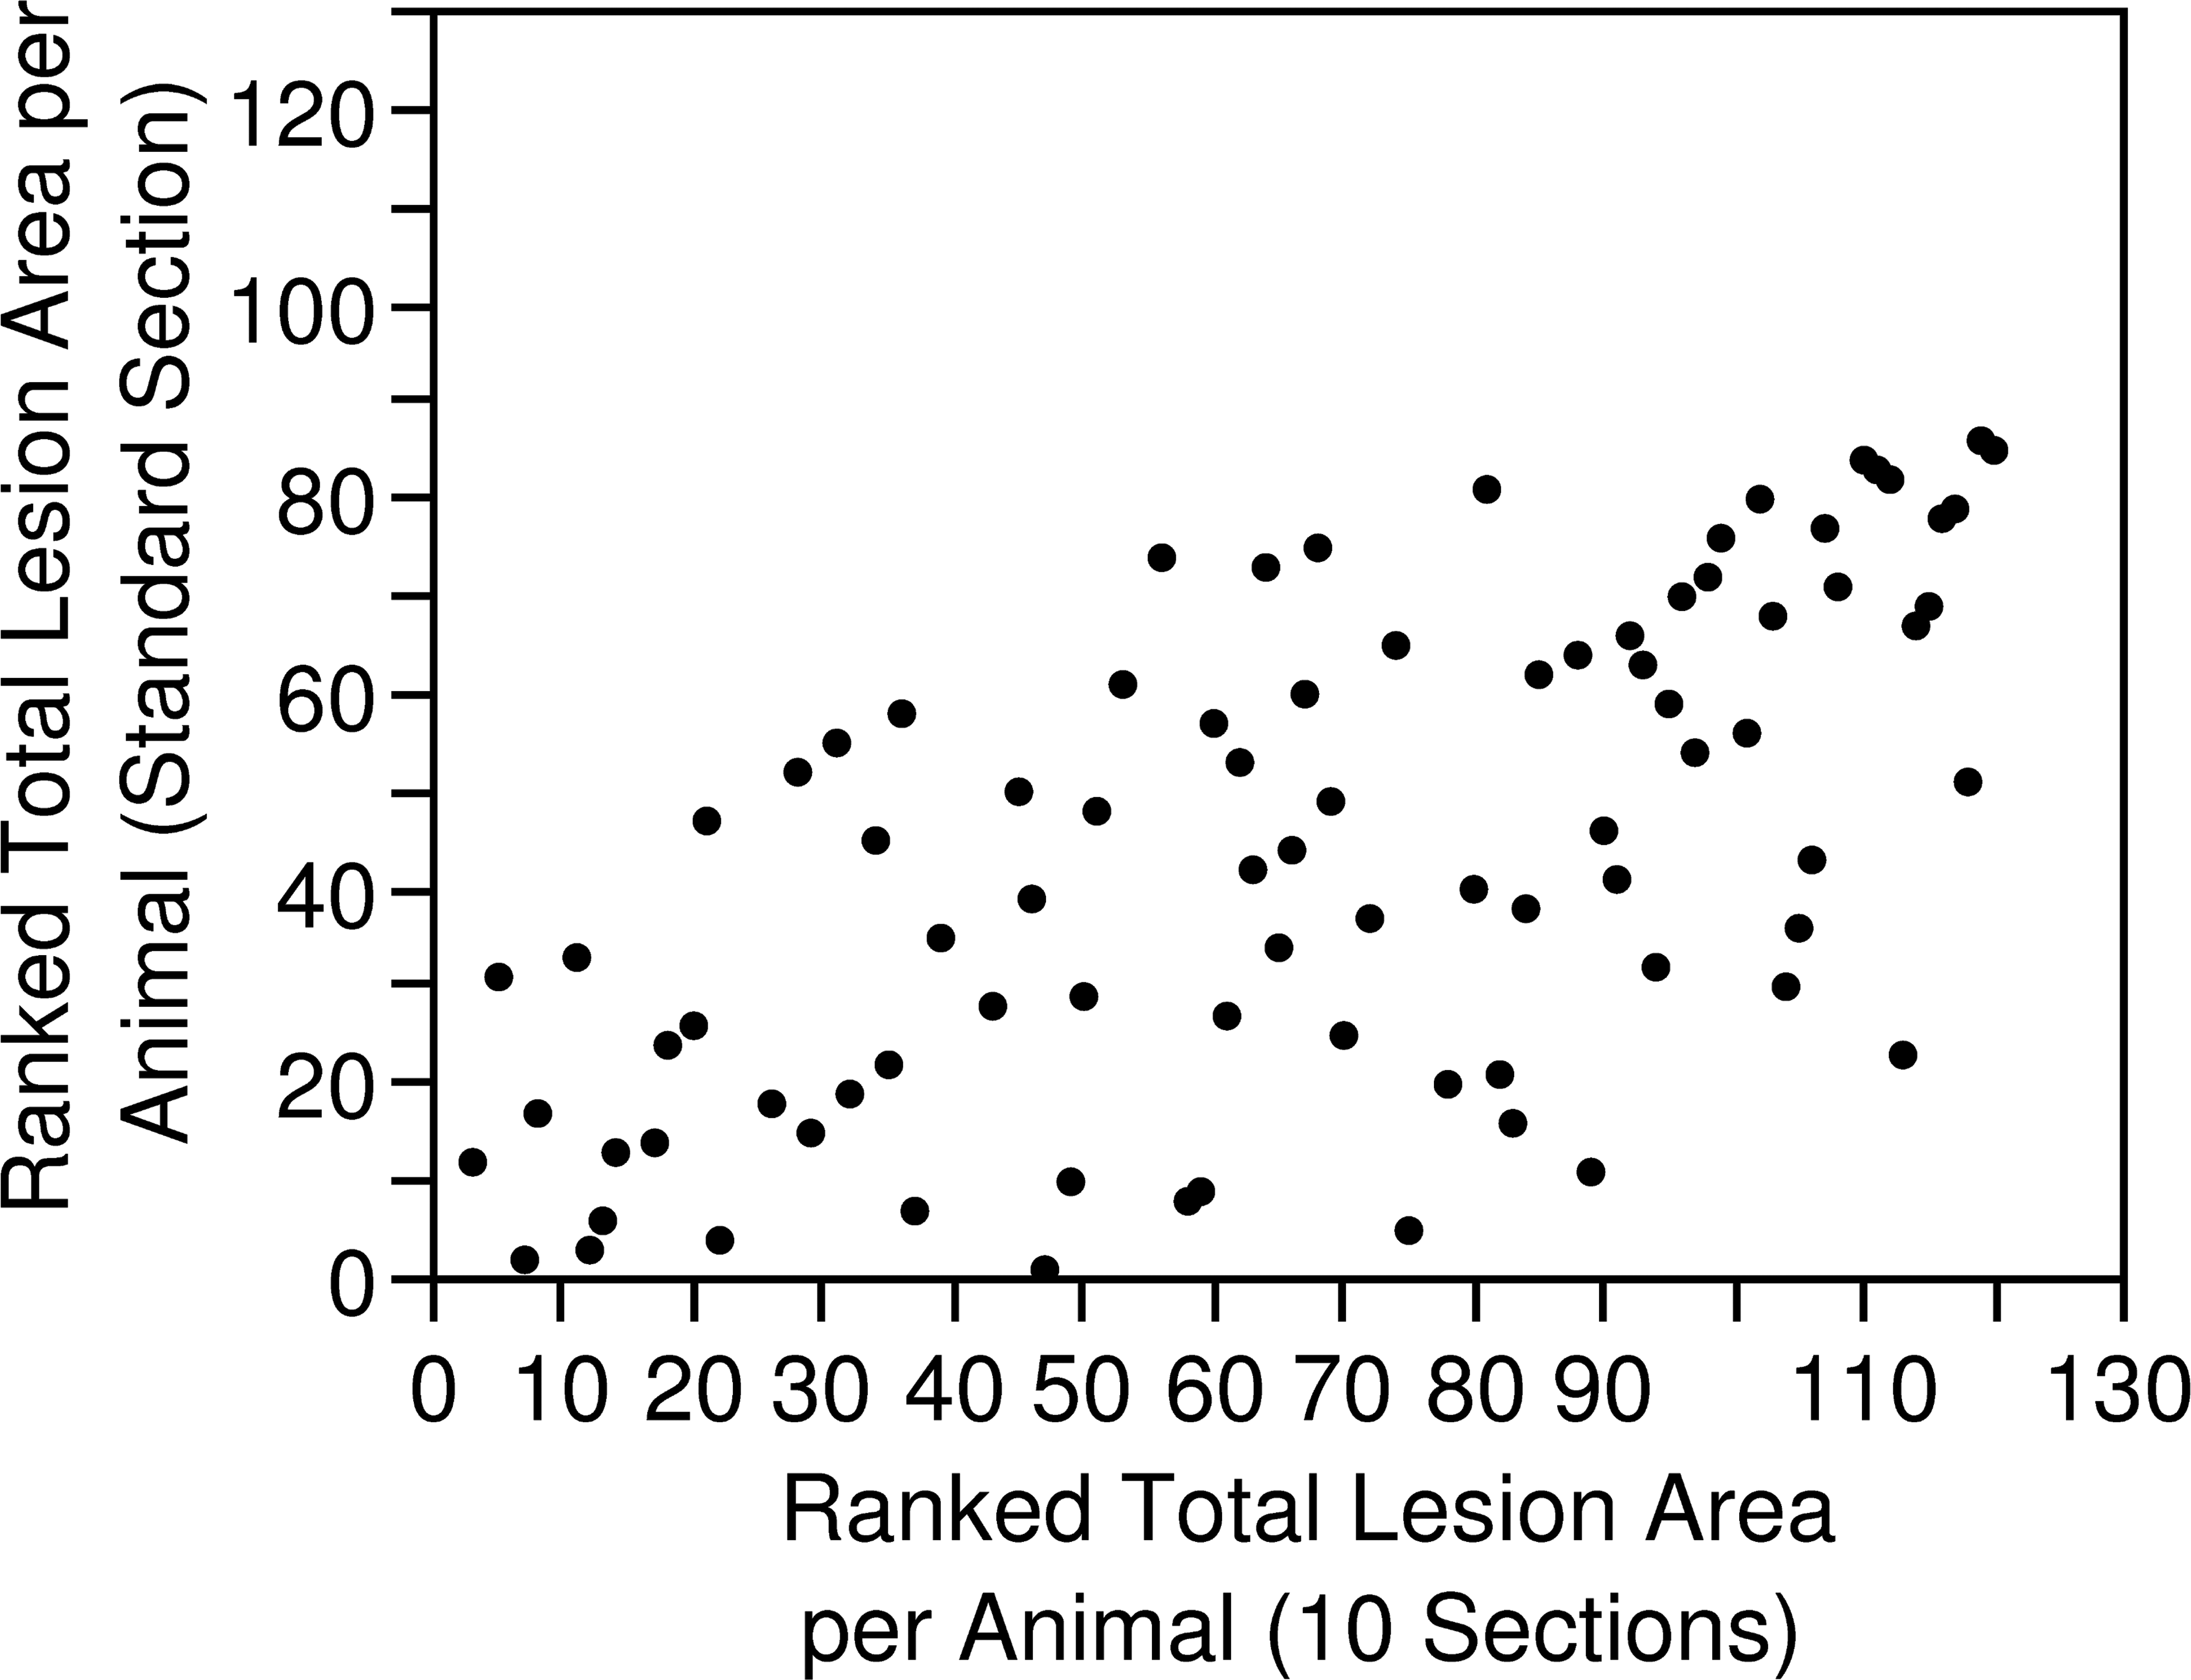
Scatter plot of the total lesion area (10 slides) versus the total lesion area (standard section) at all sites and groups combined. rs = 0.64, p ≤ .0001.
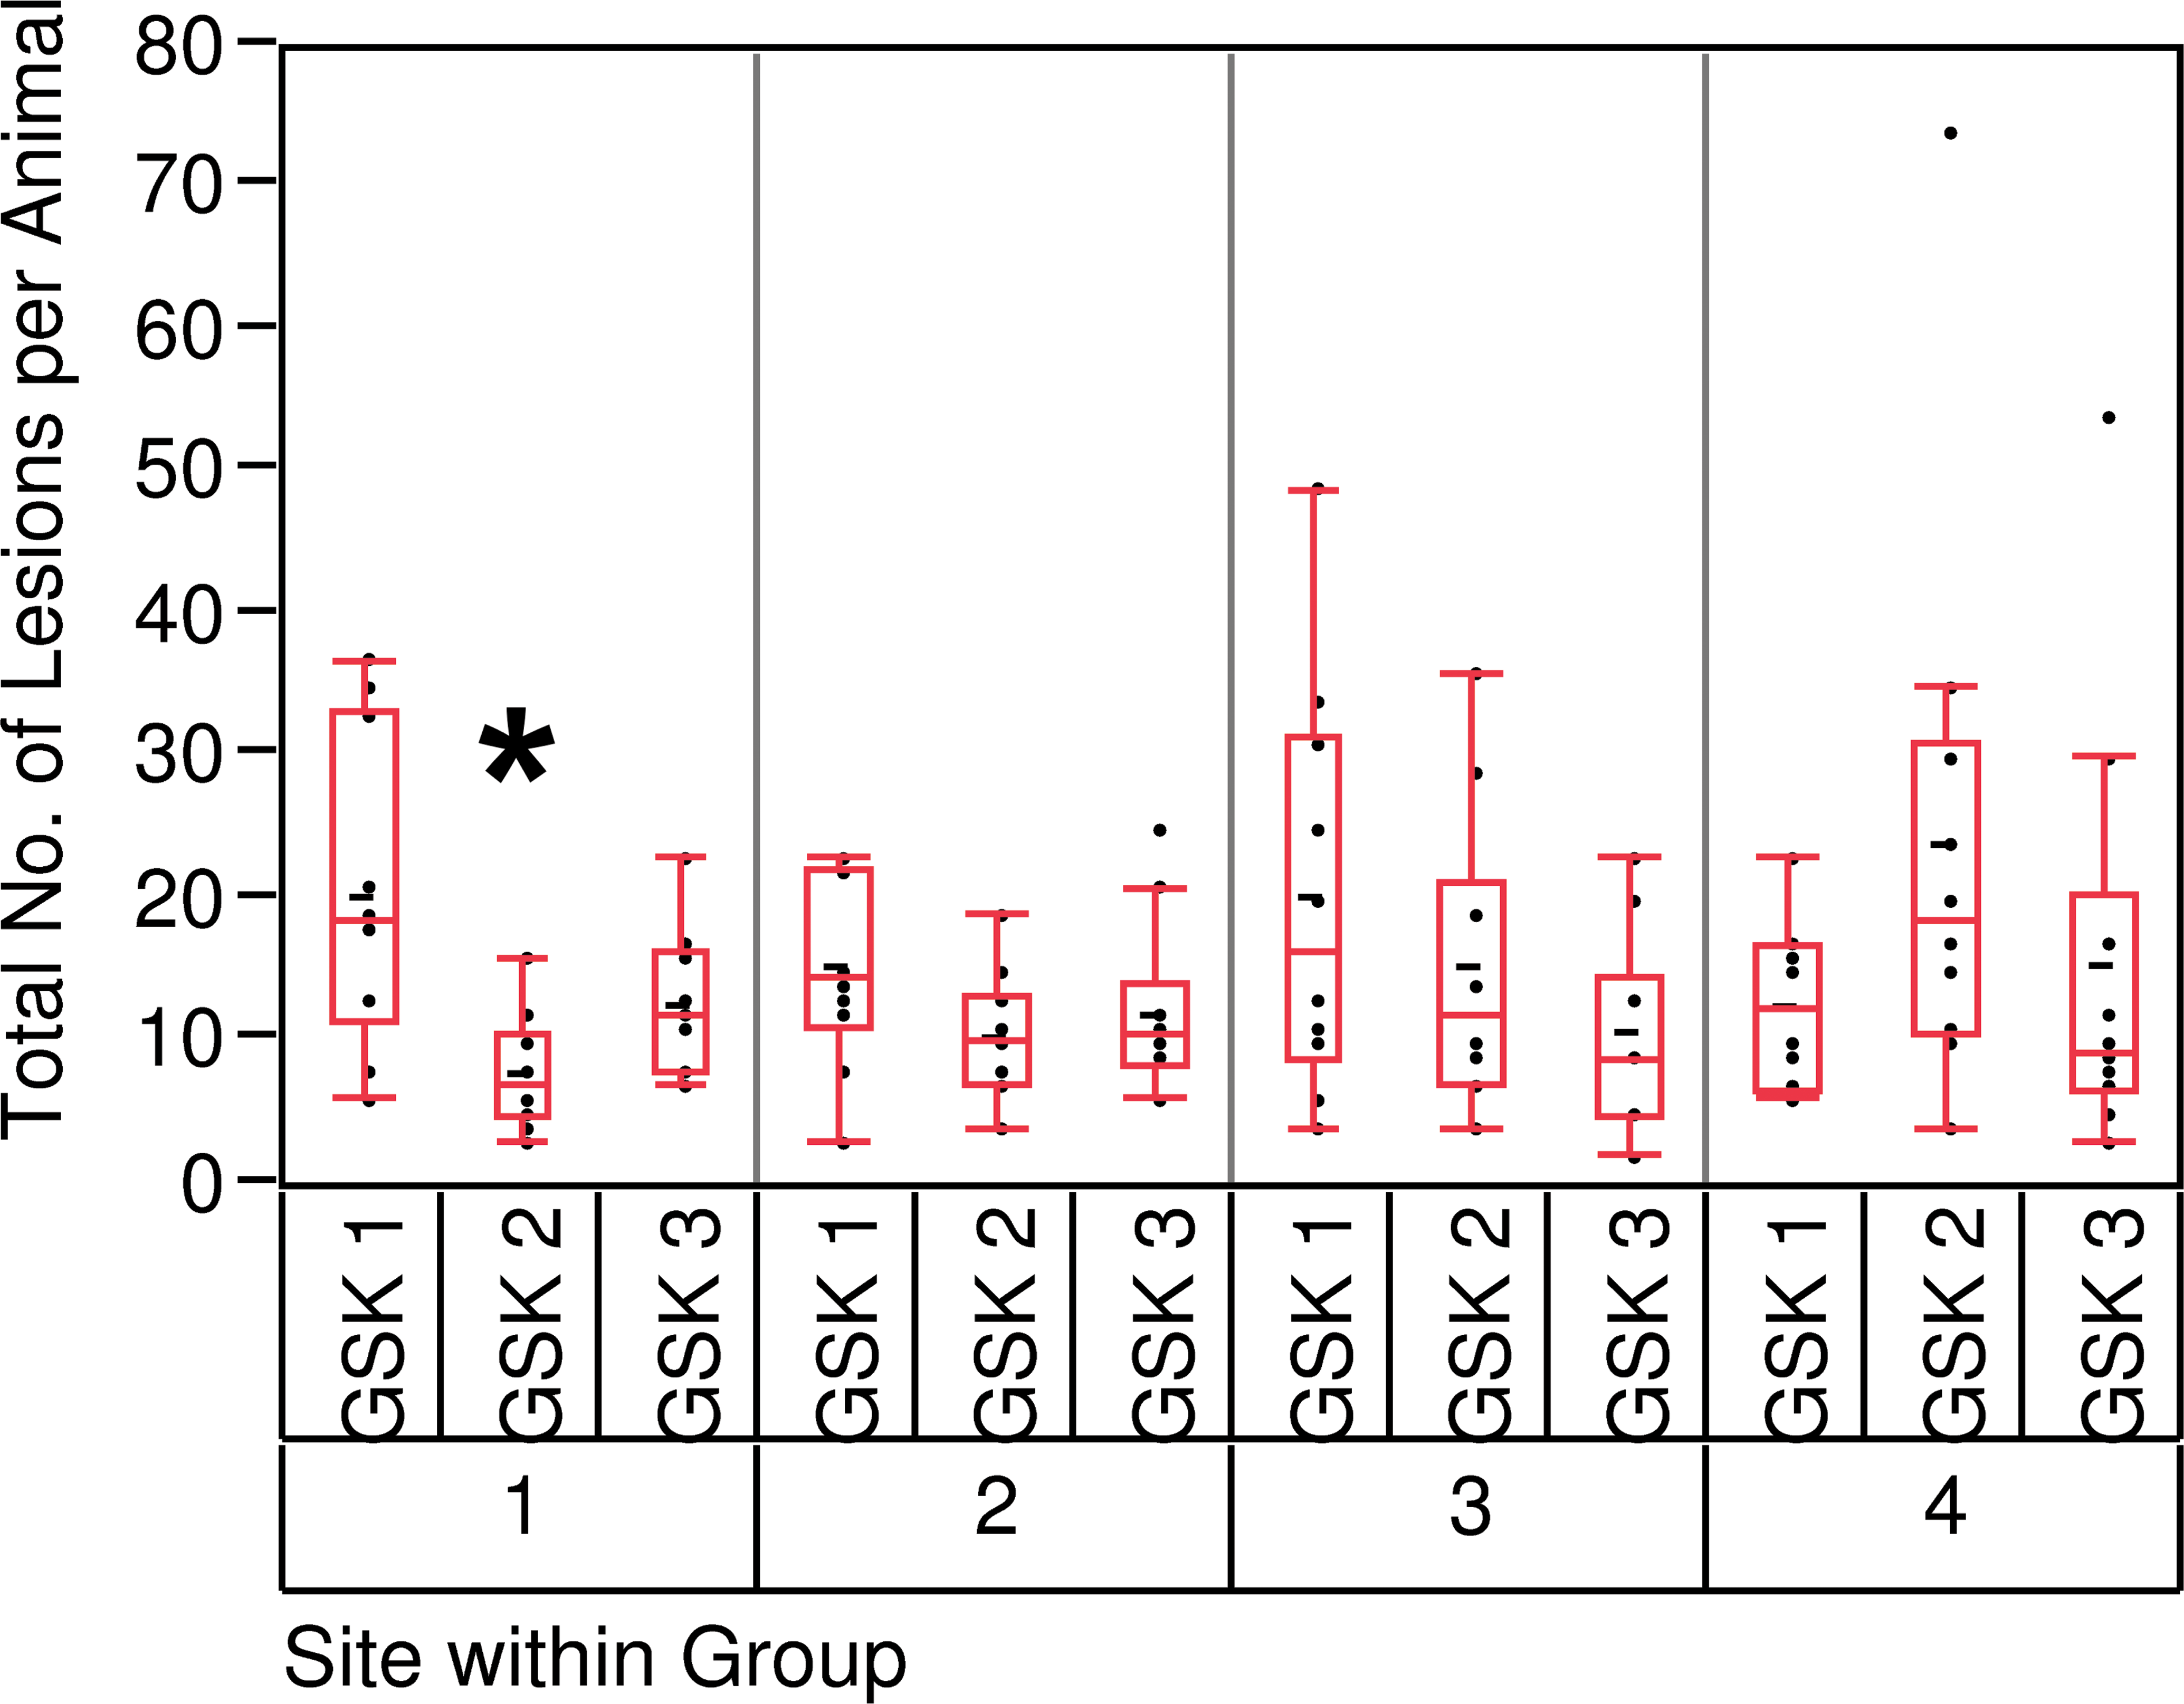
The unit of analysis for PCM incidence was the individual animal. For each animal, the total number of lesions was summed over all 10 sections. Except for GSK 2 group 4, there was no statistical difference between the groups. The variability within the groups was not homogeneous with one group 4 (GSK 2) animal presenting 74 lesions (Figure 9). There was no significant difference between group 3 (28-day terminal blood sample) and group 4 (28-day, repeat blood samples) for the total number of lesions, the total lesion area, or the total necrotic area.
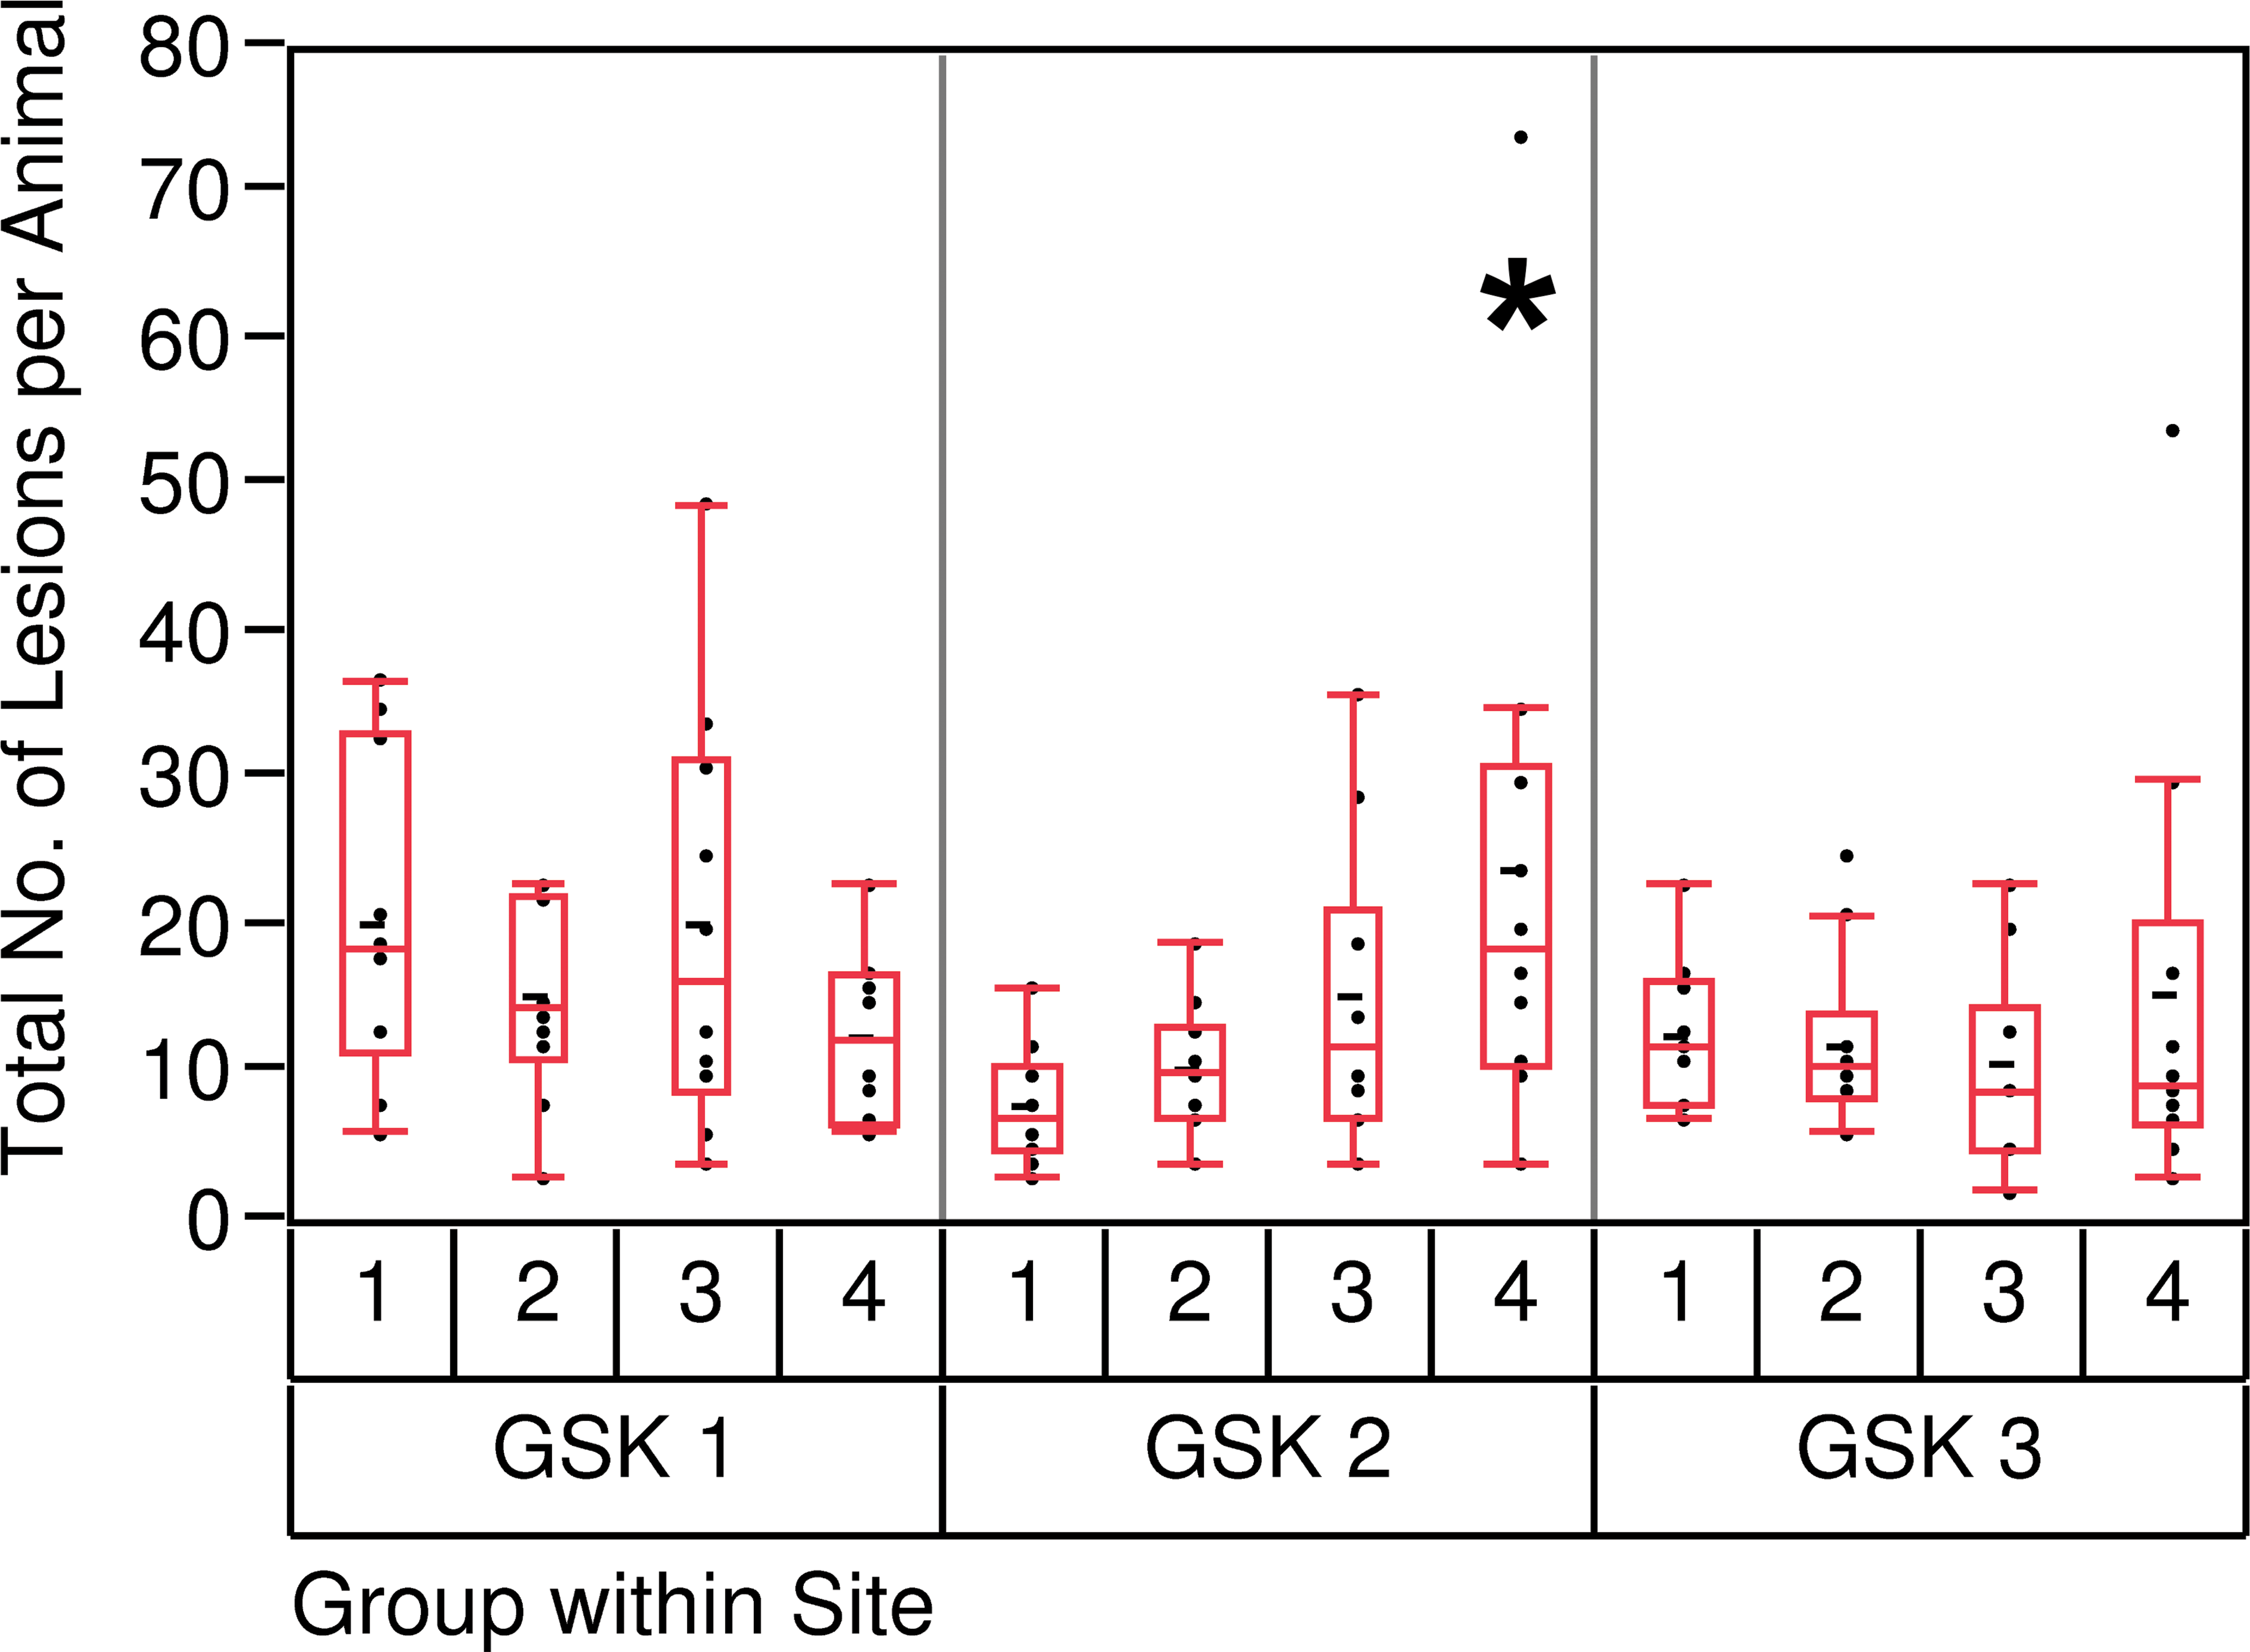
Total number of lesions per animal (10 slides), intergroup comparison. *Adjusted p value < .05 when compared to group 1 (day 7).
With the exception of study GSK 2 at 7 days (group 1), there was no statistical difference in total number of lesions observed per animal between the 3 GSK site studies (Figure 10)
Total number of lesions per animal (10 slides), intersite comparison. *Adjusted p value < .01 when compared to GSK 1.
Severity of the injury was represented by total lesion area for an animal, again summed over all sections. Statistical analysis required logarithmic transformation of the total area to meet equal variance assumptions (Figures 11 and 12). The only significant signal was observed for group 4 (GSK2) when compared to the group 1 (Figure 11).
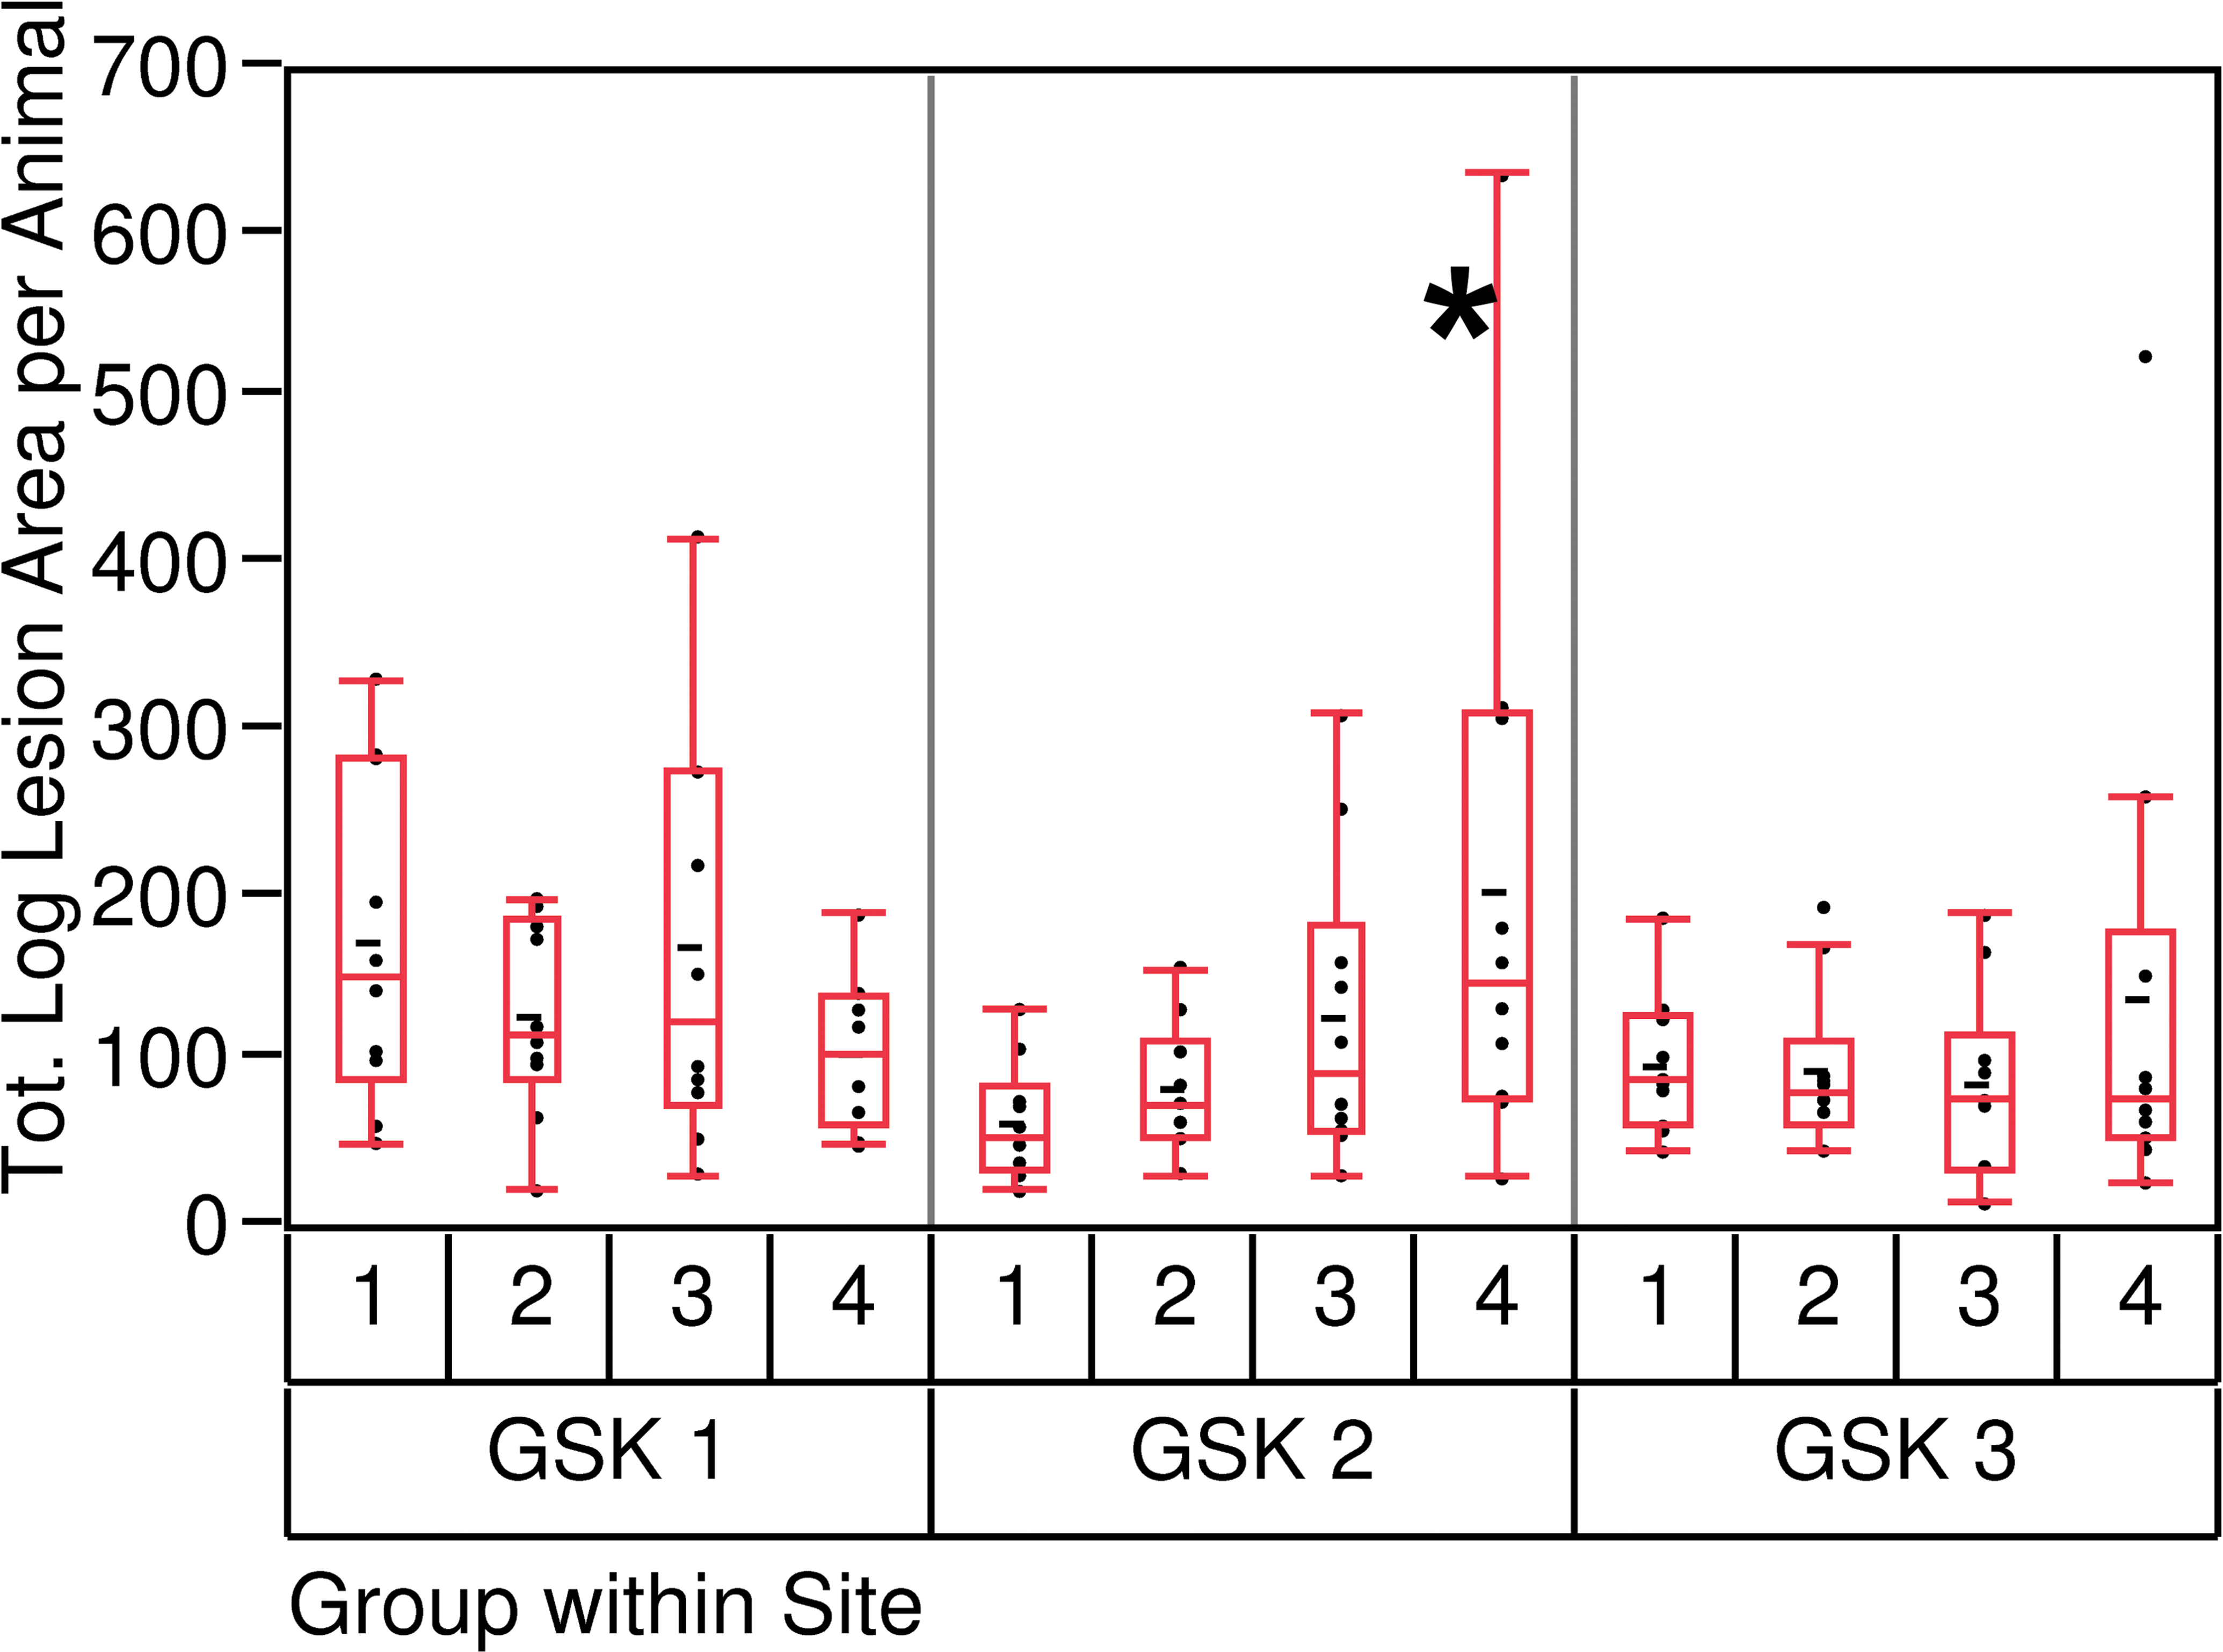
Total log lesion area per animal (10 slides), intergroup comparison. *Adjusted p value < .05 when compared to group 1 (day 7).
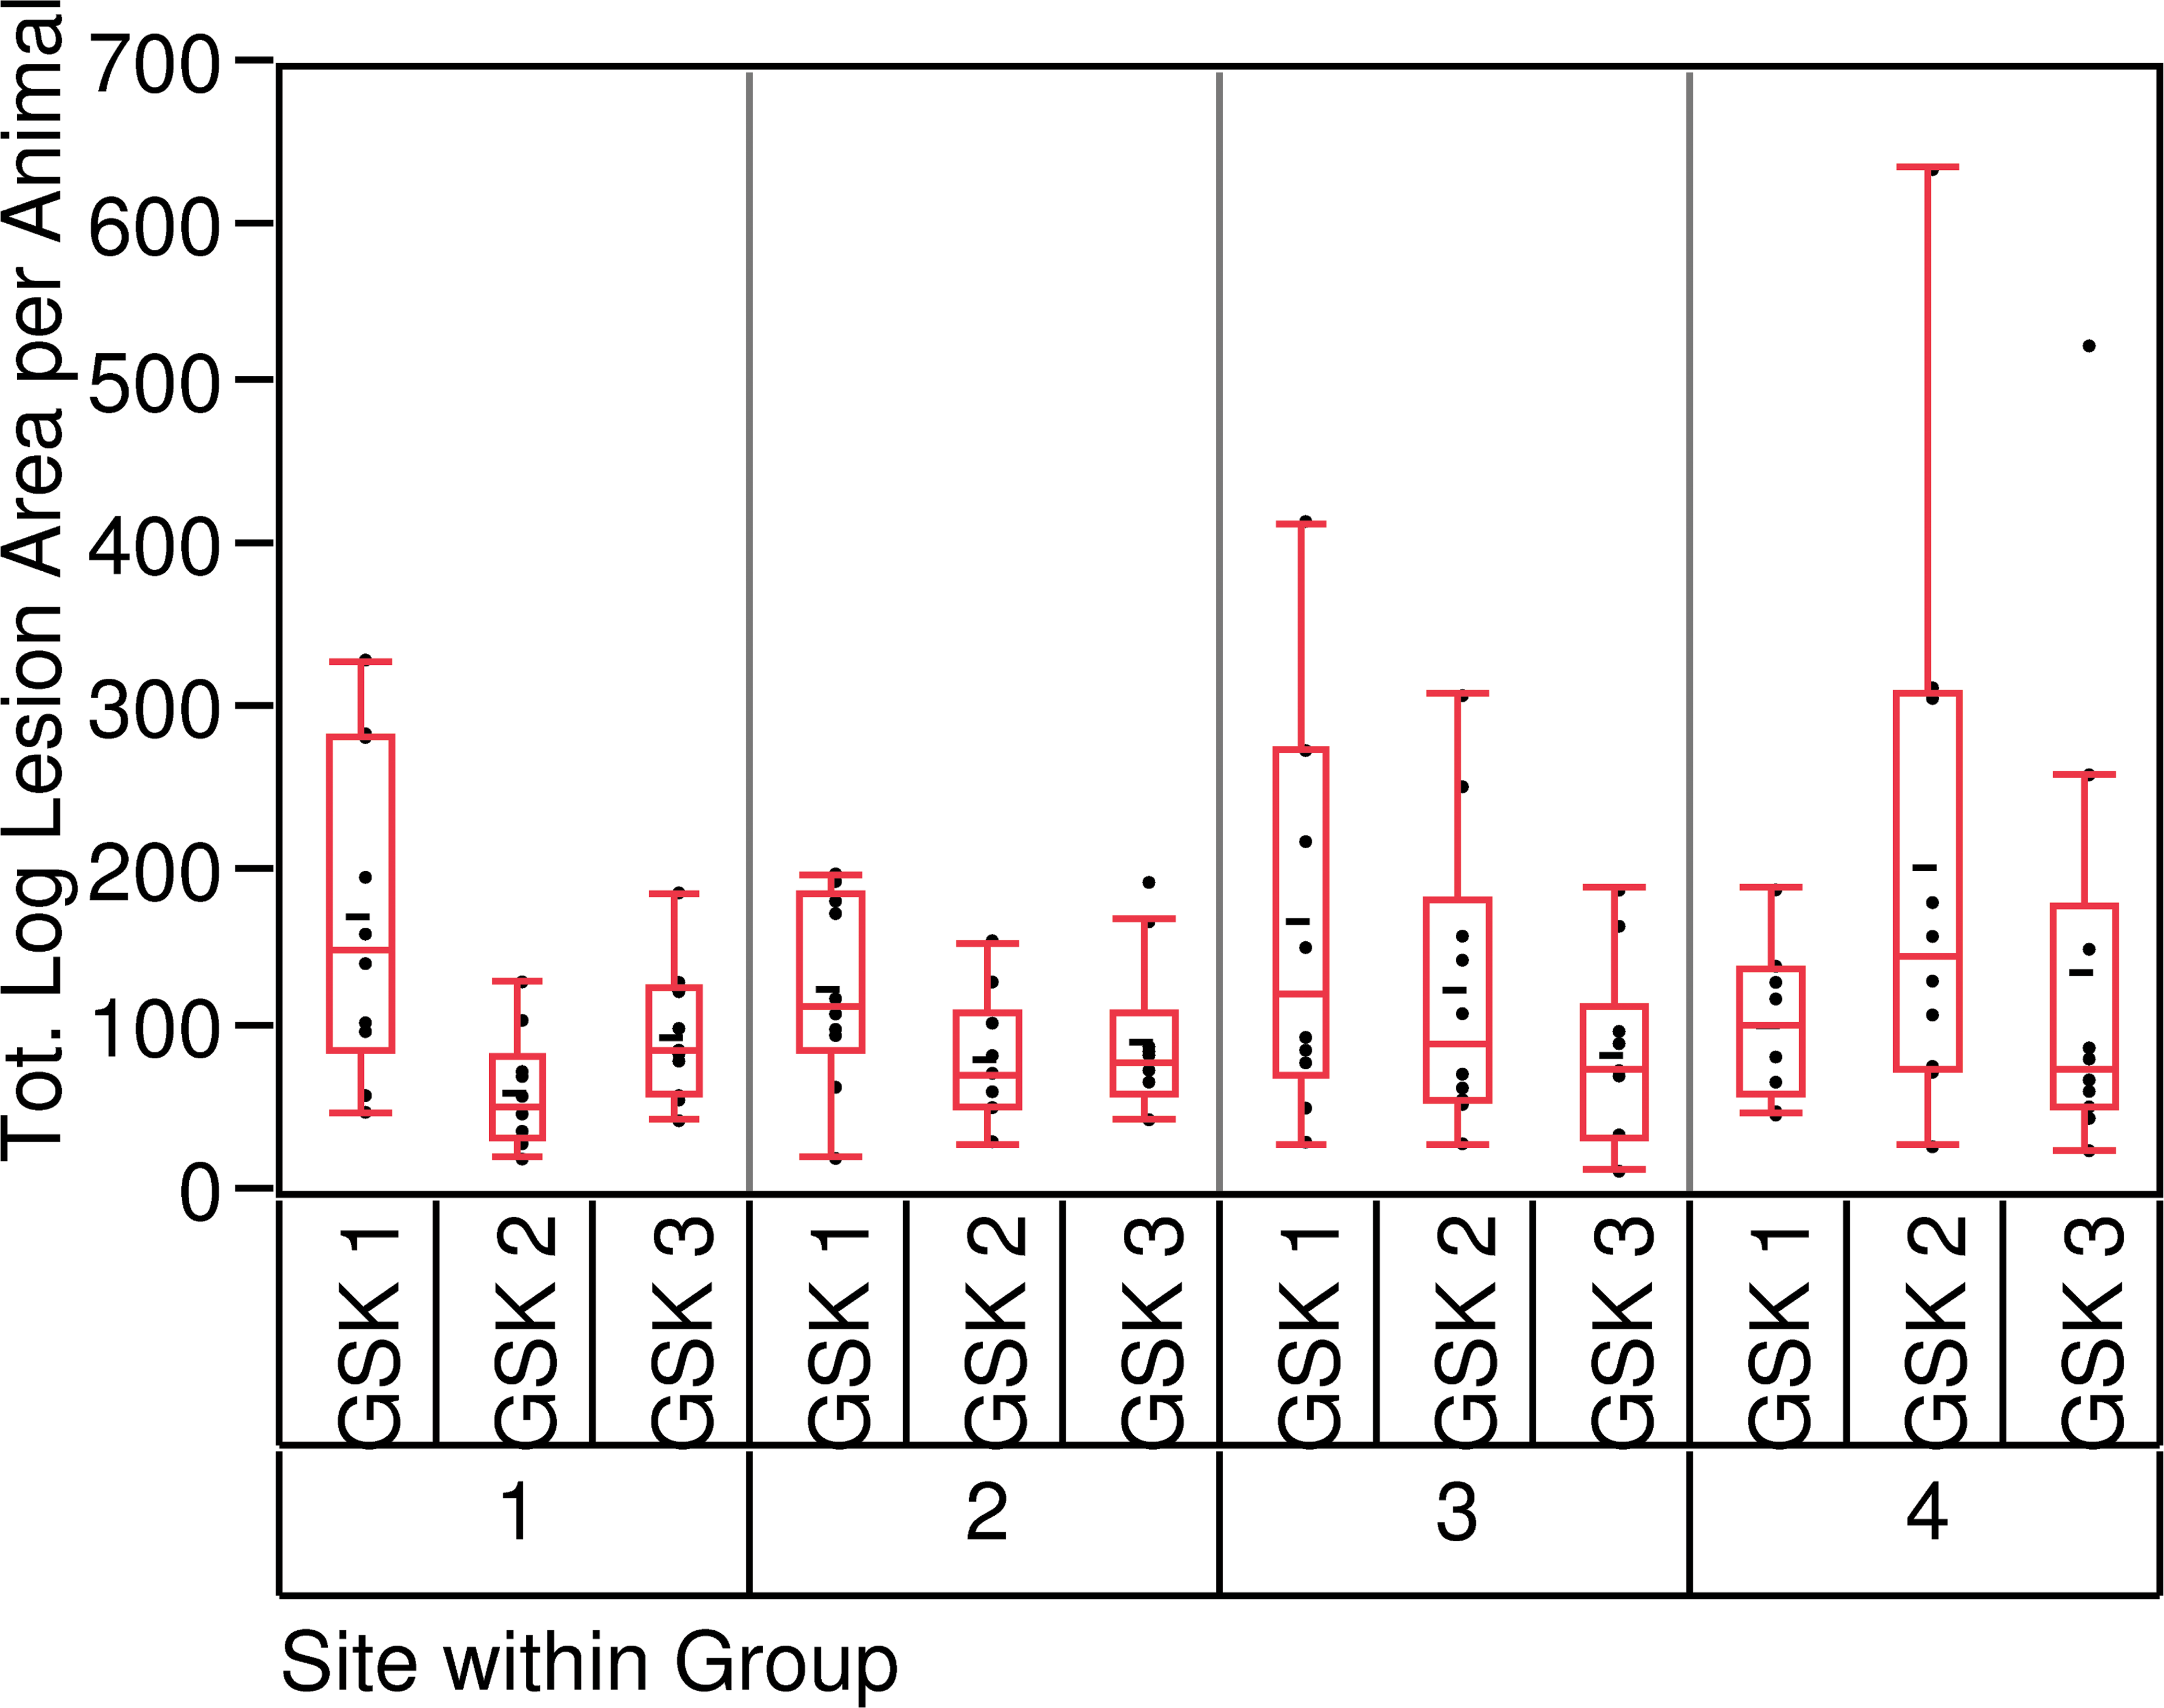
Total log lesion area per animal (10 slides), intersite comparison.
There was no difference between the 3 GSK sites (Figure 12) when comparing within group.
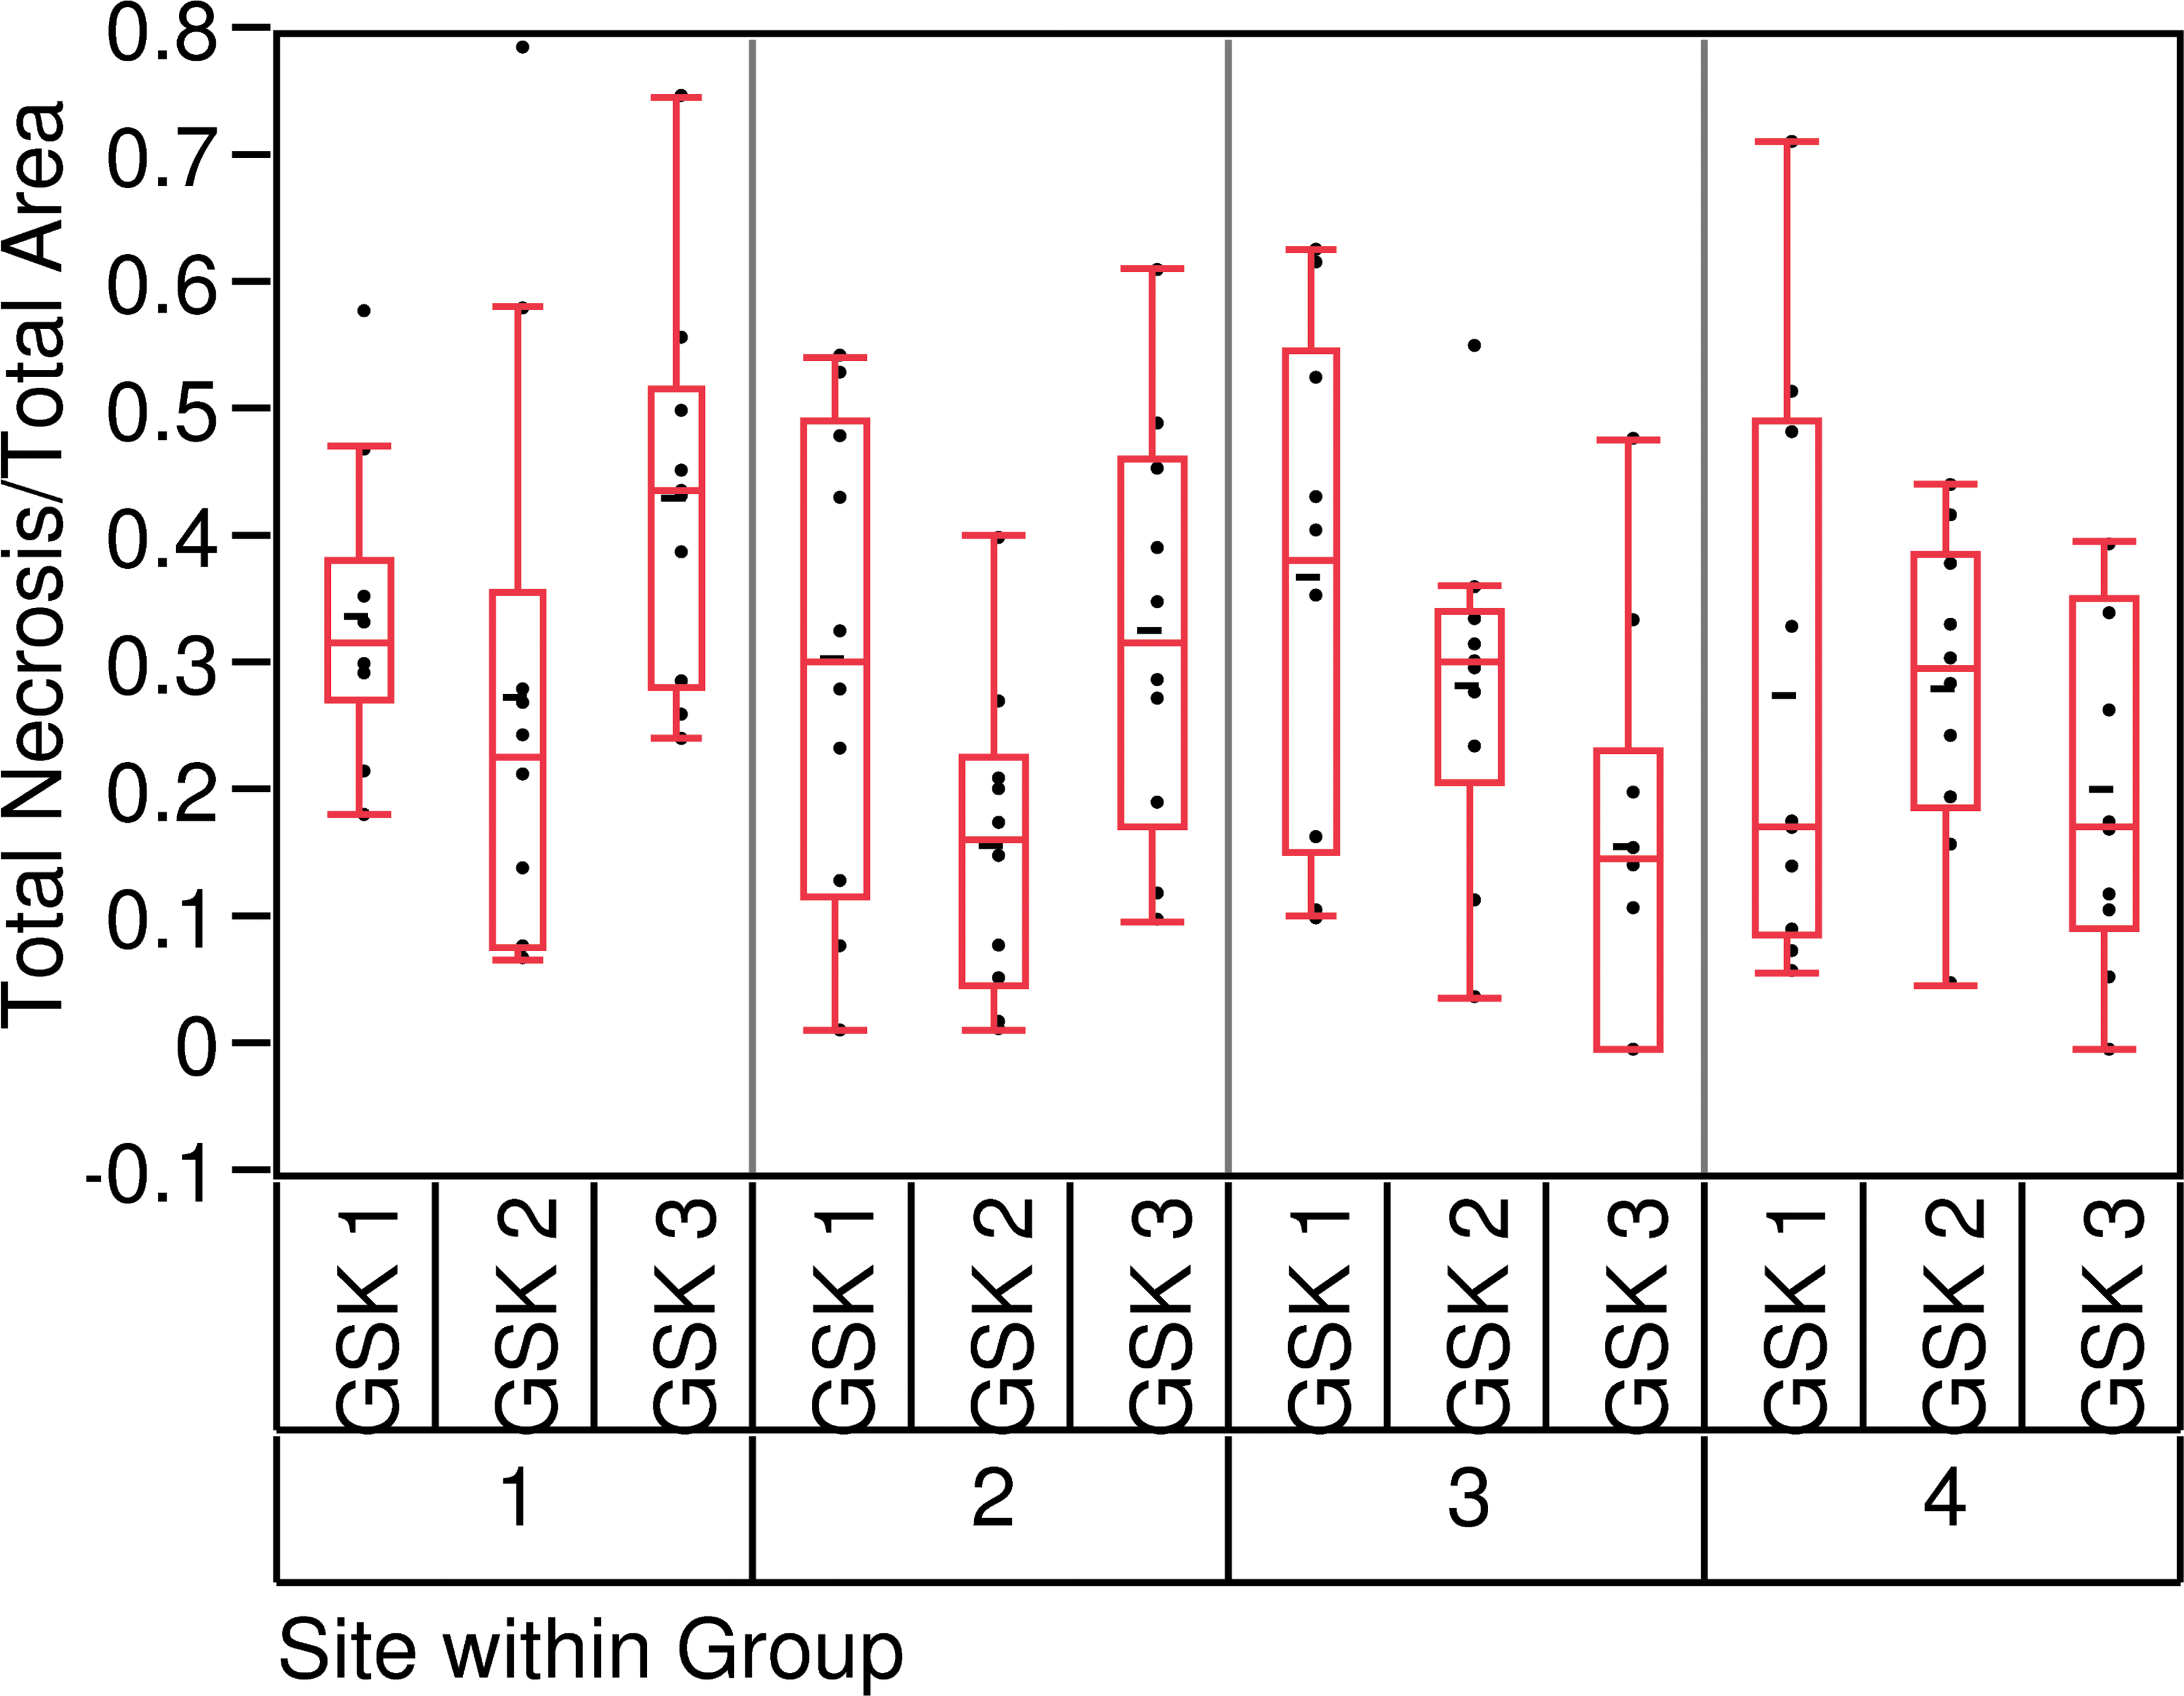
We then analyzed the potential differences in the relative total necrotic size (total necrotic size/total lesion area) between the groups and between the GSK sites (Figures 13 and 14). Except for GSK3, group 3, there was no statistical difference between the 4 groups or between the 3 sites, indicating that the relative proportion of acute necrotic myofibers was similar throughout the studies.
Hypothesis 5: PCM lesions are most common in the left ventricular, subendocardial, and apical regions of the heart.
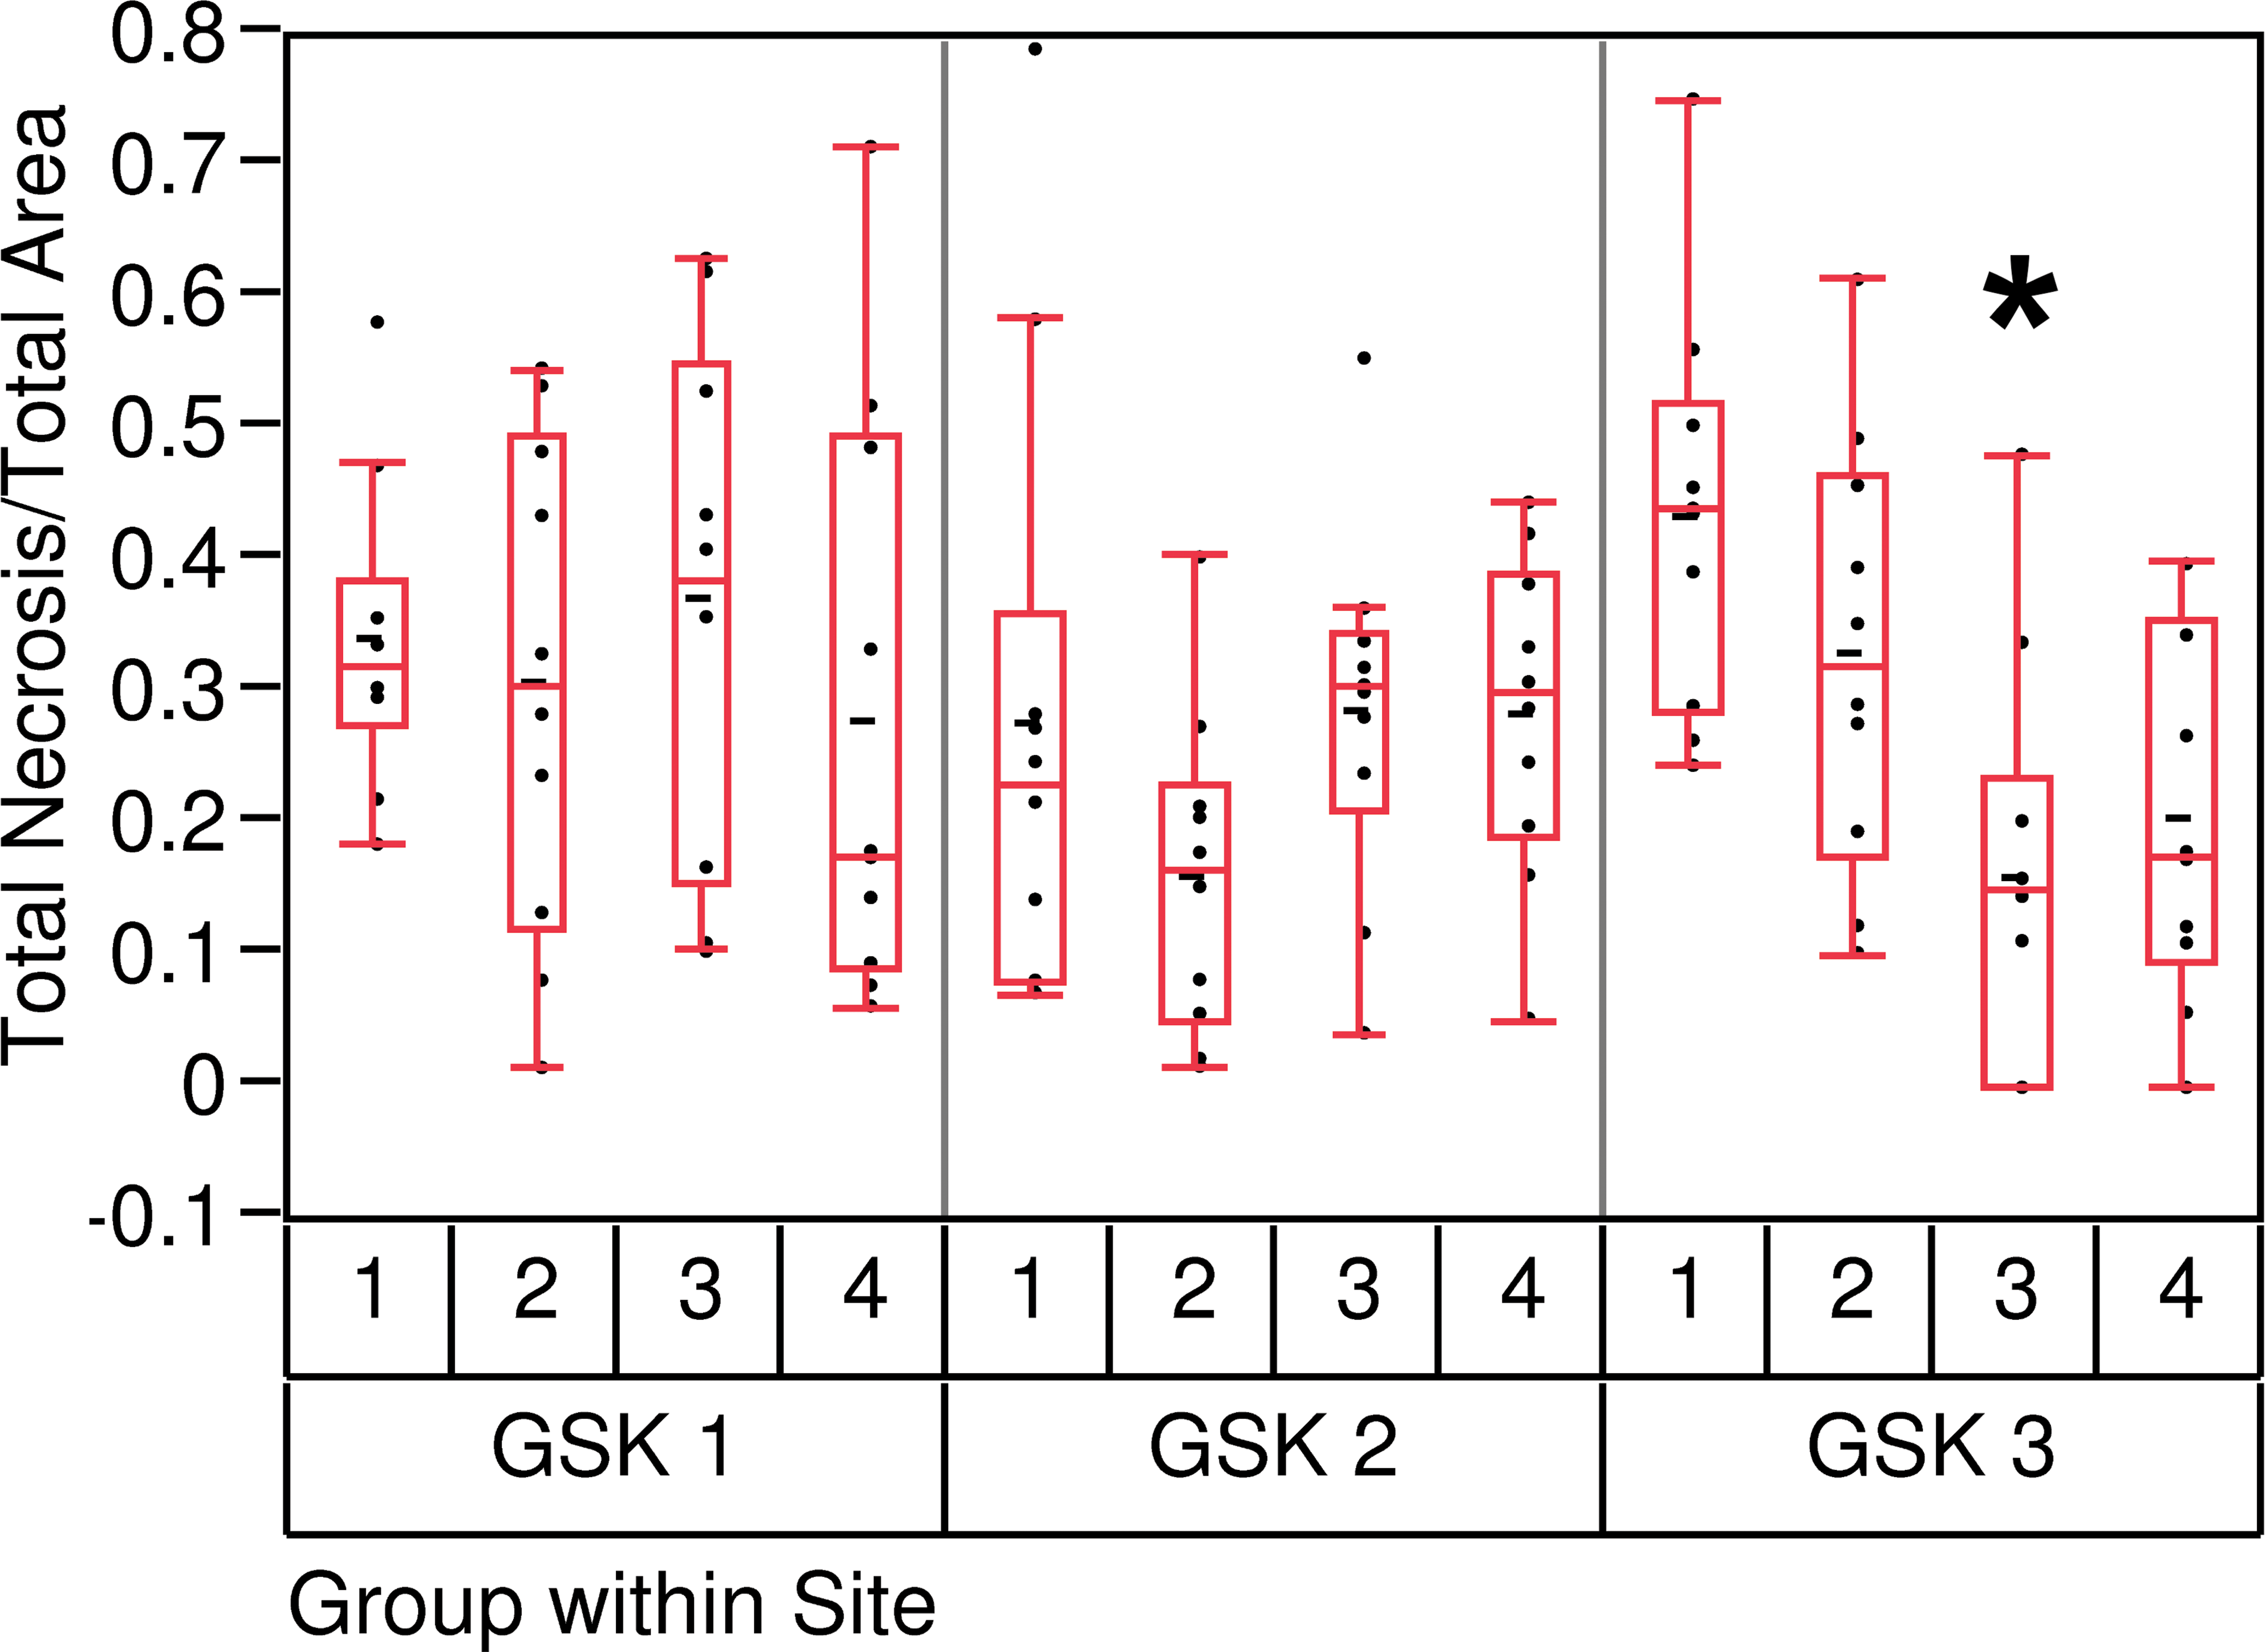
Total necrotic focus size per animal/total lesion area per animal (10 slides), intergroup comparison. *Adjusted p value < .05 when compared to group 1 (day 7).
Total necrotic focus size per animal/total lesion area per animal (10 slides), intersite comparison.
To determine the most commonly affected regions of the heart in our study, all the data from all GSK sites were combined. Evaluation of the occurrence of the first locator per group showed no difference between the 4 groups (data not shown), thus grouped data are presented (Figure 15).
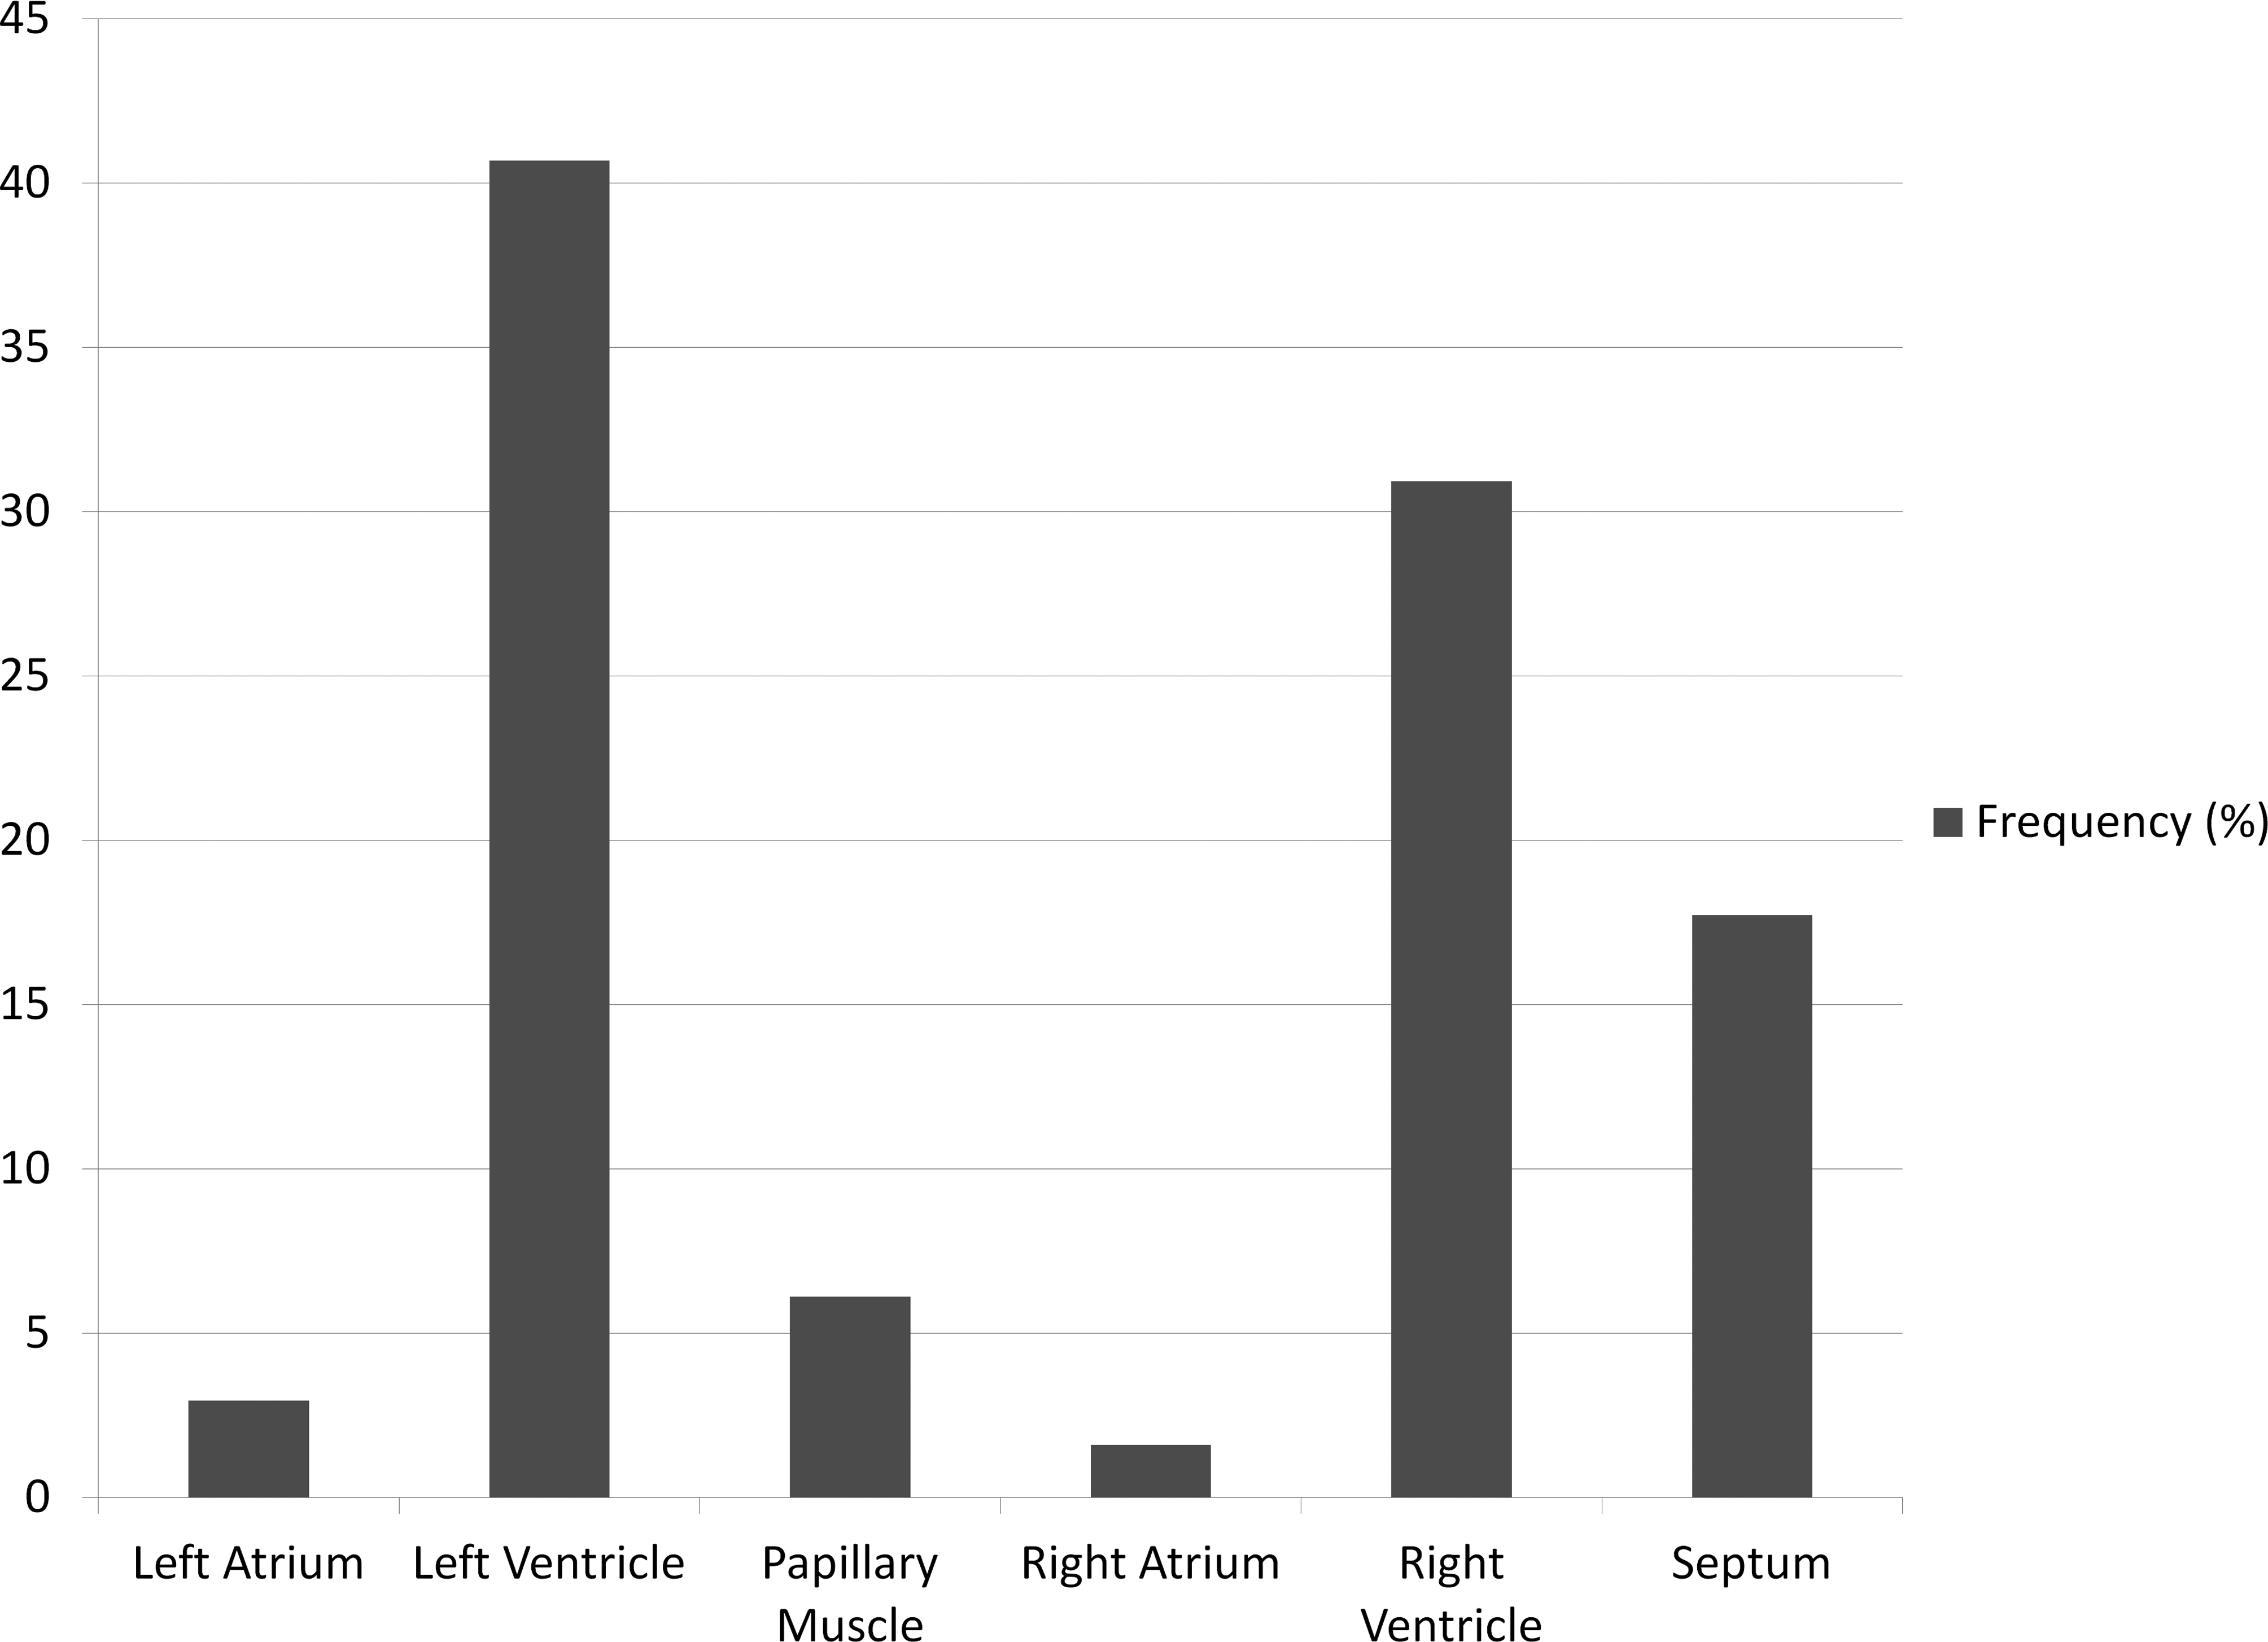
Locator 1 frequency over all sites and all groups combined. Percentage of occurrence of the primary locator.
The primarily affected tissue location in every group was the left ventricle (41%). It was followed by the right ventricle (31%) and the septum (18%). Atria and papillary muscles were marginally affected (5% and 6%, respectively).
The same breakdown was performed for the second locator (myocardial, subendocardial, or subepicardial). A lesion was considered “subendocardial” or “subepicardial” only if a part or the entire lesion was in contact with the endocardium or epicardium, respectively (Figure 16). The 4 groups presented a similar profile (data not shown) and thus grouped data are presented (Figure 17). The lesions were most frequently observed in the myocardium (83%).
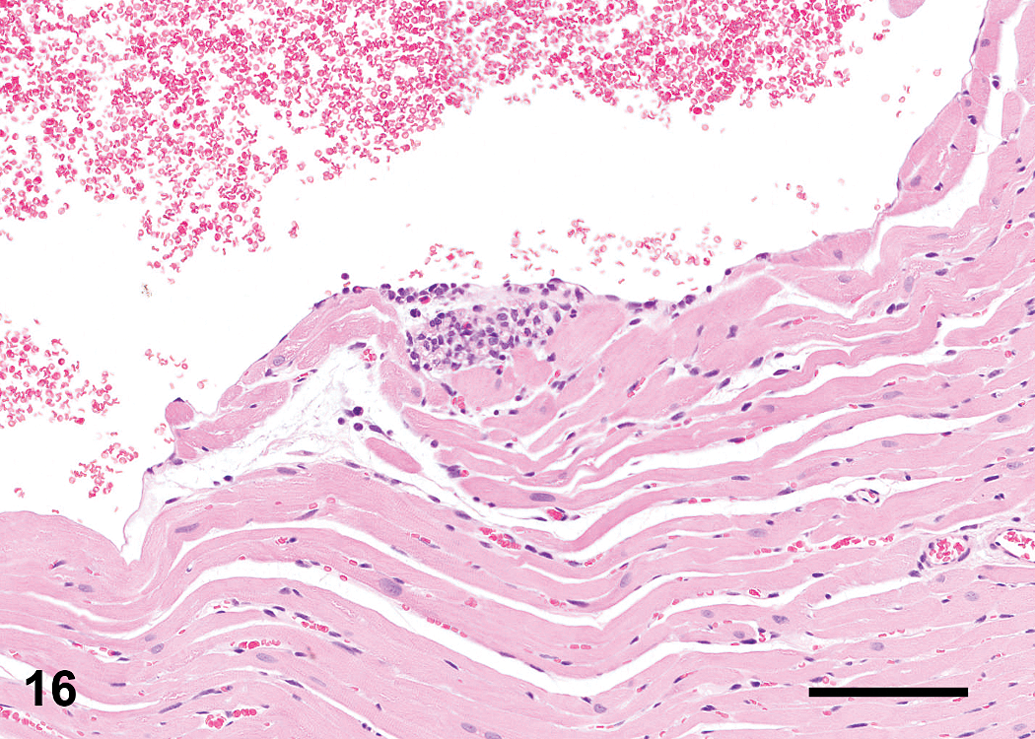
Lesion mainly inflammatory in nature. Representative of a subendothelial lesion (bar: 100 μm).
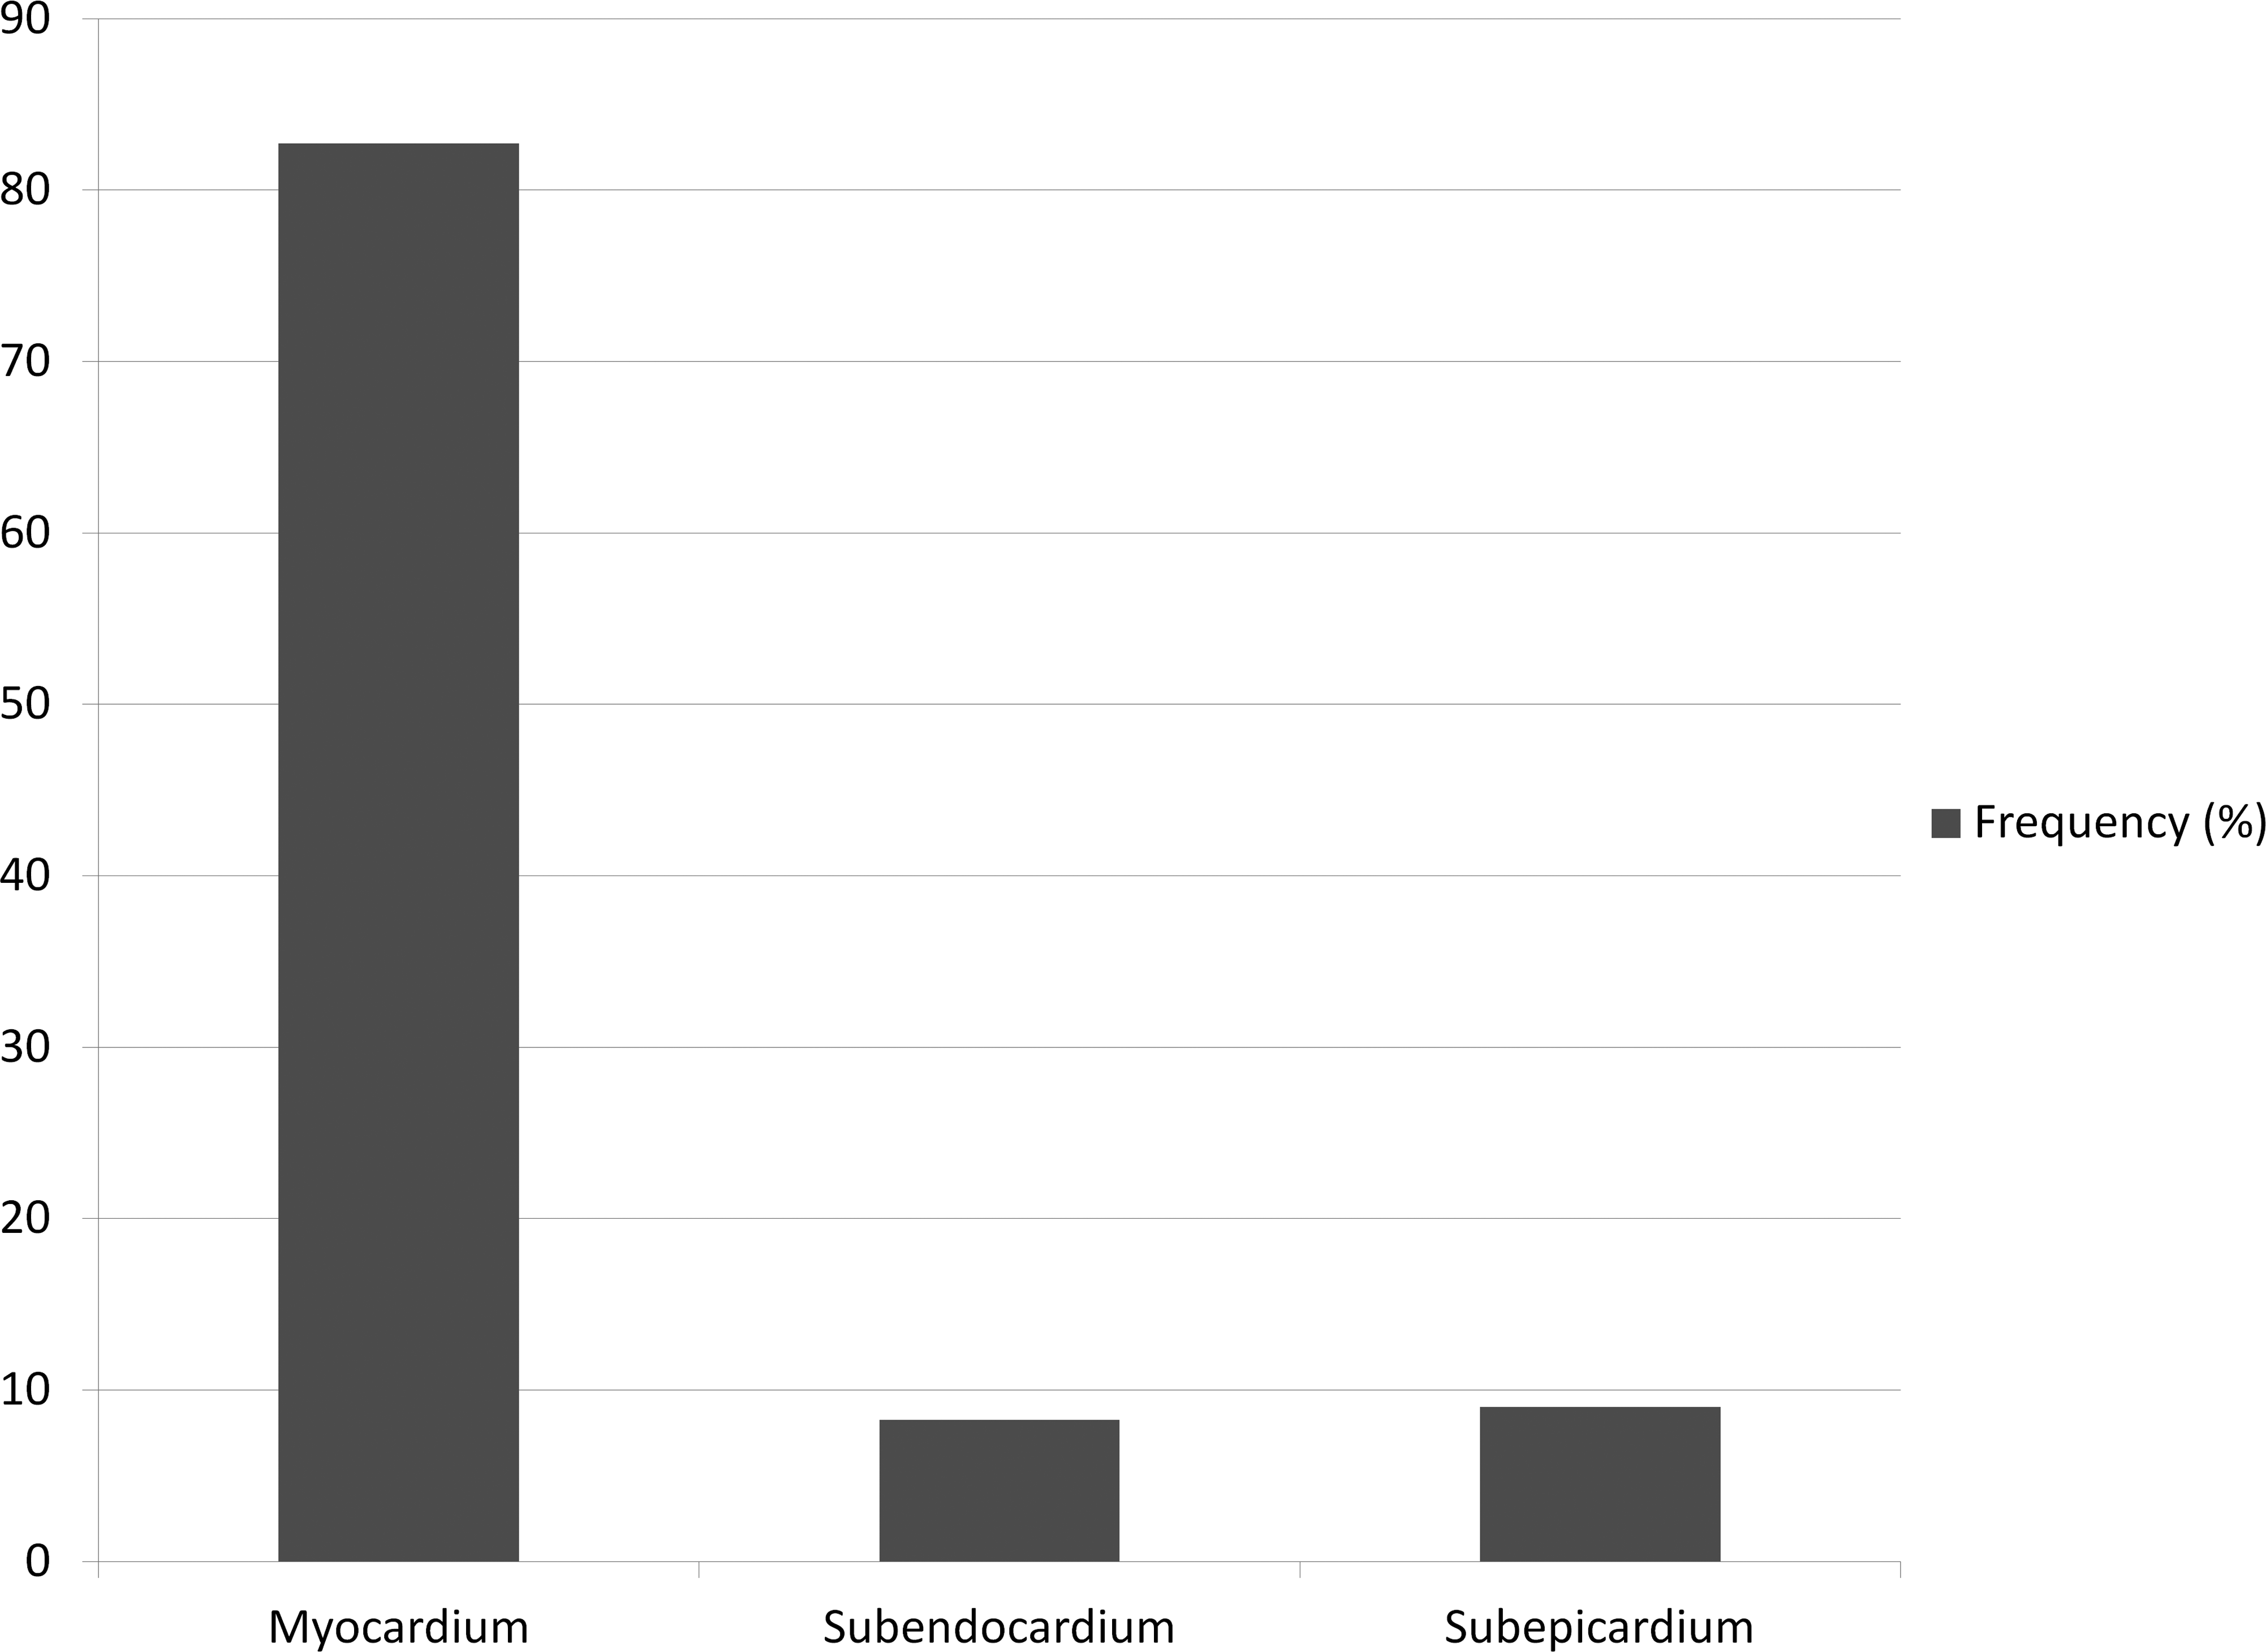
Locator 2 frequency over all sites and all groups combined, percentage of occurrence of the secondary locator.
Finally, the lesions were most commonly seen (73%) in the mid region of the heart (Figure 18).
Hypothesis 6: The detectable level of serum cTnI correlates with the incidence and/or size of “acute” necrotic area.
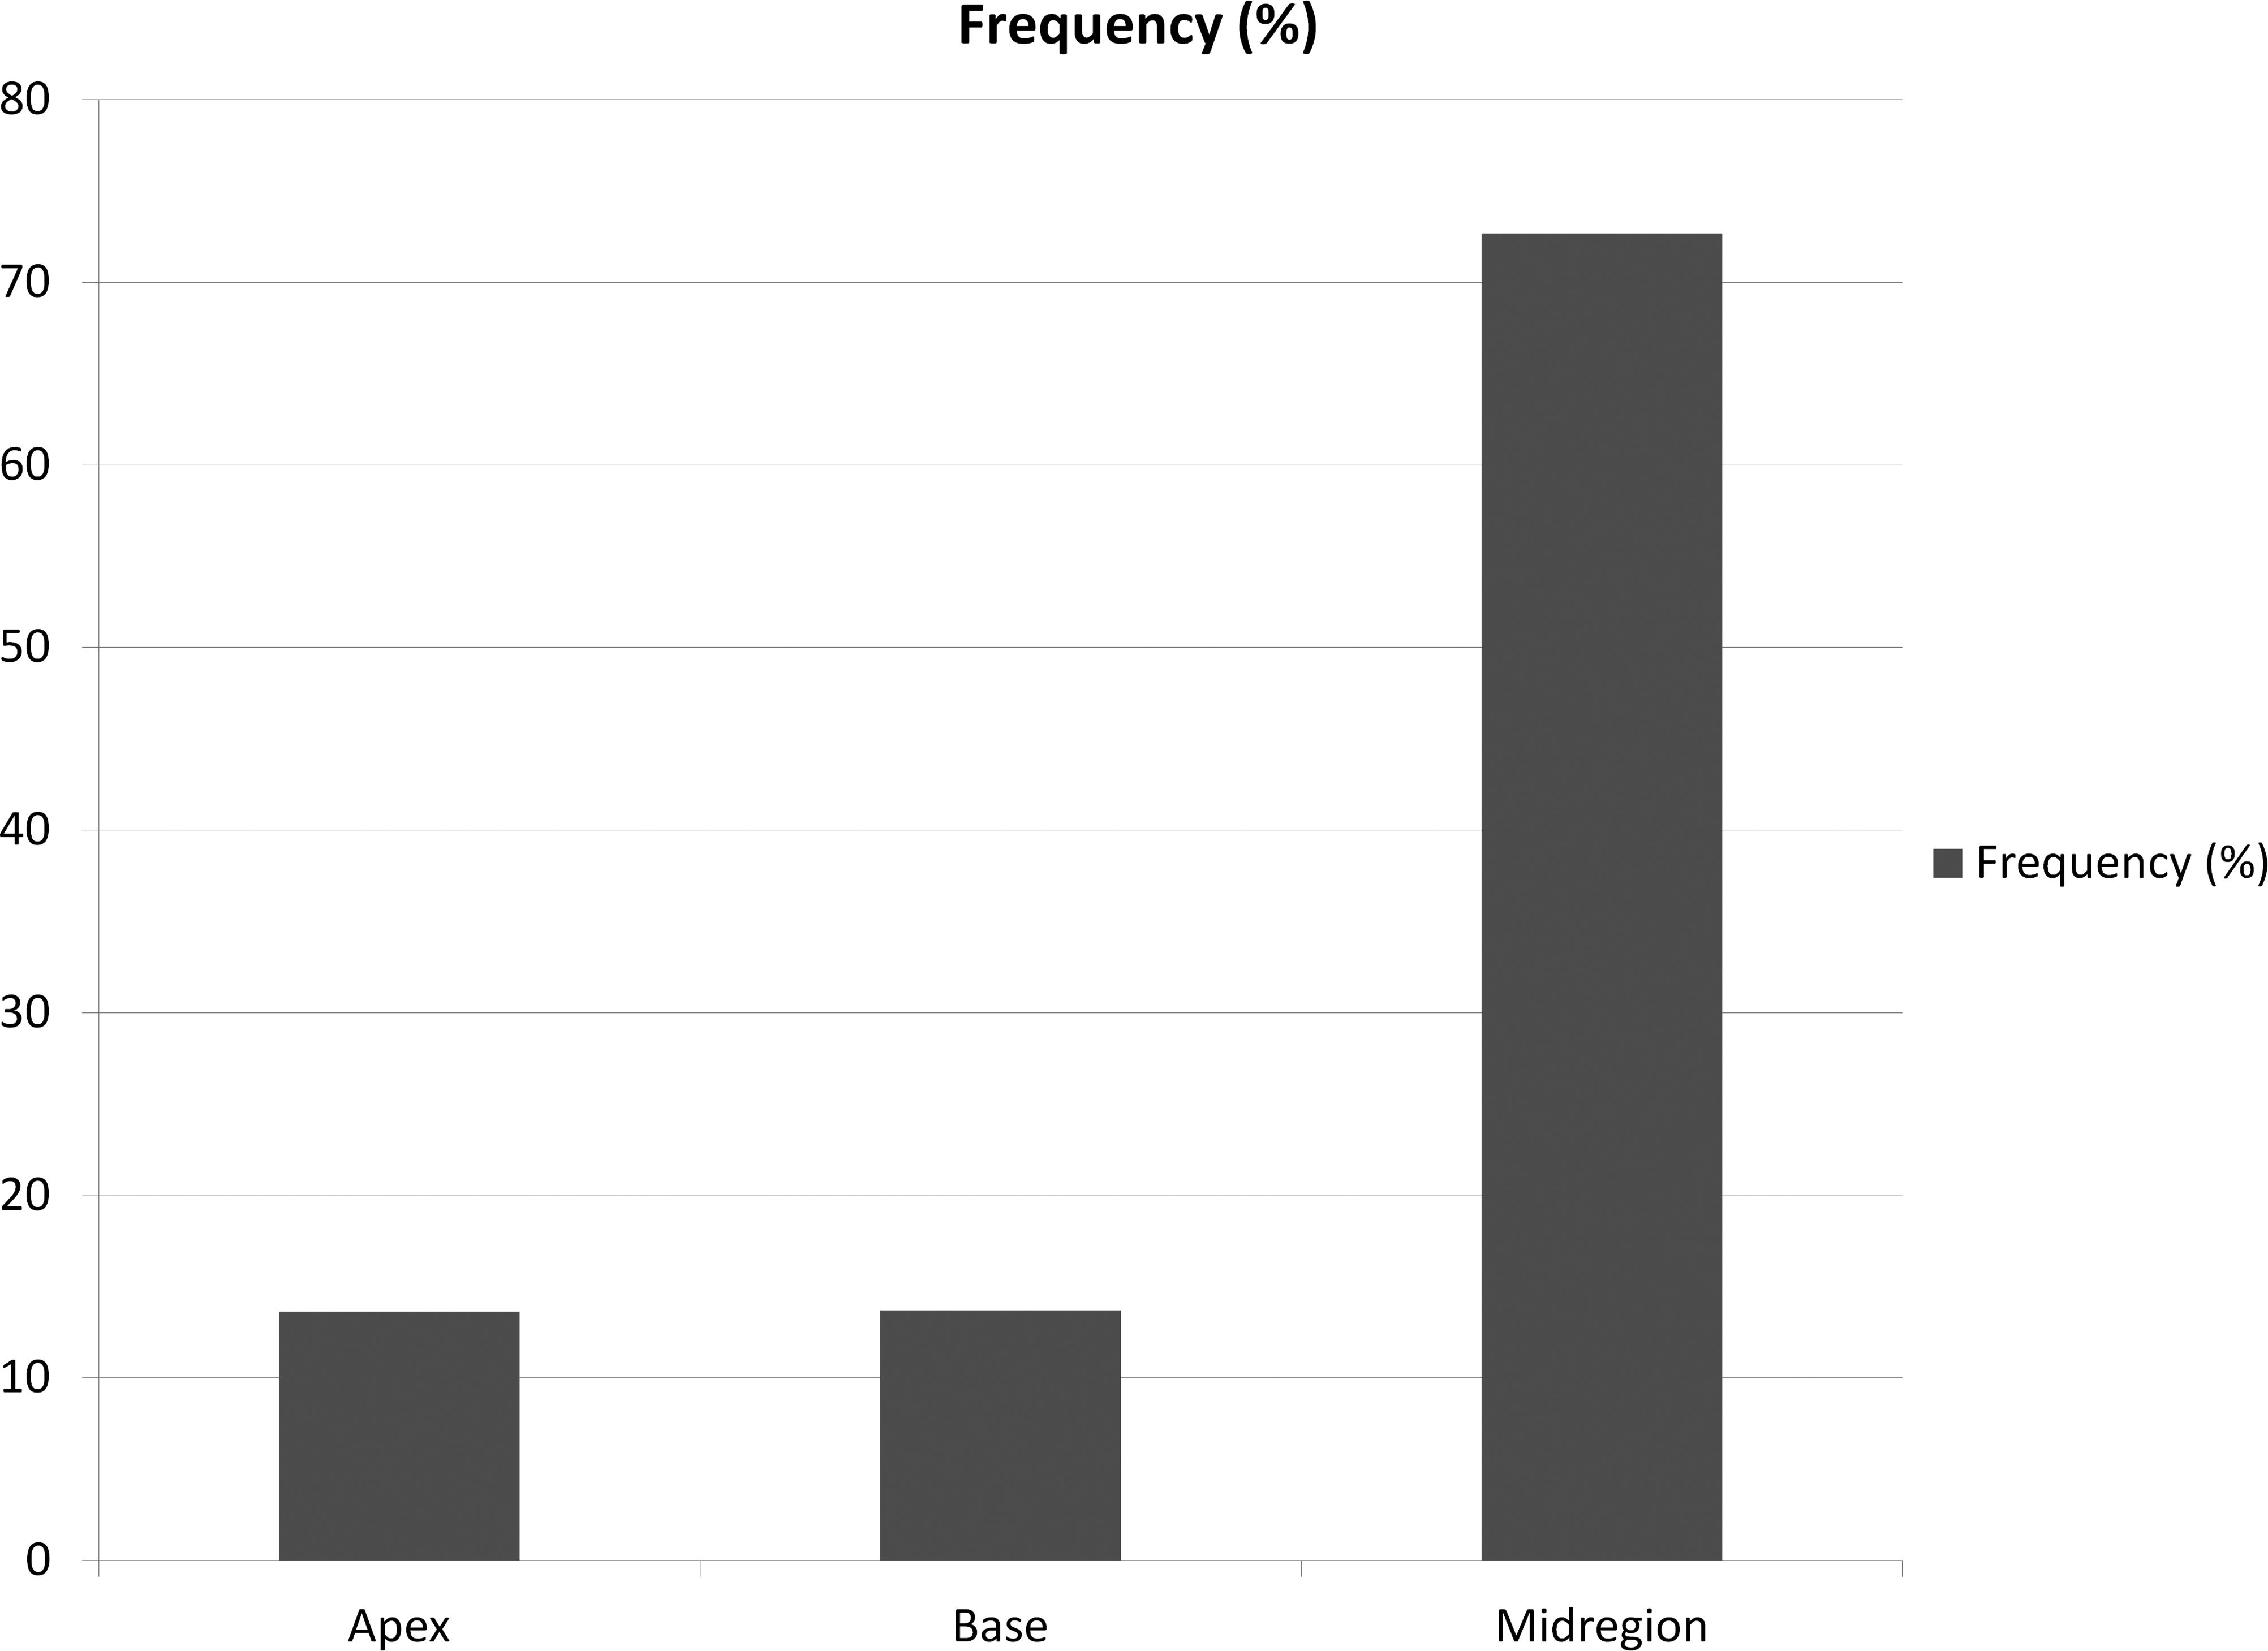
Locator 3 frequency over all sites and all groups combined, percentage of occurrence of the third locator.
The cTnI levels were generally quite variable within one site or within one particular group (Figure 19). GSK 1 tended to have the most variable data. The animals from group 4 (repeat blood sampling) tended to have (for GSK 1 and GSK 2) the most variable cTnI levels in the terminal blood sample. The interim cTnI levels from the same group 4 animals (22-day, tail vein sampling) showed less variability.
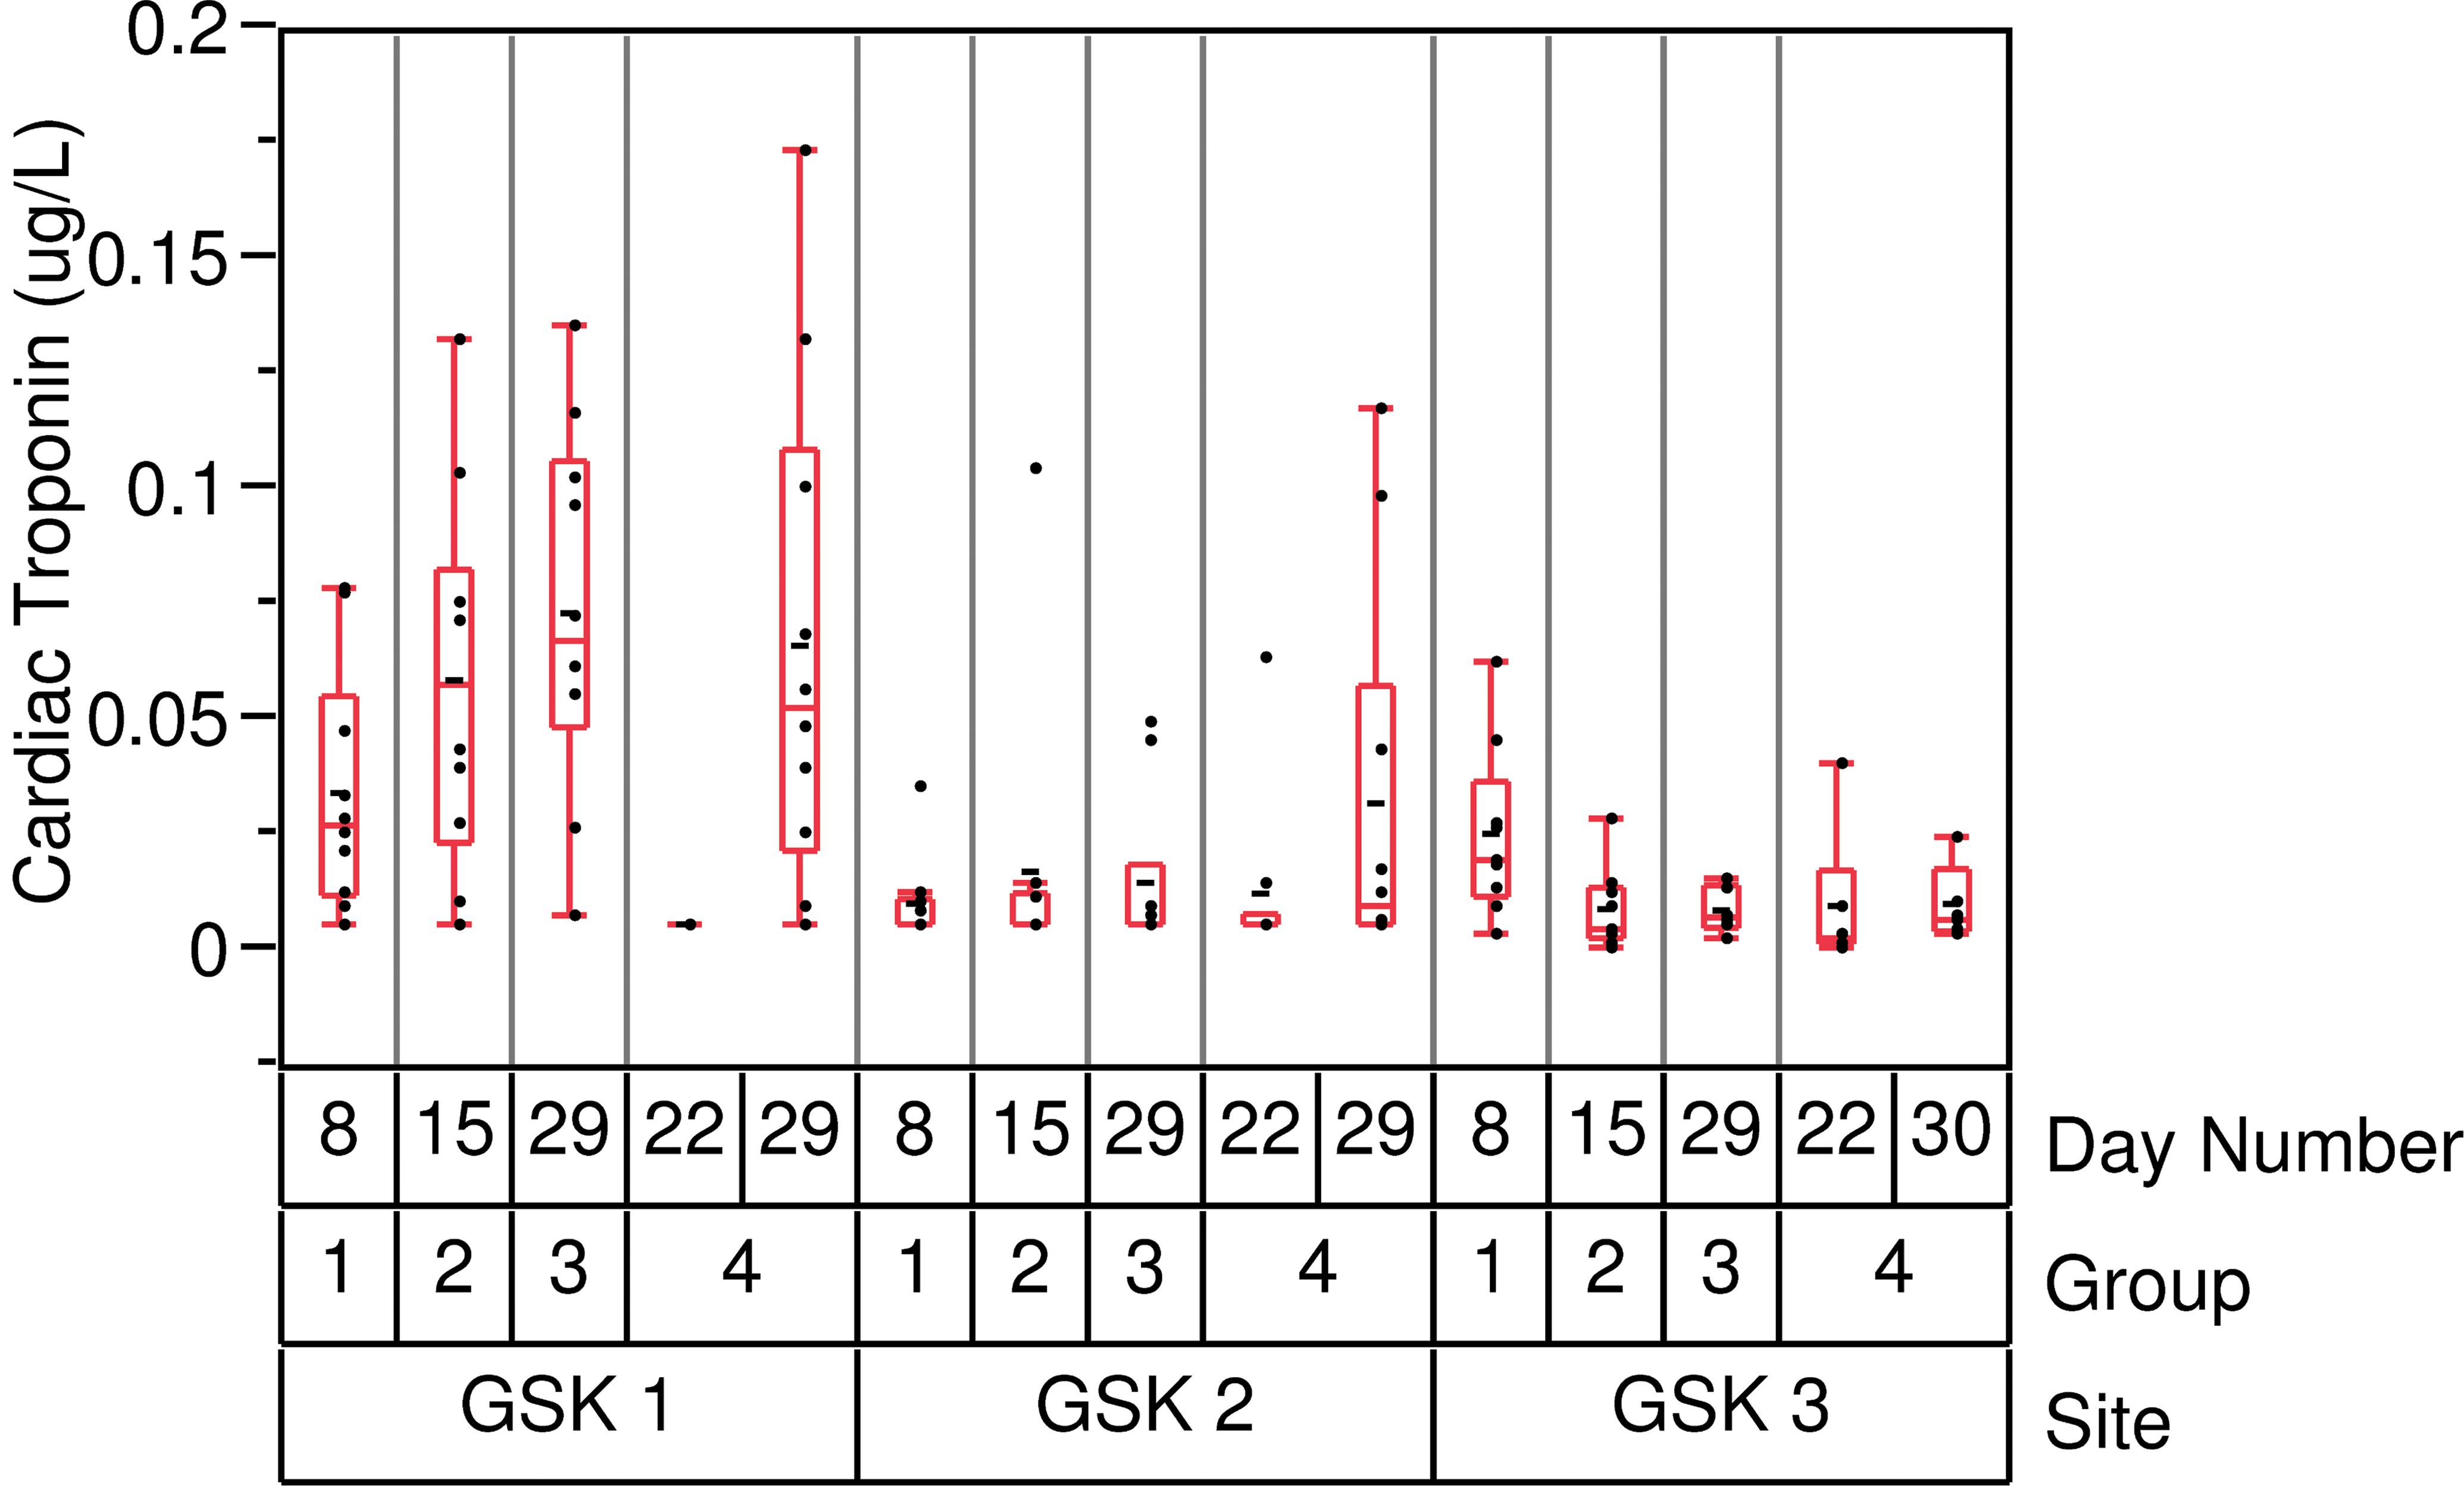
Boxplot of the cardiac troponin I levels.
In these studies, no correlation was found between the necrotic area and the cTnI levels. Even when combining all the data together (and then with the caveat of the different duration and locations) no correlation was found.
Discussion
Rodent PCM is a well-known entity in the context of nonclinical regulatory toxicity studies. The majority of rodent toxicologic pathology literature conveys this finding as an issue for rats in longer term studies (older rats); however, prevalence of this spontaneous disease in young rats is potentially confounding for shorter duration nonclinical toxicology studies which support first in human trials. This multisite study was conducted to address characteristics of the change in young rats, spatial distribution within the heart, biological variance, potential influence of study designs with different durations and environmental factors, and to investigate correlative relationships to serum cTn levels.
The common literature refers to PCM with different terminology such as degeneration/necrosis, inflammatory cell infiltrate, mononuclear cell infiltrate, or cardiomyopathy. Because it is a typically progressive change, all these terms are accurate at some point in the development of the lesion (Jokinen et al. 2011; Greaves 2011). This cardiomyopathy classically starts with focal necrosis of individual/isolated cardiomyocytes, followed by an inflammatory cell infiltration (may be mixed in nature in the early stage then mainly mononuclear). The end stage of the lesion could result in fibrosis for the larger degenerated foci.
It should be noted that in human medicine, and although cardiomyopathy literally means “cardiac muscle disease,” this term is mostly reserved for severe diseases that lead to heart failure (Aldeman 2010).
The variety of the terminology, the ambiguity of the term, the lack of harmonization within the industry, and the confusion of the term cardiomyopathy can induce with respect to human disease can result in regulatory questions. The future publication from the cardiovascular system working group for the International Harmonization of Nomenclature and Diagnostic Criteria for Lesions in Rats and Mice should help reduce interlaboratory variability in terminology.
In our multisite study, the most common primary morphologic diagnosis was inflammatory cell infiltrate followed by degeneration/necrosis (together accounting for 91% of the lesions). If we consider the primary and secondary diagnoses, the most common change was a combination of terms (representing 58% of all lesions), inflammatory cell infiltrate, and degeneration/necrosis, irrespective of the necrosis proportion (necrosis was always diagnosed in combination with inflammatory cell infiltrate). We therefore proposed and implemented the term necrosis/inflammatory cell infiltrate (NICI) for use in GSK internal toxicology studies. This combined term reflects the biological progression and captures the morphological spectrum of PCM. Predominantly fibrotic lesions are far less common, and diagnosed separately at GSK.
This change (i.e., NICI) proved to be present in every single animal in our study. To get this incidence of 100%, we used a step-sectioning approach and produced 10 slides at a 300-µm interval. In all groups of 10 animals, there was sufficient representation of NICI in the standard section across the dose group (range 5–9, average 7.16, 72% of all standard sections were representative). We also identified positive correlation between the total lesion area in 10 slides with the lesion area in the standard section and lesions present in the standard section were not different in character than those seen in step sections. Variable expression of background or incidental disease, like PCM in SD rats is a fairly common observation in toxicologic pathology, and modest group size in standard study designs is commonly used to manage these variable effects. The standard sectioning technique is considered adequate for routine toxicologic studies. This particularly high incidence, together with other factors, prompted GSK to change the rat strain used in routine toxicity study from the Sprague-Dawley to the Han Wistar.
The total number of lesions per animal tended to show some interindividual variability. Some animals considered to be outliers had up to 74 lesions on the 10 sections. Generally, all 3 GSK site studies were comparable. The only observed statistical difference was observed between GSK2 to GSK1 for group 1 (7 days).
Within a particular site, there was no clear difference between the groups. The only observed statistical difference was observed for GSK2 when comparing group 4 (the 28-day repeat-sample group) to group 1 (the 7-day group). One animal belonging to group 4 (the 28-day repeat-sample group) presented the highest number of lesions (74) of this whole study. However, when removing this outlier, the statistical analysis results did not change. Understanding the source of the variability was challenging as multiple components can have an impact (variations in animal source, testing facility practices, pathologist, variability in response between animals, the number of intervention procedures within a study, etc.). In this study, we tried to minimize as much as possible the variability by following the same protocol, by using similar materials and procedure, by creating specific selection and sectioning patterns, and by using histopathology methods that were standardized for preset criteria. The authors thus believe that the majority of the variability came from a biological component (interanimal variability).
No difference could be seen between the two 28-day groups (groups 3 and 4) indicating that in this study the number of in-life blood samplings (and associated handling and anaesthesia) did not have an effect on the NICI numbers or size (incidence or severity). The degree of handling for these investigative studies models that employed in standard regulatory toxicology designs, thus we conclude that stress associated with routine handling did not have any impact on the incidence or severity of PCM in these rats.
In this study, the lesions were found predominantly in the left and right ventricle, and to a lesser extent in the septum. Interestingly, the papillary muscles were rarely affected. The lesions were mostly myocardial (without any contact with either the endocardium or the epicardium) and largely located in the mid region of the heart. This is somewhat different to what was described by Ruben et al. (2000), who reported that the apex was a site of predilection. Below the fibrous ring, the papillary muscles and the free wall of the left ventricle were also mentioned. In our study, the base of the heart (below the fibrous ring) and the apex were marginally affected. The locations of the cardiomyopathy that Jokinen et al. (2011) reported in a retrospective study with F344 rats were comparable to ours with a slightly different order as in their review the septum was more affected than the right ventricle. The differences observed between our study, Jokinen et al., and Ruben et al. could partly be attributed to the extensive slide review performed, and by the highly standardized approach used in this study for the main areas (base, mid region, apex, see Figure 1) and the sublocators (i.e., if a lesion was not in contact with the endocardium, the sublocator was classified as myocardial) for consistency purposes and intersite comparison.
The cTnI levels were variable in this study and, for GSK site 2 and 3, usually within the published normal range of 0.02 µg/l to 0.15 µg/l (Herman 2011; Schultze 2009, 2011; Wallace 2004) and within the internal historical range. No correlation was discernible between the cTnI levels and the total necrotic area. This is likely to be due in part to the low levels of circulating troponin I observed, to the age of the lesions, and to the limitations of the histopathologic evaluation (observation of a sample of sections believed to be representative of the whole heart). Even though some were clearly necrotic in nature and acute, the cTnI peak was probably reached before the terminal blood sampling. Usually there was no difference in the cTnI results between groups 3 and 4, indicating that in this study the number of in-life blood sampling (and associated handling and anesthesia) did not have an effect on the cTnI levels. This would be in agreement with the study performed by Schultze et al. (2009), where saline gavage did not produce statistically significant cTnI changes using an ultrasensitive assay.
The data from GSK 1 showed slightly higher cTnI levels (though no statistical difference was observed between the sites). When comparing cTnI levels from the two 28-day groups (groups 3 and 4) for this site study, the higher cTnI levels observed may be due to the terminal procedures, notably duration of anesthesia, and blood sampling location (i.e., tail vein during the course of the study and abdominal vena cava for the terminal sample). The contribution of these potential effects requires further investigation.
Drug-induced cardiac pathology can be confounding and have a picture similar to changes seen in control animals. This is particularly true with test article–related myocardial necrosis which can look like the background NICI. The difficulty to differentiate between the two, described by Jokinen et al. (2011) for the F344 rat, can be lowered by building up a strong knowledge of background lesions and terminology harmonization. Features such as site of expression for the background disease, prevalence in males, and the absence of correlation between cTnI and NICI could help us build a weight of evidence when toxicology data show a pattern outside that seen with spontaneous disease (e.g., higher incidence or severity in treated groups, change in the relative proportion of the necrosis, fibrosis, or inflammatory cell infiltration). Additional techniques such as interim cTpI measures, gene expression analysis, and electron microscopy could also help the assessment.
An integrated approach using functional parameters (e.g., blood pressure, heart rate, electrocardiography, contractility, or echocardiography), clinical pathology (e.g., cTnI, CK, proANP/BNP), and morphologic pathology should always be used when dealing with test article–related cardiotoxicity.
Footnotes
The authors declared no potential conflicts of interest with respect to the research, authorship, and/or publication of this article.
The authors received no financial support for the research, authorship, and/or publication of this article.
Acknowledgments
The authors thank Beverly Maleef, John Bowles, Joanna Barton, Elizabeth McNeil, Barry Reed, and Karen Cartwright for their help during the method development and the images acquisition.