
Abstract
Although cardiac troponin T (cTnT) assays have been used to detect myocardial damage in horses, a cTnT assay has not been analytically validated, to our knowledge. The aims of this study were to estimate the precision of a high-sensitivity cTnT assay in horses and determine the effect of hemolysis on the measured cTnT concentration. Serum samples from horses were mixed in 3 different pools. Pool 1 consisted of samples from 3 healthy horses, pool 2 from 6 horses with heart failure or atypical myopathy, and pool 3 from 10 horses with atypical myopathy. The within- and between-run coefficients of variation were determined for each pool. Pools 2 and 3 were diluted to estimate linearity. To study the influence of sample hemolysis, serum was collected from 4 horses with a high cTnT concentration, in which hemolysis was mechanically induced. In addition, ethylenediamine tetra-acetic acid blood tubes were collected from 3 other horses, from which hemolysate was prepared and added to plasma at different concentrations. The within- and between-run coefficients of variation of all pools were <10%, and a good linearity was found. Three out of 4 hemolyzed serum samples had a decreased serum cTnT concentration. Plasma samples with a high hemolysis index showed a negative interference, resulting in a lower cTnT concentration. Results of the high-sensitivity cTnT assay were highly reproducible. Because samples from horses with musculoskeletal damage were included, further studies should test the possible cross-reactivity between troponin T of musculoskeletal and cardiac origin before the assay can be used in equine clinical practice.
Introduction
Cardiac troponin I (cTnI) and T (cTnT) are used in human and small animal veterinary medicine to detect cardiac damage in cases of acute myocardial damage.1,3,7,13,20 Even though human cTnI assays have been used in horses to detect myocardial damage,5,17,18,22,29 cTnI assay validation studies are scarce, 23 and studies about cTnT measurement in horses are limited.11,23 In 2015, equine cTnT reference intervals were established using a high-sensitivity cTnT (hs-cTnT) assay. 30 In human medicine, this hs-cTnT assay yields an improved diagnostic accuracy compared to the older, less sensitive troponin tests, especially when patients are presented with a mild troponin increase in an early phase of acute myocardial infarction. 28 In horses, both cTnT and cTnI have been used to detect myocardial damage. 30 There are many cTnI assays from different manufacturers. Because all of these cTnI assays have different target peptides and use different antibodies, there is a lack of standardization, which makes cTnI results difficult to compare.2,29 In contrast, only 1 manufacturer a has produced cTnT assays,2,3,27 which considerably facilitates data interpretation. Because cTnT might be a good alternative for cTnI and data can be easily compared between studies due to the higher level of standardization, it is a promising cardiac biomarker for use in equine veterinary medicine. However, assay validation is needed before cTnT results can be interpreted correctly. Therefore, the aims of this study were to determine the analytical performance of the hs-cTnT assay in horses and to study the influence of sample hemolysis on cTnT results.
Materials and methods
After the study was approved by the ethical committee of the Faculty of Veterinary Medicine and Bioscience Engineering at Ghent University (EC2012/57), blood samples were collected from horses that were admitted to the Faculty of Veterinary Medicine (Merelbeke, Belgium). In the first study, the precision of the assay was determined. In the second study, the effect of hemolysis on the cTnT concentration was investigated.
High-sensitivity cardiac troponin T assay
The hs-cTnT assay b is a sandwich electrochemiluminescence immunoassay that uses 2 monoclonal mouse antibodies against amino acid positions 125–131 and 136–147 of the human cTnT molecule. 12 Biotinylated capture antibody, ruthenium-labeled detection antibody, and sample are briefly incubated. After 9 min, streptavidin-coated beads are added, and a second incubation is started. The mixture is then aspirated into a measuring cell and binds to a magnet on an electrode surface. Next, the measuring cell is filled with detection buffer, voltage is applied on the electrode, and the emitted light can be measured by a photomultiplier. 12
Study 1: analytical performance
For study 1, blood was collected by puncture of the jugular vein using a tube holder c and serum collection tube. d After 30 min at room temperature, the tubes were centrifuged for 10 min at 2,576 × g. The serum was harvested, and the samples were fractionated in different cryovials and stored for a maximum of 6 months at -20°C. One of these cryovials was transported to a laboratory where the cTnT or cTnI concentration was determined with the hs-cTnT or a commercial chemiluminescent immunoassay. e Although these assays have not been previously validated, results were only used to obtain an approximate indication of the cTnT concentration.
After collection of all samples, the remaining serum was thawed and mixed into 3 pools with a low, medium, or high cTnT concentration based on the initial cTnI or cTnT results. Samples from 3 healthy horses were included in pool 1 (low cTnT concentration). Samples from 6 horses with heart failure (due to severe valvular heart disease) or atypical myopathy were mixed in pool 2 (medium cTnT concentration). Pool 3 (high cTnT concentration) only included samples from 10 horses with atypical myopathy. Each pool contained a minimum of 10 ml, was refrozen (at −20°C), and analyzed within 1 week. The within-run coefficient of variation (CV) was determined by measuring each pool 5 times on the same day. The between-run CV was assessed by measuring each pool twice on 3 consecutive days. Dilution linearity was examined by serial dilution of pools 2 and 3. Each pool was measured undiluted and after 1:2, 1:4, 1:8, 1:16, and 1:32 dilution with a commercial diluent. a
Study 2: influence of hemolysis
For study 2, 7 horses with a high serum cTnT concentration caused by atypical myopathy were selected to study the influence of hemolysis, whereby 2 different methods were applied.
Method 1
From each of 4 horses, 2 blood samples were collected. In 1 sample of each horse, hemolysis was mechanically induced on whole blood (before clotting) by repeated aspiration of the blood sample through a 21-gauge needle. The serum was harvested after centrifugation and stored at -20°C until analysis. The hemolysis index (HI; an objective, spectrophotometric measurement of the amount of hemolysis 24 ) of each sample was measured, b and cTnT was compared for the nonhemolytic and hemolytic samples.
Method 2
From the 3 other horses, 2 ethylenediamine tetra-acetic acid (EDTA) tubes were collected per horse. From 1 sample per horse, the initial plasma cTnT concentration and HI were determined. Next, fresh hemolysate was prepared from the other EDTA tube on the same day according to Clinical and Laboratory Standards Institute protocol. 10 The EDTA blood was centrifuged, the plasma removed, and the red blood cells were washed 3 times with 10 ml of isotonic saline. The cells were recovered after the final centrifugation and frozen overnight at -20°C. After thawing, the samples were brought to room temperature and centrifuged for 30 min to remove the cellular stroma. The supernatant hemolysate was collected and added at 7 different concentrations to the EDTA plasma sample of the same horse. The final HI was determined, b and the cTnT concentration was compared to the initial cTnT concentration.
Statistical analysis
Data analysis was performed with SPSS statistics 21.0. f Simple linear regression analysis was used to compare the measured cTnT levels with the expected cTnT levels based on linear dilution. The effect of the hemolysate on the EDTA plasma cTnT concentration (method 2) is presented in an interferogram, which is a graphic representation of the mean percentage change of the cTnT concentration (y-axis) with increasing HI (x-axis). The change in percentage was calculated as follows:
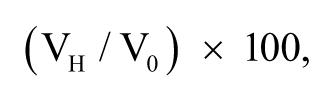
where V0 is the original cTnT value before hemolysis and VH is the final value obtained after hemolysis. The change in percentage was calculated for each of the 3 horses for 7 different concentrations of hemolysate.
Results
Study 1: analytical performance
The mean cTnT serum concentration of pools 1, 2, and 3 was <4.00, 18.47, and 1098.80 pg/ml, respectively. Tables 1 and 2 display the results of the within-run and between-run variability. Figures 1A and 1B demonstrate the regression lines of diluted samples of pools 2 and 3; good linearity was found after dilution between the observed (measured) and expected (based on the undiluted value) cTnT concentrations.
Within-run variability of the high-sensitivity cardiac troponin T (hs-cTnT) assay of 3 pools with a different cTnT concentration (pg/mL).*
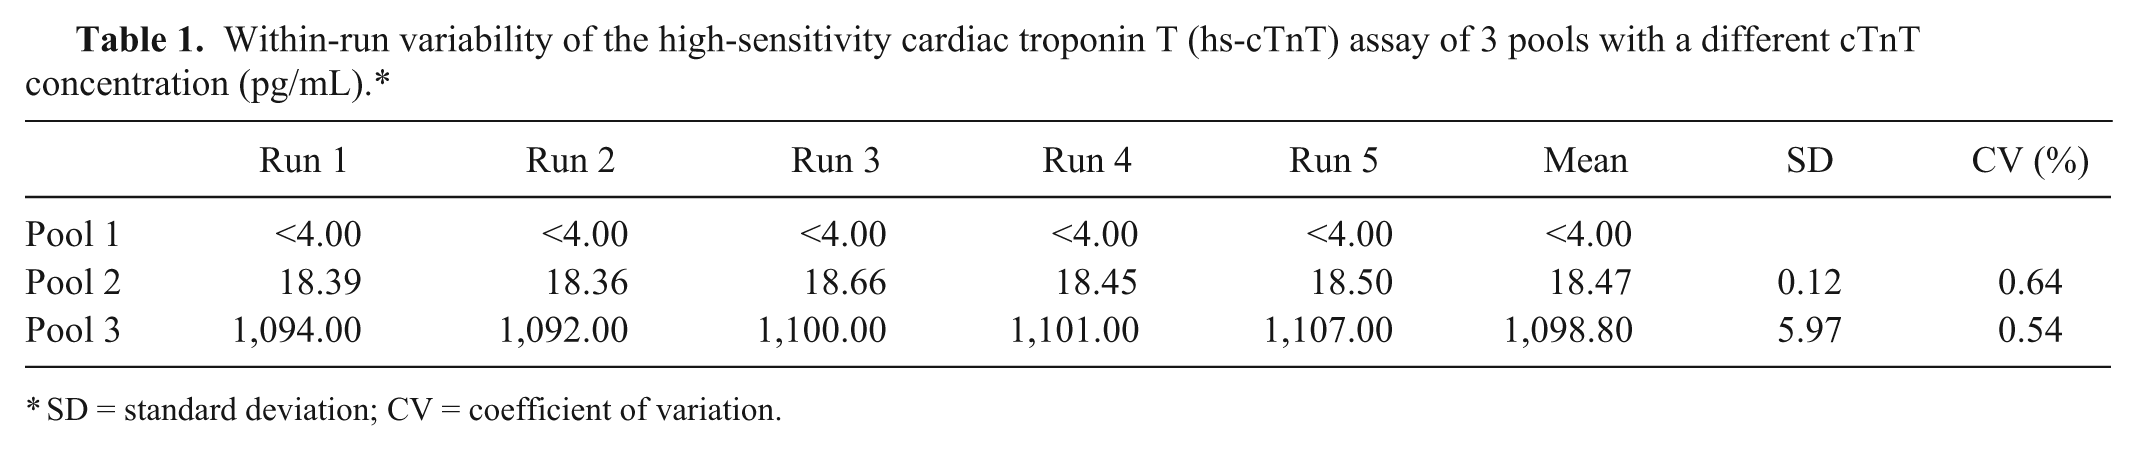
SD = standard deviation; CV = coefficient of variation.
Between-run variability of the high-sensitivity cardiac troponin T (hs-cTnT) assay of 3 pools with a different cTnT concentration (pg/mL).*
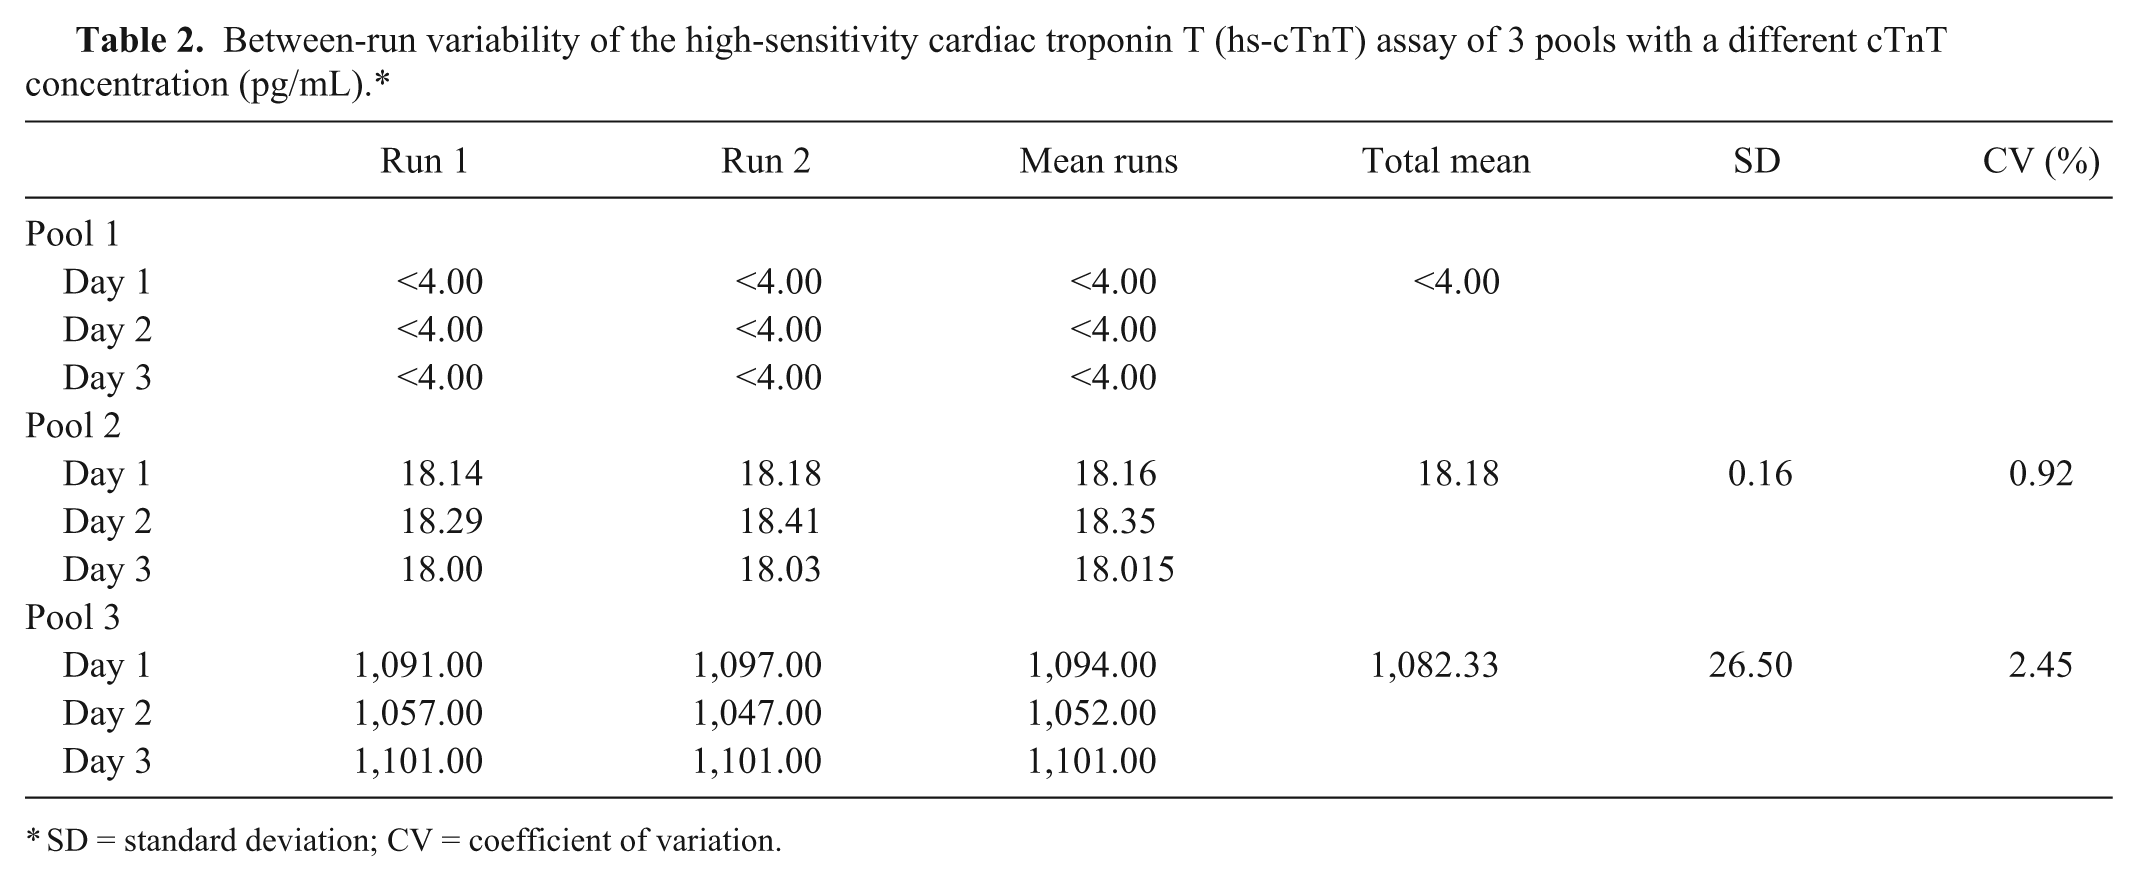
SD = standard deviation; CV = coefficient of variation.
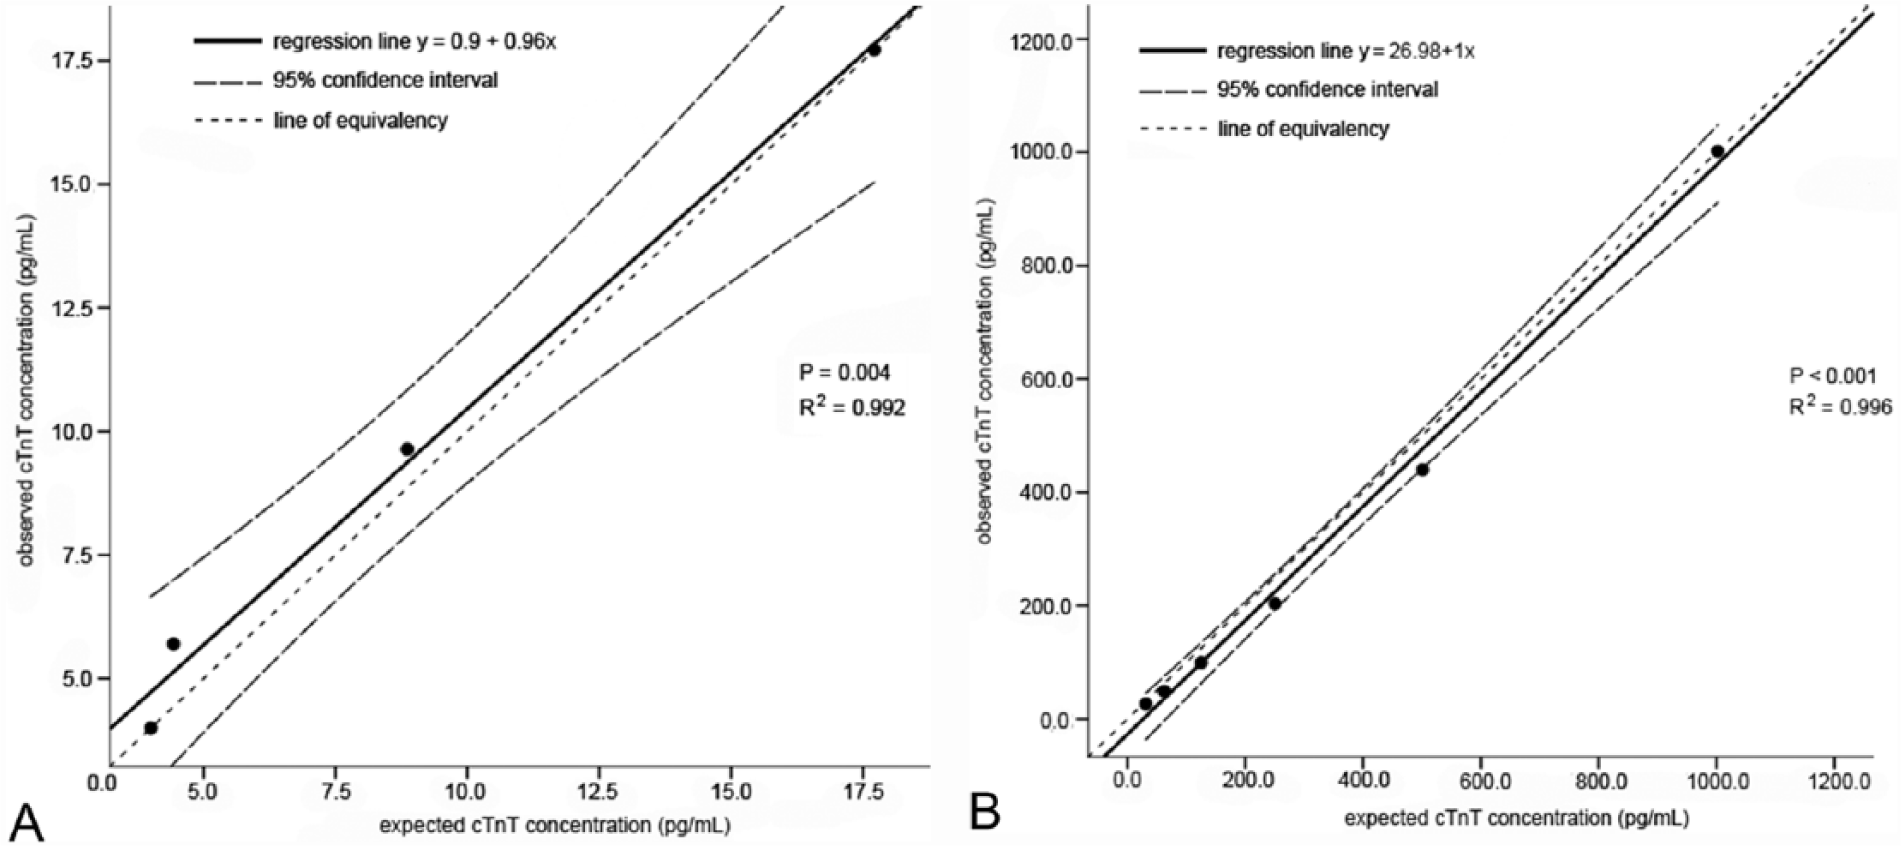
Linear regression analysis and 95% confidence interval demonstrating the relationship between the observed (measured) cardiac troponin T (cTnT) concentration and the expected cTnT concentration after dilution of pool 2 (
Study 2: influence of sample hemolysis
Method 1
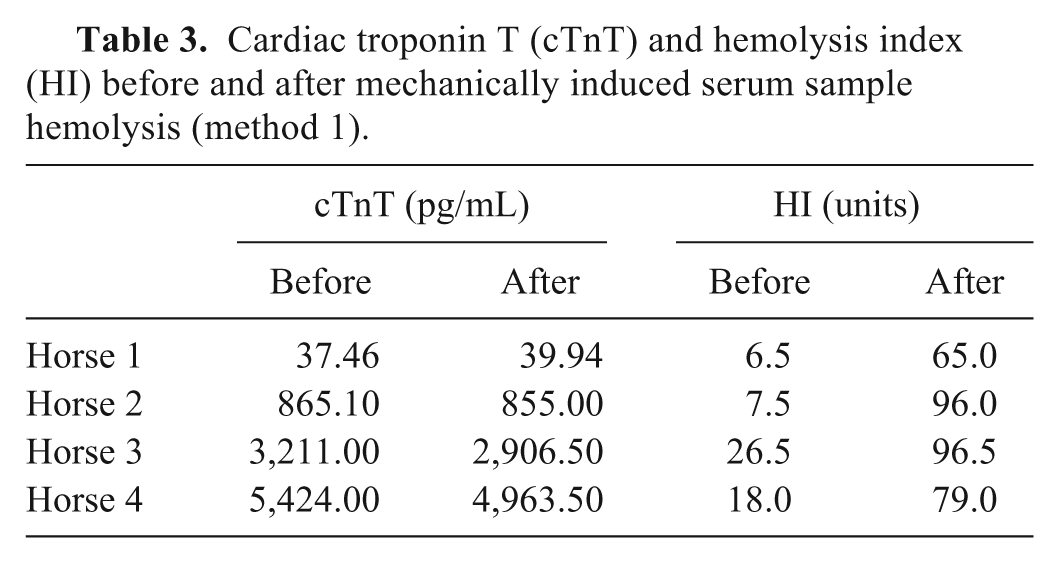
After mechanically induced sample hemolysis, the mean HI index increased from 14.6 ± 8.2 units to 84.1 ± 15.1 units. For 3 out of 4 serum samples, a lower cTnT concentration was demonstrated after hemolysis (Table 3).
Cardiac troponin T (cTnT) and hemolysis index (HI) before and after mechanically induced serum sample hemolysis (method 1).
Method 2
The HI of the 3 plasma samples before addition of hemolysate was 12, 27, and 48 units, respectively, and the cTnT concentration of these samples was 16.03, 31.10, and 223.82 pg/ml, respectively. Increasing the HI by adding hemolysate resulted in a decrease in cTnT plasma concentrations (Fig. 2).
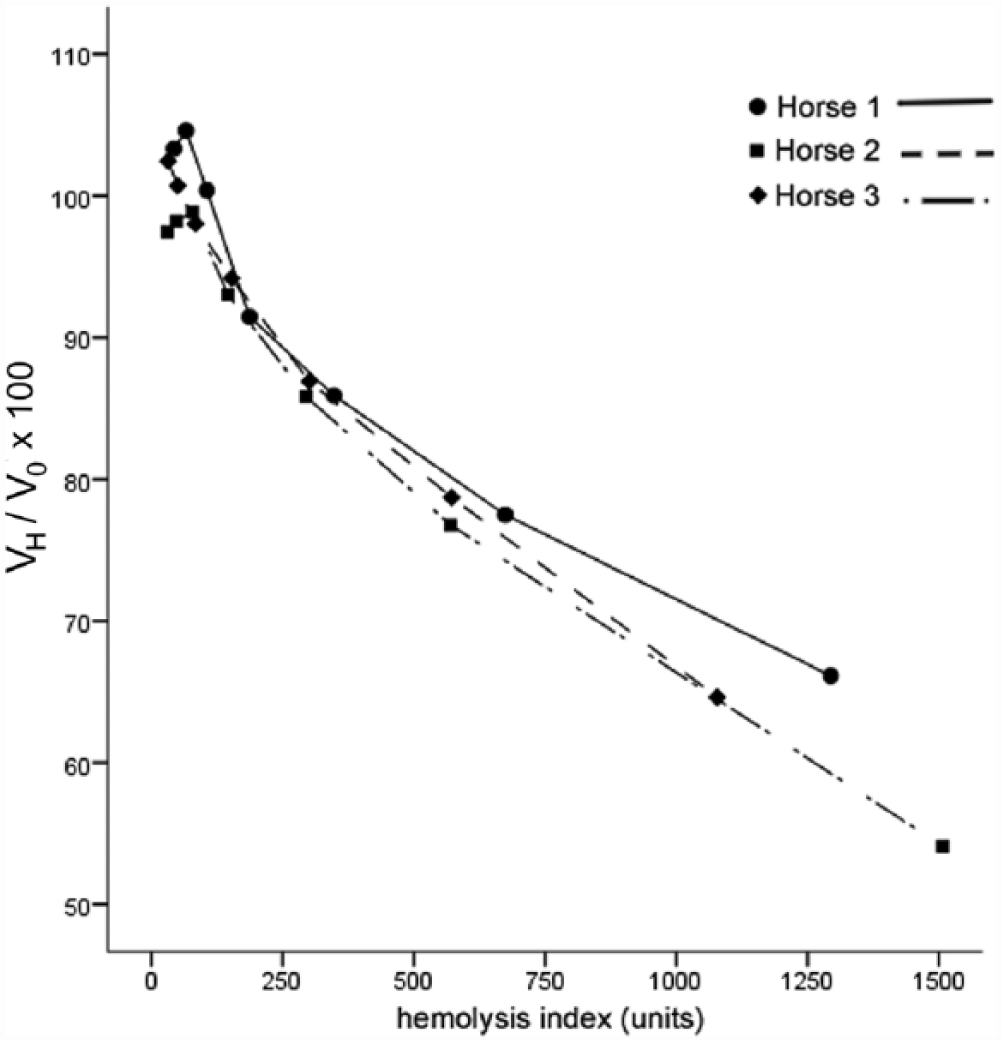
Interferogram demonstrating the graphical relationship between the mean percent change (final value obtained after hemolysis (VH)/original value without hemolysis (V0) × 100) of the initial ethylenediamine tetra-acetic acid plasma cardiac troponin T (cTnT) concentration and the hemolysis index (method 2) of horses 1, 2, and 3.
Discussion
In human medicine, the guidelines suggest that the CV should be <10% at the 99th percentile cTnT concentration. 26 Veterinary guidelines suggest that the CV should be smaller than the clinical decision limit or the total allowable error of the assay (American Society for Veterinary Clinical Pathology, 2009, Principles of quality assurance and standards for veterinary clinical pathology. Available at: http://www.asvcp.org/pubs/pdf/ASVCPQualityControlGuidelines.pdf). In our study, the within-run and between-run CV was <10% for all sample pools, which indicates that the cTnT assay is accurate for measuring cTnT in equine blood serum. One cTnI assay was also analytically validated in horses, 22 but showed a substantially higher inter-assay CV than for the hs-cTnT assay. However, validation studies of other cTnI assays are still needed. Because a high regression coefficient (R 2 ) was found for both pools 2 and 3, a good linear agreement was obtained between the observed and expected serum cTnT concentrations. However, the influence of sample hemolysis should be kept in mind. Sample hemolysis is an important cause of laboratory errors, and an incidence of 2.5–5% has been reported in human medicine.8,21 A free hemoglobin concentration of 2 and 5 mg/dl is normal in human plasma and serum samples, respectively. 14 In our study, plasma samples with a high HI had a lower cTnT concentration (Fig. 2). This has been confirmed in 2 previous studies,4,24 where hemolysate was added to human cTnT serum samples. The exact reason for this lower concentration remains unknown, but the hemolysis effect is possibly independent of the electrochemiluminescence technique 15 as preanalytical alterations of the cTnT molecule by hemolysis have been proposed. 24 Sample hemolysis might cause the release of protease enzymes, such as cathepsins from the erythrocytes, which can cleave the cTnT molecule and, thus, destroy the antigenic binding sites of the antibodies used in the hs-cTnT assay. 25 Although the effect of hemolysis on plasma samples was clear (method 2; Fig. 2), the difference between serum samples before and after mechanically induced hemolysis was less pronounced (method 1; Table 3). The maximum HI in these samples was 96.5 units, while plasma samples with hemolysate showed a maximum HI of >1,500 units. Because a HI of 500 units is equivalent to a hemoglobin concentration of 500 mg/dl, and hemolysis can be visible from 30 to 50 mg/dl free hemoglobin, the severity of hemolysis in these plasma samples was high and would be clearly visible. 14 Therefore, a decreased cTnT concentration can be expected in samples with an obvious pink to red discoloration.
A limitation of our study was that the freshly prepared hemolysate, resulting in the highest HI, was only added to the EDTA plasma samples and not to the serum samples. In human medicine, a good correlation between the serum and EDTA plasma cTnT concentration has been described. 12 Therefore, severe hemolysis probably causes a decreased cTnT concentration in both serum and plasma. Second, the mean cTnT concentration of pool 1 was under the limit of detection of the assay. Consequently, the exact CVs of these samples could not be determined. In human serum, a between-run CV of 10% has been reported in samples with a cTnT concentration of ~10 pg/ml, but a higher CV was found in samples with a lower cTnT concentration. Therefore, the between-run CV might be higher in samples from healthy horses. Third, besides myocardial damage, horses with atypical myopathy also have severe muscle damage.9,31 Previous studies demonstrated that musculoskeletal troponin T might cross-react with cTnT in first-generation assays.6,19 However, in newer generation cTnT assays, such as the one used in our study, this cross-reactivity is counteracted by the use of a more specific cardiac troponin antibody.16,19 Thus, although further investigation is needed, the effect of musculoskeletal troponin T on our results is probably limited. Finally, the limit of blank or limit of detection was not calculated for equine cTnT and should be determined in order to fully validate the test. In conclusion, the hs-cTnT assay used in our study demonstrates a good precision for diagnostic use in the horse. Because severe sample hemolysis can cause a decrease in the cTnT concentration, appropriate sample collection and handling is recommended.
Footnotes
Author Contributions
N Van Der Vekens and G van Loon contributed to conception and design of the study. MA van Dievoet and H De Puydt contributed to design of the study. N Van Der Vekens and MA van Dievoet contributed to acquisition, analysis, and interpretation of data. H De Puydt contributed to analysis and interpretation of data. A Decloedt, S Ven, and D De Clercq contributed to acquisition of data. G van Loon contributed to interpretation of data. N Van Der Vekens drafted the manuscript. All authors critically revised the manuscript, gave final approval, and agree to be accountable for all aspects of the work in ensuring that questions relating to the accuracy or integrity of any part of the work are appropriately investigated and resolved.
a.
Elecsys diluent multiassay, Roche Diagnostics, Indianapolis, IN.
b.
Cobas E601 module, Roche Diagnostics, Indianapolis, IN.
c.
Venoject, Terumo Medical Corp., Somerset, NJ.
d.
Vacutainer, BD, Franklin Lakes, NJ.
e.
Access AccuTnI assay, Beckman Coulter Corp., Fullerton, CA.
f.
SPSS Statistics 21.0, IBM Corp., Armonk, NY.
Declaration of conflicting interests
The author(s) declared no potential conflicts of interest with respect to the research, authorship, and/or publication of this article.
Funding
The author(s) disclosed receipt of the following financial support for the research, authorship, and/or publication of this article: The study was funded by the Special Research Fund of Ghent University.