
Abstract
A morphology-based assay such as immunohistochemistry (IHC) should be a highly effective means to define the expression of a target molecule of interest, especially if the target is a protein. However, over the past decade, IHC as a platform for biomarkers has been challenged by more quantitative molecular assays with reference standards but that lack morphologic context. For IHC to be considered a “top-tier” biomarker assay, it must provide truly quantitative data on par with non-morphologic assays, which means it needs to be run with reference standards. However, creating such standards for IHC will require optimizing all aspects of tissue collection, fixation, section thickness, morphologic criteria for assessment, staining processes, digitization of images, and image analysis. This will also require anatomic pathology to evolve from a discipline that is descriptive to one that is quantitative. A major step in this transformation will be replacing traditional ocular microscopes with computer monitors and whole slide images, for without digitization, there can be no accurate quantitation; without quantitation, there can be no standardization; and without standardization, the value of morphology-based IHC assays will not be realized.
Introduction
Over the past twenty years, the process of drug development and medical treatment has changed dramatically. Three factors have played a critical role: (1) In the early 1990s, the idea of personalized medicine arose—the theory that medical treatment can be made more effective if it is individualized to a patient’s specific disease, especially if it can be related with each patient’s genome. (2) Based on work pioneered by David Sackett in the mid-1990s, the concept of evidence based medicine was proffered: “the conscientious, explicit, and judicious use of current evidence in making decisions about the care of individual patients” (Straus and Sackett 1999). The evidence-based medicine concept is increasingly being used to justify less expensive therapeutic alternatives that achieve either similar outcomes or even less than optimal outcomes if the savings generated allows for a wiser allocation of funds for the better good. (3) Finally, the lack of first-in-class drugs approved by the Food and Drug Administration (FDA) over the past two decades has increased pressure on the biopharma community to develop new ways for defining efficacy and safety—in 2010, only twenty-one drugs were approved by the FDA, a number too small to maintain a robust industry (Dooren 2010).
What this means is that new drugs must specifically hit their target(s), be substantively more effective than current therapies, be economically justifiable, be approved in much greater numbers than in 2010, and be profitable. This is a tall order, and the theoretical linchpin as to how this will become feasible is the development of biomarkers that will efficiently and effectively allow for the diagnosis of each disease, define the prognosis of each patient, predict the best treatment, and finally, recognize the toxicities a patient can expect to suffer—in total, an even taller order (Khleif et al. 2010; Walk 2010).
Based on the demands for “better than ever” methods to assess efficacy and safety, it is perhaps time for anatomic pathologists to consider the role our discipline will play in the future of drug development and diagnostic medicine. Admittedly, it is hard to conceive where the morphologic evaluation of a tissue sample, especially in oncology or in preclinical toxicology, will not be viewed as a critical diagnostic component, but this is our traditional role. The future of medicine is aimed at exploiting biomarkers to better diagnose, prognose, and predict the best mode of therapy. Here, it is not hard to see where anatomic pathology may be bypassed as a method for biomarker assessment by emerging, often molecular-based technologies. This is especially true when one considers that most “effective needs” is defined by relevance, accuracy, value, and speed.
Thus, the value of correlating morphologic changes with specific diseases, a skill that pathologists have acquired through years of training, is trapped in a vice by new methodologies. At the molecular level, gene expression analyses, defining loss of heterozygosity, microsatellite instability, and so forth, have all become highly reproducible with Next-Generation Sequencing promising entire genome sequencing with high coverage for less than $1,000 in a few years (Mardis 2008). At the macroscopic level, imaging methods such as magnetic resonance imaging and positron emission tomography allow for detailed in vivo analysis not only of soft tissue anatomy but also of the biochemistry associated with diseases such as cancer and Alzheimer’s disease. Registration of these images allows for correlation of anatomy with function. Although far from equivalent to a standard ocular microscope, the resolution of these in vivo methods is rapidly evolving. As a consequence, immunohistochemistry (IHC), the primary biomarker technique that pathologists claim “ownership” of, is being challenged by emerging quantitative methods in the detection, classification, and prediction of treatment response and toxicity, especially in oncology (Alymani et al. 2010).
The National Institutes of Health defines a biomarker as “a characteristic that is objectively measured [italics added] and evaluated as an indicator of normal biological processes, pathogenic processes or pharmacologic responses to a therapeutic intervention” (Biomarkers Definitions Working Group 2001, 91). In addition, the American Association of Pharmaceutical Scientists and the United States Clinical Ligand Society have identified four general classes of biomarker assays (Figure 1) (Lee et al. 2006). Note that the standard method of defining biomarker expression provided by pathologists examining a glass slide is considered a “qualitative assay”—an assay that generates discrete, discontinuous data in either ordinal (e.g., low, medium and high, scores 1–5) or nominal (yes/no, positive/negative) formats (Lee 2009; Cummings, Ward, and Dive 2010). Even the most sophisticated image analysis now performed on histologic sections qualifies as “quasi-quantitative”—an assay that generates numeric data along a continuous scale in terms of a characteristic of the test sample (e.g., percent of area of tumor expressing an immunohistochemical stain) (Cummings et al. 2010). The major feature that distinguishes truly quantitative assays from qualitative and quasi-quantitative assays is the use of reference standards—a set of accurately characterized samples that are used as the basis of quantization of similar samples. Until pathologists can run immunohistochemical assays with known controls that serve as true reference standards, the use of IHC on histologic sections will be considered a less valued or preliminary method of defining a biomarker (Cummings et al. 2010).
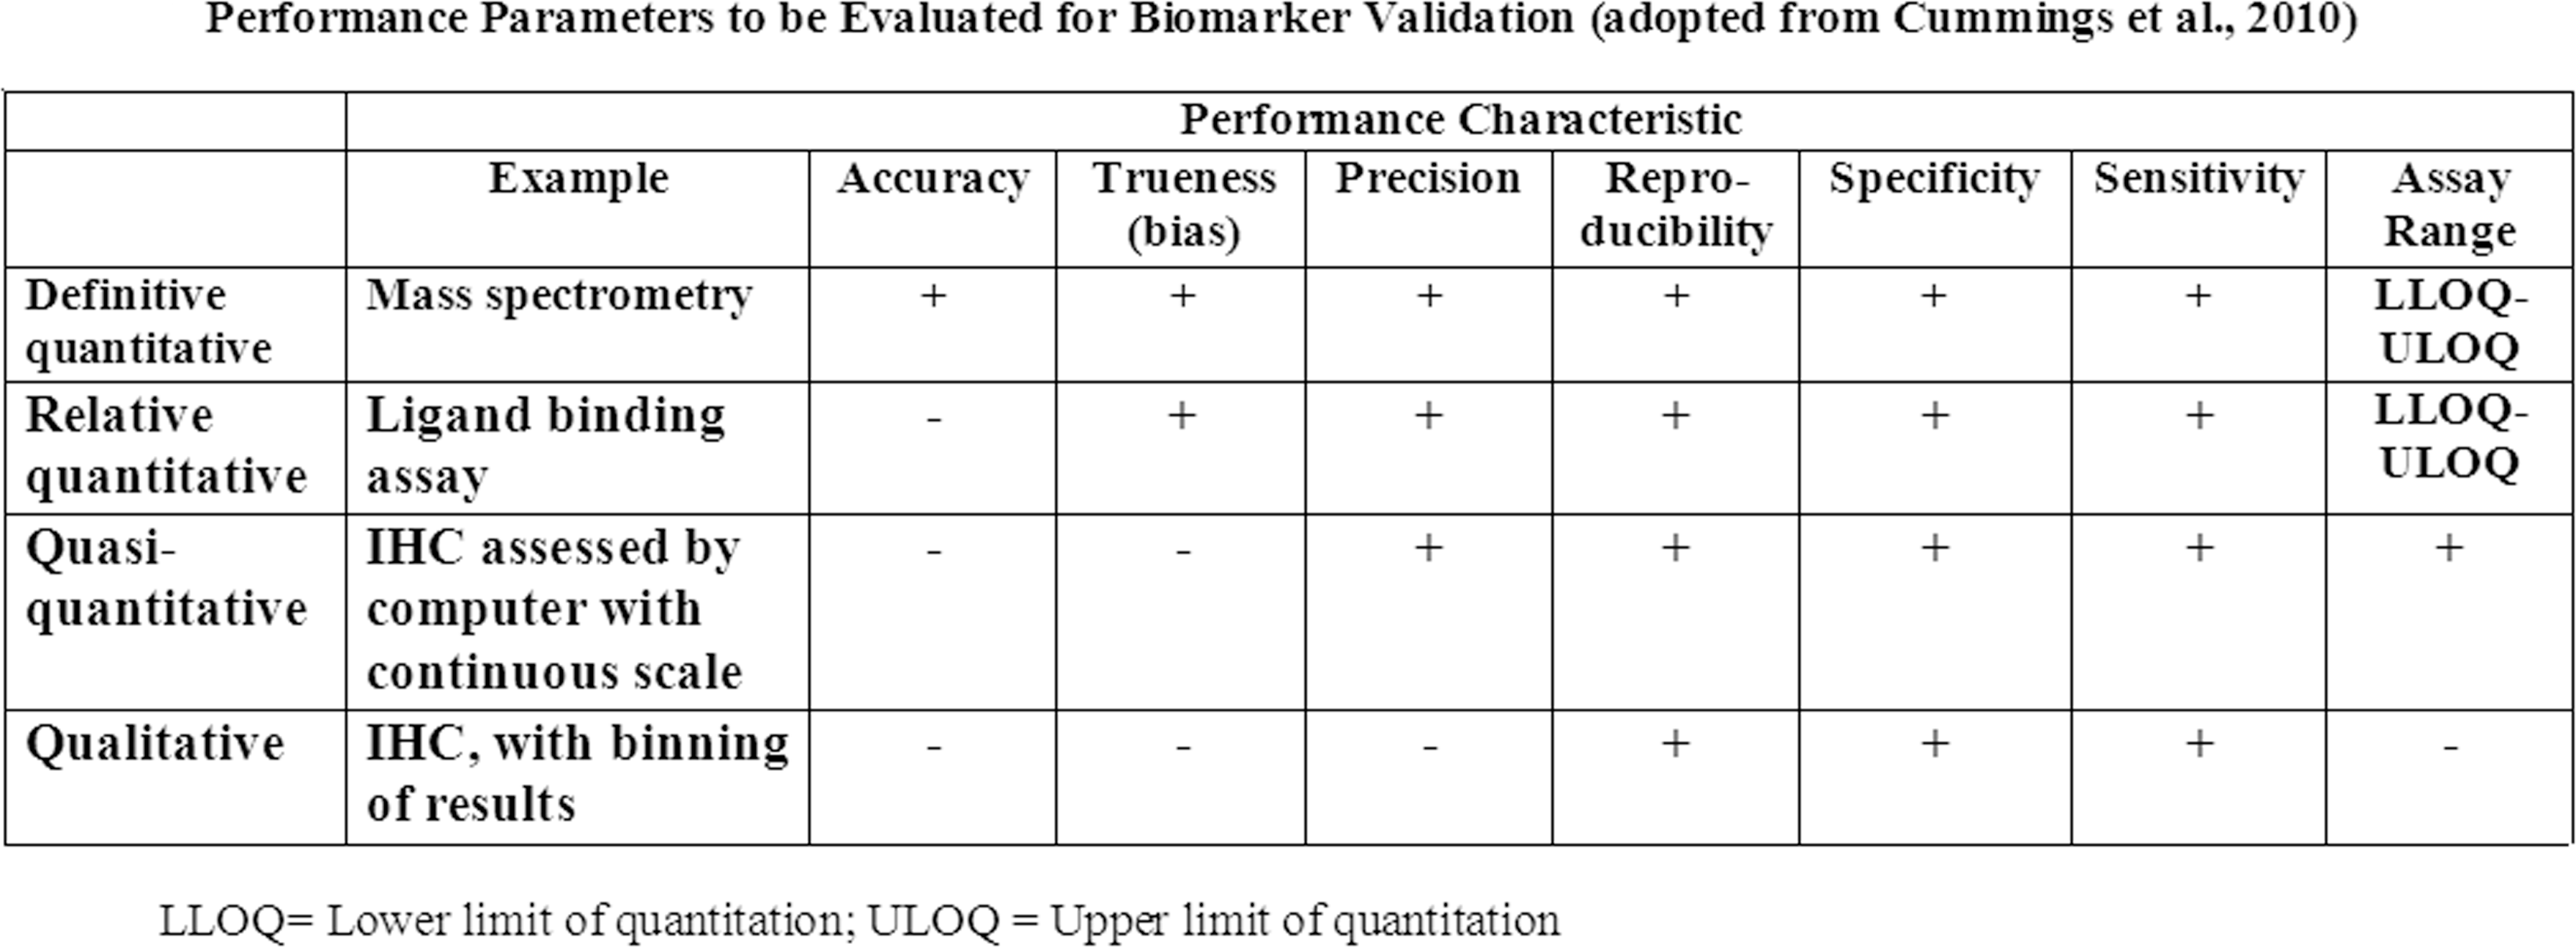
Table defining the different rigors for biomarker validation based on criteria established by the American Association of Pharmaceutical Scientists. Note that as currently performed, IHC is considered either “qualitative” or “quasi-quantitative” compared to ligand binding assays or assays using mass spectrometry. In order to have upper and lower limit of quantification, reference standards are needed. (Adopted from Cummings et al. 2010.)
An example of why the value of IHC assays for biomarker assessment is being challenged by non-morphology-based assays is the testing for human epidermal growth factor receptor 2 (HER2) positivity in breast cancer, a prognostic biomarker for tumor aggressiveness and a predictive biomarker for response to trastuzumab (Herceptin). To date, the HER2 assay (which was licensed in 1998) remains the only FDA-approved predictive IHC biomarker. A positive HER2 result is defined as 3+ IHC staining (uniform, intense membrane staining) of >30% of invasive tumor cells. At face value, the evaluation of HER2 positivity should be straightforward; however, its reproducibility is disconcertingly low and 20% of HER2 assays performed in the field (i.e., the primary treatment sites) were incorrect when the same specimen was reevaluated in a high-volume central laboratory (Wolff et al. 2007).
What should be of greater concern for those who hope to develop IHC biomarkers is that, because overexpression of HER2 is usually associated with an increase in gene copy number, cells with 3+ HER2 expression have an estimated 2,700,000 receptors, a 30-fold increase over the number of receptors corresponding to 1+ staining (Mass 2006). The authors had difficulty identifying other targets now being pursued by pharma with as many receptors as HER2. In short, the development of qualitative or quantitative IHC assays will not get easier from this point forward.
At first glance, the use of morphology-based assays for biomarker assessment may appear bleak; but in reality, the goal of biomarkers to revolutionize medicine has yet to be realized. A crude PubMed search in mid-2011 identified more than 500,000 publications on the subject, yet there has been little progress in identifying clinically useful predictive biomarkers, especially for solid tumors regardless of the technology used (Alymani et al. 2010). In a recent article, Diamandis (2010, 1) stated, Over the past 15 years, major investments have been made to discover and validate cancer biomarkers. Despite such investments, no new major cancer biomarkers have been approved for clinical use for at least 25 years. In the last decade, many reports to describe new cancer biomarkers promise to revolutionize the diagnosis of cancer and the management of cancer patients. However, many initially promising biomarkers have not been validated for clinical use.
Molecular methods such as gene expression microarrays have come under criticism as they are being evaluated over time and through an expanding data set. For example, Molyneaux and Smalley (2011) recently reported that expression profiling is poor at distinguishing tumor histological subtypes and the cell of tumor origin as it relates to BRCA1-mutant human cancers. This is a key finding, because if molecular-based assays cannot reproducibly determine the cell of origin in breast cancer subtypes, it is extremely difficult to identify key processes associated with initiation, progression, and maintenance of each tumor subtype—information critical for the development of targeted therapies. Furthermore, upregulation of genes as defined by expression assays can be poorly correlated with protein concentration resulting in the unresolved question of how accurate surrogate messenger RNA can be to quantify protein (Chen et al. 2002).
This does not mean that emerging technologies are not of value or that they will not have an expanded role in validating biomarkers in the future (Majewski and Bernards 2011). Rather, the point made is that morphology-based assays are as good (or bad) as any current technology for the evaluation of biomarkers. For all the problems of morphology-based assays such as IHC, when a protein is the target, identification of that protein by IHC in tissue remains the gold standard for tumor biomarkers and becomes the “diamond” standard when the proteins undergo posttranslational modification such as phosphorylation and/or are upregulated.
At the same time, while other technologies are rapidly improving user acceptance and sophistication by decreasing cost while increasing speed, accuracy, and precision, the process of creating and evaluating a histologic slide has remained largely static for over a century (Alymani et al. 2010; Sheehan and Hrapchak 1987). Anatomic pathology remains the only method of biomarker evaluation in which data are presented in a qualitative or at best quasi-quantitative format. Fortunately, anatomic pathology has the potential to match the advancements of other methods of biomarker assessment, but this will require a fundamental change in our work processes. Pathologists will have to go from an analogue to a digital mode of slide interpretation, transition from descriptive to quantitative methods for reporting data, and use highly standardized processes.
Something known by all pathologists but seldom mentioned is the almost complete lack of standardization in anatomic pathology from the acquisition of tissue to the stain used to define it on a glass slide. This lack of standardization can occur between individual histotechnologists and pathologists who use the same laboratory but is most apparent between laboratories. The process of transforming a tissue biopsy into a histologic section that is mounted on a glass slide is a complex process, especially when the sample is stained using an IHC technique. Thus, the most important question for validating quantitative morphology-based analyses by IHC is not whether reference standards can be established but rather whether the preanalytic variability associated with the preparation of histologic samples, the interlab variability that pathologists have come to accept, and the interobserver analytic variability that occurs when different pathologists interpret a histologic section can be minimized so the reference standards can be used as a basis for quantitative determination of an unknown histologic analyte.
This article will focus on some of the key aspects that need to be considered in the future validation of IHC staining so the use of reference standards can be applied (Figure 2). Our goal is not to replace the deductive and descriptive methods that have provided valuable insights since Virchow but, rather, to add to them so the value of morphology can be maximized. Finally, with emerging new technologies to analyze proteins and nucleic acids, the processes of anatomic pathology must be complementary and not neutral or detrimental to these methods.
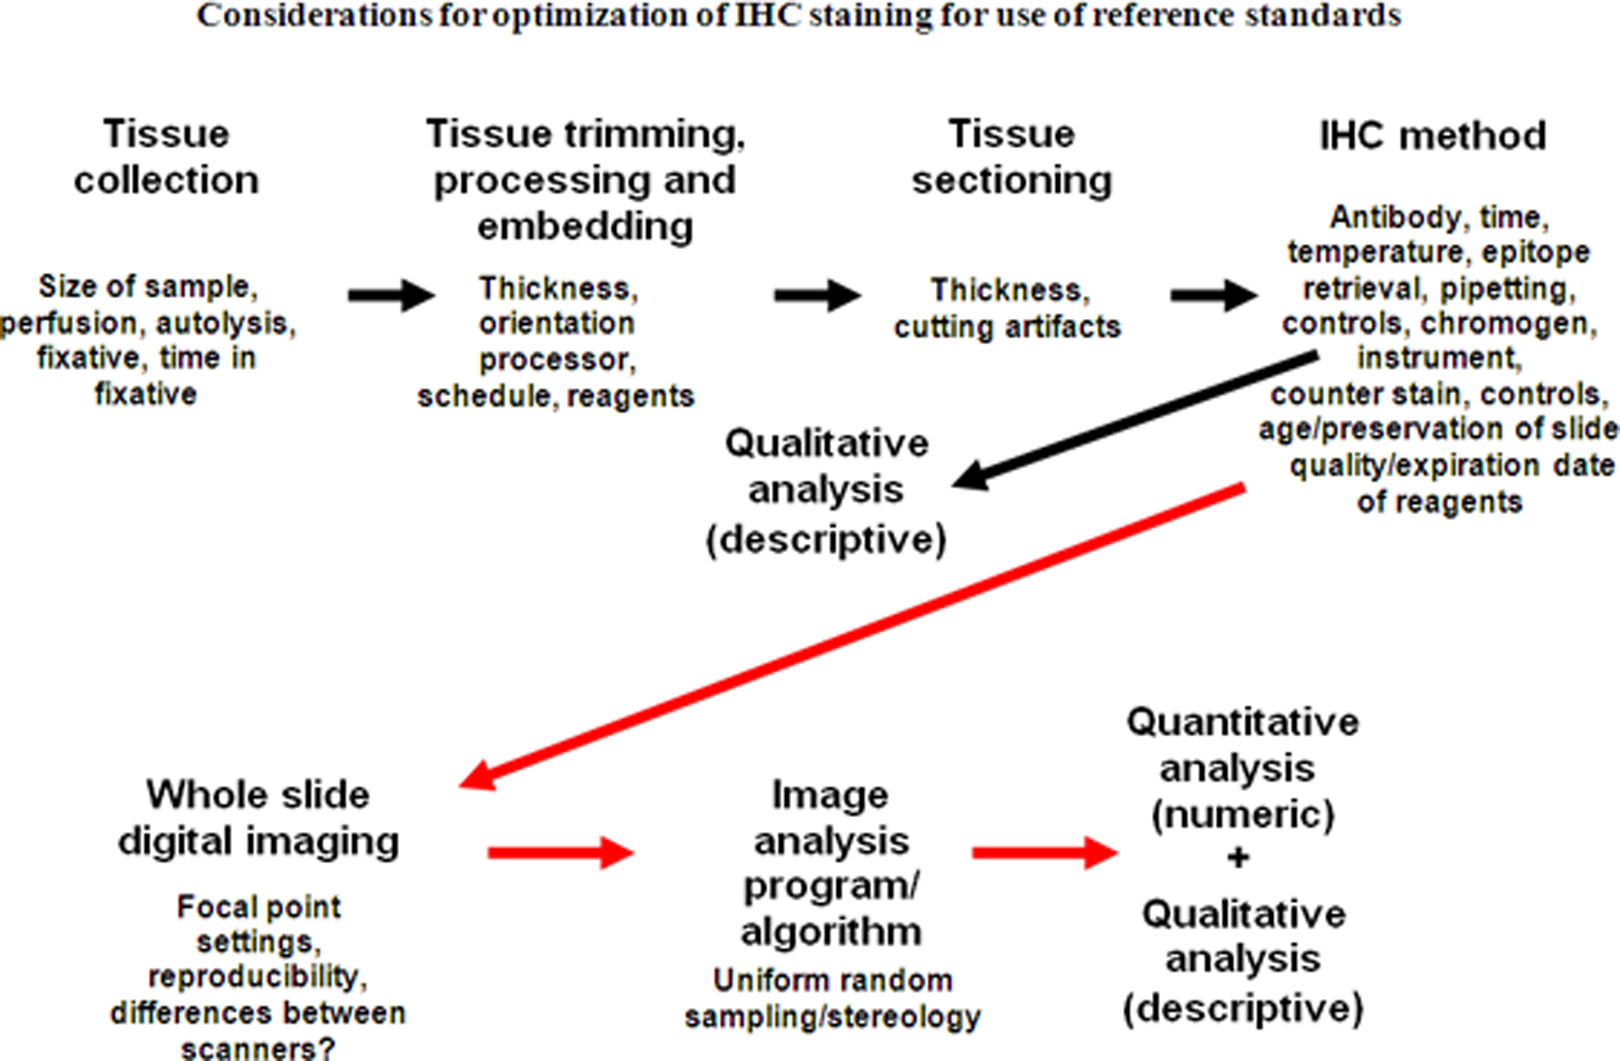
Considerations for optimization of IHC staining for use of reference standards starting with tissue acquisition through image analysis. Arrows in black denote considerations for the current process where a diagnosis is made after evaluation of IHC stained slides. Arrows in red denote the process in the future where the final diagnosis is based on traditional morphologic assessment and computer-generated quantitation. Note that by adding image scanning and image analysis, new variables are added to processes that need to be standardized.
Specimen Collection and Transportation
Minimizing the preanalytic variability for reproducible morphology-based quantitative analyses should start before a tissue is removed from a patient. Although it is generally accepted that up to 2 hours of warm ischemia (time without fixation) does not alter protein, DNA or RNA conformation or preservation of microscopic, and IHC features (Burns et al. 2009), Samaratunga et al. (2011) have reported that even before resection has been completed, intraoperative manipulations can alter gene transcription levels during radical prostatectomies.
Spruessel et al. (2004) used microarray analysis, quantitative real-time polymerase chain reaction, and surface enhanced laser desorption ionization time of flight to investigate changes in gene and protein expression in normal and cancerous colon tissue at various stages of ischemia. Initial changes of gene and protein expression profiles were observed 5 minutes after resection; and after 30 minutes, 20% of all detectable genes and proteins differed significantly from baseline values. Although some proteins are relatively stable during periods of ischemia, others such as phosphoproteins are notoriously prone to rapid phosphorylation/dephosphorylation depending on the time until fixation, the duration of fixation, and the fixation used (Burns et al. 2009; Atkins et al. 2004).
The dynamic nature of RNA and protein metabolism means that standardization will require, at a minimum, knowledge of the time from sampling to fixation and based on evidence for best practice: the same care applied to preventing RNA degradation may be required for consistent quantitative results of protein based on IHC (Best, Sawyers, and Fu 2007; Samaratunga et al. 2011; Schlomm et al. 2008).
Fixation
Formalin—10% formaldehyde in buffer—has been used for over 150 years as a fixative for tissues. From a purely practical standpoint, it has many advantages: tissues placed in it do not require refrigeration (not considered a critical fixation criterion now but was when its use began, before electrical cooling was invented); it is inexpensive; and it firms tissues, making them easier to section. That formalin is toxic and carcinogenic are present detriments but were not a concern a century ago when its alternative, ethanol, could be better used for consumption and formalin’s carcinogenic potential was not known (Fox et al. 1985).
When pathologists examine a stained slide fixed by formalin, they are reading through the artifacts caused by the cross-linking of proteins and nucleic acids this method of fixation induces. In solution, the vast majority of formaldehyde is hydrated to form methylene glycol (Fox et al. 1985; Puchtler and Meloan 1985; Shi, Liu, and Taylor 2007). Methylene glycol penetrates tissues very quickly and stops the activity of endogenous RNAses. It acts primarily as a precipitating fixative rather than a cross-linking fixative. For formalin fixation to occur, the small amount of formaldehyde in solution binds to primary amino groups and nucleic acids, forming methylol groups. These reactive methylol groups may then take part in further reactions that yield very stable methylene bridges that cross-link proteins and nucleic acids in tissues. To maintain equilibrium in the solution, more formalin is formed and the fixation process continues in a time-dependant manner. This “clock reaction” explains why full formalin fixation takes 24 to 48 hours at room temperature. It is important to understand that permeability and fixation are not the same thing: formalin will totally permeate smaller tissues more rapidly than larger tissues, but the time for cross-linking to occur depends on the “clock reaction,” and this rate is constant regardless of the size of the specimen—core biopsies fix at the same rate as large resections (Fox et al. 1985; Grizzle, 2009; Puchtler and Meloan 1985).
The current recommendations for time in fixation to perform IHC tests like HER2, estrogen receptor (ER), and progesterone receptor (PR) are that tissues be fixed in formalin between 6 and 48 hours (Hammond et al. 2010; Wolff et al. 2007). This means samples exposed to fixative for suboptimal times that are fixed more by precipitation than by cross-linking are used for qualitative and quasi-quantitative evaluation. The literature on adequate fixation time for breast cancer specimens remains confusing and controversial. Apple et al. (2011) reported that factors such as delay to fixation (ischemic time), different fixatives, including non–10% neutral buffered formalin, and different fixation times varying from 1 hour to 168 hours did not significantly alter ER and PR IHC results. In contrast, the reference cited in the American Society of Clinical Oncology/College of American Pathologists Guidelines for ER and PR testing on breast cancer, as evidence that 6 hours of formalin fixation are needed to obtain consistent IHC results, depicted a clearly definable decrease in staining intensity in the samples fixed for 6 hours compared to those fixed for 8 hours (Hammond et al. 2010; Goldstein et al. 2003). Most of the literature suggests that longer fixation times have less an effect on IHC staining, although all reports to date have been based on visual assessment (Ibarra et al. 2010; Oyama et al. 2007; Webster et al. 2009). Even less defined are the effects of shortened fixation times on IHC. This lack of understanding about fixation is summarized by Raji (2007, 4020–1): The minimum fixation time for core biopsy specimens is not known, and the panel did not find sufficient information about fixation durations that merited a specific recommendation. Laboratories and investigators evaluating the effects of longer and shorter fixation times and other methods (e.g., the use of microwave fixation) are encouraged to submit their findings to the peer-review process and share them.
Without confirmation by quasi-quantitative assessment, one should error on caution and assume that fixation parameters can have a substantive impact on IHC. Even H&E staining has been reported to be compromised with fixation in 10% NBF for 8 hours or less (Babic et al. 2010; Dapson 2007).
Because many samples are not truly fixed by formaldehyde but rather by methylene glycol, alternative fixatives might do an equivalent job of maintaining morphologic features with less toxicity and better preservation of proteins and nucleic acids than formalin. However, little serious consideration has been given to switching fixatives for two reasons: (1) for generations, pathologists have learned to look at tissues fixed by 10% neutral buffered formalin (the equivalent of 4% paraformaldehyde) and have become extremely facile in recognizing disease processes through the artifacts it causes—pathologists do not want to “relearn” a second set of artifacts; and (2) the archives of formalin-fixed, paraffin-embedded tissues serve as a legacy of diseases past and are widely considered too vast and too valuable to change processes that subject them to reinterpretation. So impenetrable is the “formalin barrier” that molecular techniques are often designed to work around the cross-linking associated with formalin fixation. It should at least be acknowledged that this “too big to fail” mentality may not be the best path forward for standardizing sample preservation. If most current protocols for handling tissues result in artifacts due to precipitation rather than cross-linking, then perhaps serious consideration of fixatives that produce equivalent if artifactually different morphology with much better preservation of nucleic acids and proteins than formalin is in order (Cox et al. 2008).
Regardless, for more standardized and quantifiable uses of tissues for IHC biomarker assessment, the impact of variations in fixation time needs to be further investigated. Noting the size of the tissue and the time it is stored in formalin needs to be included in the sample record. In addition, tissues should either be trimmed prior to or after minimum fixation so they will be of a constant thickness for consistent fixation. Alternatively, standards based on tissue type, tissue size, and time in fixative should be established. The effects of long-term storage of tissues in formalin or solutions such as 70% ethanol or phosphate-buffered saline should also be quantified so best-practice protocols can be implemented. Lastly, is formalin really the best fixative for total tissue assessment and biomarker quantitation?
Tissue Trimming, Processing, and Embedding
After fixation, tissues are generally trimmed and oriented so they can fit in the confines of a standard-sized cassette and best display lesions on microscopic examination. Subsequently, tissues are processed by being taken through a series of graded alcohols to dehydrate them and then soaked in xylene so they can be infiltrated with hot paraffin. They are then placed in a mold where they are surrounded by paraffin so the tissue and paraffin in the mold have a similar consistency for microtomy.
As with most of histotechnology, there is little lab-to-lab consistency in the processing cycle, the type of alcohol (pure ethanol or denatured ethanol), xylene (pure or recycled), or paraffins for processing. Three types of paraffin are widely used. Each has different melting points, abilities to infiltrate tissues, and/or recommendations for optimal sectioning thickness. The impact processing has on tissue morphology is well known by every pathologist who has experienced a mechanical failure or laboratory error when the normal processing cycle is disrupted. Thus, different processors, even if used optimally, will have quantifiable variability in morphology based on tissue size and variation in staining due to differences in dehydration and tissue density (Figure 3). The extent of hydration of processed tissues can also have an impact on IHC. Xie et al. (2011) reported that retention of endogenous water in tissue blocks was a major cause of antigen degradation in archival materials when they were subsequently sectioned for immunostaining.
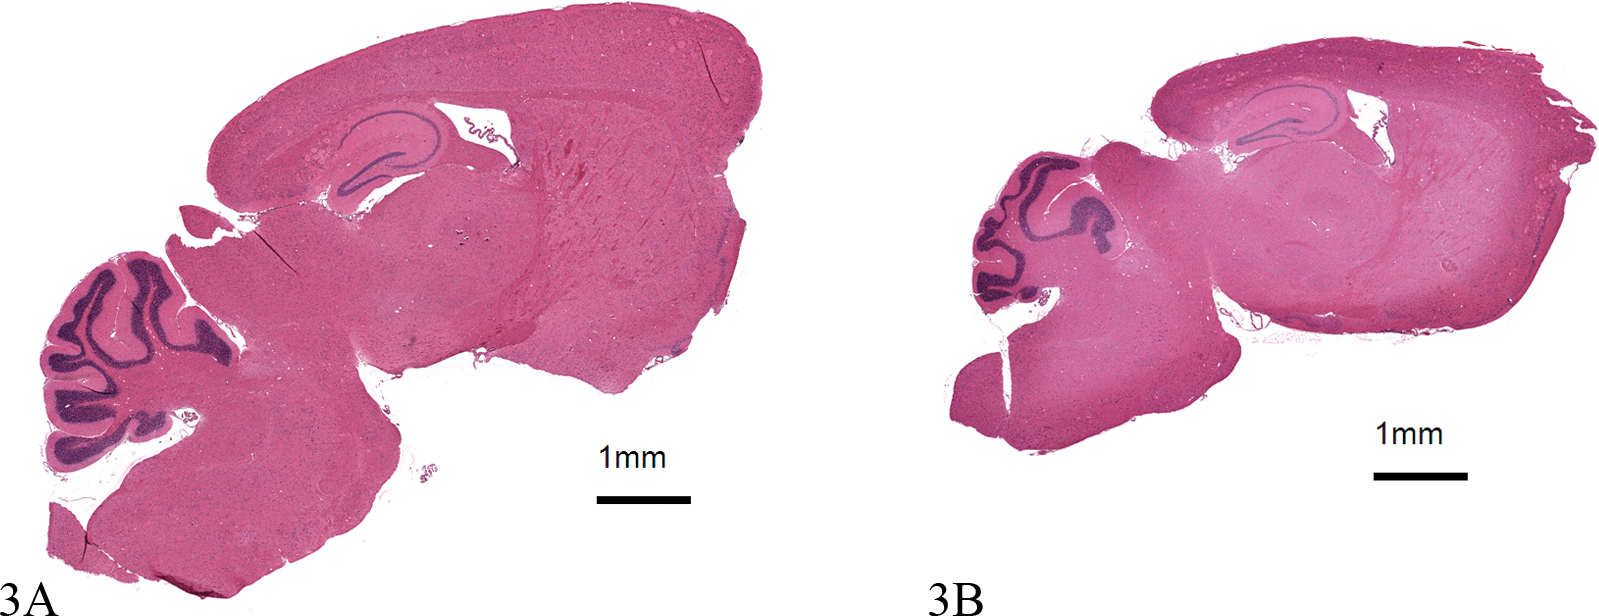
Effects of processing on tissue morphology. The two images represent horizontal sections of brain from two mice the same age, strain, and gender taken at approximately the same anatomic level. Area of the two images was determined using Visopharm software. 3A was processed normally; 3B was over dehydrated. Both visually and quantitatively, image 3A (50.4 mm2) is larger than image 3B (36.4 mm2). In addition, for IHC intensity measurements, one would expect differences between 3A and 3B because the compacted smaller tissue will have greater tissue density per unit area. There is little written on standardizing for the effects of processing; however, there are stereological methods to correct for this artifact. Both images stained with hematoxylin and eosin, 1.2×.
Embedding is where final orientation of the processed tissues occurs. Embedding tissues can have a great impact on preanalytic variability, especially for organs like skin that have an orientation that has to be respected. Although standardization of orientation is difficult for clinical samples, it is not difficult and is often essential for animal research where most organs, at least from laboratory rodents, are removed in toto. For laboratory animal studies, the orientation should be similar from tissue to tissue or if stereology is used for quantitation, there is actually an indication for “organized disorder” to perform uniform random sampling.
To summarize, there is no agreed-upon best practice for tissue processing or embedding as defined by even quasi-quantitative metrics. The development of microwave processing to speed the fixation and processing times adds a further variable that will need to be considered in the future for truly quantitative assessment of histologic sections.
Section Thickness
One of the most critical aspects of consistent staining of a histologic section is its thickness. Two points should be axiomatic: (1) the thicker the section, the darker the stain; and (2) the thinner the section, the greater the visual resolution. Both aspects have a major impact on reproducible quantification. There is debate among pathologists as to where the absolute “sweet spot” is for optimal section thickness. Taylor and Levenson (2006) reported that this “sweet spot” was approximately 5 µm and that “that uniform preparation of FFPE sections that are less than 5 µm in thickness is not possible.” In contrast, the recommended thickness for performing the Hercept test is 4 µm; and for many pharmas (including ours), the standard thickness of a histologic section is 3 µm (Wolff et al. 2007) (Figure 4).
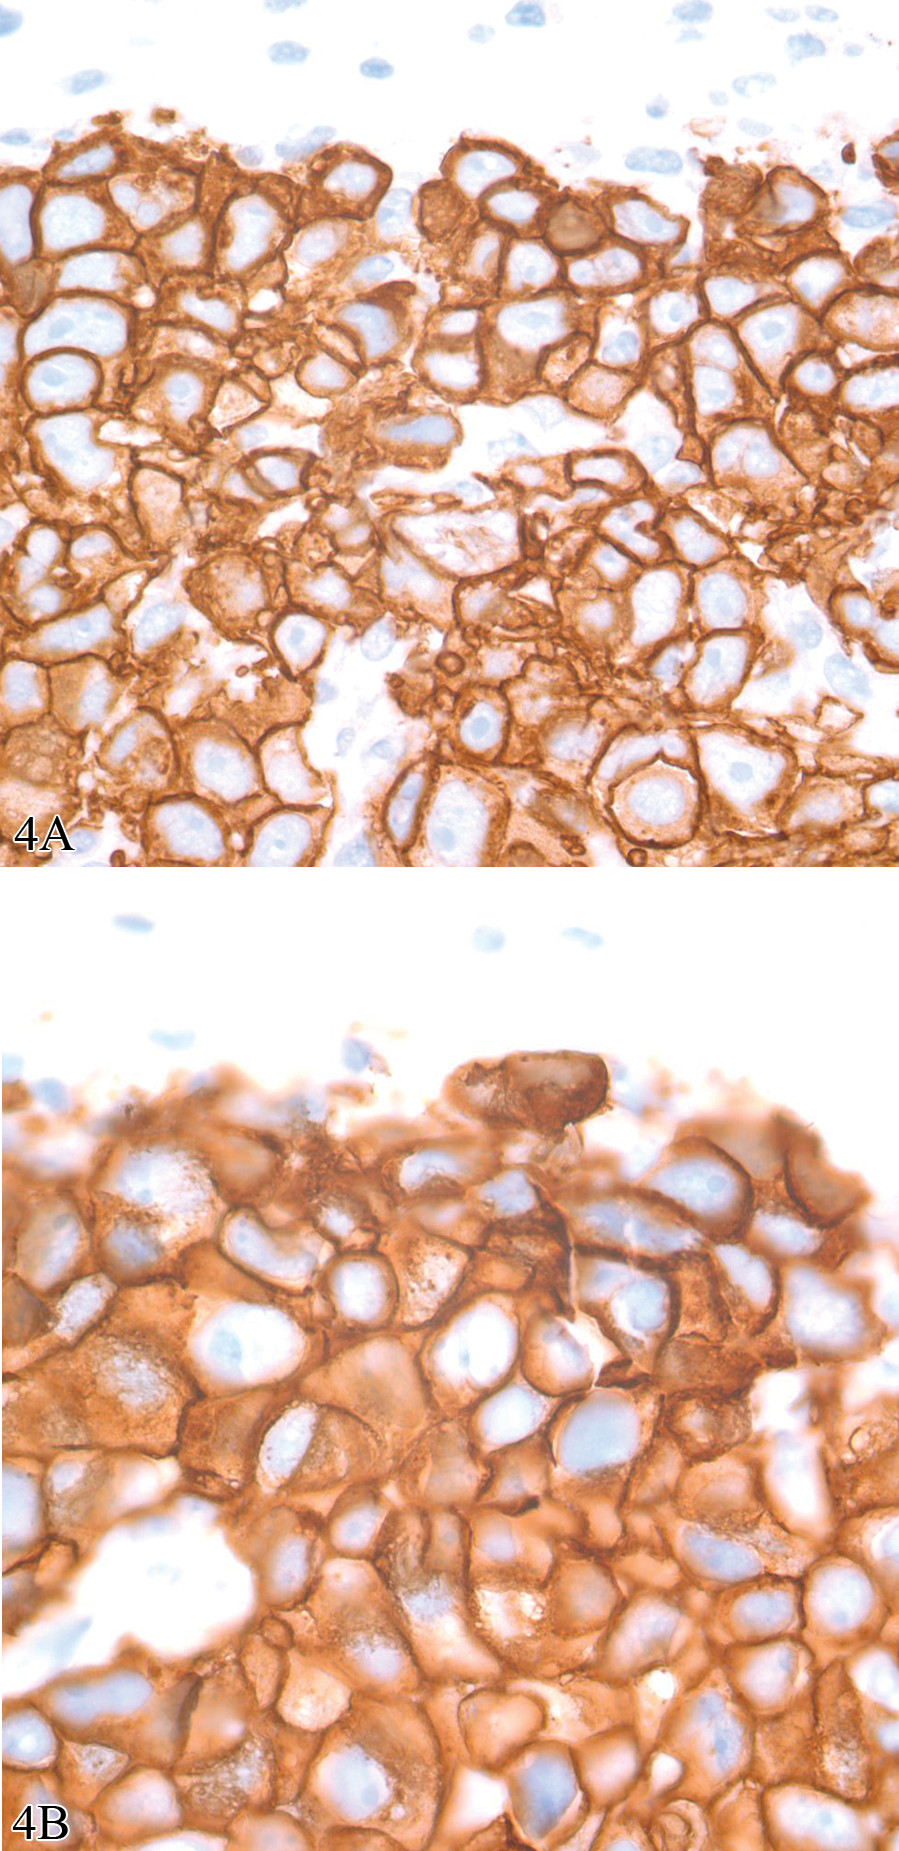
Photomicrographs of a human to mouse xenograft using BT474 cell line and immunostained using rabbit anti-human c-erb-2 oncoprotein antibody (HER2/Neu; DAKO# A0485). The two images are from consecutive sections. 4A was sectioned at 3 µm and 4B was sectioned at 5 µm. Although membrane staining can be discerned in images from both sections, it is better defined in the 3 µm thick section. In addition, the differences are so great that one could not accurately quantify the two sections using the same image analysis algorithm. Both images, diaminobenzidine with hematoxylin counter stain, 100×.
Only recently have the effects of section thickness been defined by quantitative assessment (A. Leong 2009). Little (2010) reported when a microtome was set at 4 µm, two experienced histotechnologists cut sections significantly thicker than 4 µm and that section thickness differed significantly between the histotechnologists. In addition, there was greater variability when these histotechnologists used the automated microtome setting than the manual setting. Dr. Little’s conclusion was that these differences could impact the reproducibility of image analysis algorithms.
For the future, there should be a global standard for section thickness to which all laboratories adhere for routine sectioning for IHC biomarkers assessment. In addition, automated microtomes are on the horizon (see http://www.kurabo.co.jp/bio/English/product/as-200.html). These instruments do not require the use of waterbaths, a potential source of tissue stretching. It remains to be seen if automated microtomes can decrease interuser variability and provide a more consistent section. In lieu of that, for determination of volume there are stereologic methods that can be used to accurately compensate for irregularity of section thickness (H. J. G. Gundersen, personal communication, 2011).
IHC Methods
In theory, IHC is simple to perform. It does not require expensive equipment to produce results, and almost any laboratory can develop a protocol with positive staining. However, using IHC for quantitation exposes it for what it is: a complex series of biochemical reactions in which no aspect of this complexity can be ignored, from the moment of collecting the specimen to issuance of the final report (Taylor 2000). Automated immunostainers have improved the quality of immunostains in many laboratories and have made a complex protocol seem so “set it and forget it” that fewer histotechnologists or pathologists understand the technical aspects of IHC the way they have done in the past making it more difficult for them to improve consistency while avoiding pitfalls and misinterpretation. In addition, automated immunostainers are not perfect: heat pads can fail, dispensers may be inaccurate, and reagents may not be as standardized as described. In short, automated immunostainers come with no guarantee of quality or reproducibility (Miller 2010; True 2008).
For over a generation, concerns have been expressed regarding the poor reproducibility of IHC staining methods. To this end, attempts have been made to standardize IHC assays upon which treatment decisions rest. However, to date, these approaches have failed to produce an overall system of IHC standards that ensure uniform high quality, with a level of reproducibility and reliability sufficient to allow robust comparison of IHC results across laboratories and platforms (T. Leong, Cooper, and Leong 2010; A. Leong and Leong 2011; Shi, Liu, and Taylor 2007; Taylor 2009). A study by the Canadian Immunohistochemistry Quality Control has confirmed this. Evaluating the performance of Canadian laboratories for proficiency in staining two of the most commonly used IHC assays (pan-cytokeratin and low molecular weight cytokeratin), Copete and colleagues (2011) reported that half of the 75 laboratories participating had inappropriately calibrated IHC tests for both markers. Both Type 1 (false positive) and Type 2 (false negative) errors were noted. Type 2 errors (not identifying cytokeratin expression when it was actually expressed in low amounts) occurred in 9 of 11 laboratories (81%). There is little evidence to support that clinical or research laboratories in the United States would fare better.
A list of some of the variables associated with development of an IHC assay are listed in Figure 2. Critical for standardization and the first step to the application of reference standards are appropriate positive and negative controls. For positive controls, at a minimum, both high-expressing and low-expressing tissues should be used. For IHC there are two types of “negative controls”: (1) a “reagent” negative control in which the primary antibody is omitted from the protocol or substituted by non-immune serum (ideally isotype specific) from the host species in which the primary antibody was derived; and (2) a “tissue” negative control, where the protocol is applied to tissues or cells known not to express the IHC target, the best being a knock-out animal (Ramos-Vara 2011; Taylor and Levenson 2006; Taylor 2009). For consistency, cells lines must be handled the same way as the tissue being examined with regards to time to fixation, time in fixation, processing, and so forth. They also should be placed on the slide being analyzed. Having “on-slide controls” is all but mandatory for quantitative assessment of intensity (as opposed to area above a given threshold). This can usually be accomplished using a mini-tissue microarray containing positive and negative expressing cell lines that is sectioned and placed alongside the tissue being analyzed.
Although appropriate controls are a major factor in standardizing IHC, equally as important—but an even greater challenge—is the development of a consistent immunoassay between laboratories, especially given the diversity of reagents, methods, and machines now available for performing this technique. Considerations start with antibody selection and epitope retrieval but also involve incubation times and temperatures; buffers; dilutions of primary, secondary, and in some cases, tertiary antibodies; antigen retrieval methods; and choice of chromogens or fluorophores. Even differences in counterstains such as the type of hematoxylin used can have a major impact on defining the area of interest (Figure 5).
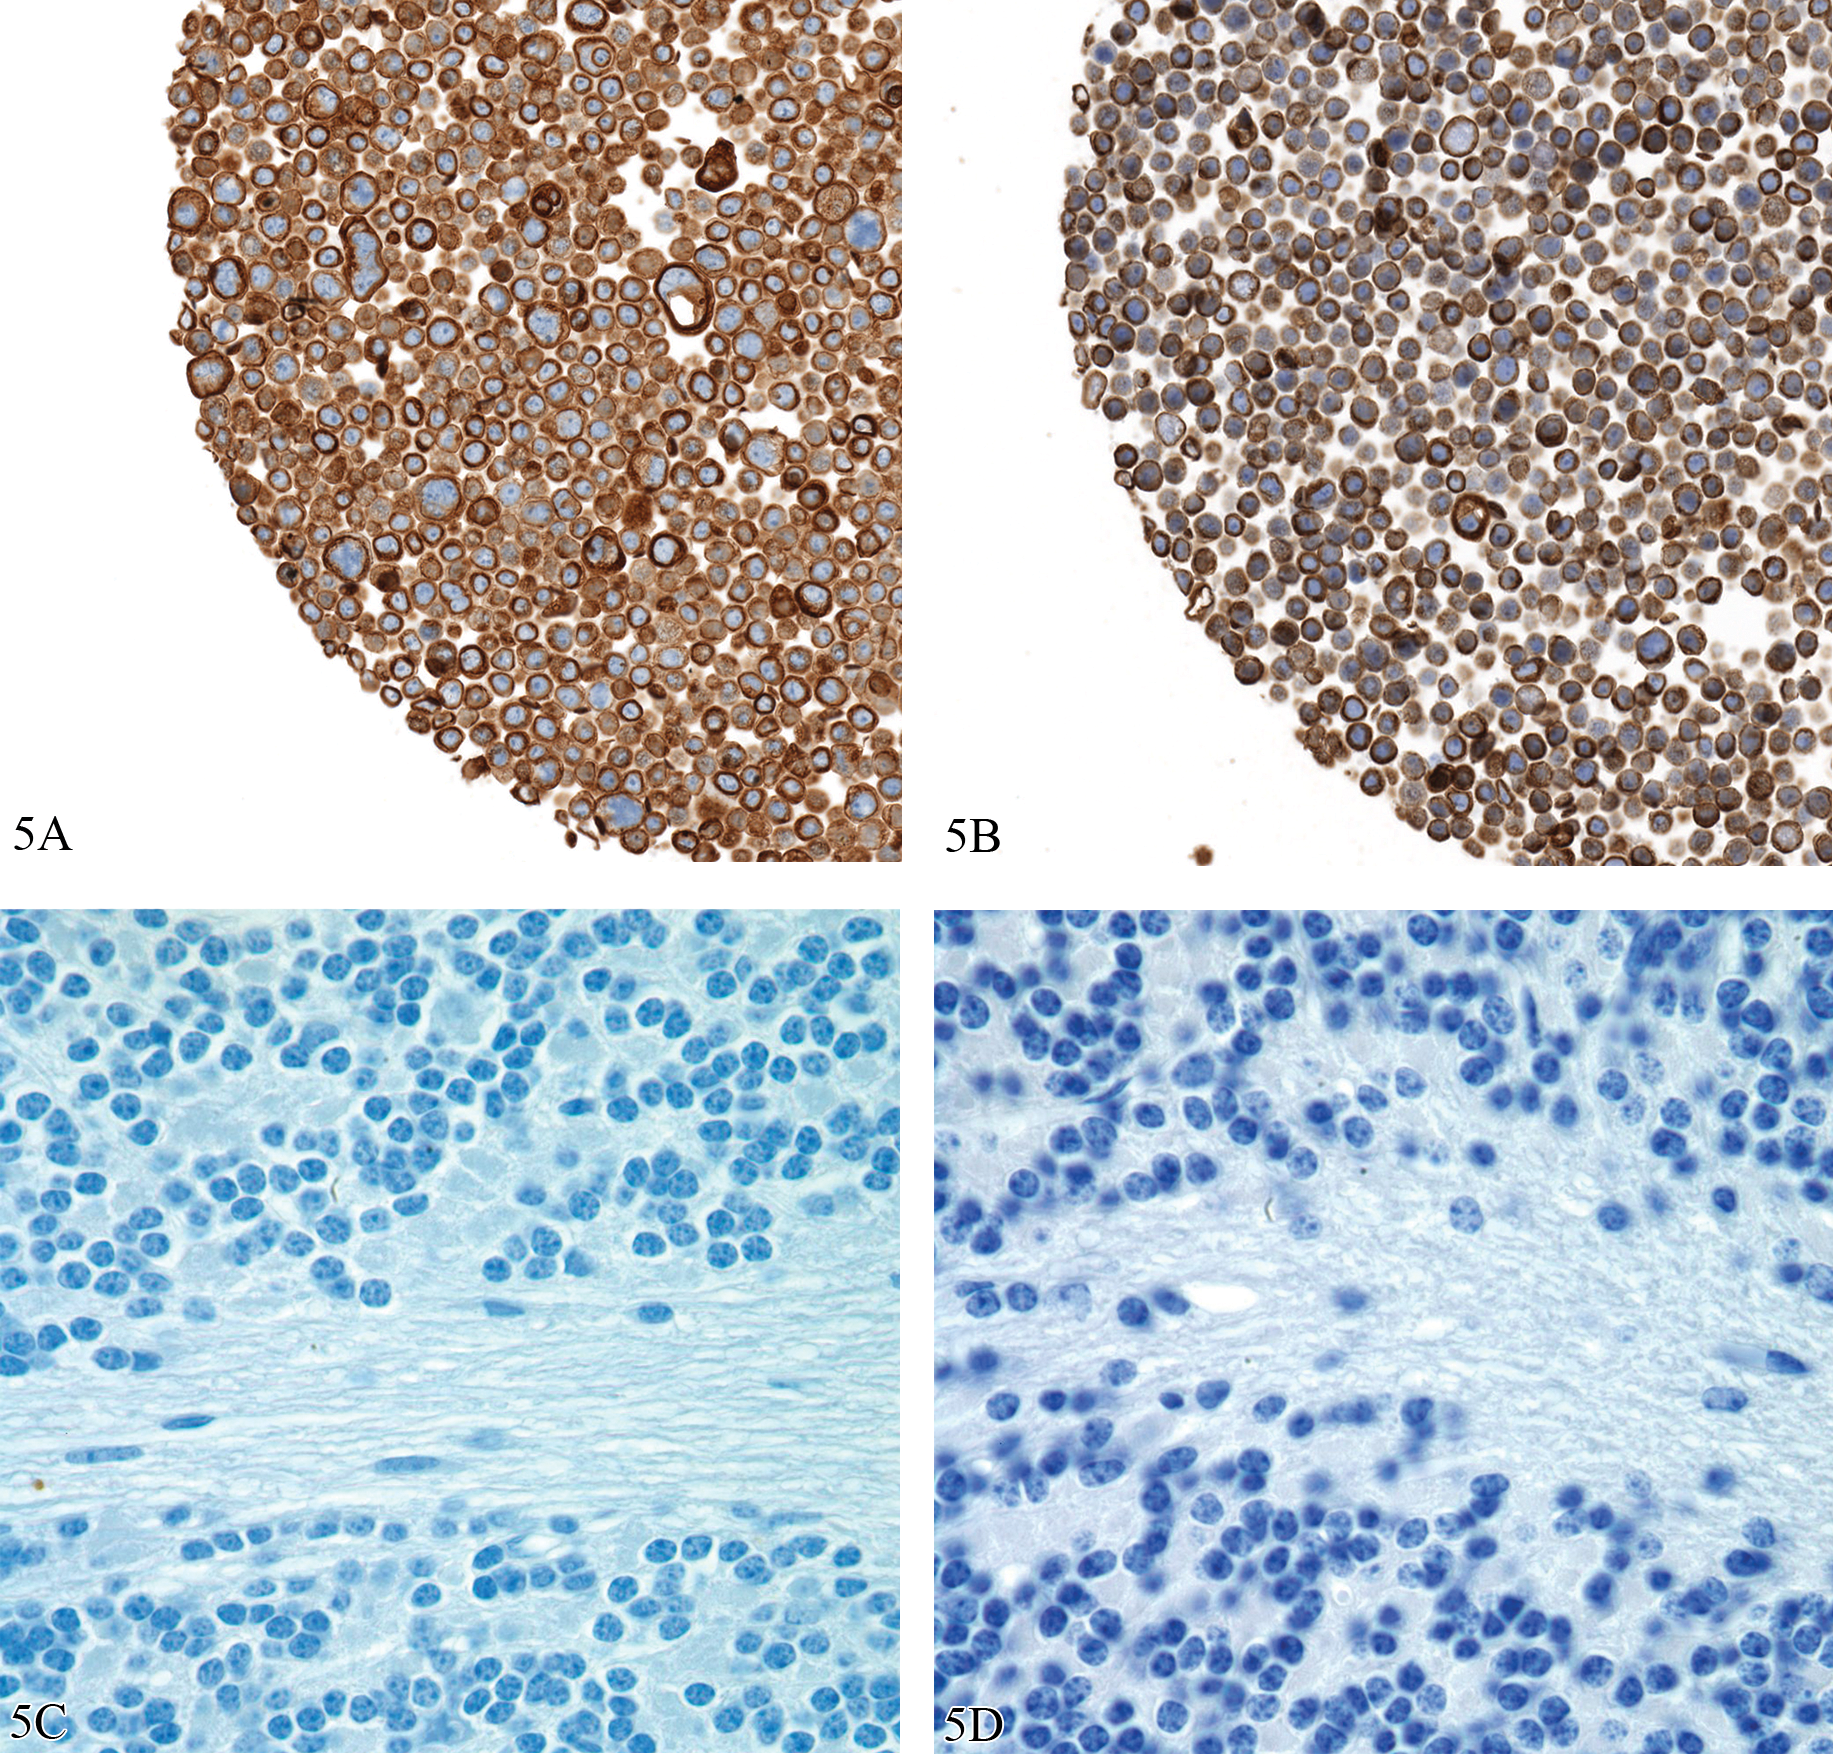
Effects of chromogens and counterstains on immunohistochemistry results. 5A and 5B are images of sections of a mini tissue microarray made from cultured cells from the WiDR cell line that were formalin fixed and paraffin embedded and stained for cytokeratins using mouse anti-human cytokeratin AE1/AE3 antibody (Dako #M3515). 5A is stained on a Ventana Discovery XT and 5B stained on a DAKO Autostainer; both followed recommended protocols. 5C and 5D are counterstained with Ventana Hematoxylin and Dako Automation Hematoxylin Histological Staining Reagent, respectively. IHC staining using both immunostainers was successful, and the hematoxylins are both of such good quality they are subject to pathologist preference. However, intensity differences between chromogens and counterstains are such that different image analysis algorithms would need to be written to define cytokeratin expression in sections stained using Ventana and the DAKO protocols. 5A and 5B, Diaminobenzidine with hematoxylin counter stain, 20X; 5C and 5D, hematoxylin, 100×.
In summary, the use of morphology-based quantitation of protein expression for biomarkers requires that the IHC assay transition from a “stain” to an immunoassay with equivalent accuracy and precision equivalent to an ELISA (enzyme-linked immunosorbent assay) tests (Cummings et al. 2008; Taylor 2009). Finally, the goal of personalized medicine is not to define the expression of a single protein but rather to place the expression of the protein in the context of a pathway that predicts the response to specific targeted therapies as well as to recognize reasons for disease resistance—whether due to compensatory mutations in a pathway at the time of diagnosis or to new mutation that may arise in the context of tumor progression. Thus, the next step for tissue-based diagnostics is to develop multiplex IHC, an area of undeveloped potential (Chung and Hewitt 2009; Seel et al. 2007).
Qualitative/Descriptive Analysis of Histologic Sections
The current “gold standard” for making a diagnosis, assessing immunopositivity, or even evaluation of staining quality—whether it be histochemical or immunohistochemical—is the visual examination of a histologic section by one or more well-trained pathologists. Any human evaluation is based on subjective visual assessment and is thus susceptible to bias and interobserver variability (Fandel et al. 2008; Hamilton et al. 2010).
The problems associated with any group of pathologists determining an accurate histologic diagnosis in anatomic pathology were demonstrated during a recent meeting of the FDA Hematology and Pathology Devices Panel during their discussion about how to “validate” whole slide imaging systems. Because of the presumed interobserver variability even within a panel of experts, it was strongly considered that these instruments may be best assessed by using an intrareader design where the correctness of the diagnosis was not important. In an intra-reader design, truth doesn’t matter. What matters is how much the reader agrees with himself or herself. So if they say this is cancer the first time around and they were wrong, nobody cares, as long as the second time around, they say it’s cancer too. (FDA 2010)
None of the current IHC assays that are approved by the FDA as diagnostic, prognostic, or predictive biomarkers make any claim that they are more accurate than visual assessment by a pathologist. If morphology-based biomarkers are to be used for quantitation, pathologists have to accept that instrument quantification has the potential to be more accurate and reproducible than their eyes.
Studies have demonstrated that even the quantification of distinctive and prognostically important features of a tumor such as mitotic figures or nuclear atypia can be associated with significant interobserver variability.
1
Tsuda et al. (2000) reported an evaluation of mitoses and cellular atypia based on analysis of 20 tumors stained with hematoxylin and eosin examined by 14 pathologists. Interobserver agreement of mitotic counts was moderate (κ = .506), and that of nuclear atypia scoring was slight to fair (κ = .265). When IHC for Ki-67 was used to define proliferation in a series of tumor tissue microarrays, interobserver agreement within each laboratory participating was substantial (κ = .700), suggesting that immunostaining is a more accurate way to assess mitoses than by H&E stained sections; unfortunately, interlaboratory variability was very high due to a considerable lack of standardization and poor inter-laboratory reproducibility in determining the Ki-67 index of a given tissue. In none of the tissues included in the study were all the participating laboratories able to agree on the same Ki-67 labeling index, demonstrating a high inter-laboratory variability for a marker believed to be well established. (Mengel et al. 2002, 296)
There is a body of literature in which the agreement among pathologists (or lack thereof) has been assessed, generally with kappa coefficients in the moderate to substantial ranges, only a few of which are cited (Coco et al. 2011; Dalton, Page, and Dupont 1994; Engers 2007; Farmer, Gonin, and Hanna 1996; Foucar 1998, 2005; Longacre et al. 2006; McCluggage et al. 2011; Mongomery 2005; Sloane et al. 1999; van den Bent 2010). Fortunately, when specific criteria for diagnoses or grading are clearly defined, there is less interobserver variability (Carlson et al. 1998; Komaki, Sano, and Tangoku 2006; Letourneux et al. 2006; Longacre et al. 2006; Rugge et al. 2002). In short, there is little evidence that the “art of pathology” improves diagnostic accuracy, but there is considerable evidence that well-defined objective and quantifiable criteria for disease diagnosis or tumor grading improves the reproducibility of morphologic assessment. The more specific criteria that are defined, the better that image analysis of digitized images, which is designed to apply criteria in a consistent and unbiased manner, can serve as a “pathologist’s aide” in confirming criteria for diagnosis or features such as tumor grade.
Whole Slide Imaging
It is hard to imagine that a morphology-based assay such as IHC could be validated or the results precisely reproduced upon reanalysis without the use of whole slide imaging (WSI) technology. WSI has rapidly evolved over the past 5 years, yet acceptance by most anatomic pathologists has been rather lukewarm. Some of the criticism directed against pathology as a profession slow to adapt to new technologies is perhaps valid; however, in spite of manufacturers’ claims, only the current generation of WSI solutions may have the potential to replace a conventional bright field microscope.
Current virtual microscope cameras and monitors have a pixel resolution that makes digital evaluation the equivalent of a high-quality optical microscope (Hedvat 2010; Rojo et al. 2006; Ying and Monticello 2006). More importantly, studies where the old and the new technologies are compared consistently demonstrate no difference in establishing a diagnosis (in light of the problems defining what is a correct diagnosis [see above]) (Evered et al. 2010; Koch et al. 2009; Mooney et al. 2011). Nevertheless, there remain seven major areas that need to be addressed before pathology adopts virtual microscopy and its widespread use can be applied to IHC biomarker assessment.
Improved ergonomics. Current WSI systems require the pathologist to navigate the digital slide image using a standard mouse and pad. For the typical pathologist who views hundreds of slides per day, current slide viewing technology is a prescription for repetitive motion injury.
Inapparent screen refresh time. Although markedly improved, even small delays (>75 msec) in having the monitor displaying the image in a new field of view is a major disruption to the workflow and productivity of a pathologist and increases the time needed to make a diagnosis (Mackenzie and Ware 1993).
The standard scan magnification needs to be 40×. Although used much less than other non-oil-requiring objectives by anatomic pathologists, very few pathologists would feel confident if the 40× objective on their microscopes were removed because it is essential for defining certain cytological features. Thus, a requirement for WSI is the need for 40× magnification with a low micron/pixel resolution and image quality that is similar to that seen using an optical microscope. In the authors’ experience, very few WSI scanning systems offer this feature with rapid scan speeds.
Consistent in-focus scans. Many current WSI systems establish focus by sampling the tissue being imaged. Unfortunately, due to variations in tissue thickness, focusing by this method almost invariably is associated with regions that are out of focus when a slide is scanned at 40×. This is troublesome to a pathologist and unacceptable for image analysis (Figure 6). Focal point scanning needs to be replaced by methods in which the entire tissue is placed in focus, not just sampling points on the tissue. Fortunately, methods such as rapid focusing on each tile, dynamic focusing, and continuous focus for line scanning systems are now available that should solve the focus problem.
FDA approval. WSI systems are unfortunately too “regulatable.” We were unable to find a single FDA regulation or guidance document with regards to the resolution of an optical microscope or requirements for the vision of the pathologists reading slides. In contrast, concerns abound about every aspect of WSI simply because every aspect from the method of acquisition to storage can be defined (FDA 2010). FDA approval of any medical device used in a diagnostic capacity is in the best interests of pathologist and patient alike; however, requiring diagnostic equivalence rather than resolution equivalence is in the best interests of neither especially since no reproducible gold standard for diagnostic accuracy exists. A requirement for diagnostic equivalence could delay the use of WSI systems, for many years.
Address the quality-time-cost conundrum. A major reason why most pathologists have not accepted WSI is that the technology is expensive, and it has not been established that it will improve the accuracy of their diagnoses, decrease the time spent evaluating a glass slide, or save money through less tangible aspects (lack of slide breakage, easier to file images, etc.). Groundwork has to be done by WSI adopters and manufacturers to build business cases, conduct time in motion studies, and create justification plans for the implementation of WSI solution.
Incorporate DICOM standards. Manufacturers of WSI need to comply with the new DICOM (Digital Imaging and Communications in Medicine) WSI standard described in DICOM Supplement 145 (ftp://medical.nema.org/medical/dicom/final/sup145_ft.pdf). DICOM is a standard for handling, storing, printing, and transmitting information in medical imaging established by the American College of Radiology and the National Electrical Manufacturers Association that is applied to almost all imaging technologies, except WSI.
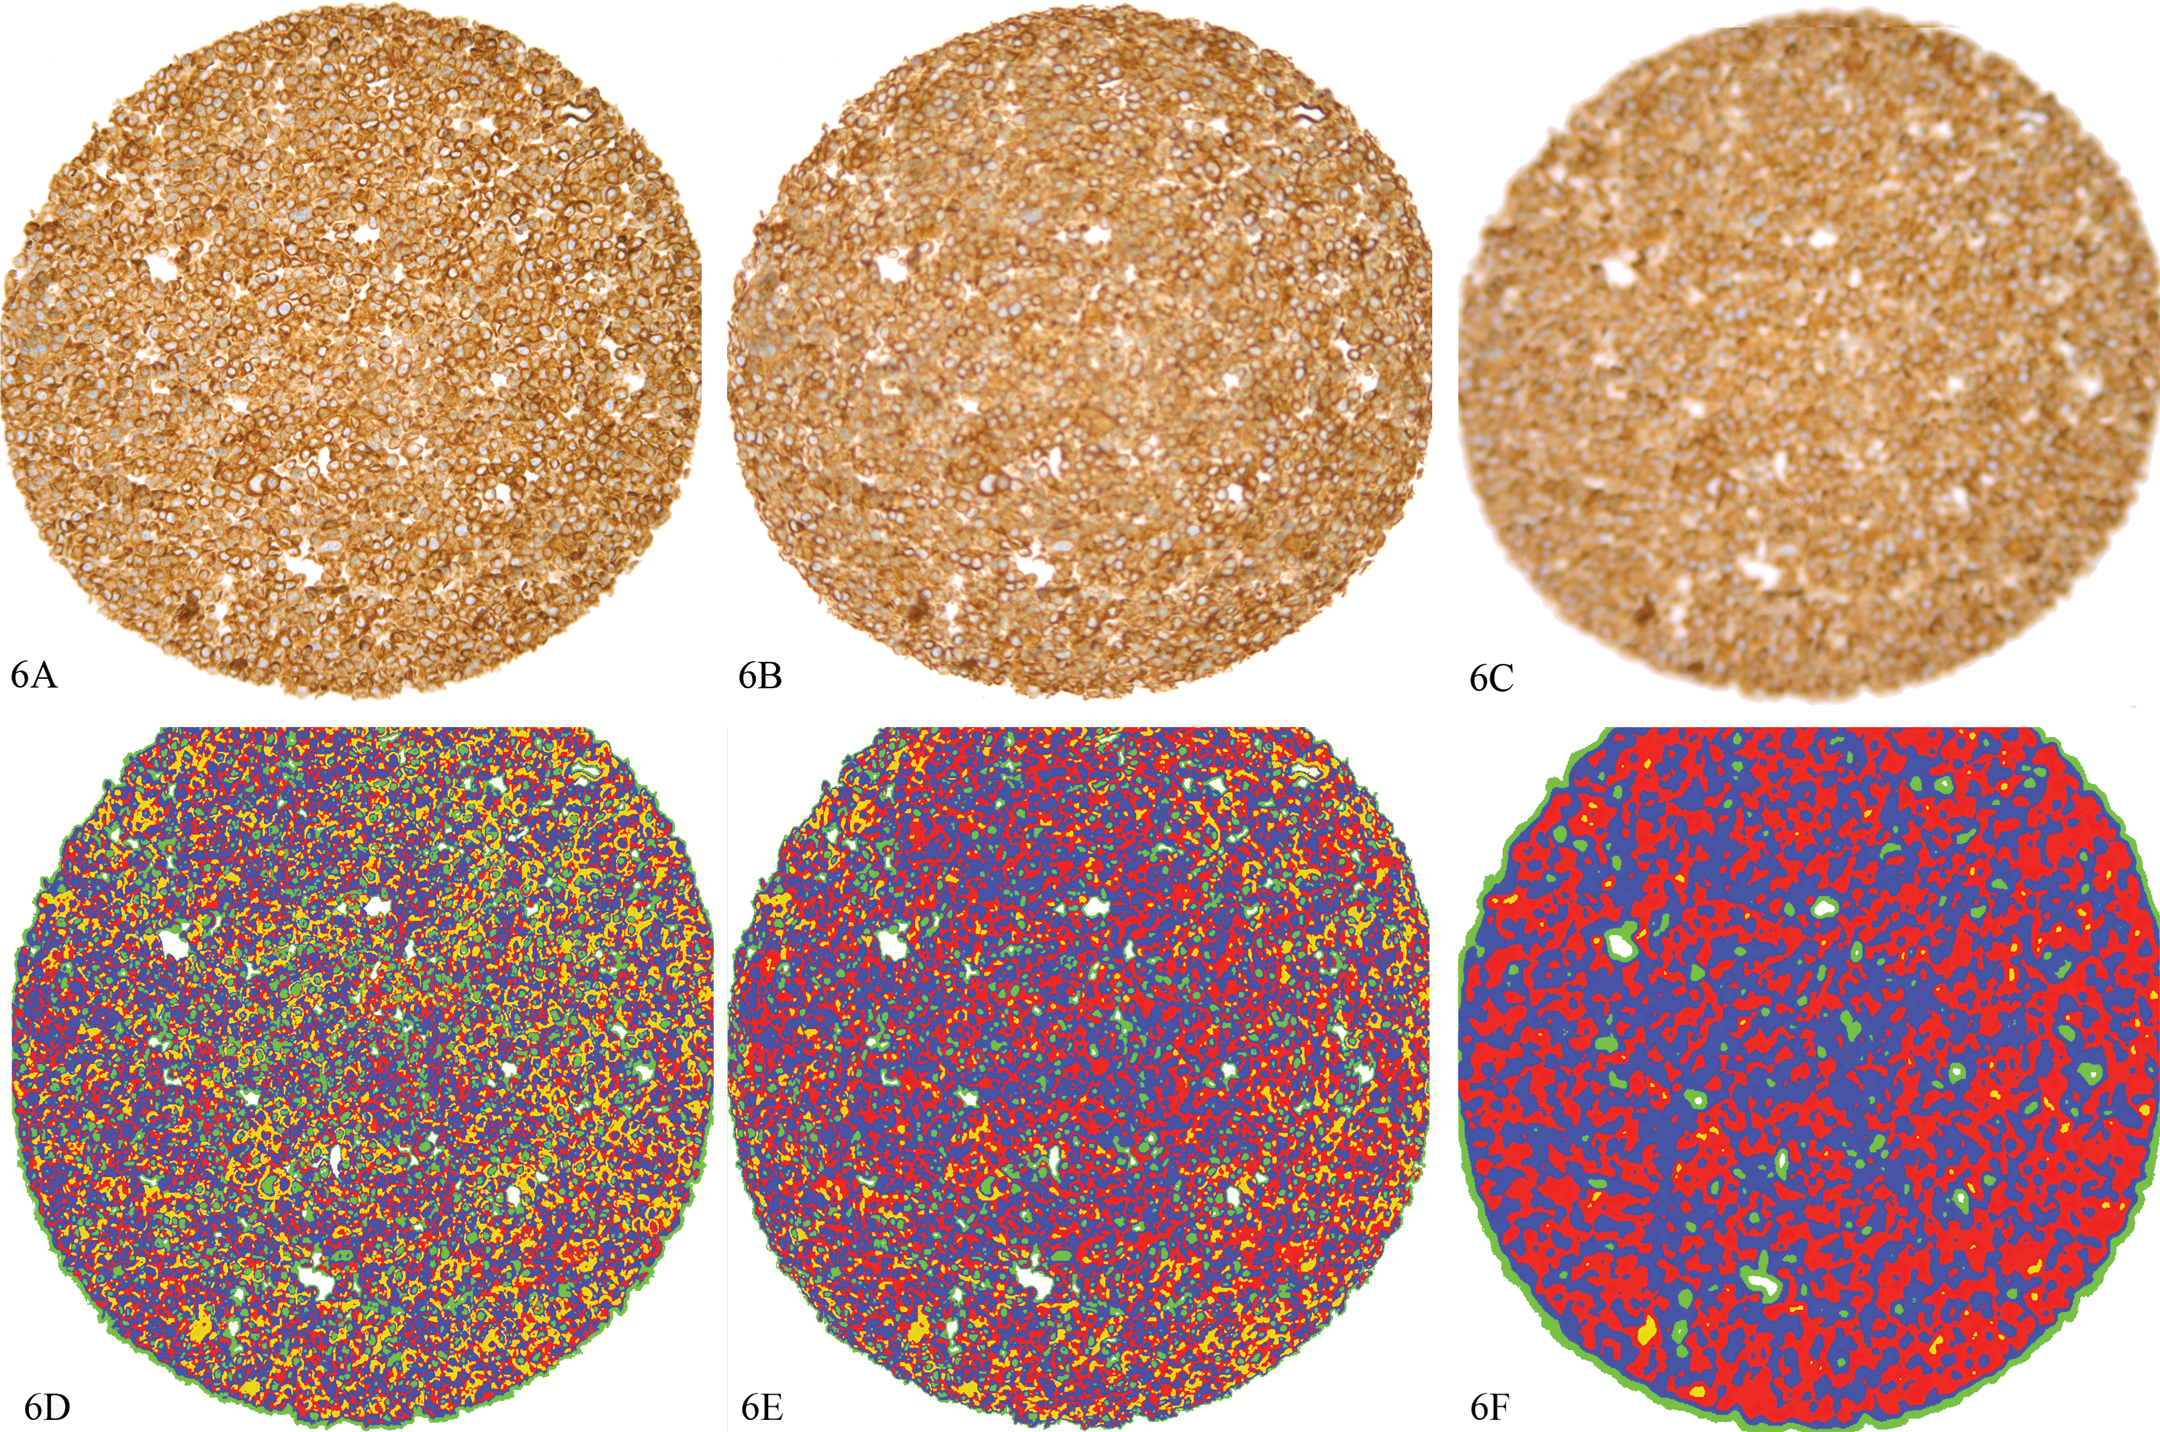
Effects of focus on image intensity. A section from the same tissue microarray as Figure 5 with staining for AE1/AE3. 6A represents an image that is focused; 6B, the same section moderately out of focus; 6C, the same section highly out of focus. 6D–6F represent analyses of the spots corresponding to 6A–6C, respectively, analyzed with the same algorithm using Visiopharm software. Thresholding was used to visually bin the intensity into 4 categories: yellow = 0–99.99 intensity units; red = 100–149.99 intensity units; blue = 150–199.99 intensity units; green = 200–243.99 intensity units, clear = 244–255 intensity units. Decreasing the focus has a similar effect as a mean filter, i.e., the image is “smoothed,” there is a loss of detail, and the extreme intensities (yellow and green in this example) are decreased. Mean intensity for 6A/6D = 148.13; 6B/6E = 149.64; 6C/6F = 155.61. Diaminobenzidine with hematoxylin counter stain, 20×.
Although a number of the technical aspects are being addressed by the next-generation scanners, all of these issues will need to be addressed before there can be reasonable assurance of acceptance by the anatomic pathology community. Until that time, digitization of anatomic pathology slides will remain a specialized tool for teaching, obtaining second opinions, and image analysis. This is unfortunate because WSI is critical for the standardization of anatomic pathology.
Quantitative Assessment of Morphologic Changes
As with WSI, there have been marked improvements in the ability of software programs to organize and then quantify pixels arranged in patterns that characterize a feature of interest to a pathologist. These programs are associated with an increasing number of publications that indicate quantitative morphometry is the equivalent of microscopic evaluation by conventional optical microscopy (Bernardo et al. 2009; Lloyd et al. 2011; Rojo, Bueno, and Slodkowska 2009; Słodkowska et al. 2011).
Most imaging systems use 8-bit depth color graphics. With the RGB color model, a pixel contains information related to the extent of red, green, or blue color channels, each with a 1–256 (28 or 8 bit) intensity range. In brightfield microscopy, where light is absorbed by the specimen, the most intense red, green, or blue color would be assigned a value of 255, where the dimmest (darkest) color would be assigned a value of 0. Thus, black is the absence of color and is given the value of 0 in all three channels; white is given a value of 255. Considering that 8 bits of information per color translates into 16,777,216 colors, 8 bit color graphics allows for the detection of very subtle color differences. To summarize, all digital images consist of pixels, and all pixels consist of numerical values that define colors, allowing the color pattern to be mathematically manipulated and analyzed (Castleman 2008).
Although the process is called “image analysis,” in reality, the difficult aspect of extracting meaningful numerical data from an image is processing the image using a series of mathematical formulas that separate a digital image into regions with similar characteristics based on features such as color, intensity, or texture (the spatial arrangement of the colors). One should realize that all image analysis software uses essentially the same mathematical formulas to manipulate the pixels. What differs is the ease of use and creative options to use these formulas for rapid and accurate definition relevant areas.
Image processing is complicated, often involving dozens of preprocessing, classifying, and postprocessing steps. As software is evolving, there are now products that offer “unsupervised” processing, meaning with limited training; the software will run through a series of algorithms that “automatically” define the structure of interest. In contrast, most processing programs use “supervised” methods, meaning the steps are programmed by a scientist-programmer with little decision-making capacity offered by the program. One can currently debate as to which is better; however, there will inevitably be the development of a “Watson” type of image analysis software where an unsupervised program will far outperform one developed by any given programmer. Regardless of the method used, once an image is processed and the area on the image to be quantified is defined, image analysis, the quantitative description of a structure, is relatively straightforward (Grunkin, Raundahl, and Foged 2011; Rojo, Bueno, and Slodkowska 2009).
At present, the limiting factor in performing quantitative analysis is not in the software performing the analysis; rather, it is the quality of the image being quantified. Quantitative assessment is performed on a tissue section that has gone through the series of steps described, each with a cumulative variability. This variability becomes obvious when critically analyzed, and it is often extremely challenging to develop an image analysis algorithm that can be applied without modification through a series of studies/samples over time without adjustment.
The basic objective in successfully performing quantitative analysis on a histologic section is to “increase the signal of interest and decrease the background noise in a consistent manner.” Three major considerations help fulfill this objective.
Optimize staining protocols from start to finish. Critical factors include specimen collection and transport, fixation, tissue trimming, processing and embedding, section thickness, and the quality of the digital image.
Realize that the numerator and the denominator of an image analysis equation are equally important. Data from morphometric analyses are always presented as a ratio, for example, the amount of the target of interest expressed by IHC relative to the cells or area in which the target of interest is expressed (usually defined by a counterstain or second IHC stain). Often, the more difficult image analysis problem is defining the area of interest not stained by IHC methods that define the target. For example, in tumors, monochromatic stains such as hematoxylin do not distinguish cells expressing the target of interest from adjacent stroma. For this reason, using polychromatic stains such as periodic acid Schiff (PAS) may better define this region of interest. HistoRx (New Haven, CT) has developed a fluorescent method for quantifying targets primarily in epithelial tumors using a fluorescent pan-cytokeratin IHC marker to define epithelial cells and then quantifying the target in these cells stained with a second fluorophore (McCabe et al. 2005). This is an excellent method, but it too requires scrutiny because one loses tissue context with fluorescence and pan-cytokeratin staining may not always define all epithelial cells causing an inaccurate estimate of the denominator. Registration of one section stained with cytokeratin and a consecutive section stained with the target is an emerging method for quantitation of target in a epithelial cells but is still early in its development.
Considering stereological principles when designing an image analysis study. Applying systematic uniform random sampling and recognition of the number of sections needed to analyze are critical to ensure an accurate three-dimensional representation of the sample in image analysis problems (Boyce et al. 2010; Howard and Reed 2005). Sample size and sampling methods of a three-dimensional tissue cannot be compensated by optimizing staining methods and are hard to correct ex post facto. Publishing quantitative results in many neurology and respiratory journals requires an obeisance to stereology. Curiously, papers using stereology in the oncology are rare, with most tumor characteristics measured on single sections in two dimensions. This is surprising considering that tumors may be extremely heterogeneous genotypically and phenotypically and systematic uniform random sampling could be critical in defining this emerging concept (Hsia et al. 2010; Navin and Hicks 2010).
Conclusions
The current theory in biomarker development is that they must be “fit for purpose,” that there be an evaluation of science around the target, and that the best method for its assessment is used (Lee 2009; Cummings et al. 2010). However, trying to understand why so few predictive biomarkers, the keystone of personalized medicine, have been developed suggests a biomedical quandary. Non-morphologic genomic, transcriptomic, and proteomic methods can be accurately quantified with reference standards; but they are generally performed on biased samples, that is, the results cannot be correlated with the diversity of cells in the tissues from which they were obtained. In contrast, morphology-based methods using IHC clearly define the cells in which a target is being expressed but, to date, are extremely difficult to quantify using reference standards. In short, neither provides the biological precision needed to quantitatively define disease.
It will be interesting to see how the discipline of anatomic pathology will define itself over the next decade considering the need for biomarkers and the potential value inherent in correlating morphology with target expression using IHC methods. We envision three possible scenarios, and all or some undoubtedly will struggle for primacy.
Do nothing. The discipline of anatomic pathology can remain unchanged, adding value primarily by nonquantitative description and diagnosis via visual assessment. There will always be a need for the skill set pathologists posses, but this is not a prescription for a discipline that will expand or attract the best and brightest minds in the future.
Take ownership. In this scenario, the discipline realizes the underutilized potential of the tissue samples we examine and the need to convert a primarily descriptive discipline to one that is largely quantitative in order to improve consistency and accuracy and to use tissue morphology as a central component of biomarker assessment. To accomplish this, there will need to be an organized dissection of the preanalytic variables involved in tissue analysis to establish processes that markedly decrease interlaboratory variability to the point where it can be determined if reference standards can be applied to IHC or other morphology-based methods. This may require changing fixatives, treating all tissue samples in a manner that preserves all molecular targets including modified proteins and RNA, as well as analyzing many more sections from the same sample to minimize variability.
Focus on strengths, jettison weaknesses, and selectively collaborate. In this scenario, the pathology community recognizes the need for quantitative assessment of target pathways but accepts the difficulty in handling tissues and concedes that other technologies are better “fit for purpose” for biomarker development than morphologic interpretation of tissue. In this option, pathologists need to become facile with established and emerging technologies that range from molecular biology to bioimaging. Note that if we accept scenario 3, pathology will still be obligated to improve the standardization of how tissues are handled as defined in scenario 2.
In summary, we believe a strong case can be made that if pathology wants to merge the traditional discipline of morphologic assessment in the rapidly evolving space of biomarker development, there is no realistic option other than to make the transition from a descriptive to a primarily quantitative discipline via standardization. This evolution is dependent on the development and FDA approval of WSI so it can replace ocular microscopes. Without WSI there can be no digitization, without digitization there can be no quantification, and without quantification there can be no standardization of processes.
Lastly, we acknowledge that that preanalytic standardization on human tissues in hospitals will be extremely difficult to implement where pathologists are often dependent on the whims of surgeons as to when samples are delivered and acquisition of similarly handled control tissue can be hard to obtain. However, anatomic pathologists working in pharmaceutical research have access to large numbers of laboratory animal samples and technology the equivalent of or better than that in major medical centers. Here, in the biopharma environment, methods could be established for optimizing tissue handling, fixation, processing, staining, and scanning—all of which should be highly translatable to clinical laboratories. One would suspect organizations such as the Critical Path Institute (CPATH) or International Life Sciences Institute (ILSI) could sponsor initiatives that would truly take advantage of the one medicine concept to improve not only the quality of research for drug development but the health and well-being of all who rely on pathologists for a diagnosis.
Footnotes
Acknowledgments
The authors would like to thank Rogley W. Boyce, Michael Grunkin, Patrick Martin, and Katherine Zokowski for their helpful comments. All work depicted was performed in the Comparative Pathology Laboratory at Biogen Idec.
Notes
R. W. Dunstan, K. A. Wharton, and C. Quigley are employees of Biogen Idec and have no other conflicts of interest. A. Lowe is the owner of Digital Pathology Consultants and has no other conflicts of interest.