
Abstract
The continuing education course on integrating clinical and anatomical pathology data was designed to communicate the importance of using a weight of evidence approach to interpret safety findings in toxicology studies. This approach is necessary, as neither clinical nor anatomic pathology data can be relied upon in isolation to fully understand the relationship between study findings and the test article. Basic principles for correlating anatomic pathology and clinical pathology findings and for integrating these with other study end points were reviewed. To highlight these relationships, a series of case examples, presented jointly by a clinical pathologist and an anatomic pathologist, were used to illustrate the collaborative effort required between clinical and anatomical pathologists. In addition, the diagnostic utility of traditional liver biomarkers was discussed using results from a meta-analysis of rat hepatobiliary marker and histopathology data. This discussion also included examples of traditional and novel liver and renal biomarker data implementation in nonclinical toxicology studies to illustrate the relationship between discrete changes in biochemistry and tissue morphology.
Keywords
Introduction
Interpreting safety findings and their relationship to test article in preclinical toxicology studies can be challenging and requires the use of a weight of evidence approach. Anatomic and clinical pathology data play critical roles, and both are needed to fully characterize test article–related findings. The continuing education (CE) course on integrating clinical and anatomic pathology held at the 2016 Annual Symposium of the Society of Toxicologic Pathology was conducted with three objectives in mind. The first was to highlight the general approach required to identify correlations and to discuss reasons for nonconcordance. The second objective was to present a series of case examples that emphasize the need for correlation between anatomic and clinical pathology to accurately interpret safety findings in toxicology studies. The last objective was to understand the diagnostic utility of traditional and novel biomarkers, with a specific focus on markers of liver and kidney injury, through use of results from a large meta-analysis of traditional hepatobiliary marker performance and presentation of practical considerations for interpretation of urinary biomarker data.
Principles for Correlating Anatomic and Clinical Pathology Findings in Toxicology Studies—Teasing Out Cause and Effect
Lila Ramaiah
Introduction
In principle, the formation of cohesive and well-supported conclusions from animal safety data should be straightforward, based on the availability of comprehensive data sets including toxicokinetics (TK), clinical signs, body weight and food consumption, clinical pathology, organ weight, necropsy, and microscopic pathology changes. However, toxicologic pathologists are often challenged with discordant results that complicate interpretations. Here we discuss pragmatic guidelines for correlating data in the toxicology setting and general principles for addressing discordance.
Why correlate?
Correlation can be leveraged to support decision-making. The first correlation we make in toxicity studies is dose/exposure and response/effect. In a well-designed toxicity study, causality in the dose–response relationship is supported by the use of control groups, dose proportionality, timing, and mechanistic plausibility. Correlation allows investigators to connect the dots and build a cohesive narrative rather than a mechanical listing of differences from controls. Correlations provide a weight of evidence that may indicate the pathogenesis of a test article–related effect and help scientists support their study data interpretations and avoid speculation. In addition, correlations can be leveraged to justify adversity, which relies heavily on integration of clinical pathology, anatomic pathology, and in-life findings. Finally, correlation promotes communication and collective intelligence, enhancing the quality of the final integrated report.
How? Correlation is an iterative and collaborative process
Toxicologic pathologists generally begin by evaluating a single data set and making decisions based on comparison to controls, dose relationship, incidence, and magnitude. Some test article–related findings are obvious on their own merit based on dose relationship, and these can be reported with relative ease. However, many abnormal findings are not clearly test article related. These include findings observed in individual animals, changes of low incidence or magnitude/severity, or those lacking dose relationship. Equivocal findings should not be dismissed until their relevance is clarified by evaluation of other study findings. Therefore, the initial interpretation prior to correlation may include equivocal or individual animal findings and involve use of low thresholds (decision point for calling a change test article related). The preliminary anatomic or clinical pathology report as a stand-alone contributing scientist report is provided to other study scientists as they each begin to make correlations and build a weight of evidence for interpretations.
Reading another scientist’s contributor report may not be sufficient to identify all correlations with one’s own data set, particularly if high thresholds were used or if individual animal findings and spontaneous, background, or procedure-related changes were not identified. For example, a marked increase in creatinine concentration observed in a single high-dose animal may not have been described in the anatomic pathology report because it was due to a spontaneously occurring renal lesion. The clinical pathologist must therefore refer to individual animal data to confirm that the creatinine increase was not test article related. Therefore, individual animal data may need to be interrogated for all study findings as appropriate (exposure, in life, electrocardiogram, immunology, biomarkers, clinical pathology, anatomic pathology, known pharmacology, etc.). As correlations are identified, findings that were initially equivocal may be more confidently interpreted. Furthermore, when armed with insights from the larger context of the study, the relevance of equivocal or discordant findings can be determined, and initial interpretations may be removed or repositioned. The investigation of individual animal correlations across all study end points can be challenging due to the large size of data sets, tight timelines, and the separation of tasks to different individuals, departments, or even companies. Therefore, a thorough integration of all data and perspectives is best achieved using an iterative reporting process and requires effective communication between scientists. In addition, scientist should have access to data that can be easily and efficiently interrogated and summarized as in Excel® or other dynamic data systems such as TIBCO Spotfire® or Novartis’s Translational Safety Platform (Skuba and Marc 2016), as opposed to cumbersome databases or lengthy and static reports in document or portable document format (PDF).
Reasons for Discordance: Nature of End Point
Nature of data, effect, and system affected
Differences in data type can influence the approach to interpretation and the extent of concordance between anatomic and clinical pathology (Table 1). Anatomic pathology data are based on the interpretation of the study pathologist and peer review pathologist, and include the possibility of having no findings within a tissue. In contrast, most clinical pathology data are quantitative, objective, and continuous results generated by automated analyzers for all samples and end points (with exceptions). Evaluating clinical pathology data within a study without consideration for sources of variability and artifacts can contribute to overconfidence or erroneous interpretation of study data. In addition, determining the dose at which test article–related clinical pathology changes occur often involves the use of decision points or thresholds, which can vary greatly between scientists. Therefore, the interpretation of clinical pathology changes is often refined based on concurrent study data.
Characteristics of Clinical and Anatomic Pathology Data That Can Affect Interpretation, Level of Concordance, and Reliance on Correlations.
Anatomic pathology data consist of observations in tissue sections, which may not contain a lesion detected by a biomarker. In contrast, clinical pathology data consist of body fluid measurements that may be influenced by a wide variety of factors. These may alter the magnitude of test article–related changes and cause discordance between end points. Therefore, the interpretation of clinical pathology data is heavily guided by correlation with other study data to confirm or rule out such effects and to determine whether they had an impact on results.
In contrast to anatomic pathology, which generally involves specimen collection at study termination, clinical pathology specimens may be collected noninvasively using nonterminal procedures. In many cases, clinical pathology is analyzed at multiple intervals prior to necropsy. Serial monitoring of clinical pathology can aid study data interpretation but can also cause discordance in study findings due to temporal differences in end point collection. For example, a histologic lesion may not be accompanied by a biomarker change if the biomarker change occurred early in the course of tissue injury or if the biomarker had a short circulating half-life.
Nature of effect: Systemic versus focal
Because clinical pathology reflects changes in systemic matrices such as blood or urine, clinical pathology changes may not always reflect what is going on locally or microscopically. For example, a systemic correlate may not be expected for a focal microscopic lesion (e.g., focal renal tubular necrosis without increase in serum creatinine or urinary protein). In this case, the affected mass of tissue is insufficient to result in increased safety biomarker levels. Conversely, a microscopic lesion would not be expected for a systemic change (e.g., electrolyte abnormalities, altered hydration status, and acid–base disturbance). Because clinical pathology is a systemic indicator, clinical pathology changes may not always reflect what is going on locally microscopically. This is best exemplified by the frequent lack of correlation between altered coagulation times and presence of thrombi or microthrombi.
Nature of effect: Temporal disconnect and kinetics of response
When biomarker half-life is short, blood must be collected at the time of injury (e.g., complement, cytokines, and cardiac troponin I [cTnI]). Effects may be too rapid and transient to expect an associated microscopic lesion. Further, long-term, irreversible, or adverse consequences may not be expected from a transient change. Concurrent histopathology evaluation may be required (e.g., discriminating between prerenal and renal azotemia), or the biomarker change may need time to become evident (e.g., decreases in red cell mass due to long red blood cell [RBC] life span).
Nature of effect: Functional versus structural
Clinical and anatomic pathology correlates might not be expected, depending on whether drug effects are functional (e.g., oxygen carrying capacity, hematopoiesis, liver synthetic function, and renal concentrating capacity) or structural (i.e., morphologically observable). For drug-mediated structural injury, anatomic pathology is more specific, while clinical pathology may or may not be more sensitive. For functional effects, clinical pathology data are more sensitive and specific than microscopic pathology, though specialized tests may also be required. Some functional alterations evident in clinical pathology (and safety pharmacology) may not have microscopic correlates (e.g., increased total bilirubin due to uridine 5-diphospho-glucuronosyltransferase inhibition or cardiac electrophysiologic changes). Conversely, structural lesions evident microscopically may not have clinical pathology correlates (e.g., seminiferous tubular injury) and may not be accompanied by a functional change. Changes in organ function such as effects on acid–base regulation or mitochondrial function are not detected by standard toxicity testing and may not be associated with structural changes.
Organ system affected
The strength of correlations also differs depending on the organ system. A high degree of concordance between clinical and anatomic pathology would be expected for hematotoxicity, though clinical pathology is more sensitive for detection of hematotoxicity. A lesser degree of correlation is expected for kidney or liver injury. Specialized biomarkers such as skeletal troponin-I are useful to detect musculoskeletal injury and may correlate with anatomic and clinical pathology similarly. For the lymphoid system, anatomic pathology may correlate with immunotoxicology end points (e.g., immunophenotyping of peripheral blood lymphocytes), but clinical pathology has limited utility aside from the identification of stress or excitement. For the endocrine system, standard clinical pathology has variable utility, depending on the affected endocrine organ. Correlates are more strongly observed with specialized hormone analyses and endocrine function tests. Similarly, standard clinical pathology has limited utility for the respiratory and nervous systems, and correlates are based on specialized functional testing. Finally, clinical pathology correlates would not be expected for lesions in eyes and ears.
Reasons for Discordance: Nonlinearity of Dose Responses
Discordance between end points may result from differences in the shape of the dose–response curve. As discussed earlier, the first correlation in toxicity studies is for dose and response, and test article–related effects are primarily identified based on their relationship to administered dose. This model assumes a linear-no-threshold response in which effects are proportional to administered dose, that is, monotonic (graded or continuous) over the entire dose range (Figure 1a). However, the linear-no-threshold model is only valid for the first interaction of a drug with its target (Conolly and Lutz 2004). In reality, dose–response curves are nonlinear; they have thresholds and exhibit multiphasic responses (Calabrese and Baldwin 2003). The shape of a dose–response curve depends on the pharmacokinetic (PK) and pharmacodynamic characteristics of the drug, the biologically effective dose (BED) at target tissues, the mode of action by which the drug exerts its biological effects, homeostasis, adaptation, repair, and the level of biological detail being considered. Importantly, although administered dose is generally used to establish test article relationship, it is at best an indirect measure of BED at the target tissue, which is much more relevant to responses (Andersen et al. 2006).
Illustration of common dose–response curves. (a) Linear-no-threshold response, (b) threshold response, (c) Hormetic or J-shaped response, (d) saturation curve, (e) sigmoid curve, and (f) U-shaped (continuous) and inverted U-shaped (dotted) curves.
The most common types of dose–response curves are threshold curves, J-shaped curves, U-shaped or inverted U-shaped curves, saturation curves, and sigmoid curves (Figure 1; Gardner 2000; Calabrese and Baldwin 2001, 2003; Conolly and Lutz 2004; Lutz, Lutz, and Andersen 2006; Stebbing 2009). Threshold curves (Figure 1b) exist because most biological responses behave as molecular switches in an all-or-none manner, and a response may not be observed until the molecular switch is sufficiently stimulated to be “turned on” (Andersen et al. 2002). Hormetic or J-shaped curves reflect beneficial effects (adaptive response, acquired tolerance or homeostatic overcorrection, also termed “hormesis”) at low-dose exposures and toxicity at higher doses (Figure 1c). Hormesis is leveraged in the toxicity setting to induce tolerance using low predoses prior to subsequent high-dose exposures. Saturation curves (Figure 1d) may be observed with target receptor loss/internalization or with modulation of regulated systems (e.g., endocrine). Phase-specific inhibitors of microtubule assembly and mitotic spindle formation (vinca alkaloids, taxanes, and colchicine) also produce a saturated dose–response curve (Gardner 2000). Since only a proportion of asynchronously dividing marrow cells are in late S and early G2 phase (phase in which they are susceptible to cytotoxic effects) at any given time, increasing the dose of a phase-specific cytotoxic agent beyond an effective threshold does not increase the number of affected cells. Sigmoid curves (Figure 1e) reflect threshold effects and hormesis at low doses and saturation at high doses. Inverted U-shaped curves may reflect the positive effects of optimal nutritive micronutrient concentration or discordant response kinetics across doses (Figure 1f, dotted curve; Peper 2009). U-shaped curves are common consequences of drug–antidrug antibody (drug-ADA) immune complex formation at mid-doses (Figure 1f, continuous curve).
Reasons for Discordance: Stochasticity of Biological Responses
At the cellular level, biological responses are inherently stochastic, as opposed to mechanical responses, which are expected or deterministic (Andersen et al. 2002). Biological stochasticity is defined as the lack of predictability of an outcome due to the randomness of cellular responses (Samson and Ditlevsen 2012). In other words, stochasticity describes the inability to predict whether a downstream effect will or will not happen in a given cell. This phenomenon accounts for the wide spectrum of biological effects observed in vivo. Risk assessment estimates the probability of adverse outcomes based on the assumption that the behavior of key events leading to deleterious outcomes may be stochastic (Andersen et al. 2002; Rhomberg and Lewandowski 2006; Marrs and Illing 2009). As such, the level of concordance one might expect also depends on the inherent stochasticity or variability of the biological responses involved. Factors involved in determining variability are listed in Table 2. The strength of concordance is expected to be low at low doses due to threshold effects, hormesis, and a low responder rate. Concordance might also be low at high or toxic doses due to increased variability associated with organ dysfunction, comorbidities, and other toxicities. Concordance is greater when effects have a high magnitude, severity, or incidence, when responses are dose proportional (as opposed to multiphasic), and when responses are predictable (as opposed to immune mediated or idiosyncratic). Greater concordance is also expected with small molecules when compared to biotherapeutics due to the high interindividual variability of responses to biologics.
Situations in Which More or Less Concordance Would Be Expected.
aDependent on the dose levels chosen, plasma exposures of the test article, pharmacologic activity, threshold effect, comorbidities, organ dysfunction, and other toxicities.
bBased on author experience.
Direct, upstream effects are expected to exhibit greater concordance than indirect or downstream effects, which are subject to a greater variety of potential responses (discussed in further detail later). Additive, synergistic, or potentiated effects are expected to exhibit strong correlation, whereas poor correlation is expected when antagonism, tolerance, or adaptive effects are involved. A high degree of correlation is expected when there is a narrow phenotypic spectrum or “expressivity” (Milewicz et al. 1998). Similarly, more correlation is expected when individual susceptibility is high (high-penetrance genes, e.g., BRCA1/2 gene for BReast CAncer), as opposed to variable (low-penetrance genes, e.g., catechol-O-methyltransferase single nucleotide polymorphisms for breast cancer; Houlston and Peto 2004). Finally, in the author’s experience, a high degree of concordance is expected among inbred mice when compared to outbred rats and dogs, while concordance is generally low among nonhuman primates, which are either wild caught or outbred.
The aforementioned principles are consistent with the framework proposed by the Organization for Economic Cooperation and Development Adverse Outcome Pathways (AOP; OECD Adverse Outcome Pathways 2016). The AOP is a program launched in 2012 to support regulatory decision-making by organizing existing knowledge on causal linkages between biological changes required for the progression to adverse outcomes (Villeneuve et al. 2014). In effect, the AOP is a toxicology correlation knowledge base that uses structured pathway representations of causally linked biological changes, from molecular initiating events to key downstream events and adverse outcomes, with information regarding the strength of those relationships. AOPs are designed with consideration of (1) level of biological organization, (2) whether relationships are direct or indirect, (3) the degree of essentiality of an event, and (4) the strength of the evidence for a relationship (AOPwiki.org/aops; http://www.oecd.org/chemicalsafety/testing/adverse-outcome-pathways-molecular-screening-and-toxicogenomics.htm).
The AOP conceptual framework can be applied to toxicologic study interpretation and correlation. As suggested by the AOPs, the strength of correlations decreases the farther downstream you look from the initiating stimulus. Responses depend on the cellular pathway; the probability of key events occurring at each point in the pathway in individual cells; individual susceptibility, particularly at low doses or for downstream events; likelihood (penetrance); and phenotypic spectrum of effect (expressivity). Direct drug effects, such as PKs and pharmacologic effects, structural injury or functional changes, are likely to exhibit greater incidence, magnitude, consistency, and correlation with other findings when compared to downstream effects at the same dose. Indirect effects such as homeostatic responses, functional decompensation, morbidity, and mortality are likely to exhibit lower incidence, magnitude, consistency, and correlation when compared to upstream effects at the same dose.
Conclusion
Toxic responses arise from a series of steps, each of which is subject to inherent stochasticity and variability. These include absorption of chemical into the body, level of exposure, delivery of chemical to sensitive tissues, interaction of the chemicals or their metabolites with biological targets in tissues, progression of these cellular interactions, dampening of effects by homeostatic or compensatory responses, or functional decompensation, eventually leading to an increase in the proportion of individuals with an adverse response. Variability of response develops at each successive step, such that levels of concordance may be high among proximal end points and low among distal ones. Similar to a ripple in water, the direct effects (central ripples) are consistent, of high amplitude and rapid, while downstream effects (outer ripples) are more variable, lower in amplitude, and farther from one another. The water ripples are also affected by adjacent changes or drops (e.g., secondary effects or procedure-related effects). Therefore, observed effects result from the superimposition of component biological reactions, whether additive or antagonistic (Lutz, Lutz, and Andersen 2006).
Interpretation requires discriminating drug-related responses from nondrug-related variability. Lack of concordance does not rule out a relationship to test article; relevant correlate end points may not have been measured or correlates might not be expected. Concordance among study end points depends on timing, end point characteristics, type of effect/response, shape of the dose–response curves, proximity to the initiating event, homeostatic, tolerance or adaptive responses, individual susceptibility, and stochasticity of the biological response. Finally, correlation is an iterative and collaborative process that requires communication and access to data in formats that are easily interrogated and summarized in order to tell a cohesive story. Communication between study scientists can be leveraged to understand the relevance of unusual findings, to build the weight of evidence for making specific conclusions, and to effectively communicate causality, adversity, and pathogenesis.
Case Study 1: Peripheral Blood Cytopenias
Elizabeth V. Skuba
Introduction
The development of 1 or more peripheral blood cytopenias is a relatively frequent finding in standard preclinical safety toxicology studies. Recently, in a 2-week toxicology study in male rats, unexpected, profound decreases in peripheral blood leukocyte, platelet, and reticulocyte counts were noted in surviving low-dose animals at the end of the dosing period. In addition, RBC mass (RBC count, hemoglobin concentration, and hematocrit) was found to be markedly decreased. The aim of this case study was to consider the information that can be gleaned using traditional clinical pathology and anatomic pathology data to help coax out potential underlying pathological mechanisms as well as to help direct the investigator’s choice of appropriate additional diagnostics, if they are needed. The primary focus of this case was the consideration of the potential mechanisms for the decreases in the RBC mass, beyond decreased production alone.
Study design and results
A 2-week, oral gavage toxicology study in male rats was initiated to establish the tolerability/toxicity of a low molecular weight compound intended to decrease serum cholesterol concentrations. Animals received daily doses of 0, 100, 300, and 1,000 mg/kg/day. Clinical signs, body weight, and food consumption were monitored over the course of 2 weeks, with clinical pathology and anatomic pathology to be collected at the end of the dosing period. Doses of ≥300 mg/kg/day were not tolerated. Clinical signs included muscle tremors, decreased motor activity, diarrhea, and decreased food consumption. Animals dosed at 1,000 mg/kg/day were euthanized on study day 2, while those dosed at 300 mg/kg/day were euthanized on study day 4.
The 100-mg/kg/day dose was well tolerated with the only clinical signs being salivation (clear) and hair loss around the muzzle. Compared to the concurrent controls, body weight (−5%) and food consumption (−28%) were slightly decreased. Clinical chemistry changes in these animals clearly demonstrated the expected pharmacology of the compound, with marked (−74%) decreases in serum total cholesterol concentrations.
Hematology evaluation at the end of the treatment period in the 100-mg/kg/day dosed animals revealed the presence of profound pancytopenia, with marked decreases in peripheral blood neutrophil (−99%), monocyte (−100%), lymphocyte (−84%), platelet (−97%), and reticulocyte (−96%) counts. RBC mass was also moderately to markedly decreased (>−50%).
Discussion
Focusing on the RBC parameters, the marked decrease in the peripheral blood reticulocyte counts indicated the presence of test article suppression of erythropoiesis. While decreased RBC production was an undeniable main contributor to the decreased RBC mass, a shortened RBC life span also needs to be considered a potential factor, given the magnitude of the decrease in RBC mass over the 2-week dosing period.
While all 3 of the main preclinical species have fairly consistent hematocrits, averaging between 0.45 L/L to 0.49 L/L, there are species differences. An important distinction between the species is the life span of their RBCs. The life span of RBC for dogs and people is similar at about 100 days to 120 days. For monkey, the life span of the red cell is slightly shorter, approximately 100 days; and for the rat, the life span of the RBC is between 45 days and 60 days. Species differences in the RBC life span are clearly reflected in the reticulocyte counts, with dog and monkey reticulocyte counts averaging below 60 × 109/L, while in the rat, reticulocyte counts tend to be greater than 200 × 109/L. At steady state, dogs and monkeys replace about 1% of their RBC mass daily, while rats replace about 3% of their RBCs per day. Thus, with complete suppression of erythropoiesis, without shortened RBC life span, it will take over 2 months for the RBC mass to decrease by half in the dog or monkey, while for the rat, it would take slightly less than 1 month for the RBC mass to decrease by 50%. In this case study, the hematocrit had decreased by greater than 50% in the 100- mg/kg/day treated rats in less than 15 days, suggesting that mechanisms other than decreased production were contributing to the decreased RBC mass.
Histological review of the bone marrow showed marked hypocellularity, with generalized decreases in all cell lines (erythroid, myeloid, and megakaryocytic). Changes were confirmed with cytological review of the bone marrow smears. There was a virtual absence of all hematopoietic precursors apart from rare immature megakaryocytes and an occasional neutrophil and RBC precursor. Nucleated cells observed in the bone marrow smear included numerous mast cells, fibroblasts, and macrophages with fewer lymphocytes and plasma cells. Erythrophagocytosis and phagocytosis of neutrophils and platelets was also commonly observed, supporting the notion that accelerated clearance was contributing to not only the decreases in RBC mass, but other peripheral blood cell types as well. For completeness, histological sections of bone marrow and spleen were stained with Perl’s Prussian blue stain, for iron. Compared to the vehicle control animals, the spleen from animals dosed at 100 mg/kg/day had increased staining for Perl’s Prussian blue providing further support of increased splenic sequestration of erythrocytes and accelerated RBC clearance, undoubtedly contributing to the decreased RBC mass noted in hematology.
The sequestration and the premature destruction of RBCs by phagocytes in the bone marrow, spleen, and liver are often caused by alterations that render the RBC membrane less deformable (Deplaine et al. 2011). The ability of the RBC to undergo remarkable deformations is critical to its survival, as it must be able to fluidly change from a resting biconcave disc to an ellipsoid in order to pass through narrow capillaries, as well as undergo the deformations needed to navigate through the narrowest of endothelial slits (Mohandas and Gallagher 2008). In order for an RBC to be able to undergo these continuous deformations, several key features must be in place, including maintenance of a cell surface to volume ratio, consistent cytoplasmic viscosity, and membrane deformability through the folding and unfolding of spectrin repeats (Mohandas and Gallagher 2008). Over the course of its life span, loss of membrane through microvesiculation, altered cell volume and viscosity, and decreased deformability accumulate until the cell is ultimately tagged as senescent and removed from the circulation (Lutz and Bogdanova 2013).
The RBC membrane itself is a classical lipid bilayer, composed almost entirely of cholesterol and phospholipids. The distribution of the phospholipids is asymmetrical, with phosphatidylcholine and sphingomyelin located predominantly in the outer monolayer, while all of the phosphatidylserine (PS) and phosphatidylinositides and most of the phosphatidylethanolamine are found in the inner monolayer. Phospholipid transporter proteins called flippases, floppases, and scramblases generate and maintain this asymmetry (Montigny et al. 2016). Flippases move phospholipids from the outer layer to the inner layer, while floppases do the opposite, moving phospholipids from the inner layer to the outer layer, both against a concentration gradient. Scramblases move phospholipids bidirectionally, down their concentration gradient. The maintenance of this asymmetry is particularly important, as macrophages express PS receptors. Consequently, PS expression in the outer leaflet of the RBC membrane is another important mechanism by which the cell is tagged for removal by splenic macrophages (Segawa and Nagata 2015).
The cholesterol and phospholipids are present in about equal proportions in the normal RBC membrane, but while phospholipid distribution is asymmetrical, cholesterol is evenly distributed throughout the membrane, with some cholesterol-enriched areas near lipid rafts. Another important feature of cholesterol in the red cell membrane is that it readily exchanges with plasma cholesterol, such that people with high serum cholesterol concentrations have increased cholesterol content in their erythrocytes and an increased cholesterol to phospholipid ratio, while the opposite is true of people with lower serum cholesterol concentrations (Lange and D’Alessandro 1977). Studies have been performed to investigate the impact of varying cholesterol content on RBC survivability. It’s been shown in vitro that cholesterol loading or depletion impacts the red cell membranes’ deformability and function. For example, RBCs with higher cholesterol content are more rigid, prone to acanthocyte formation and consequently have a shorter life span, while those RBCs with reduced cholesterol to phospholipid ratio demonstrate more fluidity and deformability (Forsyth et al. 2012). Alternatively, it has also been shown that cholesterol depleted cells show greater scrambling of membrane phospholipids and increased PS exposure, an “eat me” signal, shortening the RBC life span, while increased cholesterol content strongly inhibits PS exposure (van Zwieten et al. 2012). Taken together, it appears that serum cholesterol concentrations and RBC membrane cholesterol content play an important role in RBC survivability and life span. The presence of serum hypercholesterolemia may lead to increased cholesterol to phospholipid ratio in the RBC membrane, decreasing its deformability, increasing splenic entrapment, and hence, shortening the red cell’s life span. On the flip side, low serum cholesterol concentrations may lead to development of a decreased membrane cholesterol content, increased PS exposure on the outer leaflet, increased recognition by phagocytes bearing a PS-receptor and accelerated RBC clearance/shortened life span.
Conclusion
In the current case study, when consideration was given to RBC life span and study duration, the development of moderate to severe decreases in RBC mass was considered to be multifactorial due to both decreased RBC production and accelerated clearance. Clinical pathology and anatomic pathology changes which supported suppression of erythropoiesis included profoundly decreased peripheral blood reticulocyte counts, bone marrow hypocellularity, and a paucity of erythroid precursors, upon review of the bone marrow cytology. Accelerated RBC clearance was demonstrated both through bone marrow cytology, where instances of erythrophagocytosis were abundant, and histologically, with positive Perl’s Prussian blue staining in the spleen. The test article also produced severe decreases in serum total cholesterol concentrations. Given the presence of severe hypocholesterolemia, depletion of RBC membrane cholesterol content was considered as a potential mechanism for shortened RBC life span. Additional diagnostics were considered including immunohistochemistry, electron microscopy, flow cytometry, and lipid membrane analysis (Poulet et al. 2010) to further characterize the mechanism of the shortened RBC life span but were not pursued and the project was terminated.
Case Study 2: Acute Infusion Reaction in an Nonhuman Primate Toxicology Study
William O. Iverson
Introduction
Immediate infusion reactions occurring with the first dose in a toxicology study are uncommon and are certainly frightening for the study director and technical staff conducting the study. A bolus infusion of a human, bispecific, anti-epidermal growth factor receptor/ insulin-like growth factor 1R immunoglobulin G (IgG) 1 monoclonal antibody resulted in morbidity and mortality in several animals. Altering the dose administration and pretreatment with antihistamines did not completely ameliorate the effects. These severe and unexpected reactions led to a second, investigative (INV) study where additional samples were collected and analyzed to determine the mechanism(s) of toxicity. As an antibody designed to be used in oncology, some toxicity could have been managed, but the effects seen in this study would have been unacceptable to patients in a clinical trial.
Study design
The study was planned as a 29-day dose range finding (DRF) study with doses of 7.5, 15, or 30 mg/kg of MEDI6348 or the comparator molecule, panitumumab, administered as an intravenous (IV) bolus once weekly to 6 animals per group. Blood was drawn pretest and at established time points for PK, hematology, and clinical chemistry evaluations. As the result of adverse reactions following the first dose, administration was changed to a 30-min infusion and all animals were pretreated with diphenhydramine. Additional blood plasma collection for possible histamine evaluations were performed predose, end of infusion, and 30 min after the end of infusion. Following additional adverse reactions on the second day of dosing (week 2) the high dose was reduced to 15 mg/kg and administration to a 60-min IV infusion and all animals were pretreated with carprofen, diphenhydramine, and dexamethasone.
An investigative study was conducted to collect samples and determine the mechanism of toxicity in the DRF. A list of possible contributing factors was created with a plan to investigate each one (Table 3). The study consisted of 3 groups with 3 control animals and 6 animals per treatment group receiving 60-min infusions of control vehicle, MEDI6348 at 30 mg/kg, or panitumumab 21 mg/kg. All animals were pretreated with carprofen, diphenhydramine, and dexamethasone. Samples were collected for soluble factor analyses (Cytokines, Histamine, and C3a) at time points on day 1: predose (prior to and after pretreatment) and 5 min, 1 hr, 24 hr postdose; and on days 8, 15, 22, 29: predose (after pretreatment) and 5 min, 1 hr, 24 hr postdose. Analyses included a cytokine panel for interferon (IFN)γ, interleukin (IL)-1β, IL-2, IL-4, IL-6, IL-8, and tumor necrosis factor (TNF)α which were measured with a Luminex multiplex assay (Millipore, Billerica, MA), histamine measured with a Neogen ELISA kit (Neogen, Lexington, KY), and C3a measured with a Becton Dickinson (BD) ELISA kit (BD, Franklin Lakes, NJ).
Possible Mechanisms for an Adverse Infusion Reaction.
Note. ADA = antidrug antibodies; IgE = immunoglobulin E.
Complete necropsies were performed on all animals that died or were euthanized, organs collected, and representative samples collected, fixed in 10% neutral buffered formalin, and processed to hematoxylin & eosin (H&E) slides for histopathology evaluations.
Results and discussion
On the first day of dosing, 3/6 monkeys had observations of ataxia, hypoactivity, dilated pupils (all 3), 1 had excessive salivation and vomitus containing food, and 1 was dorsally recumbent with a red oral discharge. This was initially thought to be anaphylaxis and all 3 animals were given diphenhydramine injections. Shortly thereafter, the animal in dorsal recumbency began to hemorrhage from the nose and mouth and immediate euthanasia was ordered. No blood samples could be obtained at the time of the adverse events (AEs). The remaining 2 animals were given 5% dextrose solution IV, which was repeated 30 min later. Both of these animals recovered. Upon necropsy, the animal that expired had red and dark red mottled lung lobes and red discolored mucosa in the colon.
During the second dose, 1 week later, which was changed to a 30-min infusion, the same 2 animals that had adverse reactions on day 1 were hypoactive by the end of dosing and did not respond to treatment with epinephrine. Both animals were euthanized and submitted for necropsy. The lung findings in both animals were similar to those seen in the animal that expired on the first day. Associated microscopic findings in the lungs of these 2 animals were hemorrhage/congestion/edema in all 3 animals with fibrin thrombi in alveolar septa (Figure 2). Additional findings included marked congestion of the liver and focal cardiac myofiber degeneration. The cause of death for all 3 animals that died prior to week 3 was attributed to pulmonary compromise.
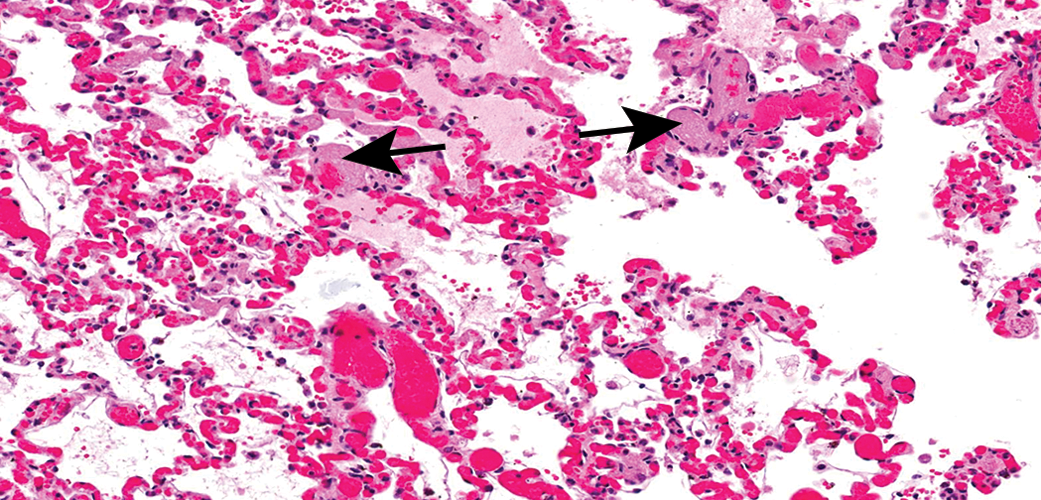
Pulmonary congestion, hemorrhage, edema, and thrombosis (arrows). Hematoxylin & eosin, original objective 20×.
On the second day of dosing at 15 mg/kg, 1 of the 6 monkeys was hypoactive at approximately 30 min after end of IV infusion and responded to treatment with epinephrine, diphenhydramine, and cortisol. Following this event, administration was changed from 30-min to 1-hr IV infusion administration for all animals, and they were pretreated with carprofen, diphenhydramine, and dexamethasone. Additional blood plasma collections for possible histamine evaluations were performed. Following these changes, the study was completed with no more AEs after day 15. There were no test article–related changes seen in any animals that survived until the terminal sacrifice on day 32.
Several months later, an investigative study with 15 male cynomolgus monkeys was initiated as described above. Despite pretreatment with carprofen, diphenhydramine, and dexamethasone, three of the six 30-mg/kg MEDI6348 animals were hypoactive following the first dose but all recovered without further treatment. Fifteen minutes following completion of the second dose 1 week later, 1 animal was hypoactive, unresponsive, slow, and ataxic when removed from cage, had a strong heartbeat but labored respiration, was restless, ventrally recumbent, with a decreased body temperature (35.2°C). The animal recovered without further treatment. All animals were normal after the third dose, but after the fourth dose on day 22, again 15 min following the end of the infusion, the same animal was hypoactive, laterally recumbent, unresponsive, with irregular/rapid respiration, and pale mucous membranes. After treatment with epinephrine and diphenhydramine, it became slightly more responsive but was still lethargic and ataxic. Euthanasia was performed, and necropsy revealed lung pathology as was seen in the previous study. The remaining animals all received the final dose and survived to the terminal necropsy with no treatment-related findings.
Analysis for ADA from samples from all animals that had clinical signs of a drug reaction yielded titers below the limits of detection. There were no significant histamine changes in MEDI6348-treated animals compared to the vehicle-treated animals. There was no clear association of cytokine levels following MEDI6348 administration with the occurrence of AEs in the 1 animal sacrifice moribund in the investigative study. In the MEDI6348 group, a greater increase relative to control was observed for IL-6 on day 29 and for IL-8 immediately following each dose. Minimal to no changes were observed for IL-2, IL-4, TNFα, IL-1β, and IFNγ. MEDI6348 tested at concentrations of 0, 1, 10, 50, 100, and 200 ug/ml, which included all mean MEDI6348 blood concentrations for 7.5-, 15-, and 30-mg/kg dose groups from the previous study, did not activate human or cynomolgus basophils in vitro. C3a levels were increased up to 8-fold over baseline in multiple animals following dosing.
Based on all analyses performed in the second (investigative) study (Table 4), it was concluded that the acute infusion reactions were most likely complement-mediated anaphylactoid-type reactions. They were observed following the first dose administration, the complement binding domains in the Fc portion of the test article were not mutated to prevent C1q binding, and were therefore capable of binding to antigen–antibody complexes, and both molecular targets were expressed on cells in multiple organs (including the lung). In the case of the decedent animals, the pathology in all animals was primarily pulmonary edema, hemorrhage, and thrombosis. Binding of the molecule to 1 or both target antigens allowed activation of the classical pathway of complement activation (Murphy, Travers, and Walport 2008). Subsequent molecules have all been designed and tested to be certain complement will not be bound or activated in vivo. In addition, a 30-min infusion is now routinely used rather than a bolus injection, which allows better monitoring of animal health during dosing.
Investigative Study Results.
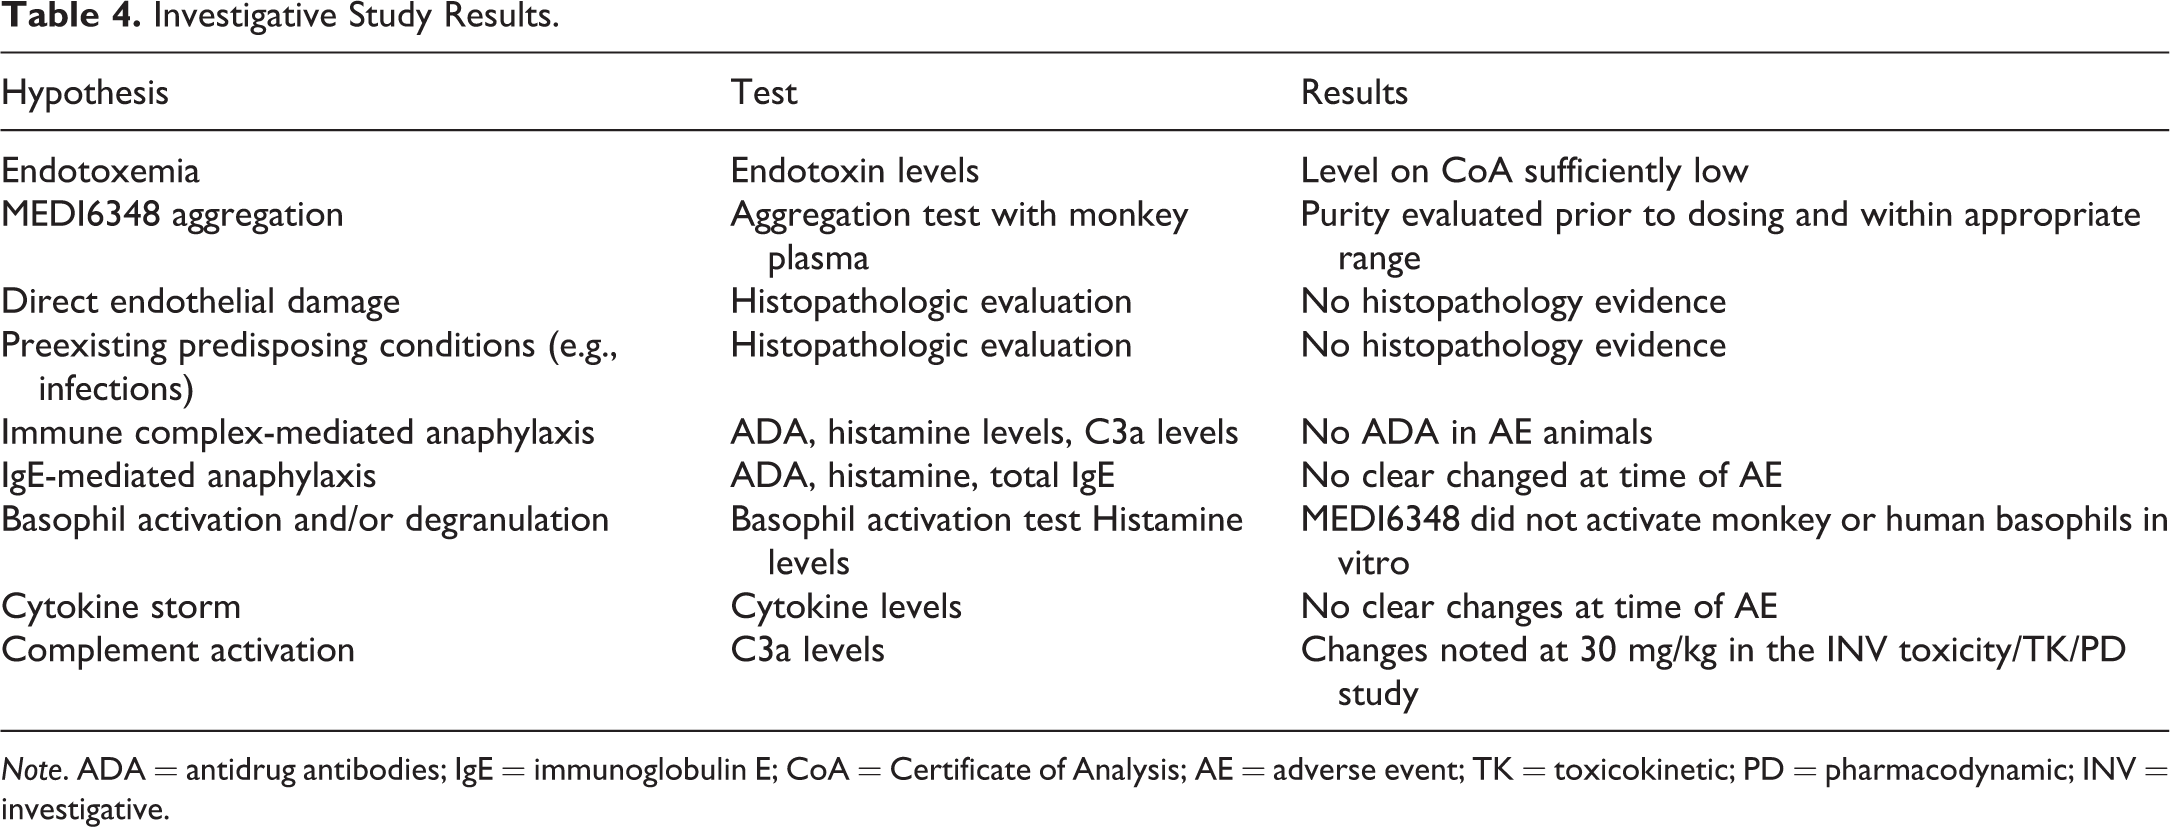
Note. ADA = antidrug antibodies; IgE = immunoglobulin E; CoA = Certificate of Analysis; AE = adverse event; TK = toxicokinetic; PD = pharmacodynamic; INV = investigative.
Acknowledgments
This case was presented by the author as part of this CE course. The persons who designed the studies and produced the data presented were Laurie A. Iciek, PhD, Bettina Kasprzyk, Marlon Rebelatto, DVM, MS, PhD, DACVP, Xiaomin Chen, PhD, Kris Sachsenmeier, PhD, Nazzareno Dimasi, PhD, and many other scientists within Research and Translational Sciences at MedImmune, LLC.
Case Study 3: Immune Complex Arteritis in a 4-Week Toxicology Study
William O. Iverson
Introduction
A human monoclonal antibody was administered to cynomolgus monkeys via 60-min IV infusion as part of an investigational new drug-enabling 29-day study. There were 5 males and 5 females in the control and high-dose groups, 3 for the 29-day interim sacrifice and 2 for the 12-week recovery sacrifice. An additional low-dose group had 3 animals per sex for the interim sacrifice only.
Methods
Complete necropsies were performed on all animals at the scheduled sacrifice intervals, organs collected and weighed, representative samples collected, fixed in 10% neutral buffered formalin, and processed to H&E slides. Following identification of multiple vascular lesions in 1 low-dose animal, tissue blocks were submitted to Pathology Associates, Inc. (Pathology Associates, Inc.[PAI], Frederick, MD) for immunohistochemical (IHC) evaluation. Using IHC, formalin-fixed, paraffin-embedded sections of gall bladder, ileum, and colon from a control group female and the affected low-dose female were stained for human IgG (indicative of the test article, a human antibody), endogenous monkey immunoglobulins (IgG and IgM), complement C3 and sC5b-9, and albumin. Granular deposits of human IgG, monkey IgG, IgM, C3, and/or sC5b-9 were considered to be evidence of immune complex deposition. Physiologic (nongranular, vesicular, or diffuse) staining was also evaluated to determine test article biodistribution, transport, and uptake. Albumin was included as a control for vascular leakage. Additional controls included tissues from undosed cynomolgus monkey tissues from the PAI tissue bank.
Results and discussion
All animals successfully completed the study with no treatment-related findings in clinical observations, appetite, body weight, blood pressure, respiration rate, body temperature, ophthalmoscopic, physical, and electrocardiogram examinations. Clinical pathology at both doses revealed that there were mild increases in total protein, up to 17%, moderate increases in globulin, up to 51%, and concurrent decreases in albumin, up to −14%. There were also mild decreases in red cell mass with concurrent increases in reticulocytes in all groups including controls, typical of procedure-related blood sampling. Upon histologic examination, a single low-dose female monkey was found to have perivascular mononuclear cell infiltrates extending into the vessel wall, in small- to medium-sized muscular arteries in multiple organs and tissues. Affected organs and tissues included multiple areas of the gastrointestinal tract (cecum, colon, ileum, jejunum, and stomach), gallbladder and pancreas, ovaries, oviducts, uterus and vagina, lung, sciatic nerve, spleen, and urinary bladder. The largest lesion found was in the wall of the gallbladder (Figures 3 and 4) and consisted primarily of macrophages and lymphocytes with smaller numbers of eosinophils around and within the media of this muscular artery.
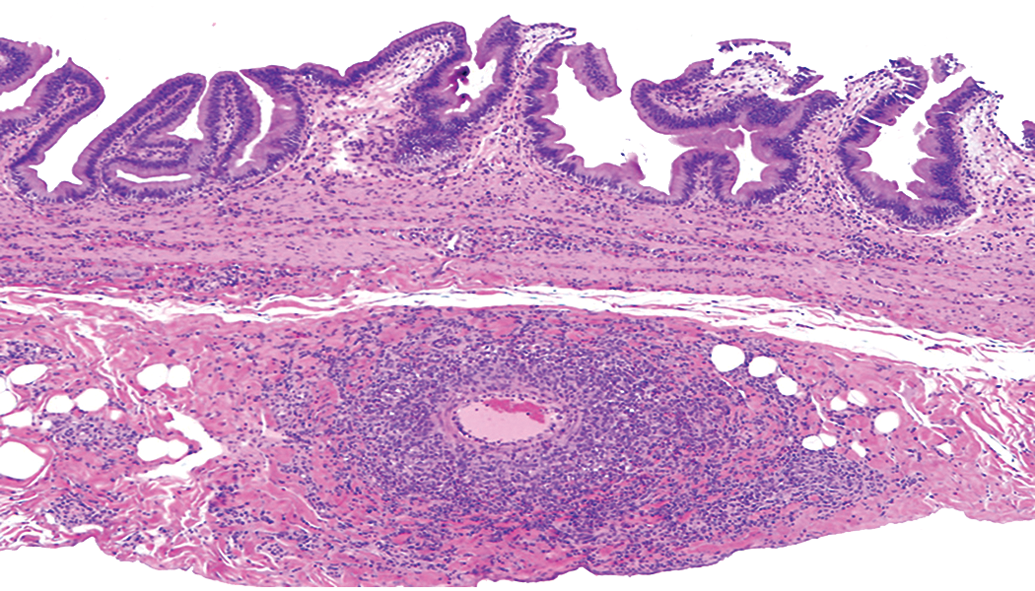
Vasculitis in wall of the gallbladder. Hematoxylin & eosin, original objective 2×.
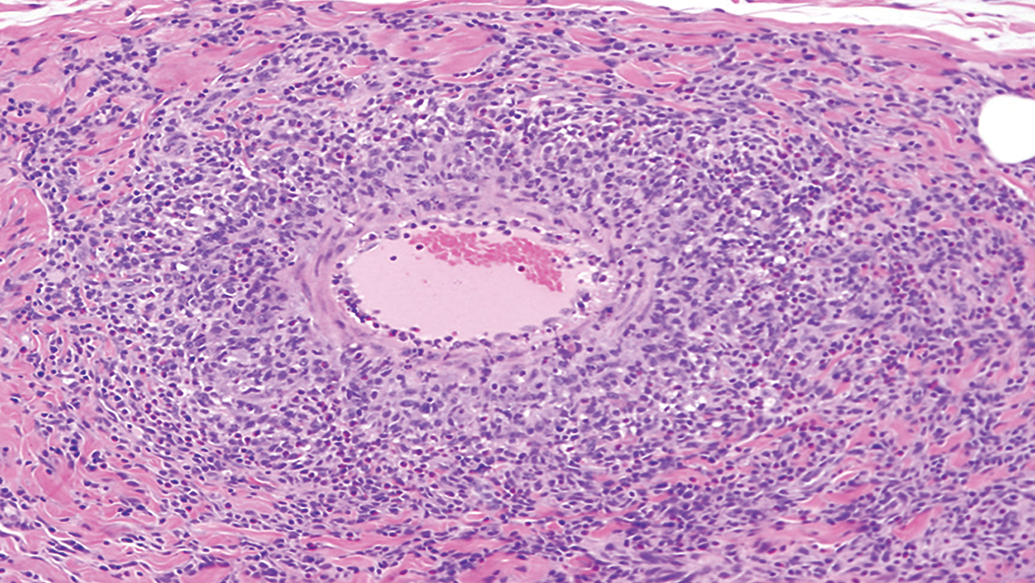
Vasculitis in wall of the gallbladder. Hematoxylin & eosin, original objective 10×.
Analysis of blood samples collected during the study revealed 7 animals had developed ADA and 1 had a significant decrease in the area under the curve (AUC) of the test article at the end of the dosing period (Table 5). The animal with loss of exposure was the same animal with the multiple arterial lesions. IHC was performed on sections of gall bladder, ileum, and colon. Immune complex–related granular deposits containing human IgG (test article), monkey IgM, and/or monkey IgG were observed in the intima and inner media, aligning the internal elastic lamina and/or at vascular branch points in the affected vessels. A few granular deposits were observed to be phagocytosed by monocytes/macrophages. Complement components (C3, sC5b-9) were not observed in the granular deposits. The IHC findings indicated that the vessel inflammation in low-dose female animal no. 2503 gall bladder, ileum, and colon was closely associated with granular deposits containing the test article and immunoglobulin (likely antidrug antibody) in affected vessels, indicating that the vessel inflammation likely was caused by formation and deposition of immune complexes (Rojko et al. 2014).
Exposure after First and Fourth Doses for ADA Positive Monkeys.
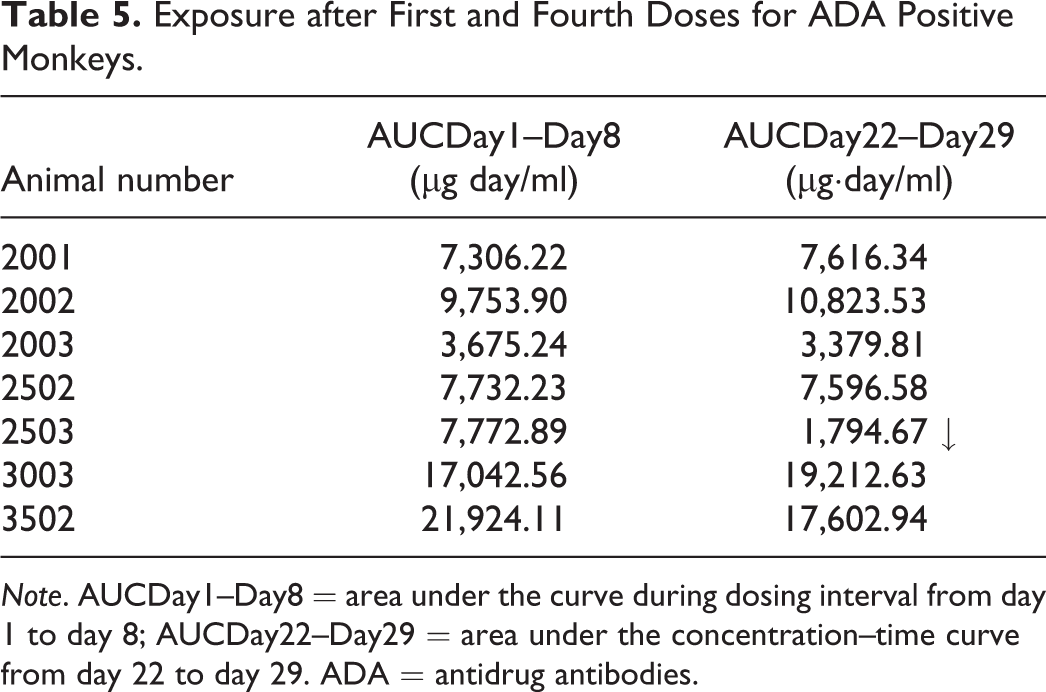
Note. AUCDay1–Day8 = area under the curve during dosing interval from day 1 to day 8; AUCDay22–Day29 = area under the concentration–time curve from day 22 to day 29. ADA = antidrug antibodies.
Cynomolgus monkeys bred in captivity for toxicology studies are an outbred population with heterogeneous genetics. Many animals bred in China are in fact hybrids between Macaca fasciculata and Macaca mulatta, and Rhesus genes are readily identified in animals with a cynomolgus phenotype (Heckel et al. 2015). This contributes to the variability in immune response to a specific human protein—the test article—when introduced repeatedly into the animal. ADA responses will vary considerably from minimal to massive, with everything in between. The specific balance between ADA and test article concentration at a given moment in time will determine the size of complexes formed, and only the largest circulating immune complexes will become trapped in vessels and incite an inflammatory response (Rojko et al. 2014).
Although interesting to the pathologist, presence of ADA and immune complexes in the test species are not indicative of a safety risk for humans, since “Immunogenicity assessments…in nonclinical animal studies are not relevant in terms of predicting potential immunogenicity of human or humanized proteins in humans” (International Council on Harmonisation of Technical Requirements for Registration of Pharmaceuticals for Human Use 2011, 5). Therefore, the presence of these vessel lesions does not halt or impede drug development. Development of ADA against therapeutic proteins is routinely monitored in clinical development programs, but the occurrence in the nonclinical safety studies of this phenomenon is not predictive for the clinic.
Acknowledgments
This case was presented by the author as part of this CE course. The persons designing the study and producing the data presented were Laurie A. Iciek, PhD, Jennifer Cann, DVM, PhD, DACVP, and Xiang-Qing Yu, PhD, Translational Sciences MedImmune, LLC, and Jennifer L. Rojko, DVM, PhD, DACVP Charles River Laboratories, Pathology Associates, Maryland.
Evaluation and Integration of Traditional and Nontraditional Biomarkers of Liver and Kidney Injury
Daniela Ennulat
Introduction
The integration of nonclinical safety biomarker changes with other study findings, most notably histopathology, is a critical part of nonclinical biomarker data evaluation. In addition to traditional biomarkers or standard clinical pathology end points, there is increasing use of nonstandard or novel biomarkers such as cTnI or kidney injury molecule-1 (Kim-1) to noninvasively monitor human subjects or patients for potential target organ toxicities identified in nonclinical studies. For the following, the primary emphasis is on understanding the relationship of changes in conventional established markers, particularly structural injury markers, with morphologic manifestations of injury in liver and kidney. Other considerations such as species differences in marker biology and biological variability are described using case examples.
One-size-does-not-fit-all in hepatobiliary marker evaluation
Proper interpretation of biomarker data requires an understanding of the biology unique to each marker, its context, and species relevance. For example, the enzymes alanine aminotransferase (ALT) and aspartate aminotransferase (AST) are highly expressed in liver, with levels up to 10,000-fold greater in liver than in serum, making them excellent hepatocellular injury markers for most species. Because of its high liver specificity, ALT is the most commonly used hepatocellular injury marker in drug development (Kim et al. 2008; Amacher 1998). However, differences in circulating half-life and dynamic range can influence the utility of ALT across species and also its interpretation in preclinical studies. In dog, monkey, and man, ALT circulates for approximately 45 hr to 60 hr, while in rats, ALT is cleared in less than 8 hr, thus hepatocellular injury in the rat is often not associated with increases in ALT (Hoffmann, Solter, and Wilson 1999; O’Brien et al. 2002). Glutamate dehydrogenase (GLDH) is another liver-specific hepatocellular injury marker that is commonly evaluated in preclinical and clinical safety studies. In rats, GLDH has a longer half-life and larger dynamic range than ALT (O’Brien et al. 2002), making it more sensitive than ALT for detection of liver injury. Similarly, GLDH is the preferred hepatocellular injury marker in the minipig, which has low liver activity of ALT and AST (Tomlinson et al. 2013).
Species differences must also be considered in the interpretation of the hepatobiliary markers alkaline phosphatase (ALP) and gamma glutamyltransferase (GGT). ALP is present in most tissues in the body, with highest expression levels in liver (hepatocyte canalicular membrane), bone, intestine, kidney, and placenta, whereas GGT is primarily present in liver (canalicular membrane and biliary epithelium) and kidney. Despite their broad tissue distribution, both enzymes are considered markers of biliary injury or cholestasis and are measured as total serum or plasma activity in preclinical studies. Again, species differences determine selection of the most appropriate hepatobiliary marker: in rats, the predominant circulating ALP isoform is of intestinal origin, and the circulating half-life of GGT is extremely short (<1 hr), thus measurement of total bilirubin, an indicator of liver function, in association with total ALP is used to evaluate hepatobiliary injury in the rat. In the dog, most ALP isoenzymes are also rapidly cleared and lack diagnostic utility except for liver ALP, which is induced in response to biliary injury/obstruction. Dogs also have a unique corticosteroid-inducible ALP that has a similar rate of clearance as liver ALP and which can be increased with stress or chronic disease (Hoffmann and Dorner 1977). Total ALP is considered a more sensitive indicator of biliary injury or cholestasis than GGT in dogs, but GGT is often used in dog studies to discriminate the cause of increased total ALP. In contrast, in monkeys, GGT is more sensitive and specific for biliary injury than ALP (Hall and Everds 2003).
Pattern recognition, as used in the evaluation of anatomic pathology data, can be applied to clinical pathology data interpretation. For example, although highly expressed in liver, ALT and AST are also expressed in muscle and various other tissues. Liver expression of AST is lower than for ALT, but AST expression in muscle is higher than ALT. As a result, in the absence of morphologic or biochemical evidence of liver injury, serum or plasma AST increases that exceed increases in ALT are likely secondary to muscle injury and should be evaluated in the context of other muscle injury markers (creatine kinase, skeletal troponin I, or aldolase) or clinical signs. This occurs often in nonhuman primate studies where muscle injury secondary to experimental procedures is common (Landi et al. 1990; Kim et al. 2005). Similarly, with liver injury, increases in serum ALT activity are typically larger than increases in AST due to the higher liver expression of ALT, but recovery from liver injury can be indicated by a return of AST values to baseline before decreases in ALT are seen due to the shorter circulating half-life (approximately 2 hr to 14 hr) of AST.
Integration of clinical chemistry and histopathology changes often occurs by proximity
In preclinical safety studies, serum biomarker changes are frequently correlated with microscopic findings for a target organ based on the known tissue specificity of the biomarker, often without consideration of the biology of the marker or the nature of the morphologic change. This is particularly true for the interpretation of changes in biomarkers of liver injury or function. Morphologic manifestations of liver injury are often complex, with multiple concurrent pathologic processes, thus a key aspect of evaluating morphologic changes for the purpose of risk assessment and reporting should be the discrimination between the primary pathologic process (e.g., necrosis or cholestasis) and any potentially secondary manifestations of the primary injury (e.g., inflammation). However, it is important to note that even primary manifestations of tissue injury may not have a correlate clinical pathology finding. For example, while an increase in serum ALT is considered indicative of hepatocellular injury, ALT increases often occur in the absence of morphologic evidence of hepatocellular degeneration or necrosis and vice versa.
A recent meta-analysis evaluating traditional markers of hepatobiliary injury and function in rats has helped to clarify the relationship between clinical chemistry changes and liver histopathology findings (Ennulat, Magid-Slav, et al. 2010). In this study, the diagnostic utility of traditional hepatobiliary markers was evaluated against liver histopathology for over 3,200 rats given 182 different treatments using receiver operating characteristic (ROC) analysis, an unbiased analytic tool that measures the diagnostic accuracy of a test for a given reference standard (i.e. histopathology) for every possible sensitivity/specificity pair without designation of a diagnostic threshold. The large size and diversity of liver findings allowed separation of cohorts of rats with specific manifestations of liver injury such as hepatocellular necrosis/degeneration, hypertrophy, steatosis, and biliary pathology. An AUC of 0.5 is equivalent to a coin toss and indicates no diagnostic usefulness, while an AUC of 1.0 indicates a perfect test, and an AUC of 0.8 indicates moderate diagnostic utility (Hanley 1989). In this study, it was demonstrated that increases in ALT and AST had diagnostic accuracy for manifestations of hepatocellular and biliary injury that was comparable to that for increases in total bilirubin and serum bile acids in rats (AUC 0.82–0.87). In fact, for the majority of rats with transaminase increases but no morphologic evidence of hepatocellular or biliary injury, there was biochemical evidence of cholestasis indicated by increases in total bilirubin and serum bile acids but not GGT or ALP. This is consistent with the pathogenesis of liver injury where functional impairment is often an early manifestation of liver injury. In liver, local cytotoxicity due to bile acid retention can activate hepatocellular apoptotic pathways and cause mitochondrial dysfunction and inflammation with the release of reactive oxygen species. Thus, biochemical evidence of cholestasis can provide both mechanistic and predictive insights into hepatocellular injury.
Liver hypertrophy is often correlated with ALT increases in nonclinical studies, potentially originating from some of the older literature where corticosteroid-mediated induction of gluconeogenesis was linked with liver hypertrophy and increases in circulating ALT activities (Haining 1970; Lake et al. 1998). While ALT is a gluconeogenic enzyme, induction of gluconeogensis is also associated with the induction of cytochrome P450 (CYP)3A; however, the induction of either hepatic drug metabolizing enzymes or gluconeogenesis alone does not in itself cause notable increases in serum ALT activity in the absence of hepatocellular injury (Jackson et al. 2008; Ennulat, Magid-Slav, et al. 2010; Ennulat, Walker, et al. 2010). Retrospective studies of the relationship between hepatic drug metabolizing enzyme (DME) induction and liver histology, liver weight, and hepatobiliary markers in rat (Amacher, Schomaker, and Burkhardt 1998), dog (Amacher, Schomaker, and Burkhardt 2001), and monkey (Amacher et al. 2006) toxicology studies have demonstrated that, in the absence of histologic evidence of liver injury, CYP450 induction and associated liver weight increases and hepatocellular hypertrophy are not associated with changes in serum ALT activities. The lack of association of ALT with hepatic DME was also reflected in the rat meta-analysis where none of the traditional hepatobiliary markers examined had diagnostic utility for hypertrophy (AUC 0.53–0.66), and transaminase values were only minimally increased in rats in the absence of necrosis (mean [SD] 1.4 [1.1] fold of control mean; Ennulat, Magid-Slav, et al. 2010). In contrast with ALT, tissue expression of ALP and GGT can be induced in association with hepatic DME induction in dog and rat liver, respectively, sometimes leading to increases in serum activities of these enzymes (Ennulat, Walker, et al. 2010).
In the absence of either hepatocellular necrosis/degeneration or cholestasis, ALT and other hepatobiliary injury markers have limited diagnostic value for manifestations of hepatic lipid or glycogen accumulation, or parenchymal inflammation in the rat (AUC 0.32–0.66). Serum cholesterol and triglyceride concentrations, often considered indicators of liver function, have no diagnostic utility for intrahepatic lipid accumulation based on the low magnitude of both AUC values (0.57 and 0.51, respectively) and serum concentrations (
Novel renal biomarkers and renal safety risk assessment
It is well known that traditional markers of renal injury or function lack sensitivity as well as specificity. The serum markers urea nitrogen (BUN) and creatinine (sCr) are markers of general renal injury and do not reflect functional compromise until a considerable portion of the renal parenchyma is affected. In contrast, the quantitative measurement of urinary markers of proximal tubular function such as urinary albumin, protein, or glucose can provide information on both functional status and localization of injury which may precede changes in BUN and sCr.
Recently, novel urinary proteins with specific localization to discrete nephron segments have been qualified for use in rat nonclinical studies and have also been recommended for use as exploratory biomarkers in the clinic (Ennulat and Adler 2015; Brott et al. 2014, 2015). Meta-analyses of these urinary biomarkers for renal injury were performed on qualification studies using tool nephrotoxicants, primarily cisplatin and gentamicin, and as such are heavily biased toward identifying severe manifestations of (primarily) proximal tubular injury. In addition, the narrow histopathologic “space” evaluated by these studies is of limited relevance to predicting the nephrotoxicity seen in drug development because the traditional blood or urine biomarkers often detect the severe manifestations of injury invoked in these studies. Broad assessment of this next generation of novel urinary biomarkers is needed in drug development studies to more accurately evaluate the usefulness of these new markers. However, nephrotoxicity is relatively infrequent in nonclinical studies, as it is seen in as little as 2% of regulatory toxicology studies in nonclinical species (Redfern et al. 2010), and diagnostic performance of these novel renal markers would best be evaluated in a large meta-analysis as done for the qualification studies. Thus, to maximize the diversity of manifestations and mechanisms of renal injury, and to optimize animal usage, collaborative efforts will be needed among sponsors to further characterize the performance of these novel markers in the drug development space.
A major challenge in the evaluation of urinary biomarker data is variability in urine concentrations. Unlike blood, which circulates within an unambiguous vascular space, urine is of an undefined and inconstant volume. To aid interpretation, normalization methods including the use of timed urine collections and expression of urinary biomarker data as a ratio to urinary creatinine concentration or urine volume are standard procedures. Despite these efforts, variability in urine parameters is often quite large and urinary biomarker data are easily misinterpreted. Studies to characterize biological variability of urinary biomarkers in rats (Pinches et al. 2012) and humans (Brott et al. 2014, 2015) have demonstrated that within-individual variation can be up to 100%. Another consideration in the implementation of any new urinary biomarker is understanding aspects of the biology unique to each biomarker. For example, novel renal injury markers such as Kim-1 and neutrophil gelatinase-associated lipocalin (NGAL) are induced in response to renal injury, and differ in the location, onset and duration of upregulation. NGAL has been demonstrated to be rapidly and transiently upregulated within the distal nephron (Paragas et al. 2011), while Kim-1 is a proximal tubular injury marker that is upregulated 24-hr to 48-hr post injury (Humphreys et al. 2013). Other markers such as urinary albumin and protein are constitutive, and their presence in urine can indicate a proximal tubular functional deficit from saturation of tubular absorption due to an excess in the urinary filtrate, for example, with urinary glucose or protein, or they may reflect glomerular injury with excessive passage of large molecular weight proteins into the filtrate (e.g., albumin). For any new biomarker, characterization of the biologic variability of the biomarker, and understanding its dynamic range and biologic behavior are essential first steps in the implementation of that biomarker.
Interpretation of liver and kidney biomarker data is based on a weight of evidence approach that includes understanding of the biomarker biology, its context relative to other study parameters, and the magnitude of change relative to biological variability. In the interpretation of new as well as traditional biomarker data, developing a true understanding of the relationship between biomarker changes and histopathology findings is an iterative process based on continuous learning from the data and questioning of assumptions.
Footnotes
Declaration of Conflicting Interests
The author(s) declared no potential conflicts of interest with respect to the research, authorship, and/or publication of this article.
Funding
The author(s) received no financial support for the research, authorship, and/or publication of this article.