
Abstract
A number of novel urinary biomarkers have been identified and partially qualified for use as markers for renal injury in rats. We use two novel multiplex assays to quantify biomarker concentration in multiple urine collections made prior to and following administration of cisplatin, a common nephrotoxicant, to rats. We investigate the correlation of the magnitude of biomarker changes with the severity of histopathological observations and explore the relationship of these to both dose and sex. The novel biomarkers evaluated are urinary albumin, alpha glutathione s-transferase (α-GST), glutathione S-transferase-yb1 (GSTYb1), lipocalin-2, kidney injury molecule-1 (KIM-1), osteopontin, and renal papillary antigen 1 (RPA-1) and plasma cystatin C, alongside the traditional biomarkers of plasma urea, creatinine, and urinary n-acetyl-beta-d-glucosaminidase (NAG), total protein, and glucose. We show for all time points, and for almost all doses, that male rats consistently had either more severely graded or a higher incidence of histologically observed lesions than females; that changes in urinary glucose, total urinary protein, NAG, and the novel urinary biomarkers albumin, osteopontin, and KIM-1 are clearly temporally associated; and that changes are related to the severity of injury. We also found that receiver operating characteristic curve analysis and area under the curve are significantly higher than urea or creatinine for all new biomarkers except aGST, GSTYb1, cystatin c, and total protein in both sexes.
Keywords
Introduction
Drug-induced kidney injury is a leading cause of candidate compound attrition in drug development (Garrett and Workman 1999; Kola and Landis 2004; Lesco and Atkinson 2001). However, with the exception of histopathological examination, the surrogate functional assessments of urea and creatinine and the evaluation of additional urinary parameters that are used as markers of renal toxicity are widely regarded as being insensitive to, and poorly specific for, renal injury (Han et al. 2002; Star 1998). Over recent years, a number of novel urinary biomarkers (kidney injury molecule-1 [KIM-1], albumin, total protein, β2-microglobulin, cystatin C, clusterin, trefoil factor-3 and renal papillary antigen-1 [RPA-1]) have emerged in rodents and have been shown to be of greater sensitivity and specificity than the traditional plasma markers for the detection of acute drug-induced nephrotoxicity, either tubular, or glomerular (with associated tubular involvement).This improvement in performance has been recognized through a qualification process overseen by the European Medicine Agency (EMA) and Federal Drug Administration (FDA) (EMA 2010; Dieterle et al. 2010; Warnock and Peck 2010). In their commentary around the qualification data, the regulators recognized that to date there had been limited attempts to qualify novel biomarkers in female rats, or to track the resolution of biomarker signals in both sexes during recovery from injury. Subsequently, the regulators suggested additional relevant information be considered to widen the context of use for these biomarkers. These data include investigation of sex differences in response to damage by nephrotoxicants as well as longitudinal assessment of biomarker change after injury and during recovery (EMA 2010).
In this article, the final in a series of three, we aim to address these deficiencies by characterizing the variation in biomarker responses over time following a point injury in both sexes of rat. We follow groups of rats given various doses of cisplatin, a common well-characterized nephrotoxicant, over time (up to 22 days) and relate biomarker changes to observed histopathological findings. We also calculate the sensitivity/specificity profiles for each biomarker against the most prominent histopathological findings.
Two previous papers provide additional data and analysis for this study. The first paper of the series documented the detailed methodology of the study and also reported the biological variation, reference change values and reference ranges for five traditional (two plasma and three urinary) and nine novel (one plasma and eight urinary) renal biomarkers (Pinches et al. 2012a). The second paper reported the effects of shortened collection period on renal biomarkers (Pinches et al. 2012b).
The biomarkers of interest in this study were the traditional biomarkers urinary total protein (TP), glucose and n-acetyl-beta-d-glucosaminidase (NAG) and the novel biomarkers urinary albumin, alpha glutathione s-transferase (α-GST), glutathione S-transferase-yb1 (GSTYB1), lipocalin, kidney injury molecule-1 (KIM-1), osteopontin, and renal papillary antigen 1 (RPA-1).
Methods
A detailed methodology for this study was reported in the first paper in this series (Pinches et al. 2012a). In brief, 85 male and 85 female HsdHAN Wistar rats supplied by Harlan UK were acclimatized for at least 6 days prior to dosing. The animals had free access to pelleted RM1 (E) SQC diet and to water, except during the 6-hr urine collection period when food was temporarily withdrawn. Rats were housed in an accredited facility at AstraZeneca Research Facilities (Nether Alderley, Cheshire, UK). All animal procedures were carried out under local Ethical Committee guidelines and approval, and followed the UK Home Office (1989) “Code of Practice for the Housing and Care of Animals Used in Scientific Procedures.”
Study Design
Ten groups of ten male and ten female (five animals of each sex in each of three control groups) HAN Wistar rats were given a single dose of 0.1 mg/kg (low), 1 mg/kg (mid), or 2.5 mg/kg (high) cisplatin dissolved in 0.9% physiological saline or the same volume per body weight of vehicle to control animals (5 mL/kg), by intraperitoneal injection. Urine samples were collected on a maximum of six occasions with two timed collections on each occasion, the first at 6 hr followed by a rest period and a further collection at 18 hr. Urine collection was performed on days –4/–3 predose and days 2/3, 4/5, 7/8, 14/15, and 21/22 postdose depending upon study group. Blood sampling and necropsy with subsequent histopathology were performed on days 5, 8, and 22. The analysis of novel biomarkers was performed at all time points in males and for 18-hr collections only in females. Therefore subsequent analysis of biomarker data between sexes was only performed on the data from the 18-hr collections.
Materials
Cisplatin (cis-diammineplatinum (π) dichloride) (CAS N°15663-27-1) was purchased from Sigma-Aldrich (Gillingham, UK). Doses were selected on the basis of results obtained in an exploratory dose-finding toxicity study where a clear dose response for degeneration/necrosis of the S3 segment of the proximal tubules was observed at 1 and 5 mg/kg on days 2 and 5 and no response was observed at 0.1 mg/kg. The high dose was selected in order to establish clear kidney toxicity without lethality.
Urine Collection
Urine samples were taken by metabowl collection at 6 and 18 hrs. The 18-hr day/night collection was taken with food available to the study animals. Animals had access to water ad libitum throughout both urine collections. Multiple aliquots were made and analyzed for creatinine, NAG, urine specific gravity, quantitative measurement of glucose and total protein on the day of collection. Aliquoted samples were stored at –80°C until analysis.
Blood Sample Collection and Analysis
Blood sampling was performed at days 5, 8, and 22. For in life blood samples, 1 mL was taken from a tail vein into lithium heparin. For terminal blood samples, 2 mL were taken from the vena cava into lithium heparin.
Biomarker Analysis
Details of the methodology used to analyze urinary and plasma biomarkers and to perform creatinine correction have been described previously. However briefly, novel biomarker analysis was performed on two different multiplex assay plates using a multiplex ECL-based Meso Scale Discovery (MSD) Sector Imager 6000 instrument (MSD, Gaithersburg, MD, USA) according to the manufacturer’s instructions. Traditional parameters were analyzed using a Roche Modular P analyzer (Roche Diagnostics, West Surrey, UK) according to the manufacturer’s instructions.
Histological Examination
Animals were euthanized by inhalation of halothane on days 5, 8, or 22. The body weight was recorded and the thoracic and abdominal cavities examined for macroscopic abnormalities. The kidneys and liver were weighed, sampled, and fixed in 10% buffered formalin for 24–48 hrs. Each kidney was bisected transversely to produce a section including the papilla tip and transverse sections of three lobes were taken from the liver.
The tissue samples were processed to wax blocks, slides prepared, stained with hematoxylin and eosin, and examined by light microscopy and a diagnoses of multiple histopathological features entered into the PathData computerized recording system.
Statistical Analysis
All biomarker values were normalized to concurrent urine creatinine concentration.
For analysis of urine parameters, animal groups were binned by dose (groups 1, 5, 9—control; groups 2, 6—0.1mg/kg dose; groups 3, 7—1mg/kg; groups 4, 8, 10—2.5mg/kg). Mean values for each biomarker, for each dose group, and for each time point were calculated for each sex. Percentage changes in biomarker values from pre-dose for each dose group and at each time point were then calculated for animals of both sex (percentage change = [mean biomarker value – predose mean biomarker value]/predose mean biomarker value × 100).
To cross-compare biomarker performance (sensitivity and specificity) receiver operator characteristic (ROC) curves were created using Analyse-it (Leeds, UK). For each sex, and for each biomarker, area under the curve (AUC) was calculated and compared using a method by DeLong et al. (1988). Novel and traditional biomarker AUCs were compared with the AUC of either urea or creatinine, whichever was higher. The data selected for the ROC curve analysis were the biomarker values that were temporally most closely associated with the histopathological observations. So for groups 1–4, biomarker values used were day 5; groups 5–8, day 8; and groups 9–10, day 22. The binary classifier used in the analysis was the presence/absence of histological change (all grades) of proximal tubular (S3) necrosis.
To determine if grade of histopathology was correlated with concurrent biomarker value, a Spearman rank correlation was performed using GraphPad-Prism (San Diego, CA). Again, biomarker values used were those most closely temporally related to the histopathological observations.
Results
Histopathology
Dose-response relationships in histopathological findings were striking (compare Figures 1 and 2). Multiple changes in the different components of the nephron were present, several of which showed distinct temporally associated variations. In general terms, females showed a reduced incidence and severity of histopathological observations at all doses and time points. Table 1 summarizes the incidence and severity of key histopathological observations across dose groups, sex, and day.
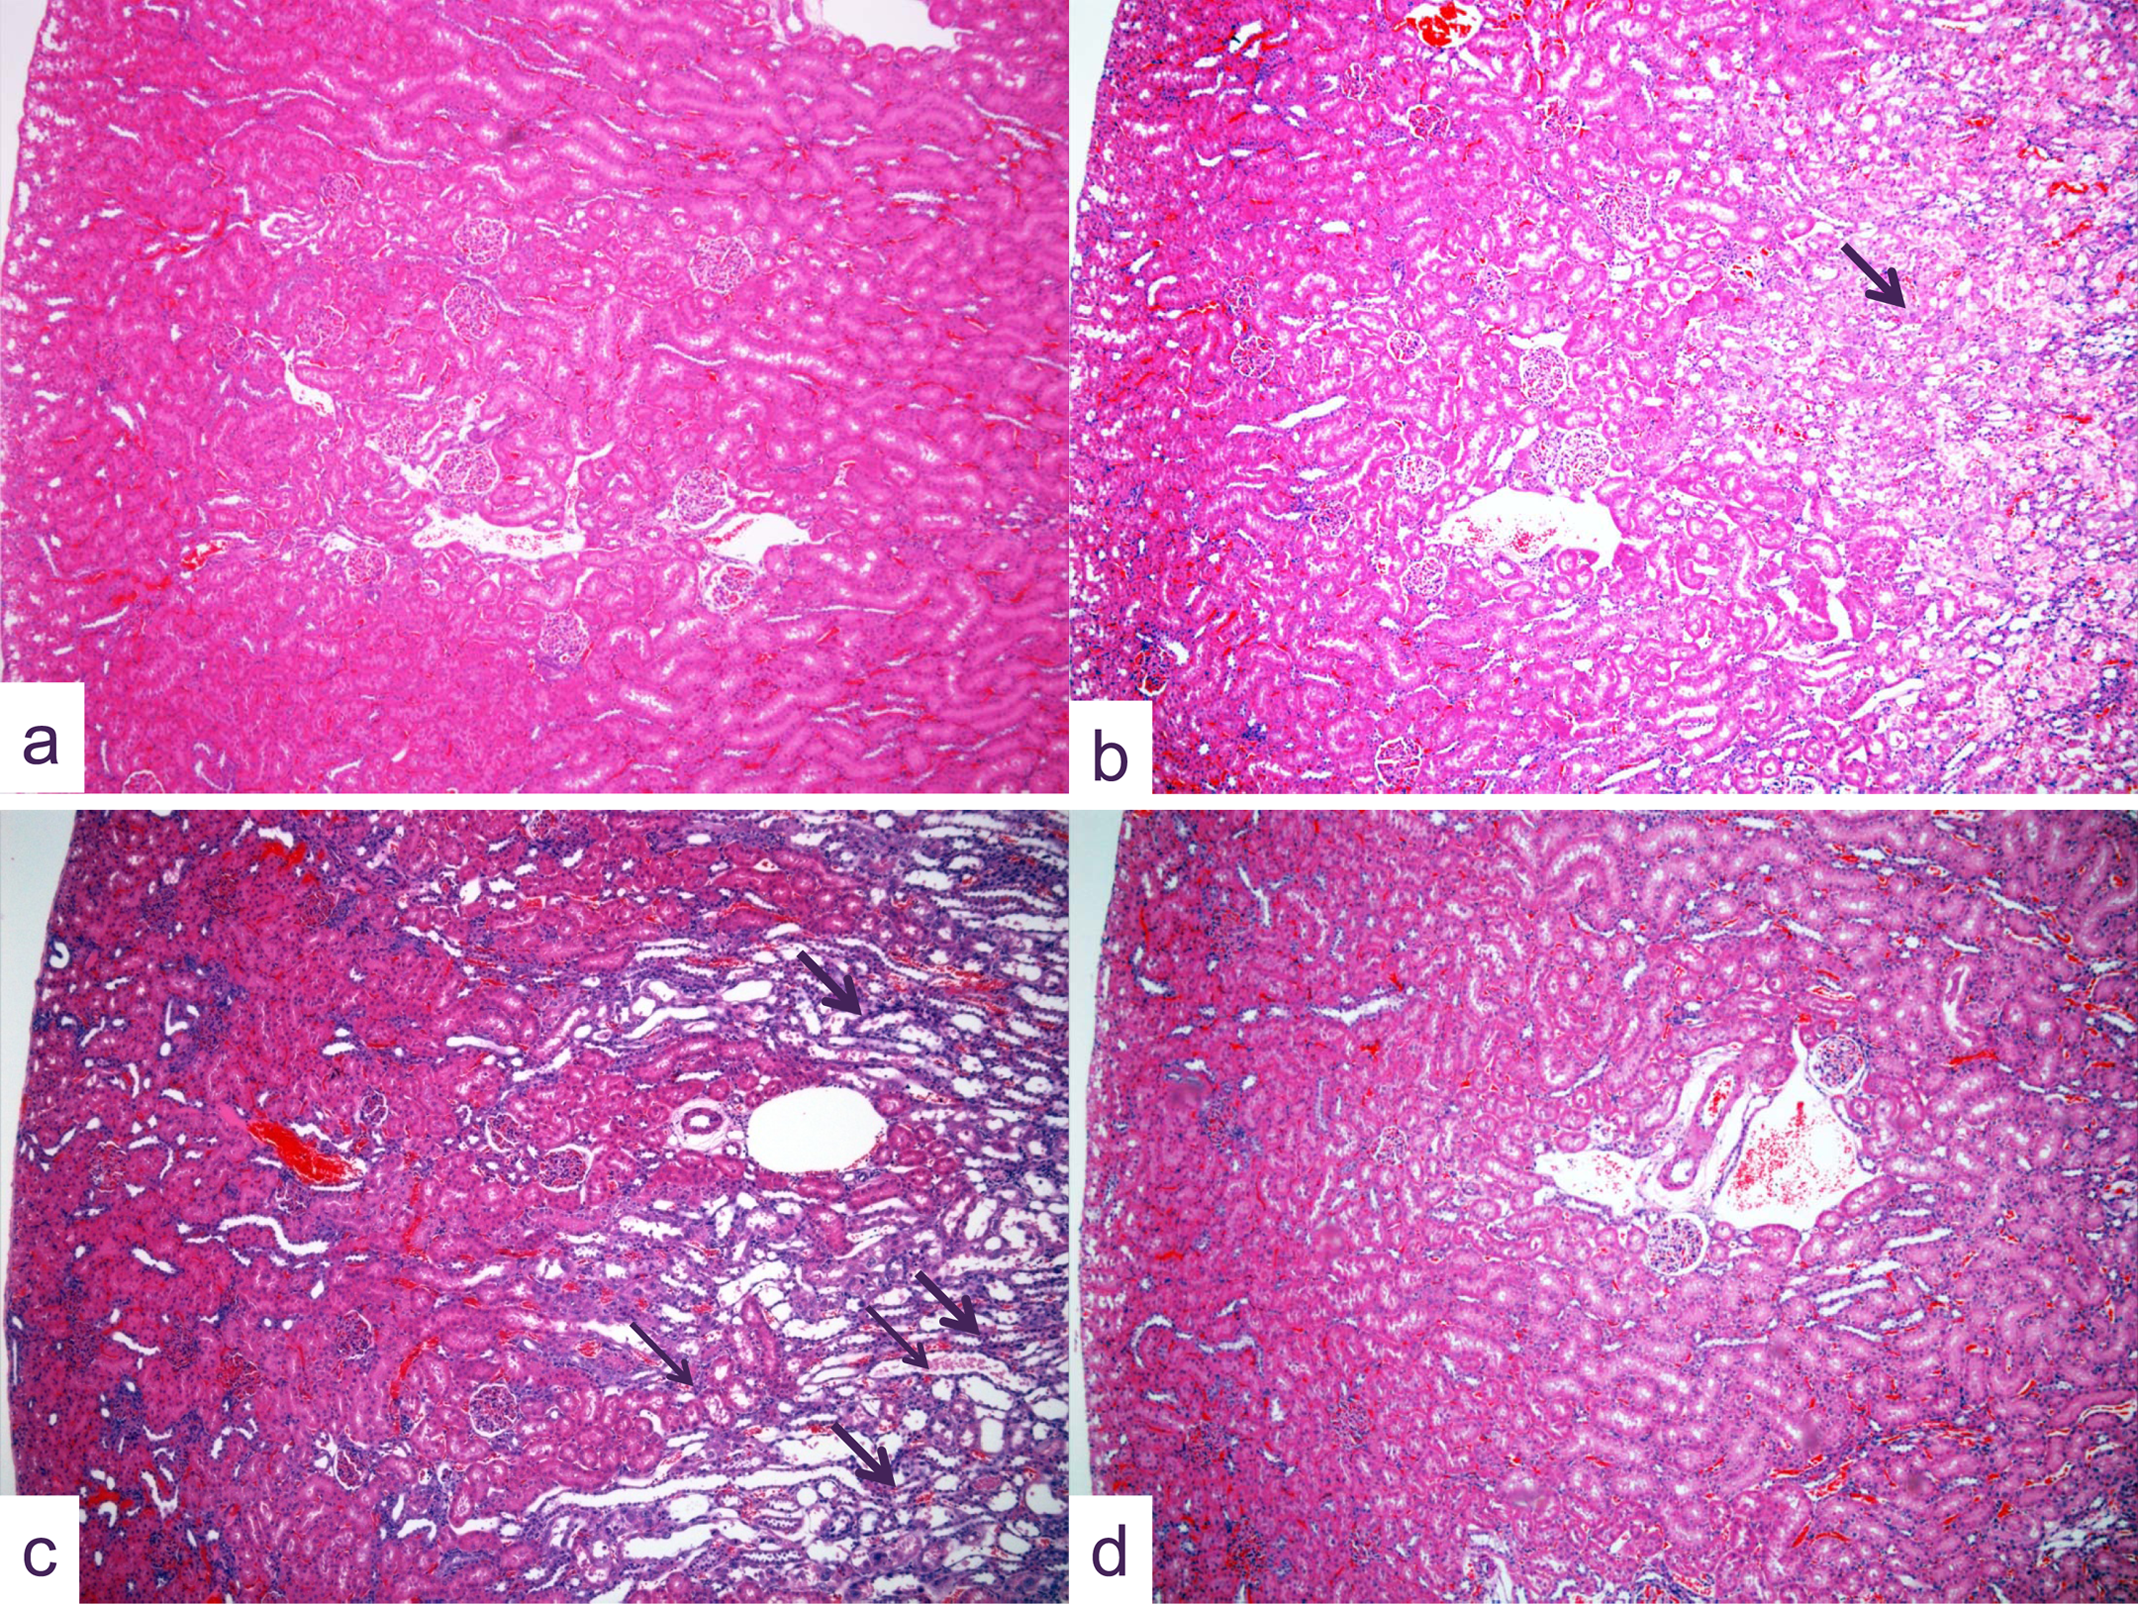
Photomicrographs of kidney sections from (A) control animals and (B–D) rats given a single oral dose of 2.5 mg cisplatin/kg and killed 5 (B), 8 (C), and 22 (D) days later. No lesions are present in (A); while at 5 days (B), severe cortical tubular necrosis especially in the region of S3 proximal tubules occurs (arrow). At 8 days (C) at this site, some tubular necrosis remains evident (small arrows) but substantial tubular regeneration present as tubular basophilia is prominent (large arrows). At 22 days (D) at this magnification, the kidney section appears ostensibly normal (hematoxylin and eosin, original objective lens magnification x5).
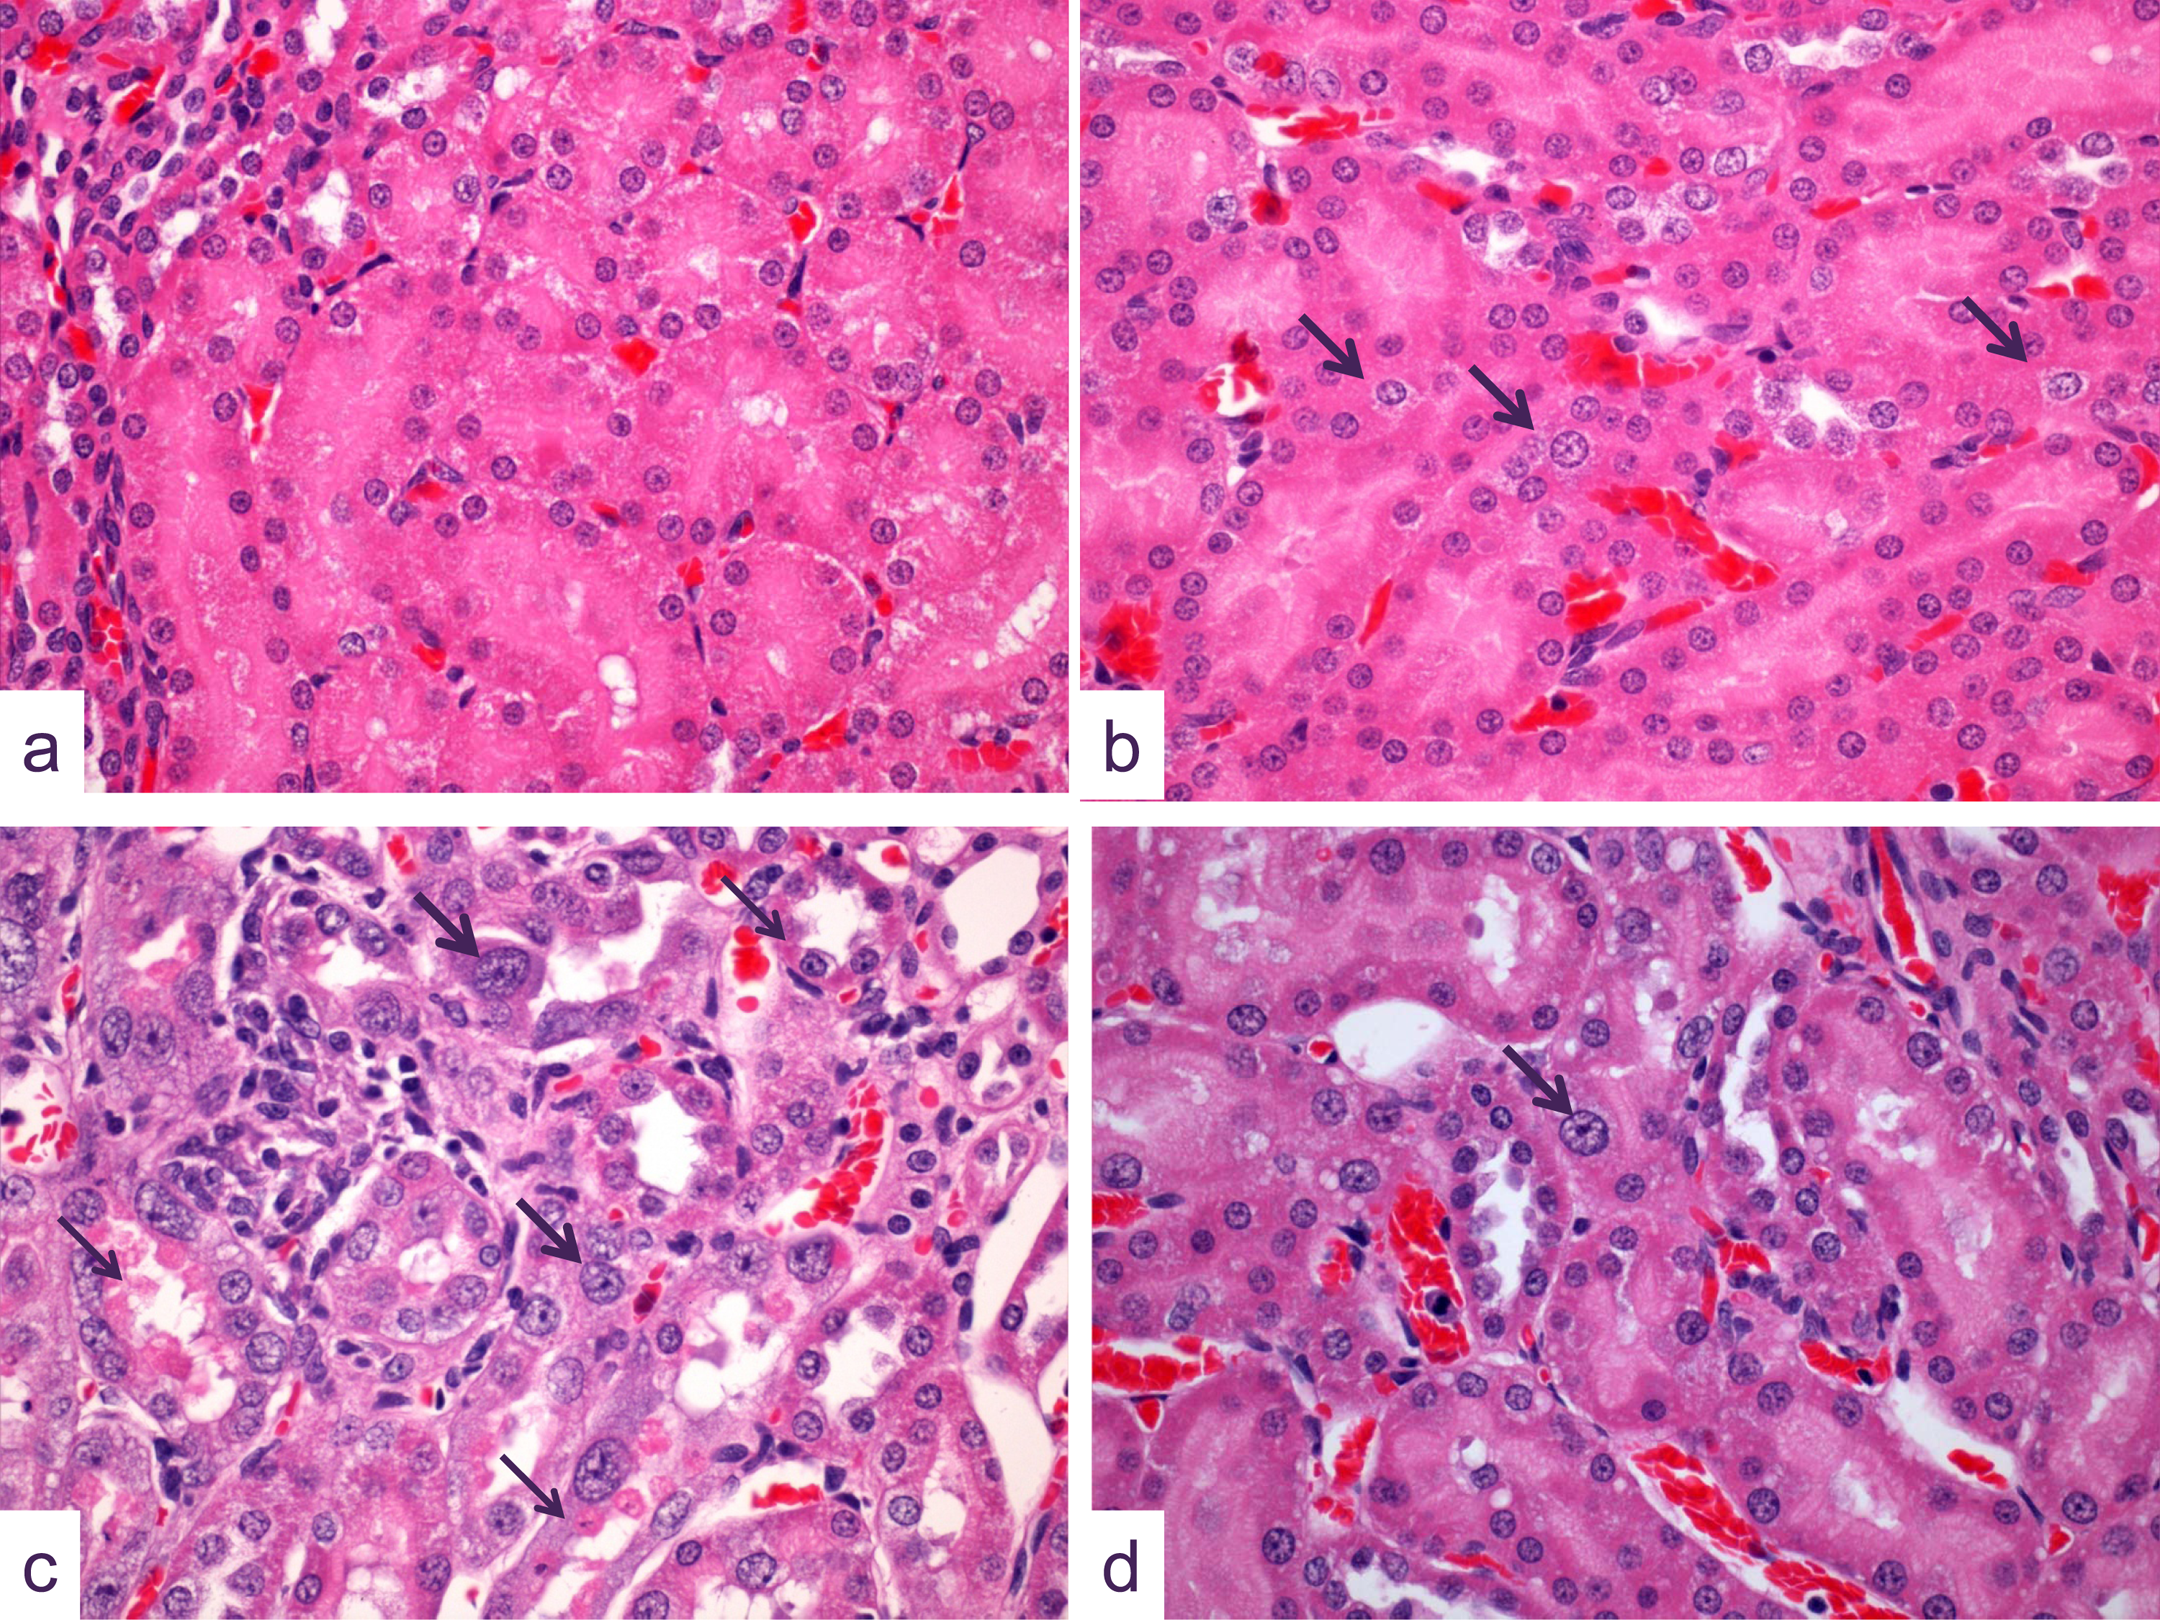
Representative photomicrographs of kidney sections at the cortico-medullary junction showing detail of tissue changes, most notably in S3 segment proximal tubules (A) control, (B) 0.1 mg cisplatin/kg, 5 days, (C) 1 mg cisplatin/kg, 8 days, (D) 2.5 mg cisplatin/kg, 22 days. In (A) the normal appearance of this segment of the proximal tubule shows uniformly small, rounded nuclear profiles; while in (B) at the lowest dose evaluated, at day 5, tubular structure remains unchanged except that greater numbers of tubular nuclei show mild karyomegaly (arrows). Following 1 mg cisplatin/kg administration, at 8 days (C), the degree and incidence of karyomegaly (large arrows) is substantially increased and is coincident with significant residual tubular necrosis (small arrows) and tubular epithelial regeneration. On day 22 after a dose of 2.5 mg cisplatin/kg (D), cortical tubular regeneration is well established, although significant tubular epithelial nuclear karyomegaly (arrow) remains (hematoxylin and eosin, original objective lens magnification x40).
Incidence and severity of key histopathological observations across sex, dose, and day following dosing with 0.0 mg/kg, 0.1 mg/kg, 1 mg/kg or 2.5 mg/kg cisplatin in rats.
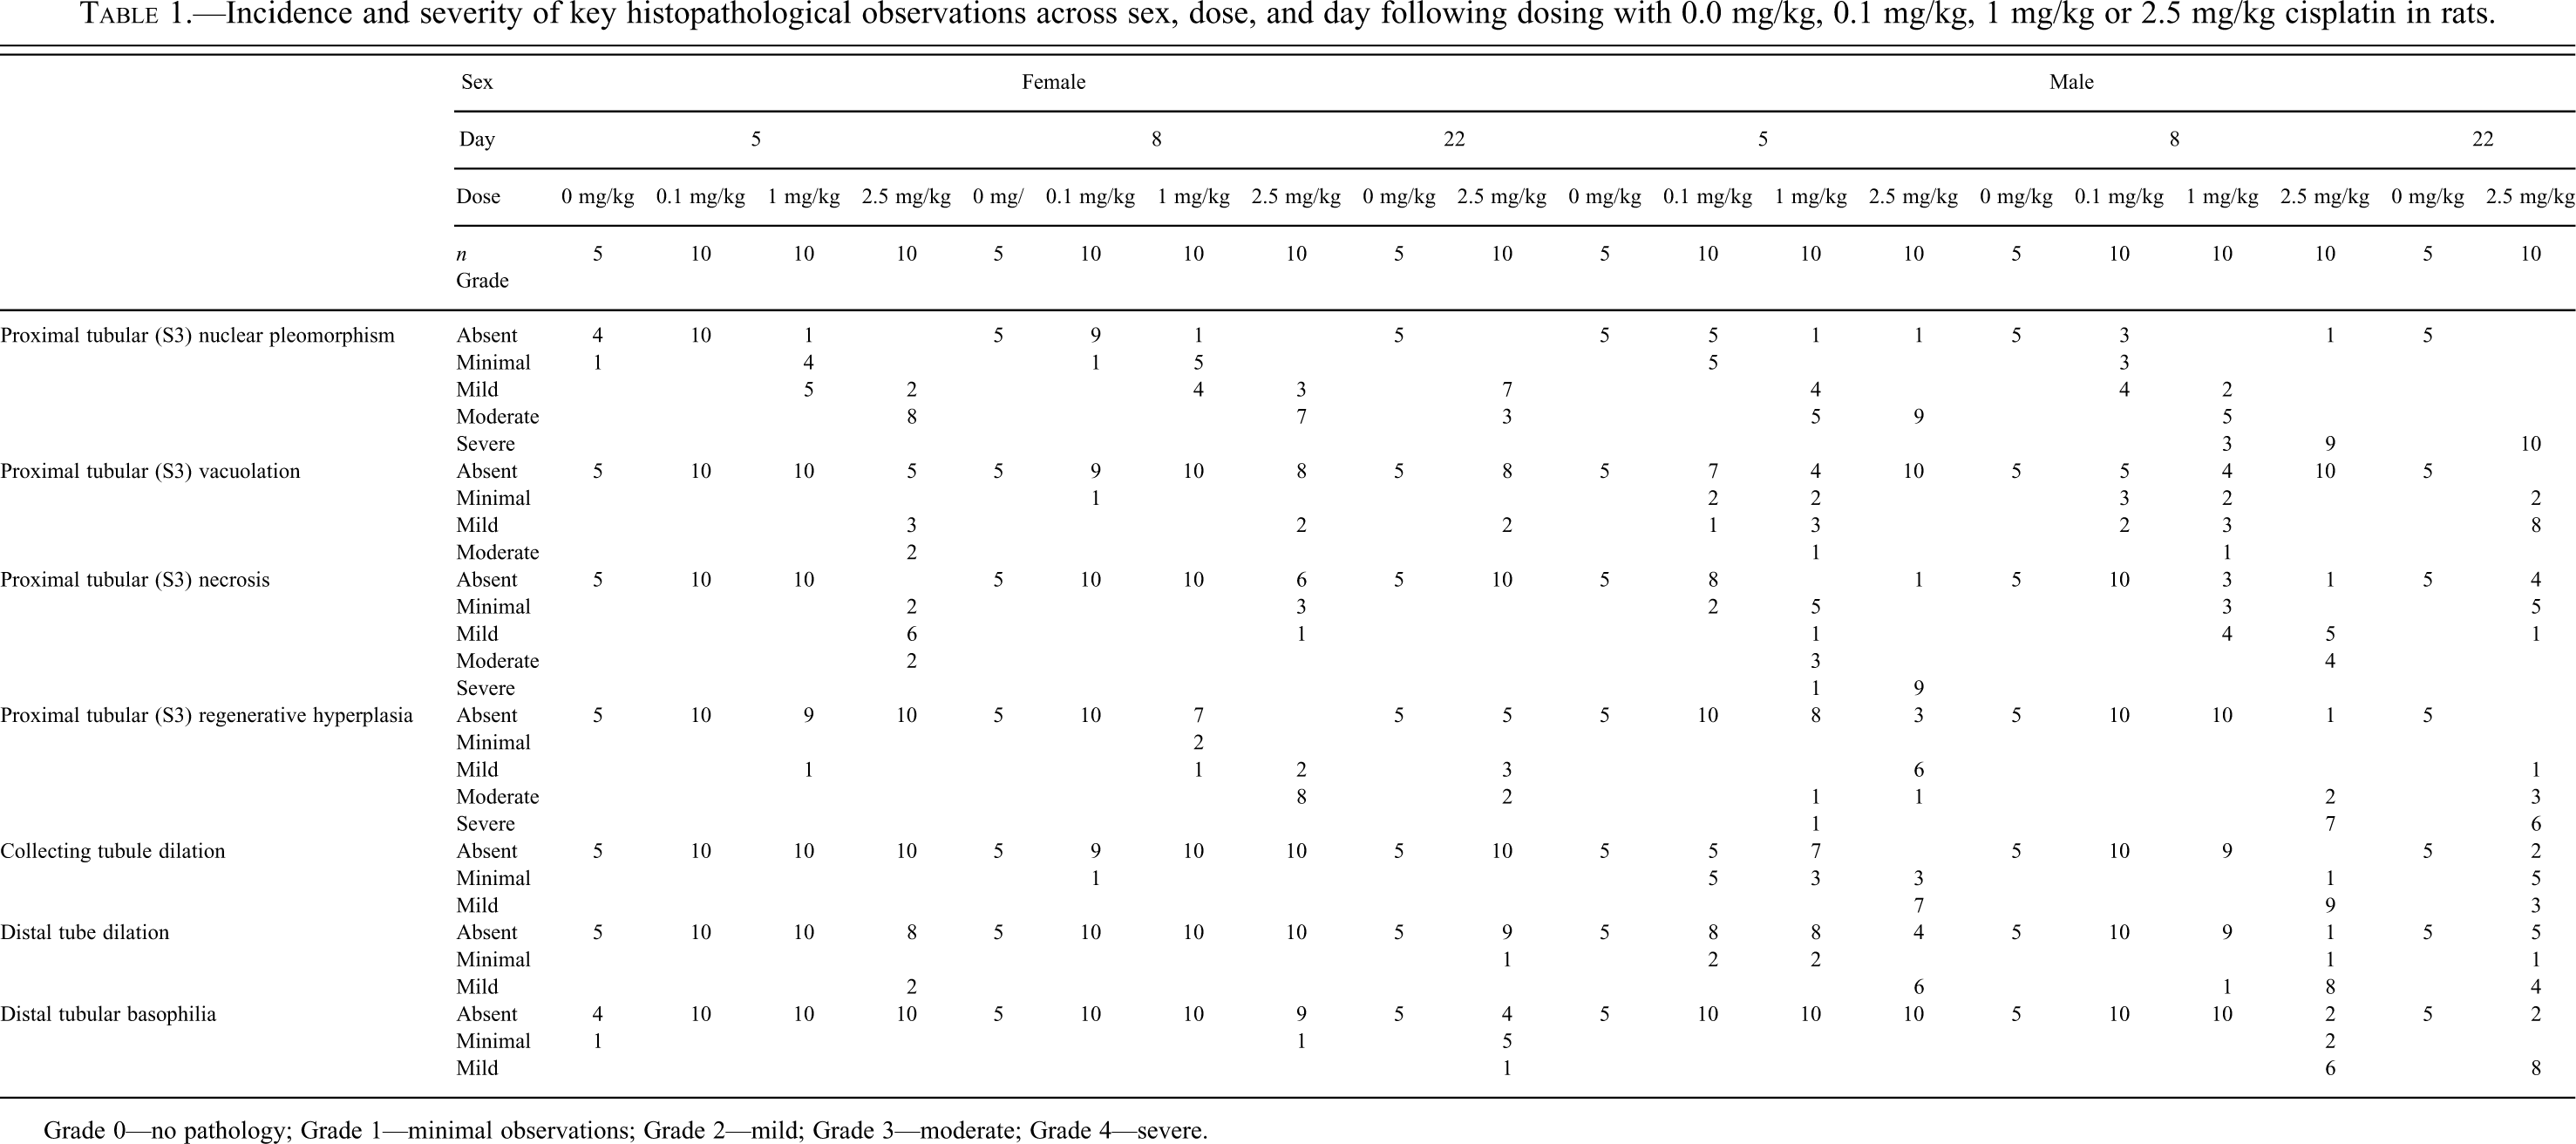
Grade 0—no pathology; Grade 1—minimal observations; Grade 2—mild; Grade 3—moderate; Grade 4—severe.
2.5 mg/kg dose group
Five days after administration of 2.5 mg/kg cisplatin (group 4), the major site of toxicity was in the proximal tubule (mostly the S3 segment), which showed significant incidence and/or severity of nuclear pleomorphism, and tubular necrosis in both sexes (Figures 1b). Proximal tubular regenerative hyperplasia was present in most males but no females. Other pathological changes that were seen at this time point at low incidence and severity included vacuolation, necrosis of the distal tubule, and dilatation of the collecting tubule.
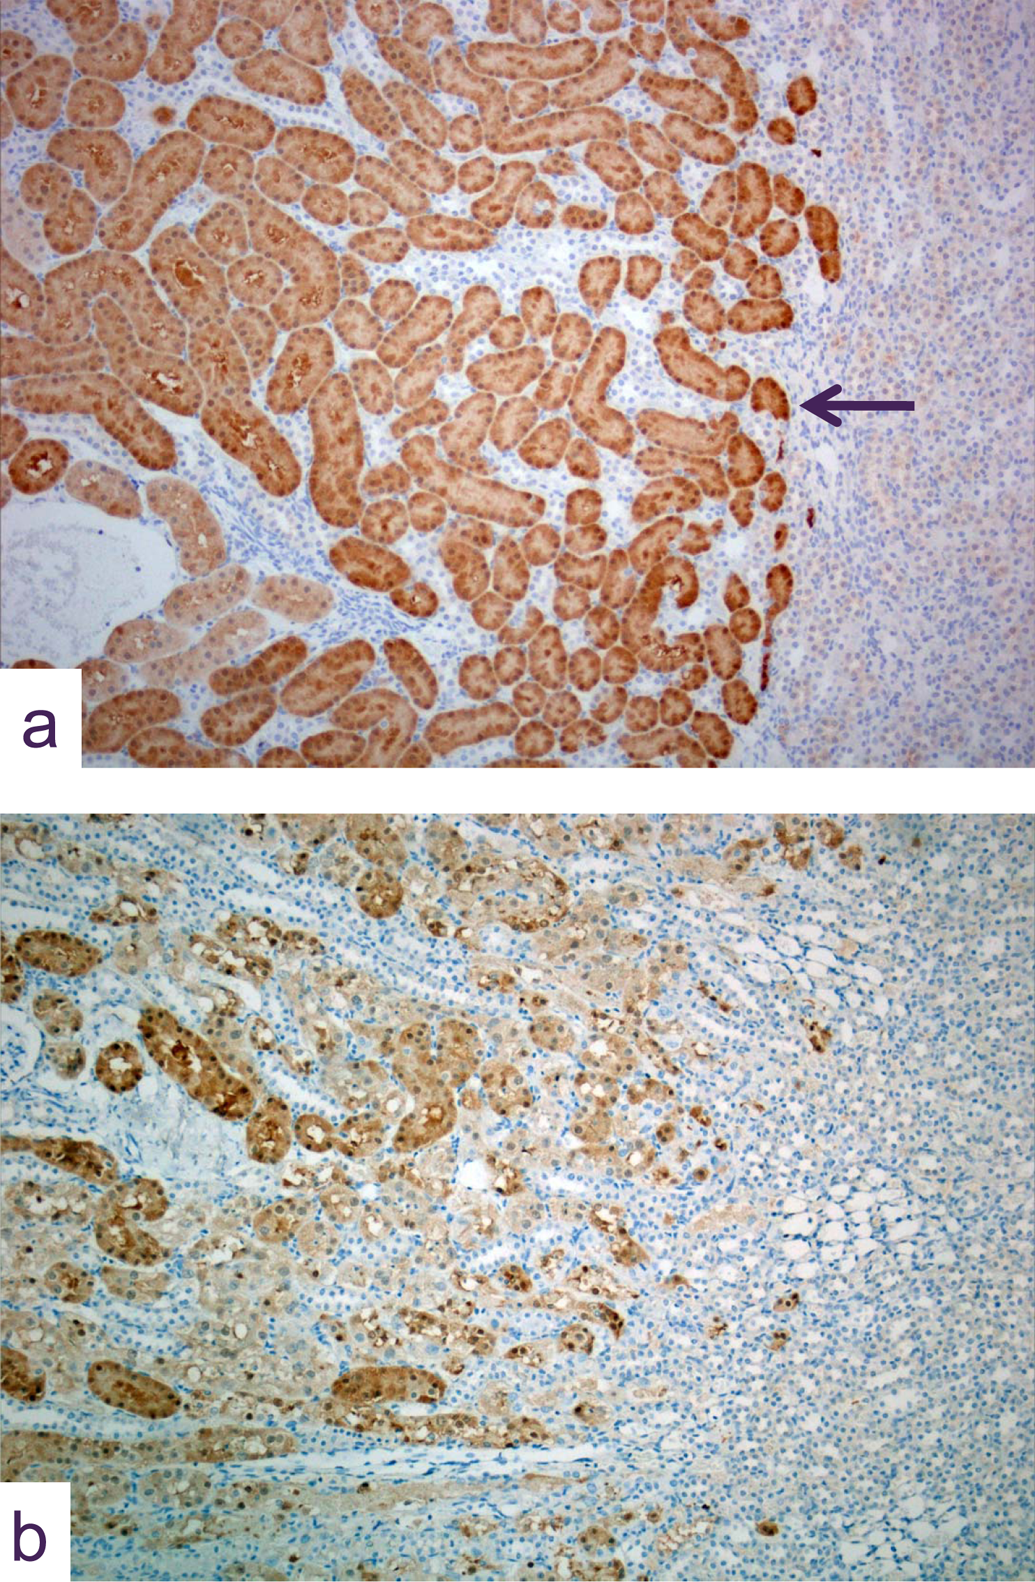
Photomicrographs of kidney sections immunohistochemically stained for GST. In (A) the normal uniform staining in this tissue from a control animal is localized exclusively to proximal tubules: note the sharp delineation between the unstained medullary tissue and the cortex at the limit of the S3 segment tubules (arrow). In (B) fragmented and heterogeneous staining in S3 tubules in a kidney from an animal given 2.5 mg cisplatin/kg and killed 5 days later. (original objective lens magnification x10).
At 8 days postdose (group 8), the proximal tubular changes were of similar nature to those seen at 5 days, although severity was reduced. Proximal tubular regenerative hyperplasia was also now evident in females and of greater severity in males (Figure 1C). Cortical distal tubular dilatation and collecting tubular dilatation were at a similar level as that seen at day 5 in males, but were absent in females. Also in males, distal tubular basophilia (regeneration) and collecting tubular basophilia were evident at high incidence but at low severity.
At 22 days postdose (group 10), in the majority of males, numerous changes were still present in the kidney. In females, similar changes in morphology were apparent but were less severe and less frequent. to those seen previously. In most males and a number of females, changes in the form of proximal (S3 segment) tubular vacuolation, nuclear pleomorphism, and regenerative hyperplasia were present to some degree, while minimal or mild tubular necrosis was seen in six male animals only. In addition to these injuries, minimal cortical distal tubular necrosis was present in two males. Distal and collecting tubular basophilia and dilatation of minimal to mild severity were evident in most males but few females.
1 mg/kg dose group
In males, following 1.0 mg/kg cisplatin at 5 days postdose (group 3), the incidence of proximal tubular S3 segment nuclear pleomorphism and necrosis was approximately the same as that seen at 2.5 mg/kg, but the severity of these changes was reduced. In females, the pathological findings were of a reduced severity and incidence when compared with males. Principal finding at this time point was minimal to mild proximal tubular nuclear pleomorphism only. In males at 8 days postdose (group 7) findings were similar to day 5 but the incidence and severity of S3 tubular necrosis was reduced by comparison In females, similar findings to day 5 were noted.
0.1 mg/kg dose group
Following dosing with 0.1 mg/kg cisplatin (groups 2 and 6), the features of cisplatin toxicity described above were present only in a few male animals and 1 female at both days 5 and 8 postdose. These findings of minimal severity included proximal tubule (S3) vacuolation and nuclear pleomorphism and in 2 males, minimal tubular necrosis at day 5.
Plasma Biomarkers
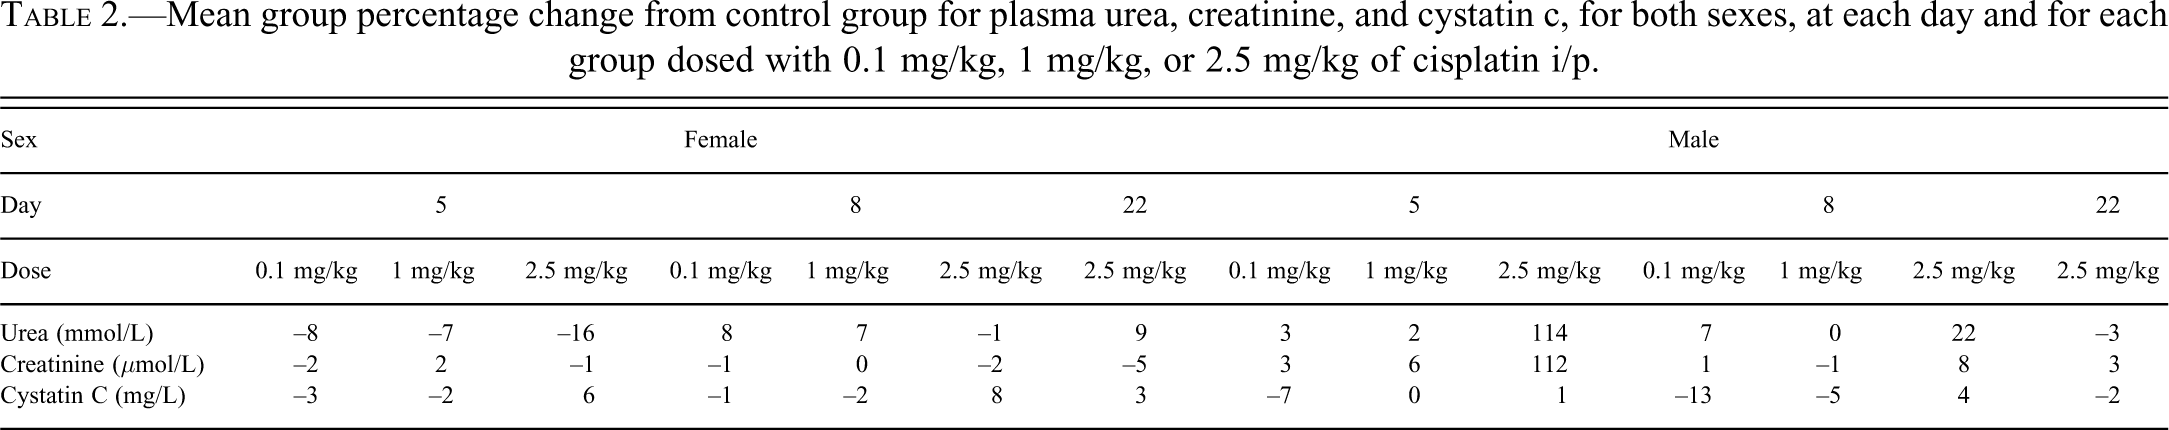
Changes in plasma biomarkers were only noted in male rats dosed with 2.5 mg/kg of cisplatin. At day 5 both urea and creatinine were higher than the control group (˜100%), at day 8 only urea was marginally higher than the control group (22%). There were no changes of note in the female rats group mean values following any dose. The mean group percentage change from controls for urea, creatinine, and cisplatin, for each sex and dose group over time, are shown in Table 2.
Mean group percentage change from control group for plasma urea, creatinine, and cystatin c, for both sexes, at each day and for each group dosed with 0.1 mg/kg, 1 mg/kg, or 2.5 mg/kg of cisplatin i/p.
Urinary Biomarkers
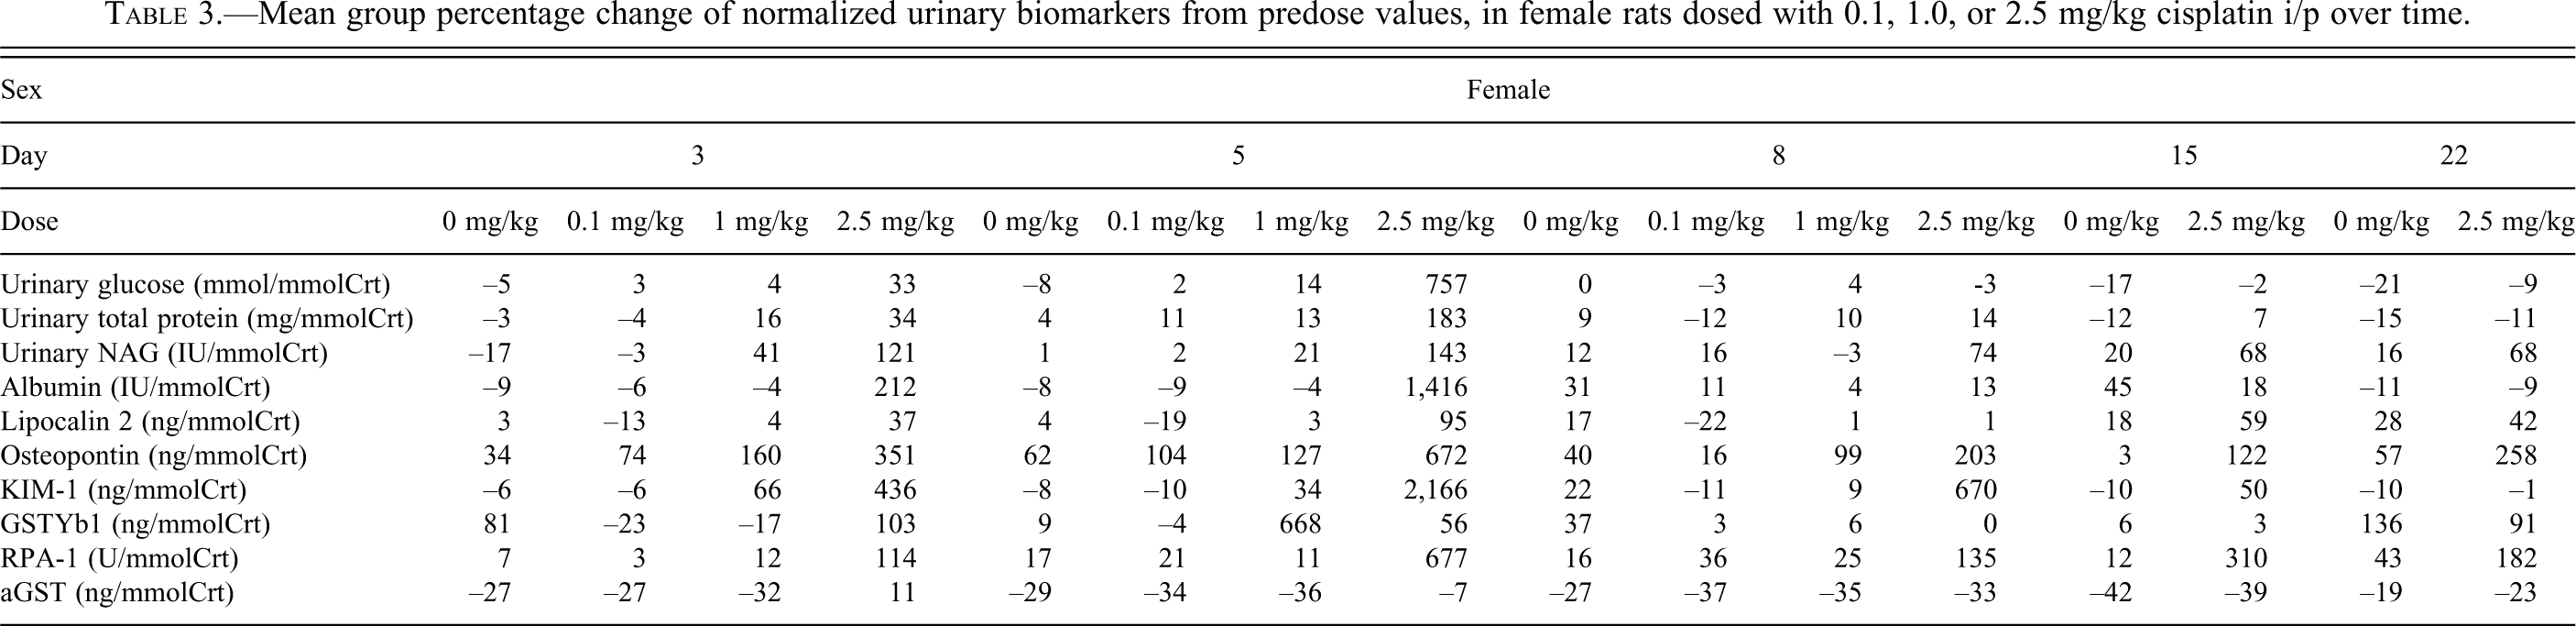
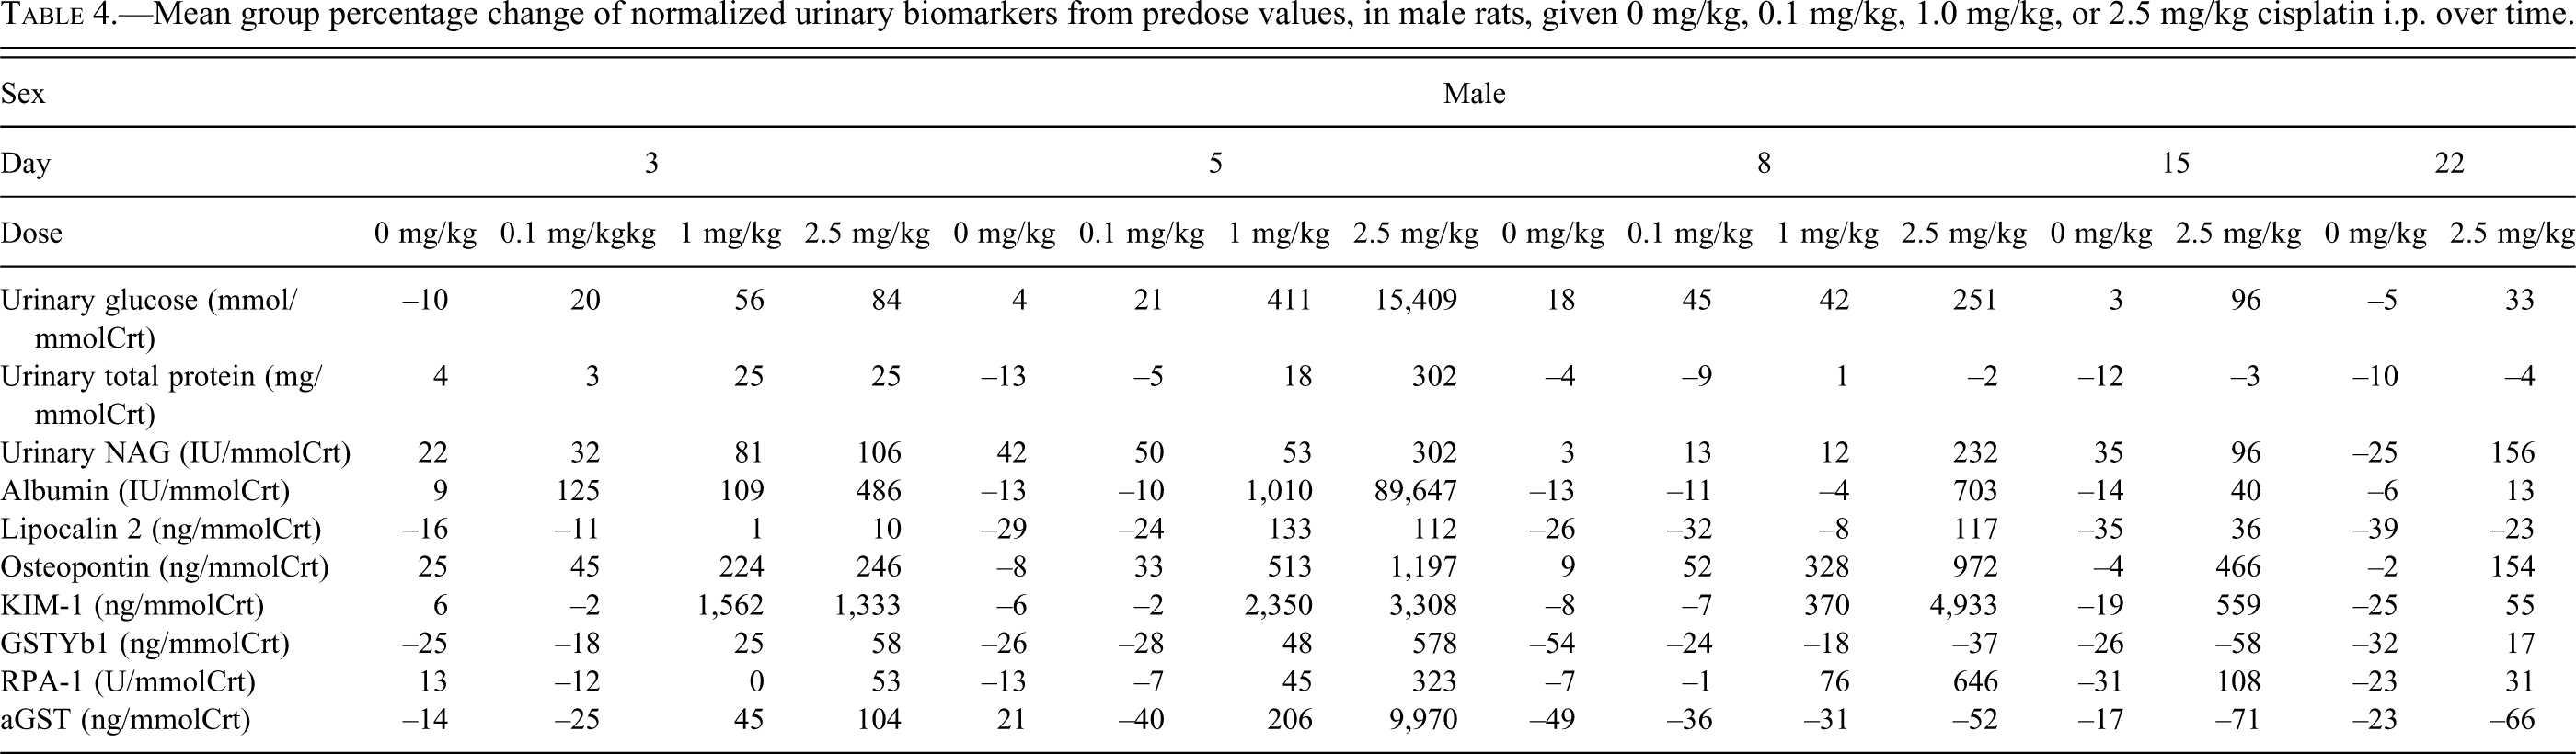
Dose-response relationships in biomarker values were striking. Multiple biomarkers showed changes, several of which showed distinct temporally associated variations. In general terms, and similar to the histopathological observations, biomarker changes in females were of a reduced magnitude and tended to be seen in the 2.5 mg/kg dose group only. The mean urinary biomarker percentage change from predose values for each dose group at each collection are shown for females in Table 3 and males in Table 4 and are also referenced in the text below.
Mean group percentage change of normalized urinary biomarkers from predose values, in female rats dosed with 0.1, 1.0, or 2.5 mg/kg cisplatin i/p over time.
Mean group percentage change of normalized urinary biomarkers from predose values, in male rats, given 0 mg/kg, 0.1 mg/kg, 1.0 mg/kg, or 2.5 mg/kg cisplatin i.p. over time.
Urinary glucose
Urinary glucose increases were dose-, temporally- and sex-related. Glucose increased most dramatically in males. Maximal values occurred at day 5 in the high-dose group (15,409%), but emerged at day 3 in the mid (56%) and high dose (84%) groups and remained increased until day 22 (33%) in the high dose group. In contrast in females clear increases were limited to the high-dose group at day 5 (757%).
Urinary total protein
Increases were noted in both sexes in the high-dose group at day 5 only. Males had a greater percentage increase than females (302% vs. 183%).
NAG
Urinary NAG increases were dose-, temporally, and sex-related. In both sexes, NAG was increased at all time points in the high-dose group (106%–302%). The magnitude of increase was generally higher in males (e.g., day 5, high-dose group, 143% females, 302% males). There was also an increase in males dosed with 1 mg/kg at day 3 (106%).
Albumin
Albumin increases were dose-, temporally- and sex-related. Increases were most dramatic in males. Maximal values occurred at day 5 in the high-dose group (89,647%), but emerged at day 3 in all dose groups (0.1 mg/kg 125%, 1 mg/kg 109%, 2.5 mg/kg 486%) and remained until day 15 in the high-dose group (40%). In contrast, in females, clear increases were limited to the high-dose group at days 3 (212%) and 5 (1,416%) and were of a reduced magnitude when compared with males.
Lipocalin-2
Lipocalin-2 increases were minor in nature in both sexes and restricted to the high-dose groups at either day 5 for both sexes (females 95%, males 112%) and day 8 for males (117%) and day 15 for females (59%).
Osteopontin
Osteopontin increases were dose-, temporally, and sex-related. Osteopontin was increased in both sexes, in both the mid- and high-dose groups, at days 3 and 5 (females 127%–672%, males 224%–1,197%). For days 8–22, the high-dose group of both sexes was increased (females 258%–203%, males 972%–154%) plus the mid-dose male group at day 8 (328%). Increases were more marked in females at day 3 (351% vs. 224%) but in males thereafter (except day 22) and were maximal at day 5.
KIM-1
KIM-1 increases were dose-, temporally, and sex-related. KIM-1 was increased in males in both the mid- and high-dose groups, at days 3, 5, and 8 (370%–4,933%). For days 15–22, the high-dose group was increased (559%–55%). Increases were maximal at day 8, then decreased in magnitude. In females the magnitude of increase was reduced and limited to the high-dose group for days 3–15 (50%–2,166%), except at day 3 where the mid-dose group was also increased (66%).
GSTYb1
In males, increases were limited to the high-dose group at day 5 (578%). In females, minor increases were seen in the high-dose group at day 3 (103%) and the mid-dose group at day 5 (668%), and in the control group at day 22 (136%).
RPA-1
RPA-1 increases were dose- and temporally related. In females, increases were noted in the high-dose group from days 3–22 (114%–677%) that were maximal at day 5. In males, increases were noted in the high-dose group at days 5–15 (323%–646%). Maximal increases were noted in females.
aGST
In males, increases were noted at days 3 and 5 in the high-dose group (104%–9,970%) and at day 5 in the mid-dose group (206%). Increases were minor except in the high-dose group at day 5 that were very marked. No changes were noted in females.
Receiver Operating Characteristic Curve Analysis and Area under the Curve
ROC curve AUCs for both sexes and for each biomarker are shown in Table 5. For proximal tubular (S3) necrosis, there were significantly higher AUCs for all new biomarkers in both sexes except for aGST and GSTYb1. For the traditional markers, AUC was significantly higher than either urea or creatinine for NAG in both sexes, and for glucose in males.
Area under the receiver operator curve for female and male rats that received 0 mg/kg, 0.1 mg/kg, 1 mg/kg, or 2.5 mg/kg cisplatin ip.
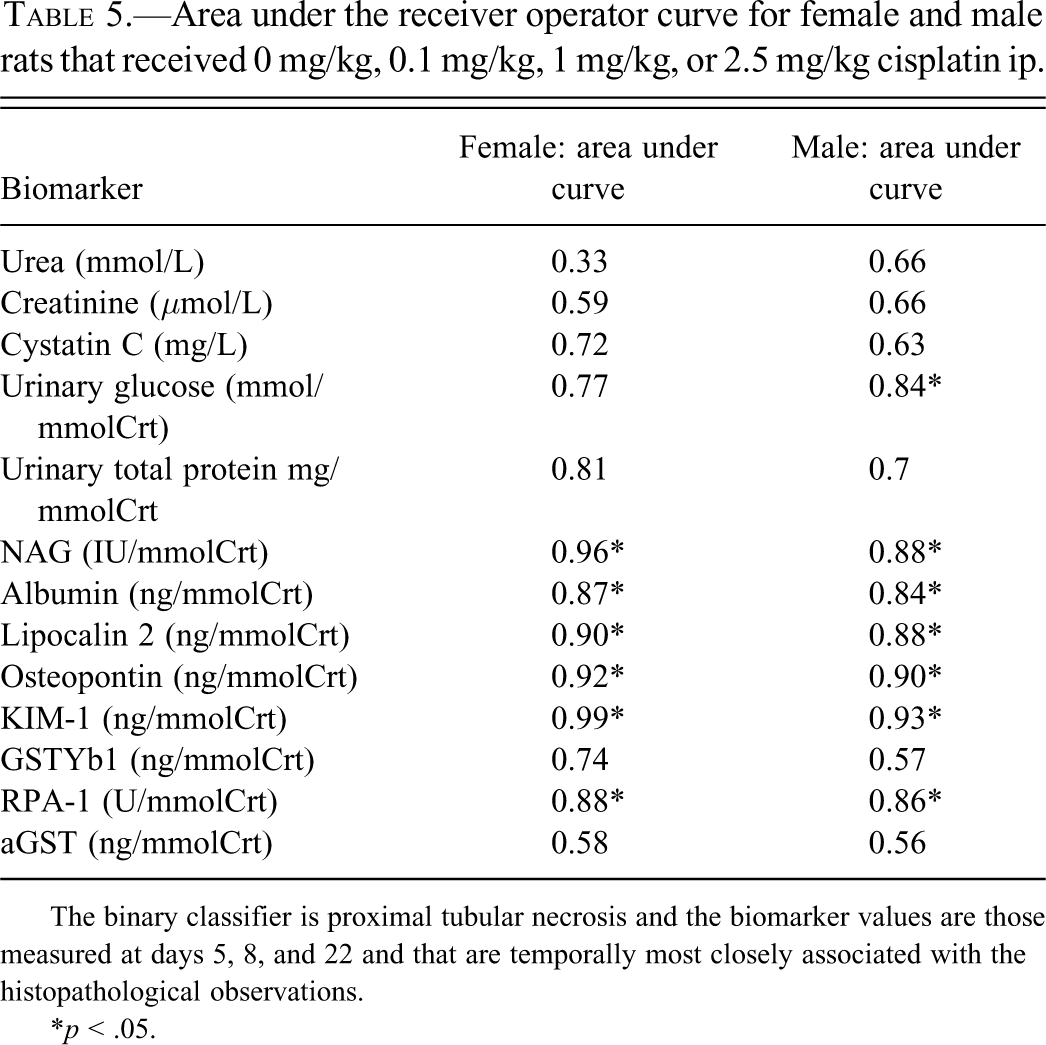
The binary classifier is proximal tubular necrosis and the biomarker values are those measured at days 5, 8, and 22 and that are temporally most closely associated with the histopathological observations.
* p < .05.
Correlation of Biomarkers to Grade of Histopathological Observation
Spearman rank correlation coefficients are shown in Table 6. For proximal tubular (S3) necrosis, KIM-1, Osteopontin, Lipocalin-2, NAG, and urinary glucose had correlation coefficients over 0.6. For proximal tubular (S3) regenerative hyperplasia, no biomarkers had a correlation coefficient that exceeded 0.6. Figures 4 and 5 shows selected biomarker data against histological grade of proximal tubular (S3) necrosis.
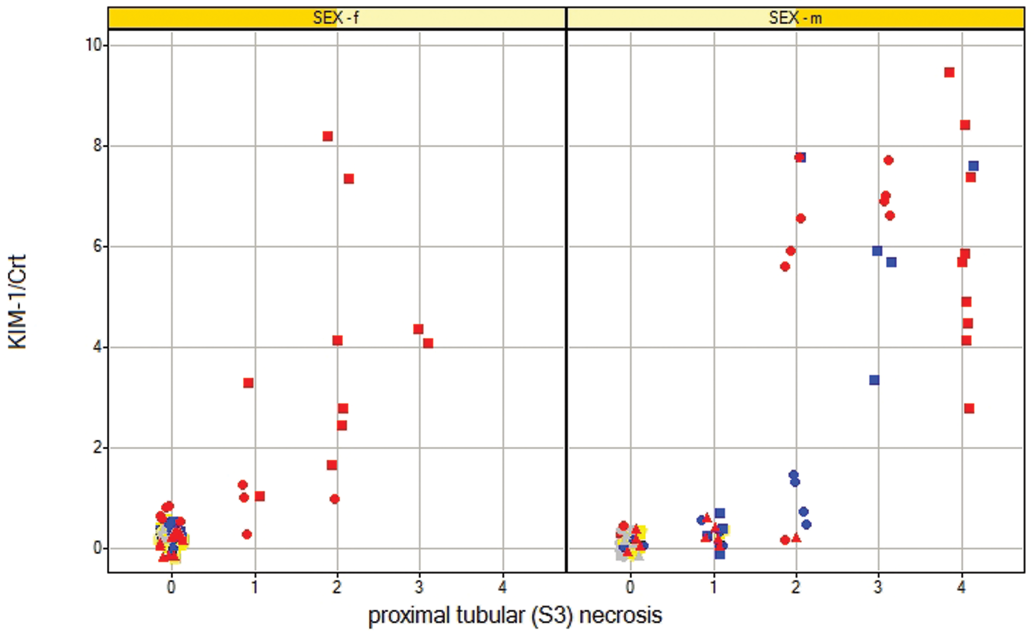
Scatter plots for KIM-1 showing grade of histological finding (proximal tubular S3 necrosis) against the normalized (to creatinine) urinary biomarker values for urinary samples taken from rats of both sexes dosed with 0 mg/kg, 0.1 mg/kg, 1 mg/kg, and 2.5 mg/kg of cisplatin ip. The urine samples are those that are temporally most closely associated with necropsy at either day 5, day 8, or day 22. Color denotes dose (gray 0.0 mg/kg, yellow 0.1 mg/kg, blue 1 mg/kg, red 2.5 mg/kg). Shape denotes day (square day 5, circle day 8, triangle day 22).
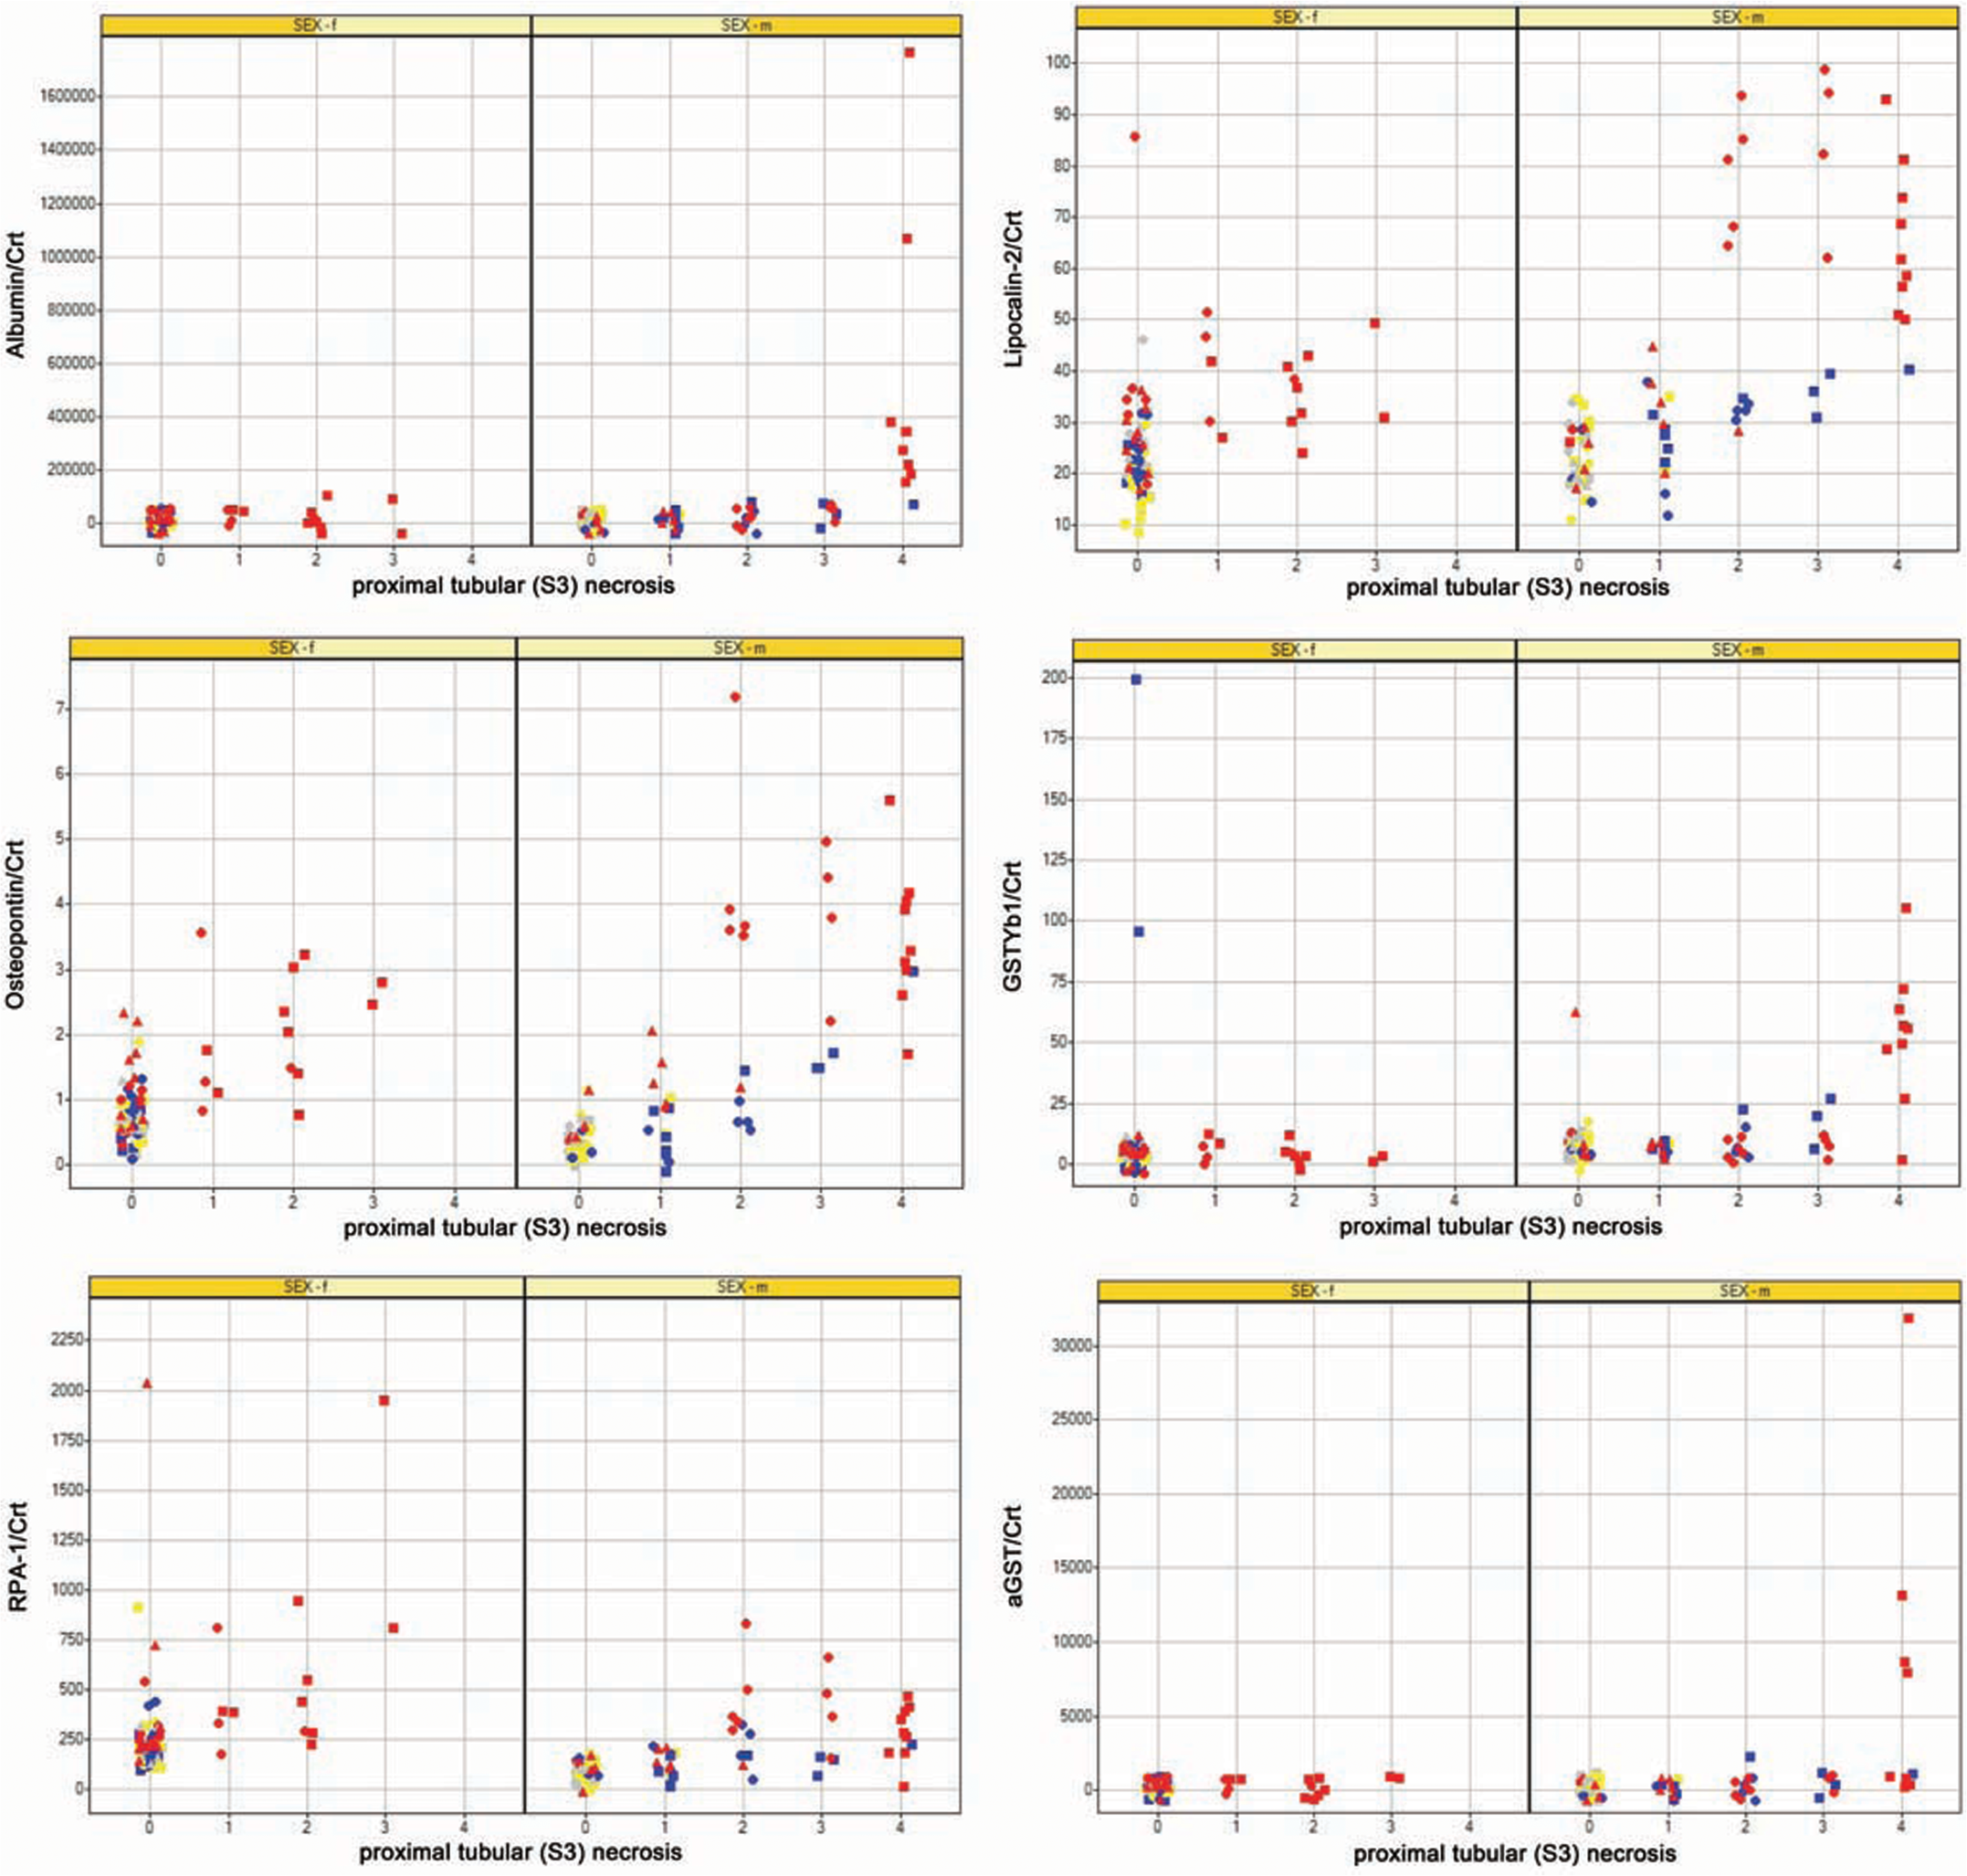
Scatter plots for 6 biomarkers showing grade of histological finding (proximal tubular S3 necrosis) against the normalized (to creatinine) urinary biomarkers values for urinary samples taken from rats of both sexes dosed with 0 mg/kg, 0.1 mg/kg, 1 mg/kg, and 2.5 mg/kg of cisplatin ip. The urine samples are those that are temporally most closely associated with necropsy at either day 5, day 8, or day 22. Color denotes dose (gray 0.0 mg/kg, yellow 0.1 mg/kg, blue 1 mg/kg, red 2.5 mg/kg). Shape denotes day (square day 5, circle day 8, triangle day 22).
Spearman rank correlation of grade of histopathological observation against biomarker value (corrected for creatinine) for rats of both sexes that received 0 mg/kg, 0.1 mg/kg, 1 mg/kg or 2.5 mg/kg cisplatin ip.
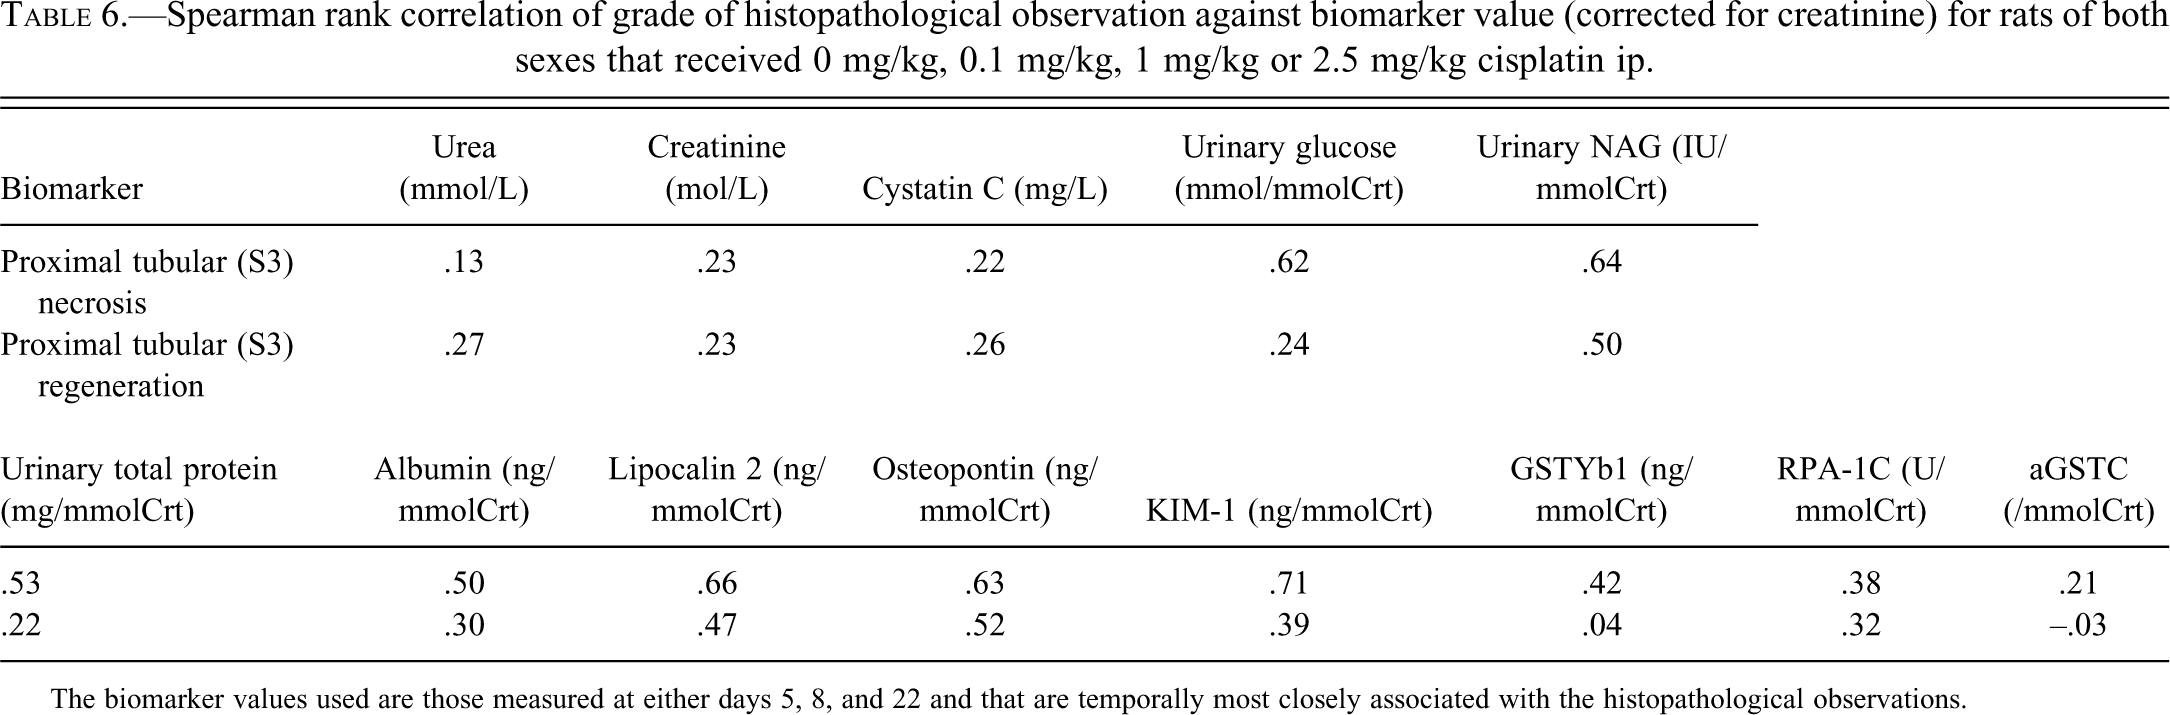
The biomarker values used are those measured at either days 5, 8, and 22 and that are temporally most closely associated with the histopathological observations.
Discussion
Cisplatin is a commonly used anti-neoplastic drug that is administered to human patients for the treatment of a wide variety of cancers. However, it frequently induces renal dysfunction, with 20% of those treated with high doses developing severe renal dysfunction (Yao et al. 2007). In this study we administered cisplatin to rats to explore its well-established nephrotoxic effects as a model of renal injury that will translate across the species. Cisplatin is freely filtered by the glomerulus and is actively taken up by the cortical tubular epithelial cells through an active transport process mediated by the organic action transporter 2 (OCT2). Once in the cell, an aquated cationic form of cisplatin binds to macromolecules such as the cellular DNA and forming adducts that are highly toxic (Jordan and Carmo-Fonseca 2000). These initiate cellular DNA repair process that may lead to apoptosis if repair is impossible (Trzaska 2005). In rodents, such intracellular events are histologically observed as nuclear pleomorphism and karyomegally alongside wider tissue damage of proximal tubular damage and necrosis, most usually in the S3 segment. Following injury, recovery is mediated by proliferation, dedifferentiation, and migration of surviving tubular epithelial cells to repopulate the vacant areas on the tubular basement membrane (Bonventre 2010). Histologically this is observed as tubular regenerative hyperplasia of basophilic epithelial cells.
This is the first study to compare both male and female rats in terms of response to and recovery from damage by cisplatin using the biomarkers plasma cystatin C and urinary albumin, alpha glutathione s-transferase (α-GST), glutathione S-transferase-yb1 (GSTYb1), lipocalin-2, kidney injury molecule-1 (KIM-1), osteopontin, and renal papillary antigen 1 (RPA-1). In comparison with male rats, female rats have been shown to have a reduced sensitivity to cisplatin and show less severe histopathological changes when administered equivalent doses. This gender difference has been reported in the scientific literature and appears to be related to differences in the expression of OCT2 between the sexes. Yonezawa and colleagues (2005) showed that OCT2 is more highly expressed in the proximal tubular epithelial cells of male rats than in females. Consequently in males, intracellular concentrations of cisplatin reach higher levels more rapidly and as a result lead to a more severe nephrotoxicity. Our histopathological findings are in accord with these reports, and our study also indicates that the responses of several urinary biomarkers appear equivalent to the severity of damage induced by cisplatin, with female rats demonstrating proportionately lower biomarker responses compared with males.
The observation of, and a clear rationale behind, a difference in severity of nephrotoxicity between sexes provides an opportunity to explore biomarker changes in relation to histopathological severity in more detail. If biomarkers truly reflect specific tissue injury and are not influenced by sex differences, then in the cisplatin model we can expect biomarker values to be higher in males than females and more likely to be altered in lower-dose groups. Such observations were made for glucose, total protein, NAG, albumin, osteopontin, and KIM-1. In addition, changes in these biomarkers were all positively correlated with the grade of proximal tubular (s3) necrosis observed histopathologically. These observations give additional confidence that for these biomarkers the degree of change is related to the severity of pathology and are not overtly influenced by sex.
The biomarkers that had statistically significant higher areas under the ROC curves than creatinine were broadly similar between sexes. When the ROC were constructed with proximal tubular necrosis (of any severity) as the binary qualifier; NAG, albumin, lipocalin, osteopontin, KIM-1, and RPA-1 were higher in both sexes and for glucose higher in males only. The discrepancy between the sexes with relation to urinary glucose may reflect the influence of the reduced severity of pathology in females, as only high-dose females displayed elevated glucose at day 5. These findings suggest that elevated urinary glucose tends to be associated with the most severe degree of tubular damage and dysfunction, and that there may be sufficient functional reserve in less damaged kidneys to prevent glucosuria.
Elevations of urinary total protein showed a marginal improvement in predictivity of renal injury when compared with the current standards of urea and creatinine, although this did not reach statistical significance in the ROC curve analysis. Elevations of urinary total protein were noted in both male and female top-dose groups at day 5, in contrast to urea or creatinine, which showed increases in males only.
aGST and GSTYb1 were less markedly altered and failed to show any noticeable improvement over the current standard biomarkers of urea and creatinine when evaluated by ROC AUC. Both enzymes showed a small temporal and dose-related response, but this was variable in individual animals and inconsistent between sexes. A marked increase in urinary aGST was apparent in males that was both transient and dose-related, but no similar increase was observed in females. One possible explanation for these inconsistencies was considered to be variation in the analytical performance of the assay between plates. Reanalysis of a selected group of high-dose male and female samples was performed in order to eliminate this possibility. However, reanalyzed values were similar in magnitude to the original (data not shown), so we concluded that this is most likely to be a true sex-related difference and that this biomarker cannot be recommended for use in female rats. GSTYb1 displayed some temporal and dose relationship changes in urinary concentrations that would be indicative of a response following renal injury; however, there was no increase in the high dose female group at day 5. Such a pattern may suggest that GSTYb1 in this group had been released in a rapid burst at a time point that was not sampled. Such a pattern of acute release may limit the use of this biomarker for monitoring renal injury in situations of uncertain aeitiology or mechanism.
Cystatin C was not significantly altered during the course of the study and as such showed no improvement over the current standard biomarkers. This observation is in stark contrast to findings in human studies that show, following cisplatin administration, a close correlation of rising plasma cystatin C to declining GFR (Benöhr et al. 2006) and to other rodent models of renal injury such as puromycin- or gentamycin-induced nephropathy which are associated with changes in plasma cystatin C (Ozer et al. 2009). It is possible that this discrepancy can be accounted for by differences in dose, and dose frequency, between studies. Higher and more frequent dosing are more likely to impact on renal function with subsequent changes in calculated GFR than the single dose regime used in this study.
Lipocalin 2 and RPA-1 displayed broadly similar changes that were of comparable magnitude between the sexes. For RPA-1, females had somewhat greater temporal sensitivity than males. This may be related to differences in the expression of RPA-1 between sexes. RPA-1 is highly expressed in the collecting duct of rats, but it has also been observed focally within the proximal tubule of female rats but not in males (Pinches et al. 2012a, 2012b). As the predominant pathology in this study was noted in the proximal tubule such expression may account for the higher values of RPA-1 in females.
With regard to the temporal changes noted in biomarker values following injury, the clearest associations with histopathological changes were with osteopontin and KIM-1. Values of these biomarkers increased rapidly postdosing, continued to increase in magnitude, and peaked in association with the maximally observed severity and incidence of pathology, following which they began to decline to baseline as the injury resolved. Glucose, NAG, and RPA-1 also demonstrated similar temporal patterns, although these were not as clear-cut. Glucose showed a clear temporal association that was of shorter duration and limited to males; NAG showed increases that were of a similar duration but of a lower magnitude than the other biomarkers; and for RPA-1, despite being clearly altered by cisplatin treatment, the onset and magnitude of changes were somewhat variable between sexes. It is noteworthy that almost all urinary biomarkers had earlier-onset changes than either urea or creatinine. Notably, NAG, albumin, osteopontin, and KIM-1 showed early changes in both sexes. Changes in glucose and aGST were limited to males and GSTYb1 and RPA-1 to females. For these biomarkers, the patterns of biomarker change were most closely related to the emergence and resolution of proximal tubular necrosis. Other histological findings such as proximal tubular nuclear pleomorphism, vacuolation, or regenerative hyperplasia that were clearly present at day 22 were not specifically associated with biomarker changes. These findings therefore suggest that for a number of biomarkers, specifically osteopontin, KIM-1, and less so for glucose, NAG, and RPA-1, variations in biomarker values are associated temporally with the emergence and resolution of tubular injury/necrosis.
Conclusion
In this study, we determined the temporal association of biomarker changes following cisplatin-induced renal injury. We also investigated the correlation of the magnitude of biomarker changes with the severity of histopathological observations and explored the relationship of these to both dose and sex. We find that changes in the traditional biomarkers of urinary glucose; total urinary protein; NAG; and the novel urinary biomarkers albumin, osteopontin, and KIM-1 are clearly temporally associated and that these associations are related to the severity of renal injury.