
Abstract
Radiation detriment is a concept developed by the International Commission on Radiological Protection to quantify the burden of stochastic effects from low-dose and/or low-dose-rate exposures to the human population. It is determined from the lifetime risks of cancer for a set of organs and tissues and the risk of heritable effects, taking into account the severity of the consequences. This publication provides a historical review of detriment calculation methodology since ICRP Publication 26, with details of the procedure developed in ICRP Publication 103, which clarifies data sources, risk models, computational methods, and rationale for the choice of parameter values. A selected sensitivity analysis was conducted to identify the parameters and calculation conditions that can be major sources of variation and uncertainty in the calculation of radiation detriment. It has demonstrated that sex, age at exposure, dose and dose-rate effectiveness factor, dose assumption in the calculation of lifetime risk, and lethality fraction have a substantial impact on radiation detriment values. Although the current scheme of radiation detriment calculation is well established, it needs to evolve to better reflect changes in population health statistics and progress in scientific understanding of radiation health effects. In this regard, some key parameters require updating, such as the reference population data and cancer severity. There is also room for improvement in cancer risk models based on the accumulation of recent epidemiological findings. Finally, the importance of improving the comprehensibility of the detriment concept and the transparency of its calculation process is emphasised.
© 2022 ICRP. Published by SAGE.
MAIN POINTS
Executive Summary
(a) The concept of radiation detriment has been developed by the International Commission on Radiological Protection (hereafter, ‘the Commission’) for the purpose of radiological protection. It is defined as the excess of stochastic health effects in a group of individuals exposed to low-level radiation and their descendants compared with a non-exposed group. It is determined from sex-averaged and age-at-exposure-averaged lifetime risk estimates for a set of organs and tissues, taking into account the severity in terms of quality of life in non-lethal conditions and length of life lost. (b) The Commission recently launched a thorough review of the System of Radiological Protection, taking into account the accumulation of practical experiences and advances in scientific understanding of radiation health effects since publication of the 2007 Recommendations (ICRP, 2007). The present publication constitutes part of this review. (c) Radiation detriment is quantified assuming a linear-non-threshold (LNT) dose–response relationship for stochastic effects, and applying a dose and dose-rate effectiveness factor (DDREF) of 2 for solid cancers. This means that radiation detriment is applicable to a limited range of doses and dose rates. (d) The values of radiation detriment should be considered not as projections of the absolute number of cases of cancer or heritable disease in a population, but as inferences based on reasonable assumptions for radiological protection. (e) The methodology for calculating radiation detriment has developed over decades since the concept was first introduced in Publication 22 (ICRP, 1973). The most recent method in Publication 103 (ICRP, 2007) consists of two main parts. The first part is the calculation of nominal risk, which is the average estimate over age groups of the lifetime risk of cancer incidence and the risk of heritable effects associated with radiation exposure. The lifetime risk of cancer incidence is calculated for each of the reference populations (males and females of Euro-American and Asian populations), except for bone and skin cancers, and the results are averaged across sexes and geographical regions. The second part of the calculation methodology is the adjustment of nominal risk for the severity of the consequences. All calculation steps are executed separately for individual organs/tissues or a group of tissues, and the resulting values are added up to give the total radiation detriment. (f) The calculation of nominal risk coefficients involves a number of sequential steps. They can be summarised as follows: Baseline cancer rates were computed using cancer incidence data from selected Asian and Euro-American populations to compile rates for representative populations in different parts of the world. Risk models were developed for cancers of nine organs/tissues, a group of other solid cancers, and leukaemia, based on the analysis of cancer incidence data, mainly from the Life Span Study of atomic bomb survivors in Hiroshima and Nagasaki. Excess relative risk (ERR) and excess absolute risk (EAR) were modelled with modifying effects of sex, age at exposure, and attained age. For bone and skin cancers, lifetime incidence risks in Publication 60 (ICRP, 1991) were used as nominal risk estimates. The minimum latency period was assumed to be 5 years for all cancers, including leukaemia. The risk of exposure-induced cancer incidence (REIC) was calculated for a single exposure to 0.1 Gy, and multiplied by 10 to obtain the lifetime risk per Gy for each cancer site. It was computed for each age at exposure – 0–89 years for the whole population, and 18–64 years for the working-age population – by cumulating the risk up to the attained age of 94 years. The weighted means of REIC for each age at exposure were used to calculate the age-averaged lifetime risk, the weight being proportional to the age distribution of the reference population. The ERR and EAR lifetime risk estimates were averaged according to ERR:EAR weights specified for each cancer site. The lifetime risk estimates were adjusted downward by a DDREF of 2 for solid cancers, but not for leukaemia for which a linear-quadratic model was used. The unweighted average of the resulting values between the reference populations (males and females of Euro-American and Asian populations) provided the nominal risk for each organ or tissue. Risks of heritable diseases were estimated separately and integrated into the above result to form a set of nominal risk coefficients. (g) Adjustment of nominal risk for severity was performed by applying three adjustment factors that reflect lethality, quality of life, and years of life lost. These factors are virtually independent of radiation dose. Their determination was based on objective data from cancer statistics and expert judgement. The values used do not consider differences in age, sex, or between populations. (h) Programming errors were found in the calculation of nominal risks for the working-age population in Publication 103 (ICRP, 2007). The Commission notes that these errors do not impact overall detriment values and have no implications for the System of Radiological Protection. (i) A selected sensitivity analysis was conducted for nine solid cancers, a group of other solid cancers, and leukaemia to examine the potential impact of assumptions and parameter values in the calculation of radiation detriment. They were categorised into three groups, depending on their level of impact. Minimal impact (change by a factor of <1.5): lifetime risk metric, minimum latency period, maximum attained age, and minimum quality-of-life factor. Moderate impact (change by a factor of 1.5–2 for some organs or tissues): geographical coverage of the reference population, transfer model, and relative years of cancer-free life lost. Substantial impact (change by a factor of ≥2 for some organs or tissues): sex, age at exposure, DDREF, dose assumption in the calculation of lifetime risk, and lethality fraction. (j) The methodology for calculating radiation detriment needs to evolve to take account of advances in health care and scientific understanding of radiation effects. It will be necessary to update reference population data and to expand the geographical coverage. Assumptions for the calculation of nominal risk, including the LNT model, DDREF, and the risk transfer scheme, must be examined in the light of the latest scientific findings. Cancer risk models should be revised based on up-to-date epidemiological data. Cancer severity data require updates and refinement, including consideration of other approaches to quantify the severity of disease. It is also desirable to review the risk estimate for heritable effects, taking recent studies into account. (k) Considering the variation of cancer risk with sex and age, it is desirable to calculate lifetime risks separately for males and females and selected ages (age groups), and average these estimates in the last stage to obtain population-averaged values. This approach makes a clear distinction between science-based risk assessment and the subsequent integration of information for radiological protection purposes, thus providing a better understanding of the construction of radiation detriment. Sex- and age-related variation should also be considered in determining the values of tissue weighting factors (wT). A detailed description of them, with different sets of relative detriments, will aid understanding of the distribution range and the representativeness of wT. (l) There is considerable uncertainty about the shape of the dose–response curve for diseases of the circulatory system and cataracts at low doses. It is still unclear whether there is a threshold for these effects. Whether or not to include them in the calculation of radiation detriment remains an open question. (m) Ensuring transparency and traceability of the calculation of radiation detriment is becoming increasingly important. A full description of the calculation steps is necessary, and consideration should be given to the development of open-source software to perform these calculations. It is also desirable to improve the way that radiation detriment is expressed and communicated so that non-specialists can have a balanced perspective on the health risks of radiation.
1. INTRODUCTION
1.1. Background
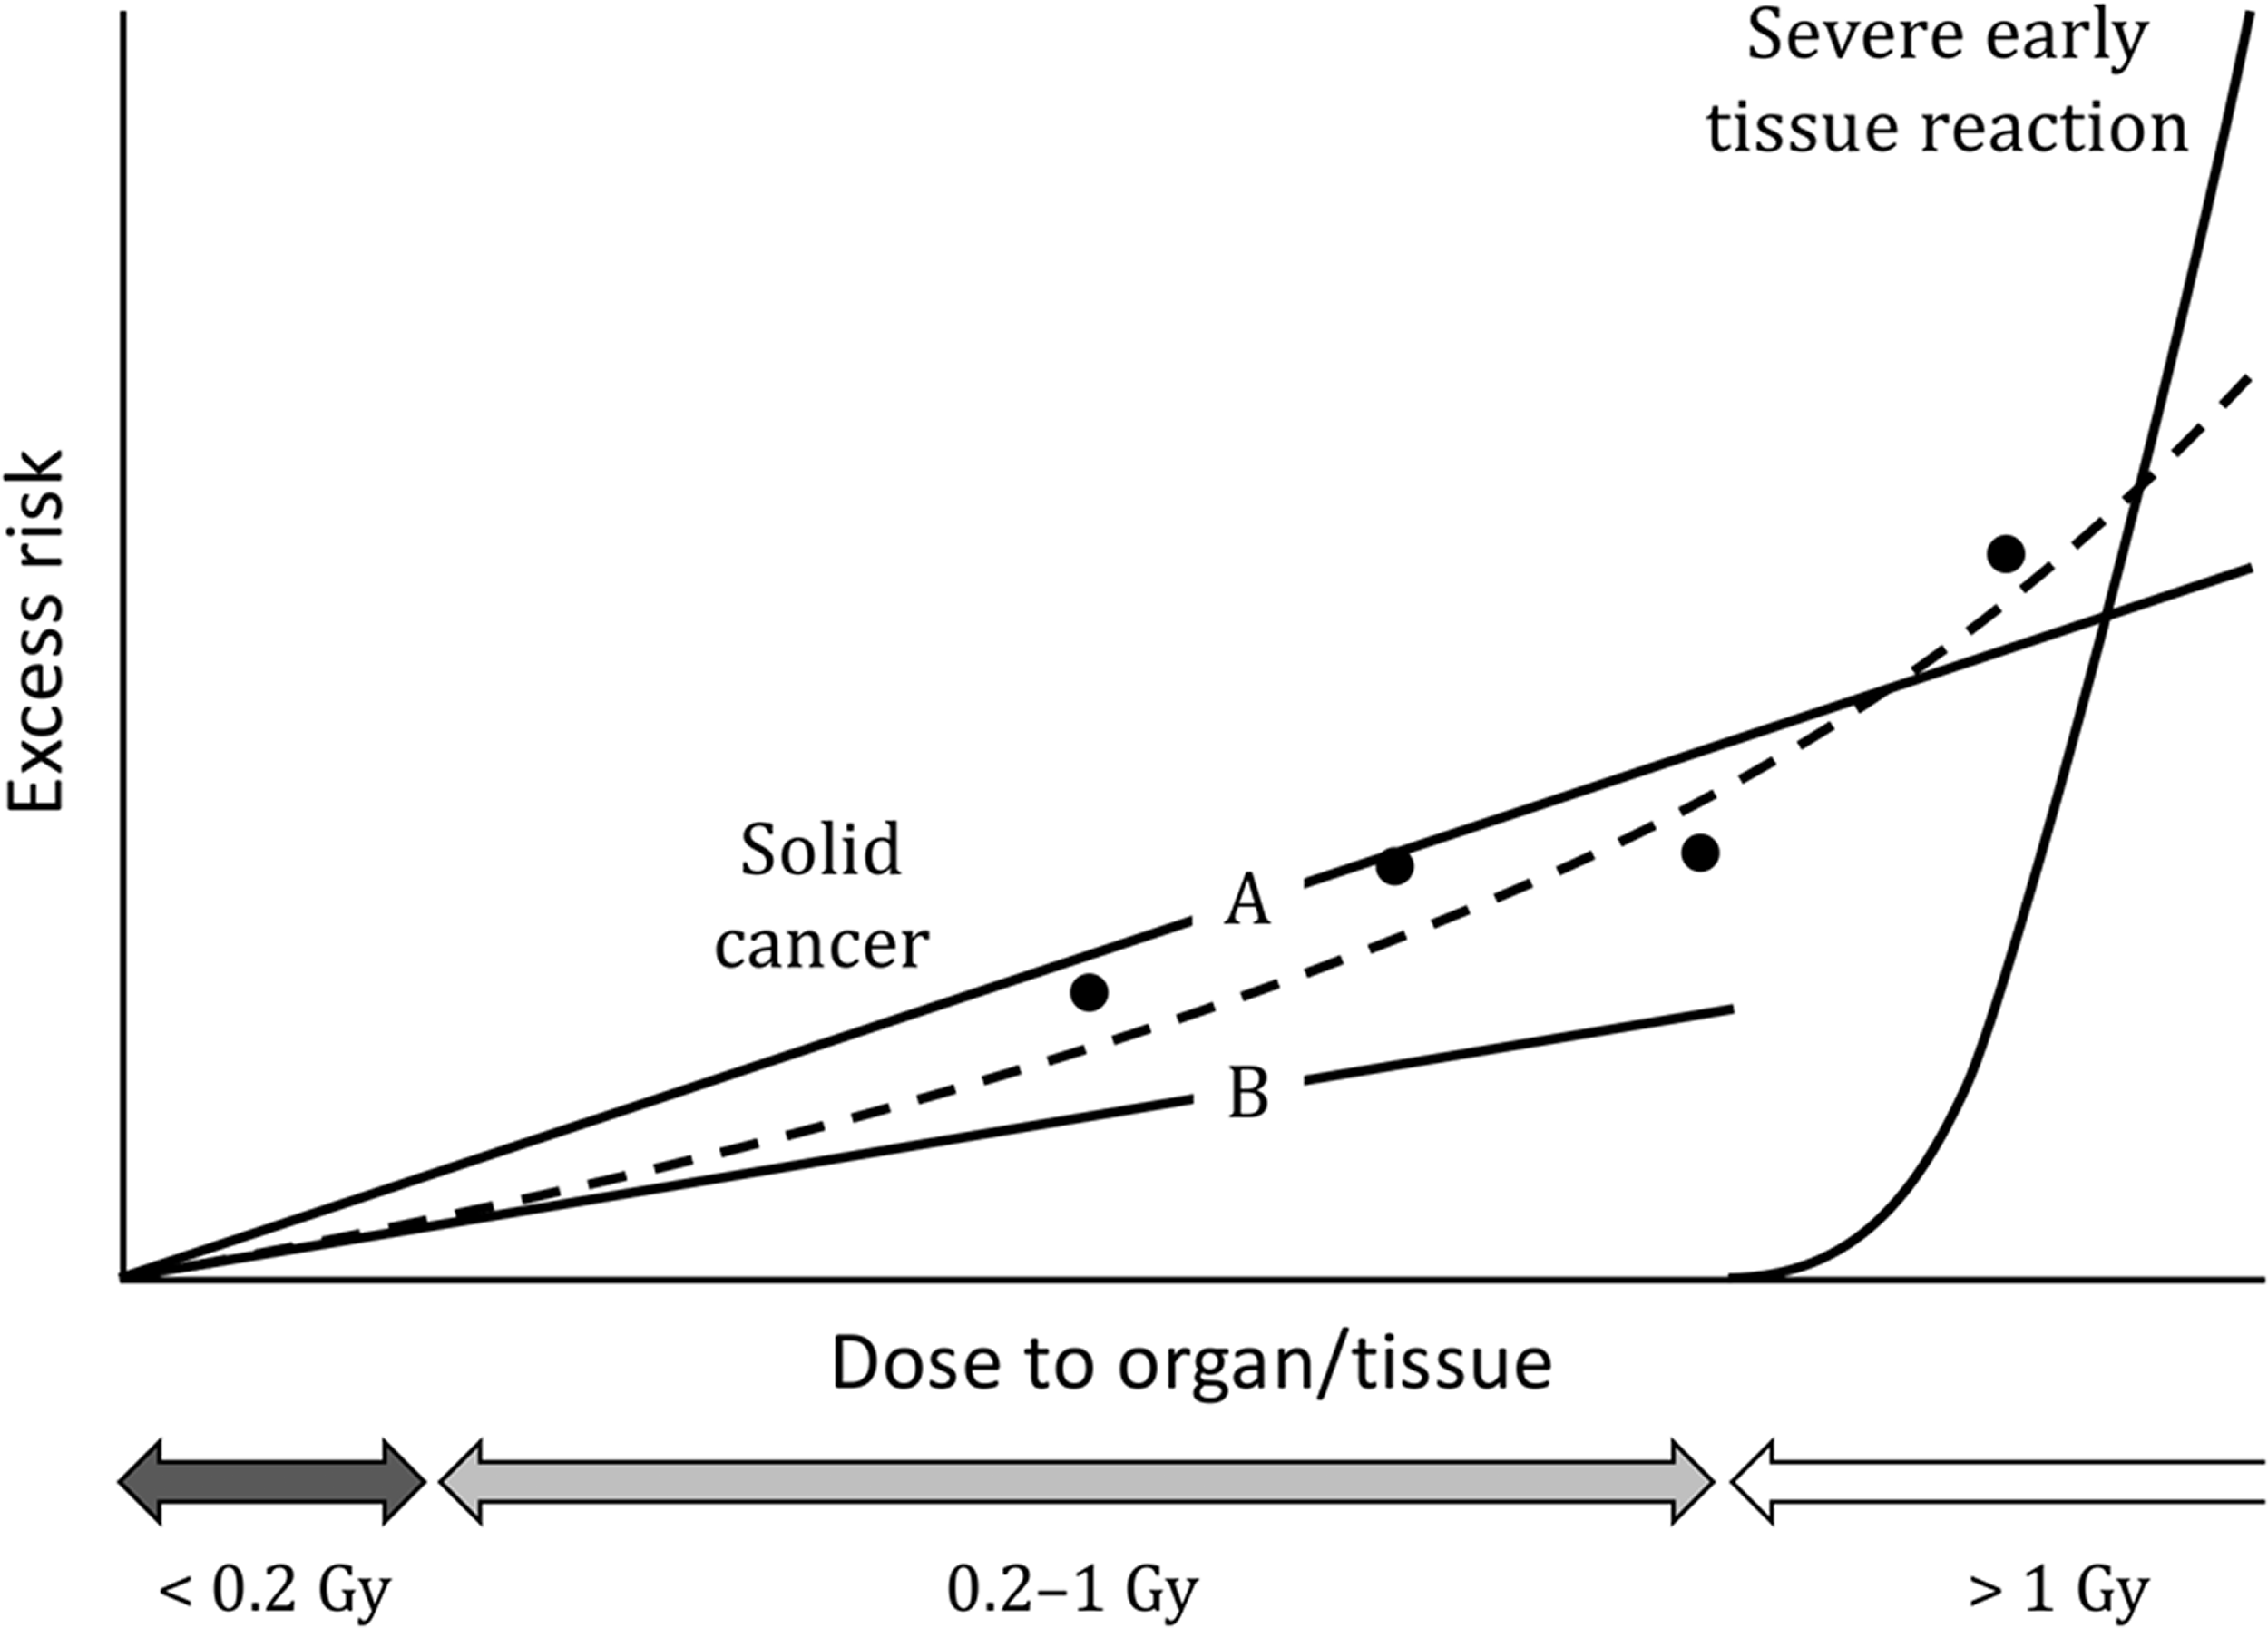
(1) The health effects of radiation are classified into two categories: harmful tissue reactions (deterministic effects) and cancer/heritable effects (stochastic effects). For radiological protection purposes, cancer and heritable effects are assumed to follow a linear dose response with no threshold for low-dose and low-dose-rate exposures. (2) Radiation-associated cancers generally have long latencies, and the length of life lost depends on the distribution of age of onset of the cancers. There are also considerable differences in fatality among cancer sites. Both the probability of occurrence and severity need to be taken into account for appropriate assessment of the risk of overall cancer attributed to radiation exposure. The same is true for heritable effects, as they include a wide range of abnormalities. (3) The International Commission on Radiological Protection (hereafter, ‘the Commission’) introduced the concept of detriment to meet this demand. It was defined as the mathematical ‘expectation’ of the harm incurred in a group from a radiation exposure (ICRP, 1973, 1977a). The harm in this definition was intended to encompass deleterious effects of all sorts, including the socio-economic impact. However, only health effects were considered in practice, and hence detriment was expressed as the expected value of the weighted number of health effects to be experienced by the group. (4) Detriment was redefined in Publication 60 (ICRP, 1991) as a multi-dimensional concept that can be expressed in a variety of ways depending on purpose (ICRP, 1991). At the same time, the Commission continued efforts to aggregate different aspects of detriment into a single quantity, and the methodology was further refined in Publication 103 (ICRP, 2007). A quantitative measure calculated using this methodology is termed ‘radiation detriment’. It is determined from lifetime risk of cancer for a set of organs and tissues, and the risk of heritable effects as an average over different populations, sexes, and ages at exposure, taking into account the severity in terms of quality of life (QOL) in non-lethal conditions and length of life lost. Calculated values for individual organs/tissues or a group of tissues are added up to give the total radiation detriment. Normalising the total number to unity gives the relative radiation detriments, and based on them, the organs and tissues are categorised into groups. This provides the basis for assigning values of tissue weighting factor, which is used in the calculation of effective dose. (5) Radiation detriment is used by the Commission for various purposes, including assessing the consequences of radiation exposures to recommend dose limits, and comparing the consequences of different distributions of organ/tissue dose within the body to select a set of tissue weighting factors. In addition to these primary purposes, radiation detriment may also be used in practice, for example, to evaluate the significance of an exposure in the process of optimisation. Whatever the application, it should be noted that radiation detriment is not designed to precisely represent risks for any particular individual. Instead, it is intended to be a reliable, robust indicator of the overall burden of stochastic effects in a representative population, based on the latest scientific information and up-to-date population health statistics. The methodology of its calculation has been developed over decades to meet these requirements. (6) Radiation detriment is quantified assuming a linear-non-threshold (LNT) dose–response relationship for solid cancers, and a linear-quadratic (LQ) dose response for leukaemia. A dose and dose-rate effectiveness factor (DDREF) is applied to solid cancers to adjust the risk estimated from the epidemiological data of high-dose and high-dose-rate exposures. A DDREF of 2 was proposed for doses of <0.2 Gy or dose rates of <0.1 Gy h−1 for radiation with low linear energy transfer (LET) (ICRP, 1991). (7) In principle, radiation detriment is applicable to low doses and low dose rates at which proportionality between radiation dose and subsequent cancer risk is assumed, with allowance for the DDREF (ICRP, 2005). There may be situations where radiation detriment, as well as effective dose, is used to control doses of several hundred mSv (ICRP, 2021). However, it should be noted that the DDREF of 2 does not apply to low-LET radiation at such doses except dose rates below 0.1 Gy h−1, and the risks may be greater than implied by the nominal risk coefficients. Radiation detriment is not intended to be used for acute high-dose exposures for which severe early tissue reactions are of concern, although this does not mean that stochastic effects do not occur at such high doses (Fig. 1.1). (8) There is sound evidence that radiation increases the risk of cancer, but the increase cannot be demonstrated unequivocally at low doses due to the absence of specific biomarkers for radiation-associated cancer, and the insufficient statistical power of epidemiological studies. This fact requires careful consideration in interpreting radiation detriment calculated for low-dose exposures for which an increase in cancer risk is not deemed proven. There is compelling evidence that radiation causes heritable effects in experimental animals, but a lack of direct evidence in humans at any dose. As such, calculated values of radiation detriment should not be considered as projections of the absolute number of cases of cancer or heritable disease in a population, but as inferences based on reasonable, albeit unverified, assumptions. While they can be used in making decisions for radiological protection purposes, it must be emphasised that the inferences entail uncertainty (UNSCEAR, 2015). (9) The System of Radiological Protection applies to any individual who is exposed to ionising radiation, and methods of controlling sources of exposure are usually applied without reference to the individual profiles of those exposed. To this end, radiation detriment is computed by averaging the risk estimates over age groups, both sexes, and geographical regions to represent the risk for a nominal population. As the calculation process involves transferring risks and averaging across populations with differing baseline cancer rates, the nominal population is regarded as a mixture of people with different factors governing individual responses to radiation, including both non-modifiable factors (e.g. sex and age) and modifiable factors (e.g. smoking and other lifestyle factors). (10) Radiation detriment is intended for inferring risks from exposure situations for radiological protection purposes, or to assess risks retrospectively for exposures of identified individuals. However, it should be recognised that there are significant differences in risk between sexes and in respect of age at exposure. For estimation of the likely consequences of an exposure of a given individual or population, it is preferable to use specific data relating to the exposed individuals and customised risk models when they are available (ICRP, 2021). A schematic representation of dose–response curves for a single acute exposure to low-linear energy transfer radiation. Circles show the observed data for solid cancer induction, and Line A is a linear fit to them. Applying a dose and dose-rate effectiveness factor of 2 to Line A yields Line B, which is the linear-non-threshold model used for low-dose and/or low-dose-rate exposures. The dashed curve represents a linear-quadratic model that is supposed to be the true dose–response relationship. Line B is almost identical to the dashed curve at low to moderate doses (<0.2 Gy), demonstrating a good approximation of the risk of solid cancers. However, underestimation of risk becomes significant as dose increases. At high doses (>1 Gy), severe early tissue reactions become a major concern.
1.2. Scope and objective
(11) The Commission recently launched a thorough review of the System of Radiological Protection to assess the needs for update, taking into account the accumulation of practical experiences and advances in scientific understanding of radiation health effects since publication of the 2007 Recommendations as Publication 103 (ICRP, 2007; Clement et al., 2021). As part of this review, the present publication revisits historical development of radiation detriment, and scrutinises its calculation methodology. The process of calculating radiation detriment in Publication 103 is detailed, with the main focus on the computation process of the nominal cancer risk coefficients. The intention is to ensure transparency and reproducibility of the calculation. Information provided herein should be considered as an improved and corrected version of Annex A.4 of Publication 103. (12) Radiation detriment serves as the quantitative basis for the System of Radiological Protection, and continual improvement is necessary to better represent the health burden from radiation exposure. While this publication discusses issues to be addressed and possible methods for improvement, this should not be interpreted as the Commission’s decision to make changes. Methods for calculating radiation detriment, as well as the result of the calculation in Publication 103 (ICRP, 2007), remain valid unless otherwise stated.
1.3. Structure of the publication
(13) This introductory section (Section 1) is followed by five sections. Section 2 provides a historical review of the quantitative expression of radiation detriment. It highlights how the calculation method has adapted to progress in scientific knowledge. Section 3 details the computation process used in Publication 103 (ICRP, 2007). Data sources, risk models, computational methods, and the rationale for the parameter values adopted are explained for each step of the process. Section 4 presents the results of a series of sensitivity analyses that examined the impact of selected parameters on radiation detriment. The aim of the analysis was to identify major sources of variation and uncertainty in the calculation of radiation detriment. Section 5 discusses key issues for better quantification of radiation detriment and possible ways to address them. Section 6 summarises the main conclusions, and includes suggestions for future improvement.
2. HISTORICAL DEVELOPMENT
2.1. Publication 26
(14) The concept of detriment was first introduced in Publication 22 (ICRP, 1973). It was defined as ‘mathematical concept “expectation” of the harm incurred from a radiation dose, taking into account not only the probabilities of each type of deleterious effect but the severity of the effects as well’. (15) In Publication 26 (ICRP, 1977a), quantitative values for detriment at low doses and low dose rates were assessed based on a linear dose–response model. It was noted that linear extrapolations may lead to an overestimate of radiation risks at low doses and low dose rates, but endorsed this as a cautious assumption. Additionally, while recognising that risks for some cancer sites were age- or sex-dependent, the Commission judged that, for radiological protection purposes, sufficient accuracy could be obtained by using an average value for each organ or tissue regardless of age or sex for both workers and the general public. The weighting factor to calculate detriment was taken as 1 for fatal cancers and severe hereditary effects. Smaller weighting factors were implied for other, less severe effects, but were not specified. Consequently, detriment, specifically called ‘risk factor’ in Publication 26, was expressed as the sex- and age-averaged probability of fatal cancers and severe hereditary effects per unit dose equivalent to an organ or tissue. It was quantified for the following organs/tissues: gonads (including cancer mortality in the exposed, and hereditary effects in the progeny), red bone marrow, bone, lung, thyroid, breast, and ‘other tissues’. (16) The risk factor for leukaemia was taken to be 20 × 10−4 Sv−1. A review by the Commission concluded that bone was much less sensitive than breast, red bone marrow, lung, and thyroid, and the risk factor for bone cancer was taken to be 5 × 10⁻⁴ Sv−1. The risk of lung cancer was approximately the same as that for the development of leukaemia, and the same risk factor was assigned (i.e. 20 × 10−4 Sv−1). The sensitivity of the thyroid to the induction of cancer by radiation appeared to be higher than that of the red bone marrow for the development of leukaemia. However, as mortality from thyroid cancer is much lower than mortality from leukaemia, the overall mortality risk factor was considered to be 5 × 10⁻⁴ Sv−1. Based on data on the development of female breast cancer following radiation exposure, it was suggested that, during reproductive life, the female breast may be one of the most radiosensitive tissues of the human body. There were indications that, under these circumstances, the risk factor for breast cancer could be a few times higher than that for leukaemia, and the risk factor was taken to be 25 × 10−4 Sv−1. In addition to the tissues discussed above, there were other tissues (e.g. stomach, lower large intestine, salivary glands, and liver) for which there was evidence that radiation was carcinogenic, but no risk factors were specified. It was estimated that the combined risk of malignancy in all remaining unspecified tissues was unlikely to exceed 50 × 10−4 Sv−1. For gonads, the risk factor for hereditary effects over the first two generations was taken to be approximately 40 × 10−4 Sv−1. (17) Based on the values described above, the Commission concluded that the mortality risk factor for radiation-induced cancers added up to 125 × 10−4 Sv−1, as an average for both sexes and all ages, and that the average risk factor for hereditary effects could be taken to be 40 × 10−4 Sv−1. The results are summarised in Table 2.1. Publication 26 (ICRP, 1977a) values for nominal mortality risk coefficients. *No specific organs listed.
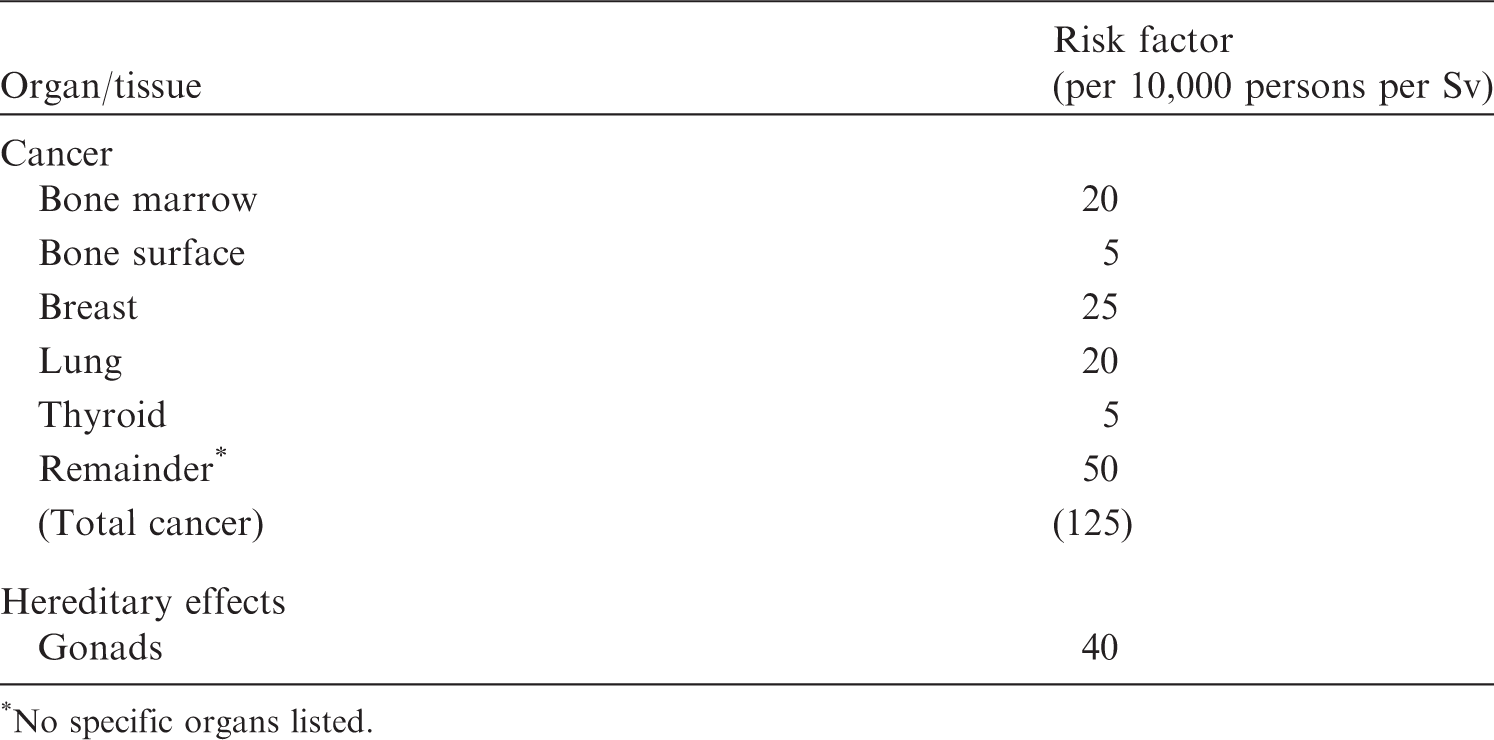
2.2. Publications 27 and 45
(18) Publication 27 (ICRP, 1977b) provided supporting guidance to the General Recommendations [Publication 26 (ICRP, 1977a)]. It aimed to assess the total harm from radiation exposure and other occupational hazards for the purpose of verifying the appropriateness of dose-equivalent limits for workers. (19) In order to compare the harm of different types of diseases and injuries, Publication 27 (ICRP, 1977b) used years of life lost (YLL) as a quantitative index. The Index of Harm was thus defined as the number of years lost per 1000 worker-years for a given annual dose from occupational exposure. It was concluded that ‘If fatal malignancies were induced at a rate of 10−4 rem−1 (10−2 Sv−1), with an equivalent life loss of 15 years for each including the periods of illness from fatal and non-fatal malignancies, the life loss from somatic effects would amount to 1.5 man-years per 1000 man-years per rem (150 person-years per 1000 person-years per Sv) of average occupational exposures’.1 1Units of dose are shown as in the original reference. Otherwise, Gy is used for nominal risk and Sv for radiation detriment. 21 rem = 10 mSv.
(20) The assessment of the Index of Harm in Publication 27 (ICRP, 1977b) was revised in Publication 45 (ICRP, 1985), based on more comprehensive data. For cancers induced by occupational radiation exposure, the risk factors in Publication 26 (ICRP, 1977a) were used as the probability of fatal cancer induction per unit dose, and each case was assumed to bring a mean loss of 15 years of life expectancy plus 1 additional year to take into account the period of illness prior to death (i.e. 16 years per case). The proportions of each type of curable cancer were reviewed to estimate the induction rates and severity of the non-fatal (curable) component, which led to the weighting of 0.29/1.26 for them, as shown in Table 2.2. The resultant life-loss detriment, defined as the product of risk factor and mean loss of life expectancy, from all cancer induction was 0.3 years Sv−1 in females and 0.2 years Sv−1 in males.
(21) For hereditary effects, the United Nations Scientific Committee on the Effects of Atomic Radiation (UNSCEAR) 1982 Report estimated years of life impaired or lost to be 0.63 years per person per Gy of genetically significant radiation at equilibrium 3
3Under continuous radiation exposure (10−2 Gy per generation), the population will reach a new equilibrium with respect to the incidence of these diseases.
Weighting of detriment from curable cancers in Publication 45 (ICRP, 1985) * .
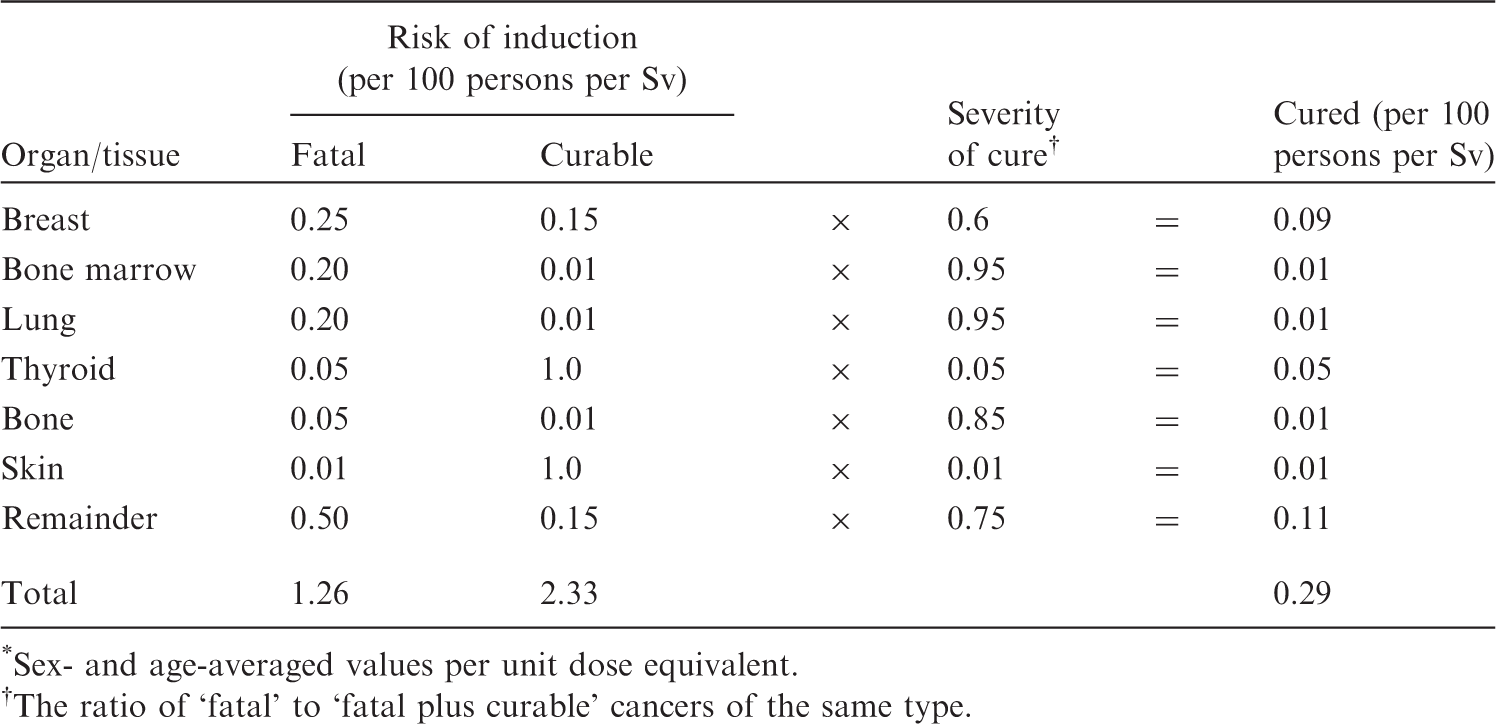
*Sex- and age-averaged values per unit dose equivalent.
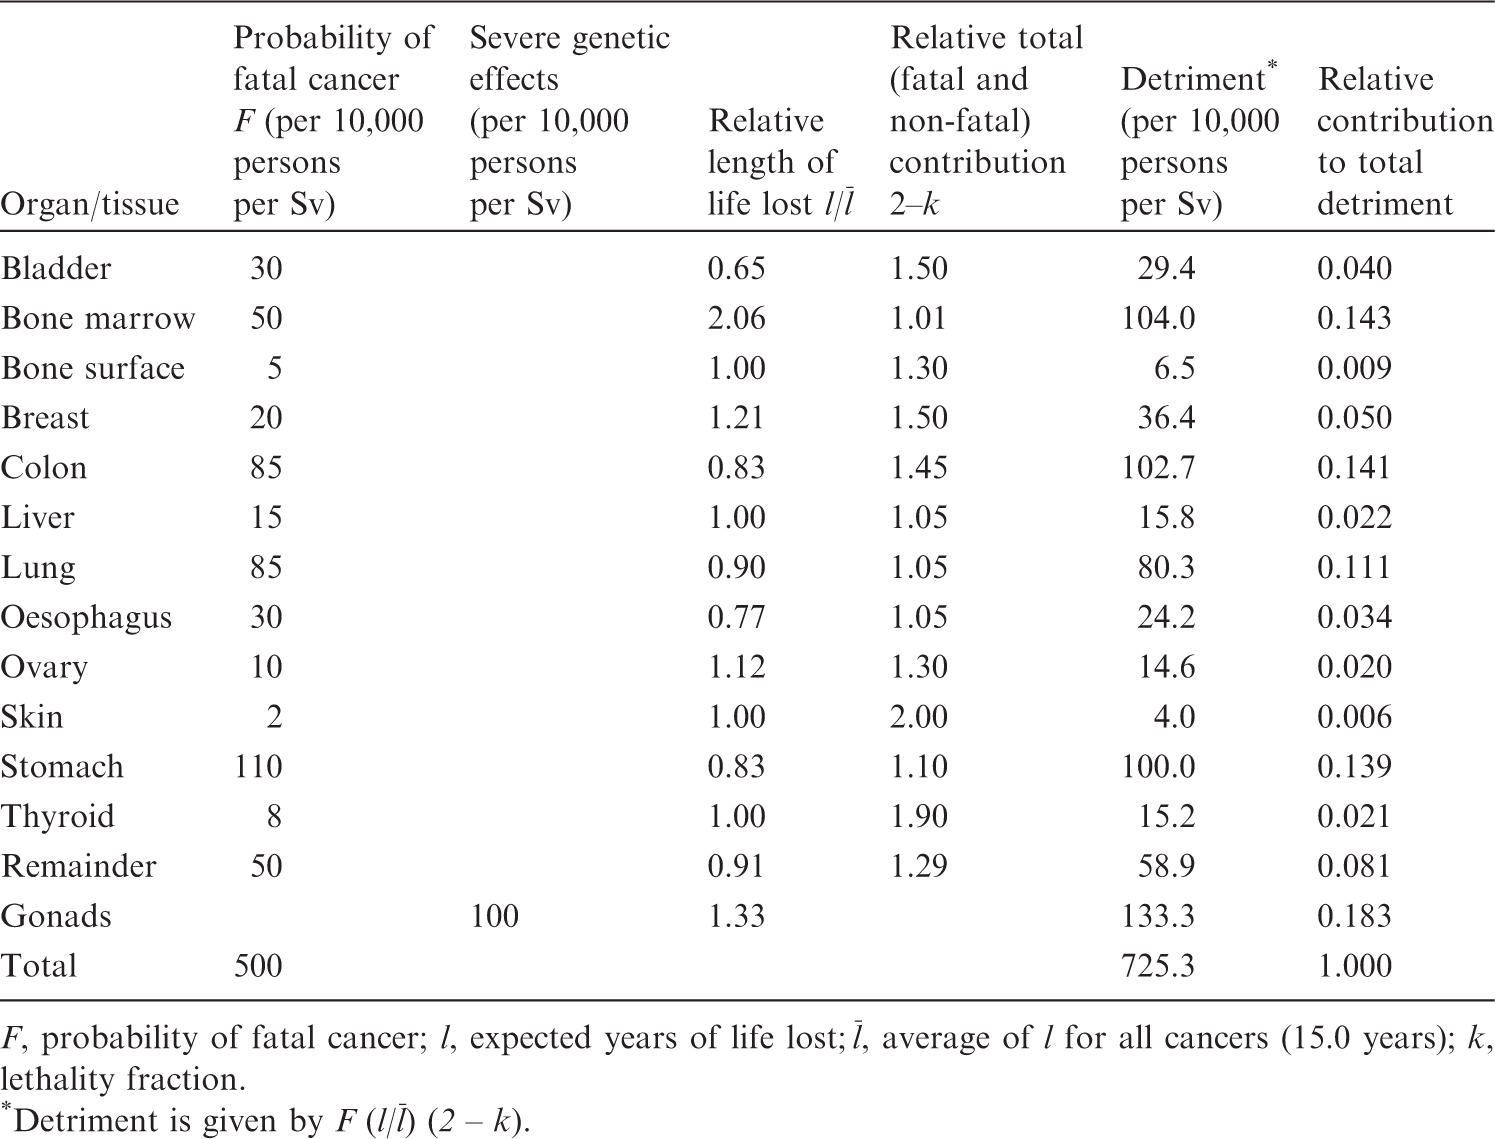
The ratio of ‘fatal’ to ‘fatal plus curable’ cancers of the same type.
(22) The effects of exposures during pregnancy were also taken into account with the assumption that intrauterine death, mental retardation, cancer, and hereditary effects were induced without a threshold. With an assumed frequency of 6.5 pregnancies per 100 worker-years of the female population in employment, the Index of Harm was calculated to be 1.0 per 1000 female worker-years for exposure at 2 mSv year−1.
2.3. Publication 60
(23) In Publication 60 (ICRP, 1991), the Commission outlined that new information on the risk of radiation-induced cancer in human populations had emerged since 1977, along with new experimental data in laboratory animals and cultured cells, leading to a re-assessment of risk estimates in Publication 26 (ICRP, 1977a). In interpreting data, it was decided to apply a DDREF of 2 to reduce the probability of fatal cancers obtained directly from observations at high doses and high dose rates. The relative probabilities (the distribution of probabilities in organs) of fatal cancer for males and females were calculated for China, Japan, Puerto Rico, the UK, and the USA for age 0–89 years and averaged. Multiplying the probability of fatal cancers by the relative probabilities yielded the values given in the second left column in Table 2.3 for bladder, bone marrow, breast, colon, lung, oesophagus, ovary, and stomach. (24) Separate considerations were given for thyroid, bone surface, skin, and liver, as follows. For thyroid, the UNSCEAR 1988 Report (UNSCEAR, 1988) and the US National Academy of Sciences’ Biological Effect of Ionizing Radiation (BEIR) Report V (NAS/NRC, 1990) agreed that the best-available estimates of risk to the thyroid were those presented in NCRP Report No. 80 (NCRP, 1985). These estimates gave a lifetime risk for fatal thyroid cancer of 7.5 × 10⁻⁴ Gy−1. The fatality rate was stated to be 0.1, thus the incidence was 75 × 10−4 Gy−1. For bone surface, based on high-LET radiation data, the BEIR IV Report (NAS/NRC, 1988) provided an estimate of lifetime incidence of 133 × 10−4 Gy−1. With a lethality fraction of 0.70, this became 93 × 10−4 Gy−1, and 4.7 × 10⁻⁴ Sv−1 after application of a quality factor (Q) of 20. For skin, Publication 59 (ICRP, 1992) found the incidence of skin cancer to be 1000 × 10−4 Sv−1, while the fatality (or lethality) fraction was conservatively estimated as 0.2%. The risk of fatal skin cancer was presumed to be applicable at low doses, and was thus taken to be 2 × 10⁻⁴ Sv−1. For liver, the data from Thorotrast studies in West Germany, Portugal, Japan, and Denmark yielded approximately 300 × 10−4 fatal liver cancers per Gy. With a Q of 20, a nominal risk estimate of 15 × 10−4 Sv−1 was derived, and also applied for low-LET radiation. (25) In addition to nominal estimates of fatal cancer, detriment calculated in Publication 60 (ICRP, 1991) included three additional components: a specific allowance for differences in expected life lost for fatal cancer originating in different organs; an allowance for the burden of non-fatal cancers; and an allowance for the risk of serious hereditary disease in all future generations descended from the irradiated individual. (26) To allow for detriment associated with non-fatal cancers, detriment of each cancer type included a non-fatal component weighted according to the lethality fraction k. Thus, if there were F fatal cancers in a given tissue, the total number of cancers was F/k. The number of non-fatal cancers was then (1 – k) F/k, and total weighted detriment was F + k [(1 – k) F/k] or F (2 – k). Parameter values and detriment calculated by this formula are summarised in Table 2.3. The relative contributions of the organs to total detriment (last column) formed the basis of the Commission’s tissue weighting factors. Calculation of detriment in Publication 60 (ICRP, 1991). F, probability of fatal cancer; l, expected years of life lost; *Detriment is given by F (l/
2.4. Publication 103
(27) Publication 103 (ICRP, 2007) adopted a new calculation methodology which is detailed in Section 3. While the methods used were broadly similar to those used in Publication 60 (ICRP, 1991), modifications were made in several aspects of the computations. Of these, one major change was the move to nominal risk calculation based on cancer incidence data rather than cancer mortality data. For clarification, detriment calculated using this methodology is specifically called ‘radiation detriment’, and the term ‘detriment’ means radiation detriment hereafter unless otherwise noted.
3. CALCULATION OF RADIATION DETRIMENT
(28) The procedure for calculating radiation detriment is described in Annex A.4 of Publication 103 (ICRP, 2007) and in Cléro et al. (2019, 2022). Background information about cancer risk estimation is also given in Annex B of Publication 60 (ICRP, 1991). (29) This calculation procedure has two major parts, each of which consists of sequential steps (Fig. 3.1). The first part is calculation of nominal risk – an estimate of lifetime risk associated with radiation exposure, including the risk of cancer and heritable diseases. Risk estimates of cancer are averaged across sexes, ages at exposure, and geographical regions (i.e. populations) for each cancer site. The second part of the calculation of radiation detriment is the adjustment for severity, which takes lethality, QOL, and YLL into account. As shown in Fig. 3.1, only the first part depends on radiation dose. The second part is virtually independent of radiation exposure, but reflects the severity of cancer (and heritable disease for the gonads) of respective organs or tissues. (30) In this publication, Gy, the unit of absorbed dose, is used in the calculation of nominal risk (first part), and Sv, the unit of effective dose, is used in expressing radiation detriment (second part). (31) Averaging across sexes, ages at exposure, or geographical regions is applied at different steps in the process of detriment calculation. The lifetime risk of cancer is calculated separately for males and females, and for two composite reference populations defined in Sections 3.1.1.1 and 3.1.1.2 (except for bone and skin cancers), and the results are averaged to estimate nominal risk. After incorporating estimates of the excess risk of bone cancer, skin cancer, and heritable effects, the adjustment factors, including DDREF, lethality fraction, and parameters related to QOL, are applied without distinguishing between sexes or populations. All steps are conducted in parallel for each organ and tissue separately, and the resulting values are added up to give the total radiation detriment. Procedure for calculating radiation detriment in Publication 103 (ICRP, 2007).
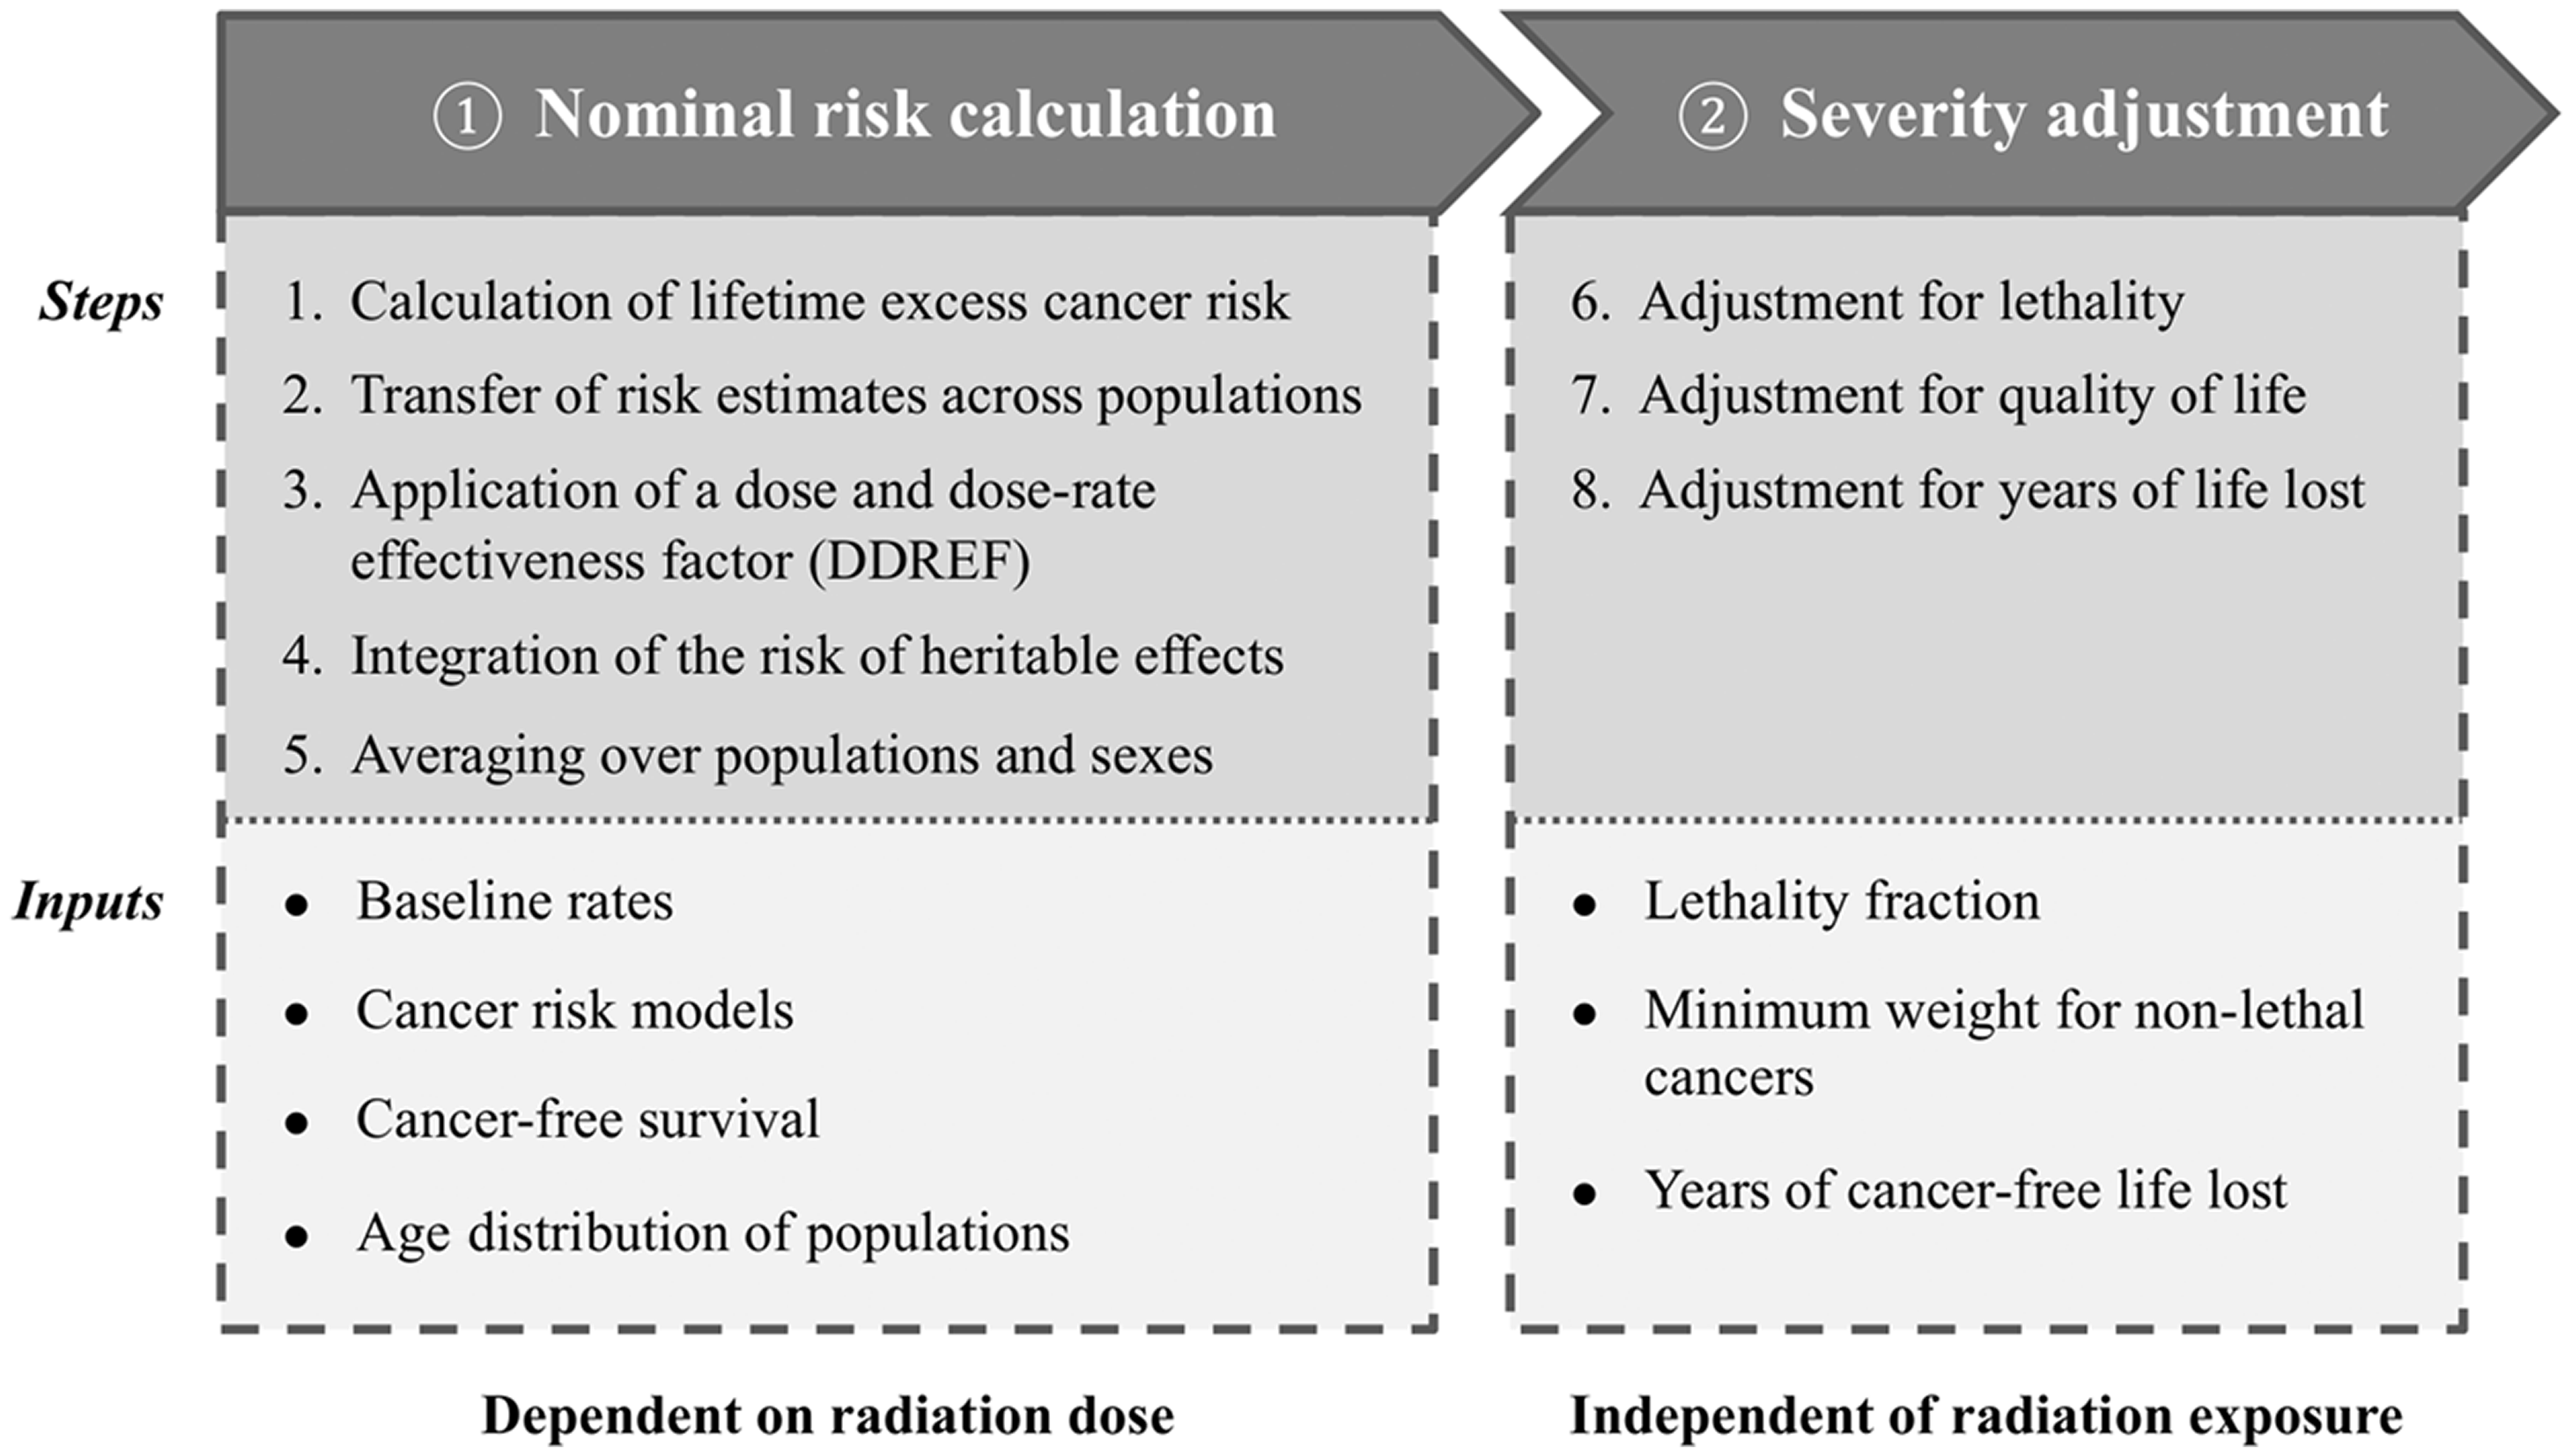
3.1. Nominal risk calculation
3.1.1. Baseline risk parameters
3.1.1.1. Reference populations
(32) Composite baseline incidence rates of cancer were computed using cancer incidence data from selected Asian and Euro-American populations with long-running cancer registries: Shanghai (China); Osaka, Hiroshima, and Nagasaki (Japan); Sweden; UK; and the Surveillance, Epidemiology, and End Results (SEER) Program of the US National Cancer Institute. An unweighted average among the selected populations was calculated to form the data of a composite Asian and Euro-American population. The aim was to compile (specify) rates for representative populations in different parts of the world.
3.1.1.2. Baseline cancer rates
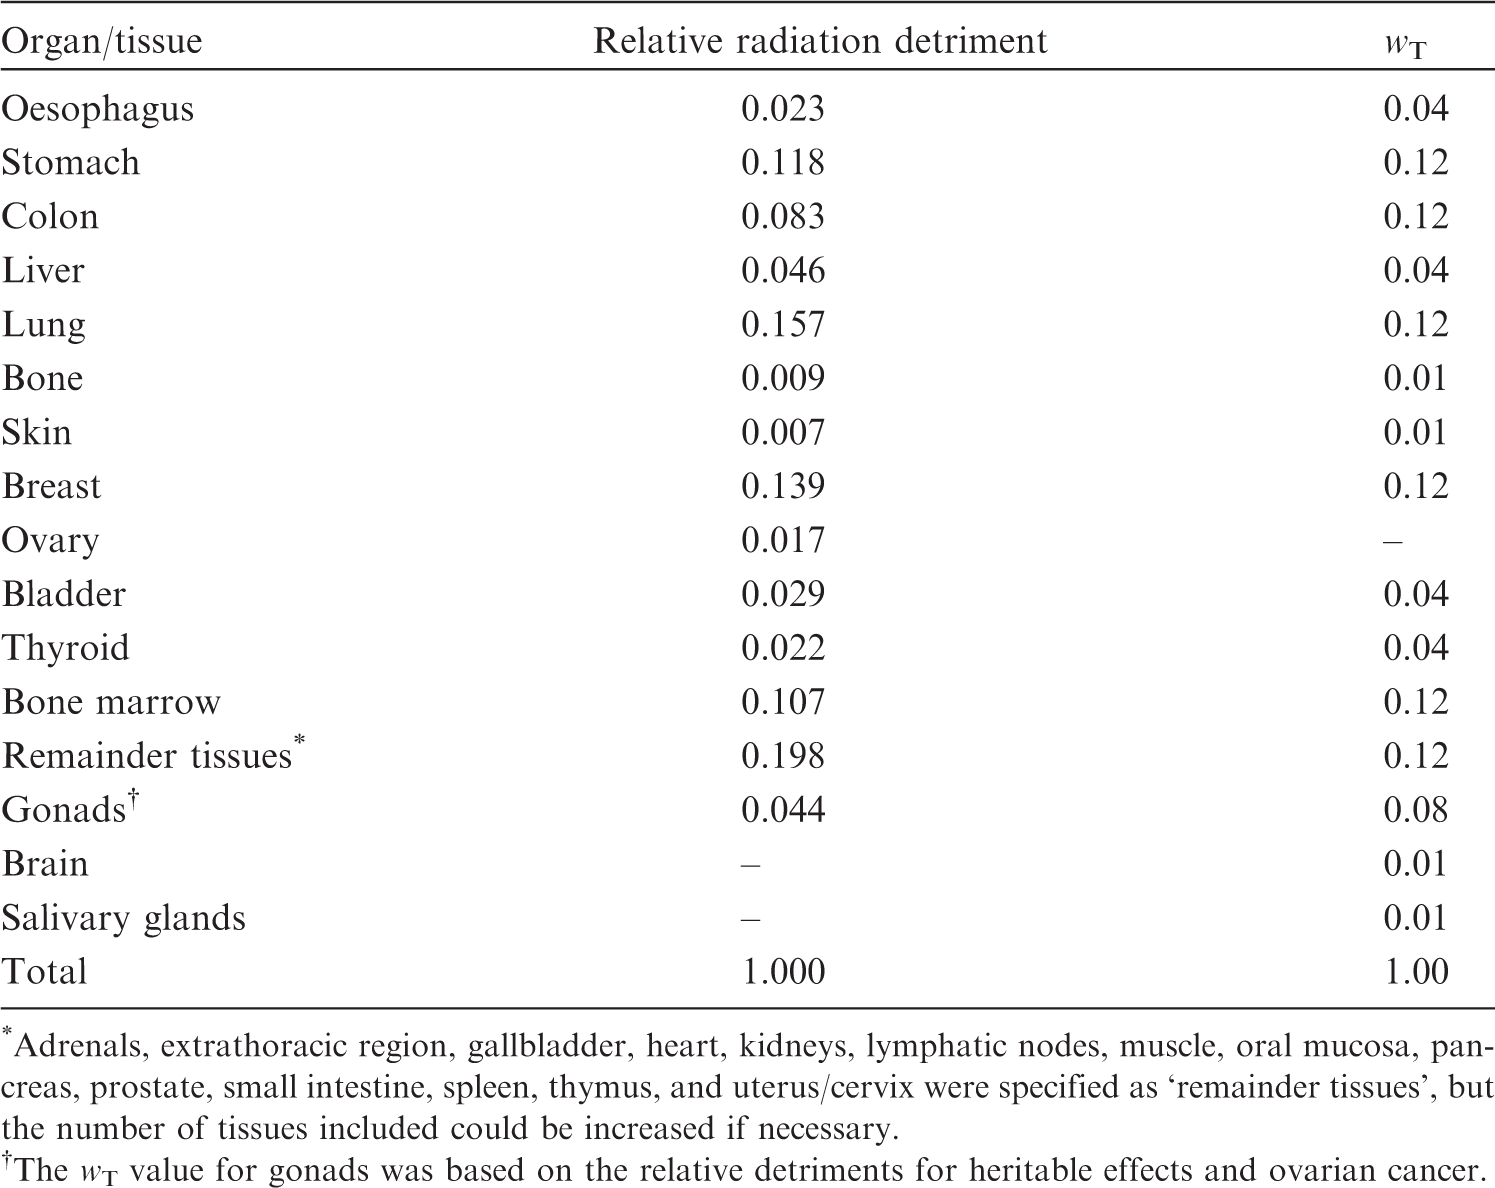
(33) Population-based cancer incidence rates were obtained from the 8th edition of Cancer Incidence in Five Continents (cancer rates measured by registries during the period 1993–1997) (Parkin et al., 2002). Average incidence rates were compiled for the Asian and Euro-American populations, separately for males and females, and by 5-year age categories (from 0–4 years to ≥90 years), for oesophagus, stomach, colon, liver, lung, female breast, ovary, bladder, thyroid, leukaemia [excluding chronic lymphocytic leukaemia (CLL)], and all solid cancers (Tables A.1–A.4 in Annex A). Mortality rates for all causes and all cancers combined were also provided (Tables A.5 and A.6 in Annex A). Tissue weighting factors (wT) for each organ/tissue category in Publication 103 (ICRP, 2007). *Adrenals, extrathoracic region, gallbladder, heart, kidneys, lymphatic nodes, muscle, oral mucosa, pancreas, prostate, small intestine, spleen, thymus, and uterus/cervix were specified as ‘remainder tissues’, but the number of tissues included could be increased if necessary. The wT value for gonads was based on the relative detriments for heritable effects and ovarian cancer.
3.1.2. Risk model for radiation-associated cancer
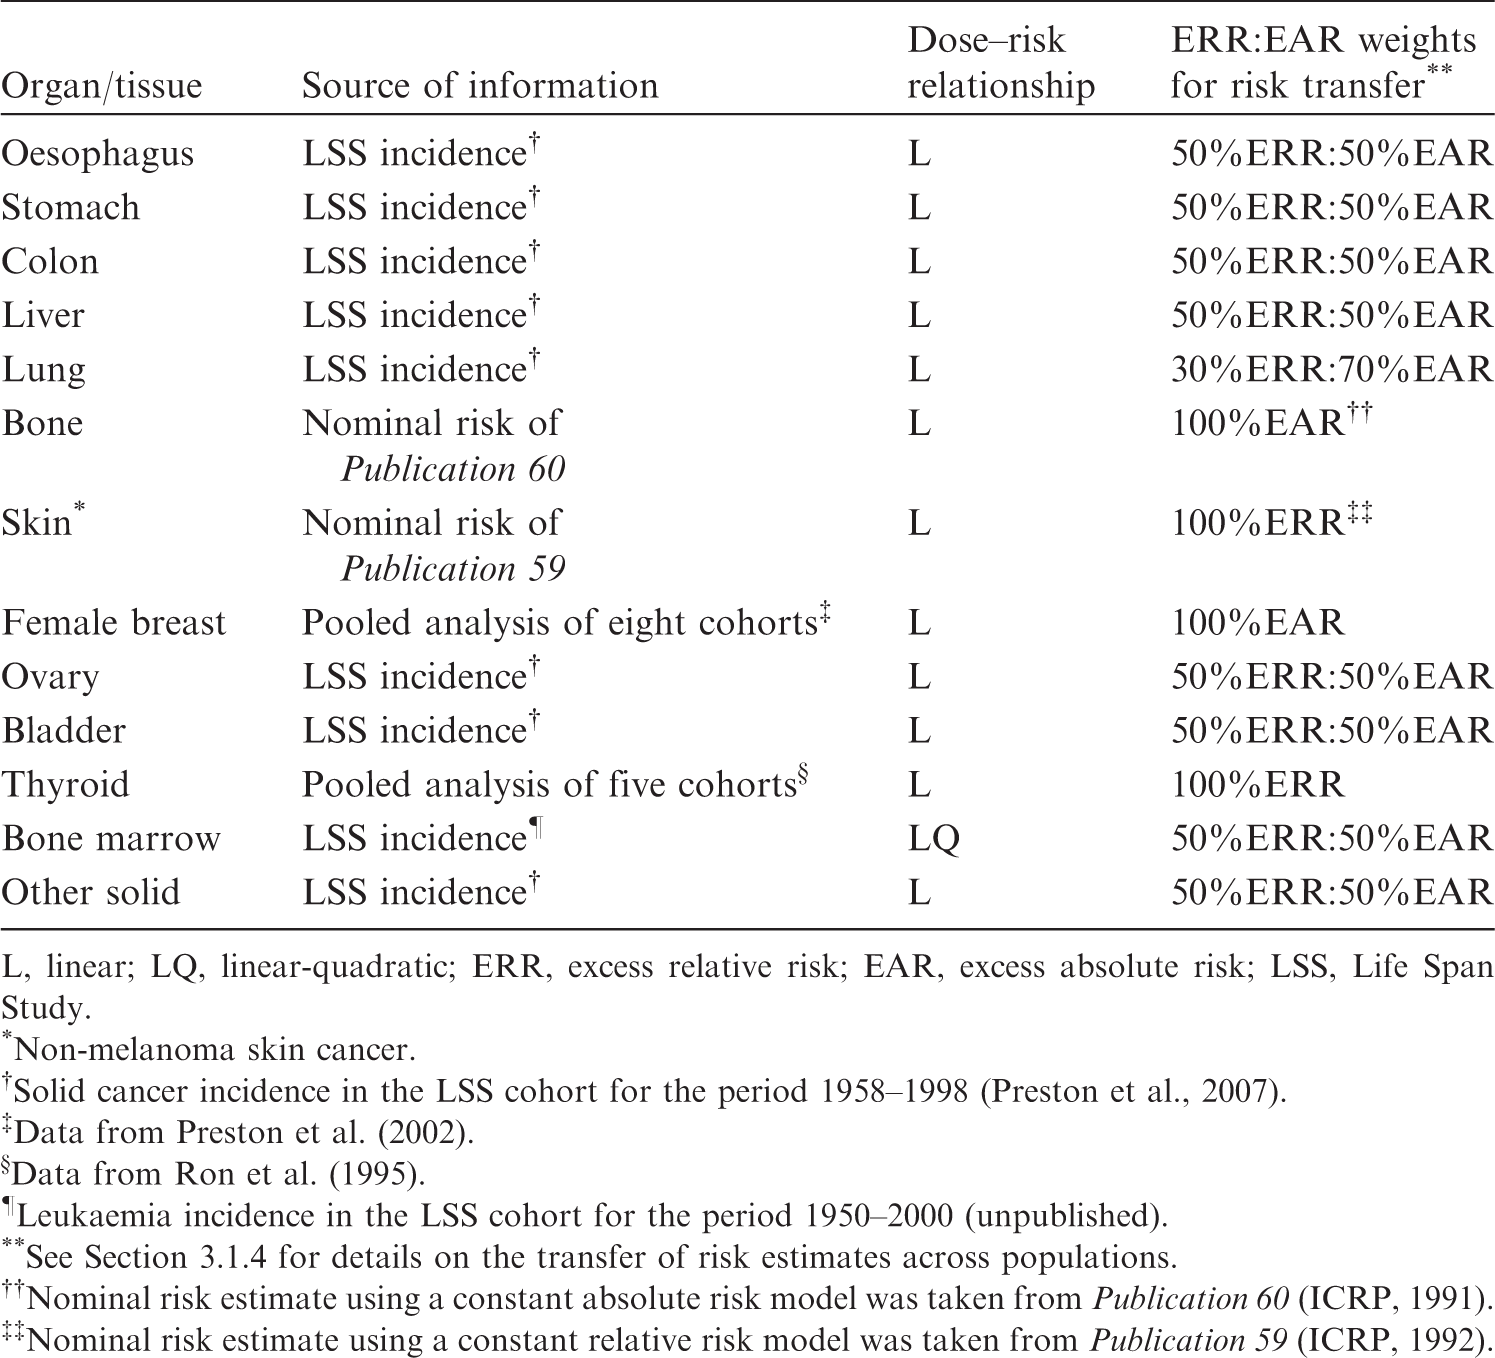
(34) For estimating cancer risk from radiation exposure, risk models were developed for oesophagus, stomach, colon, liver, lung, female breast, ovary, bladder, thyroid, and bone marrow (leukaemia). Risk models were not established for bone and skin cancers, for which nominal risk estimates in Publication 60 (ICRP, 1991) were used. Cancers of other tissues were consigned to a remainder category called ‘other solid cancers’. Excess relative risk (ERR) and excess absolute risk (EAR) were modelled to calculate a weighted average of the ERR and EAR lifetime risk estimates. Table 3.1 summarises basic information about cancer risk models used for the calculation of nominal risk. Cancer risk models for each organ/tissue category (ICRP, 2007). L, linear; LQ, linear-quadratic; ERR, excess relative risk; EAR, excess absolute risk; LSS, Life Span Study. *Non-melanoma skin cancer. Solid cancer incidence in the LSS cohort for the period 1958–1998 (Preston et al., 2007). Data from Preston et al. (2002). Data from Ron et al. (1995). Leukaemia incidence in the LSS cohort for the period 1950–2000 (unpublished). See Section 3.1.4 for details on the transfer of risk estimates across populations. Nominal risk estimate using a constant absolute risk model was taken from Publication 60 (ICRP, 1991). Nominal risk estimate using a constant relative risk model was taken from Publication 59 (ICRP, 1992).
3.1.2.1. Solid cancers
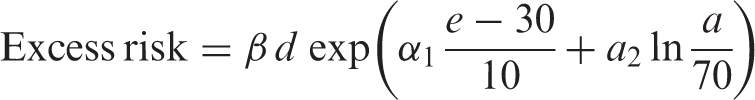
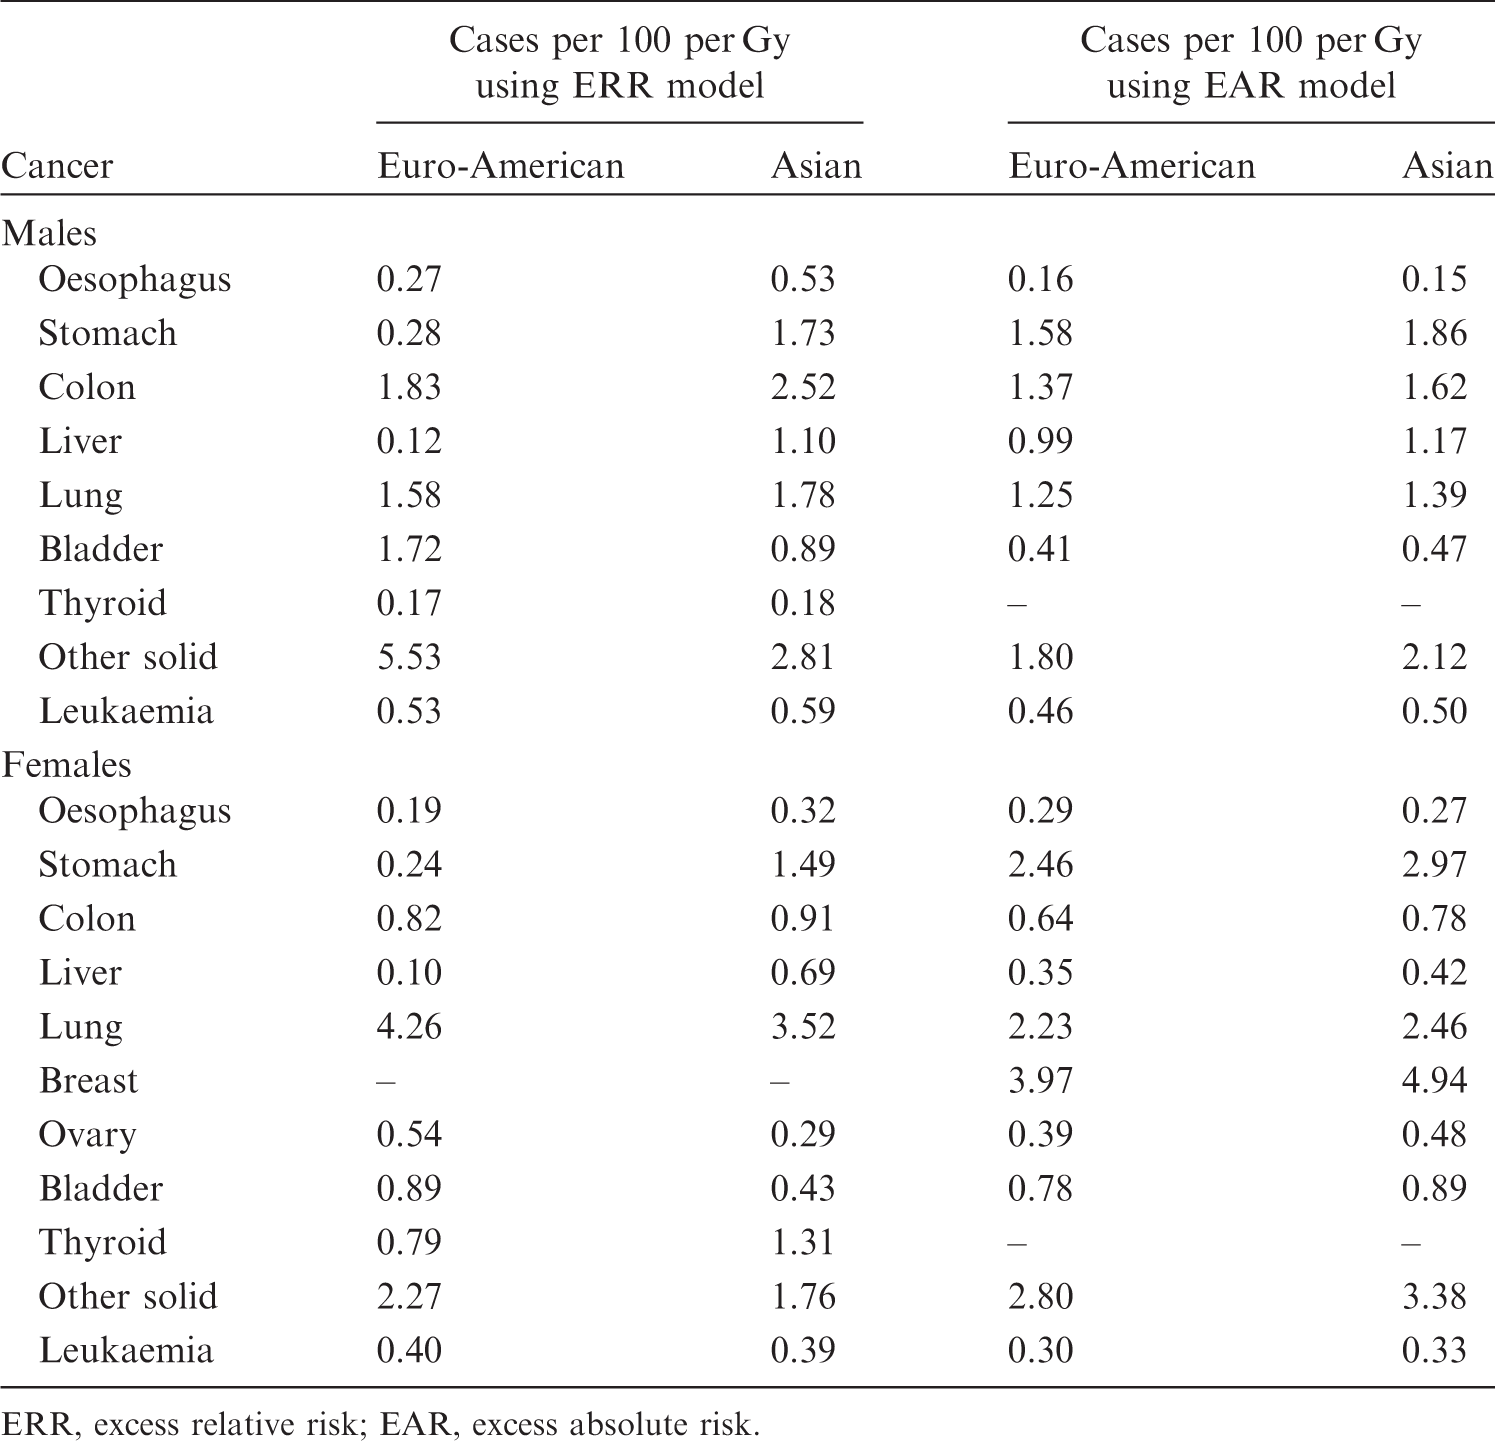
(35) In general, risk models for solid cancers derive from the report on solid cancer incidence among the Life Span Study (LSS) cohort of the Japanese atomic bomb survivors, which was based on the data of the first primary cancers diagnosed from 1958 to 1998 (Preston et al., 2007). Risk estimates were adjusted to reduce the bias in risk estimates arising from uncertainty in individual dose estimates from Dosimetry System 2002 (DS02). (36) Risk models involved a linear dose response allowing for modifying effects of sex, age at exposure, and attained age. These effects were constrained to equal the values obtained for all solid cancers as a group, unless there were indications that these constraints resulted in a marked reduction in the goodness of fit when modelling cause-specific cancer types. (37) Both the ERR model and the EAR model are expressed as follows: 4The dose in Gy is intended to represent that of low-LET radiations, as DS02 organ dose estimates in the reference (Preston et al., 2007) were calculated as the sum of the gamma-ray dose plus 10 times the neutron dose to allow for the greater biological effectiveness of neutron doses.
(38) For female breast cancer, an additional term was introduced to take the effect of menopause into account: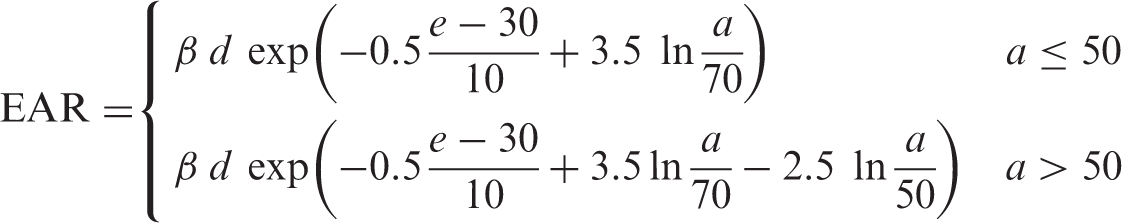
(39) The minimum latency period is the shortest time in which a specified radiation-induced tumour is known or believed to occur after exposure. The minimum latency period was assumed to be 5 years for all types of solid cancer.
Parameter values for the incidence-based excess absolute risk (EAR) models for solid cancers (ICRP, 2007).
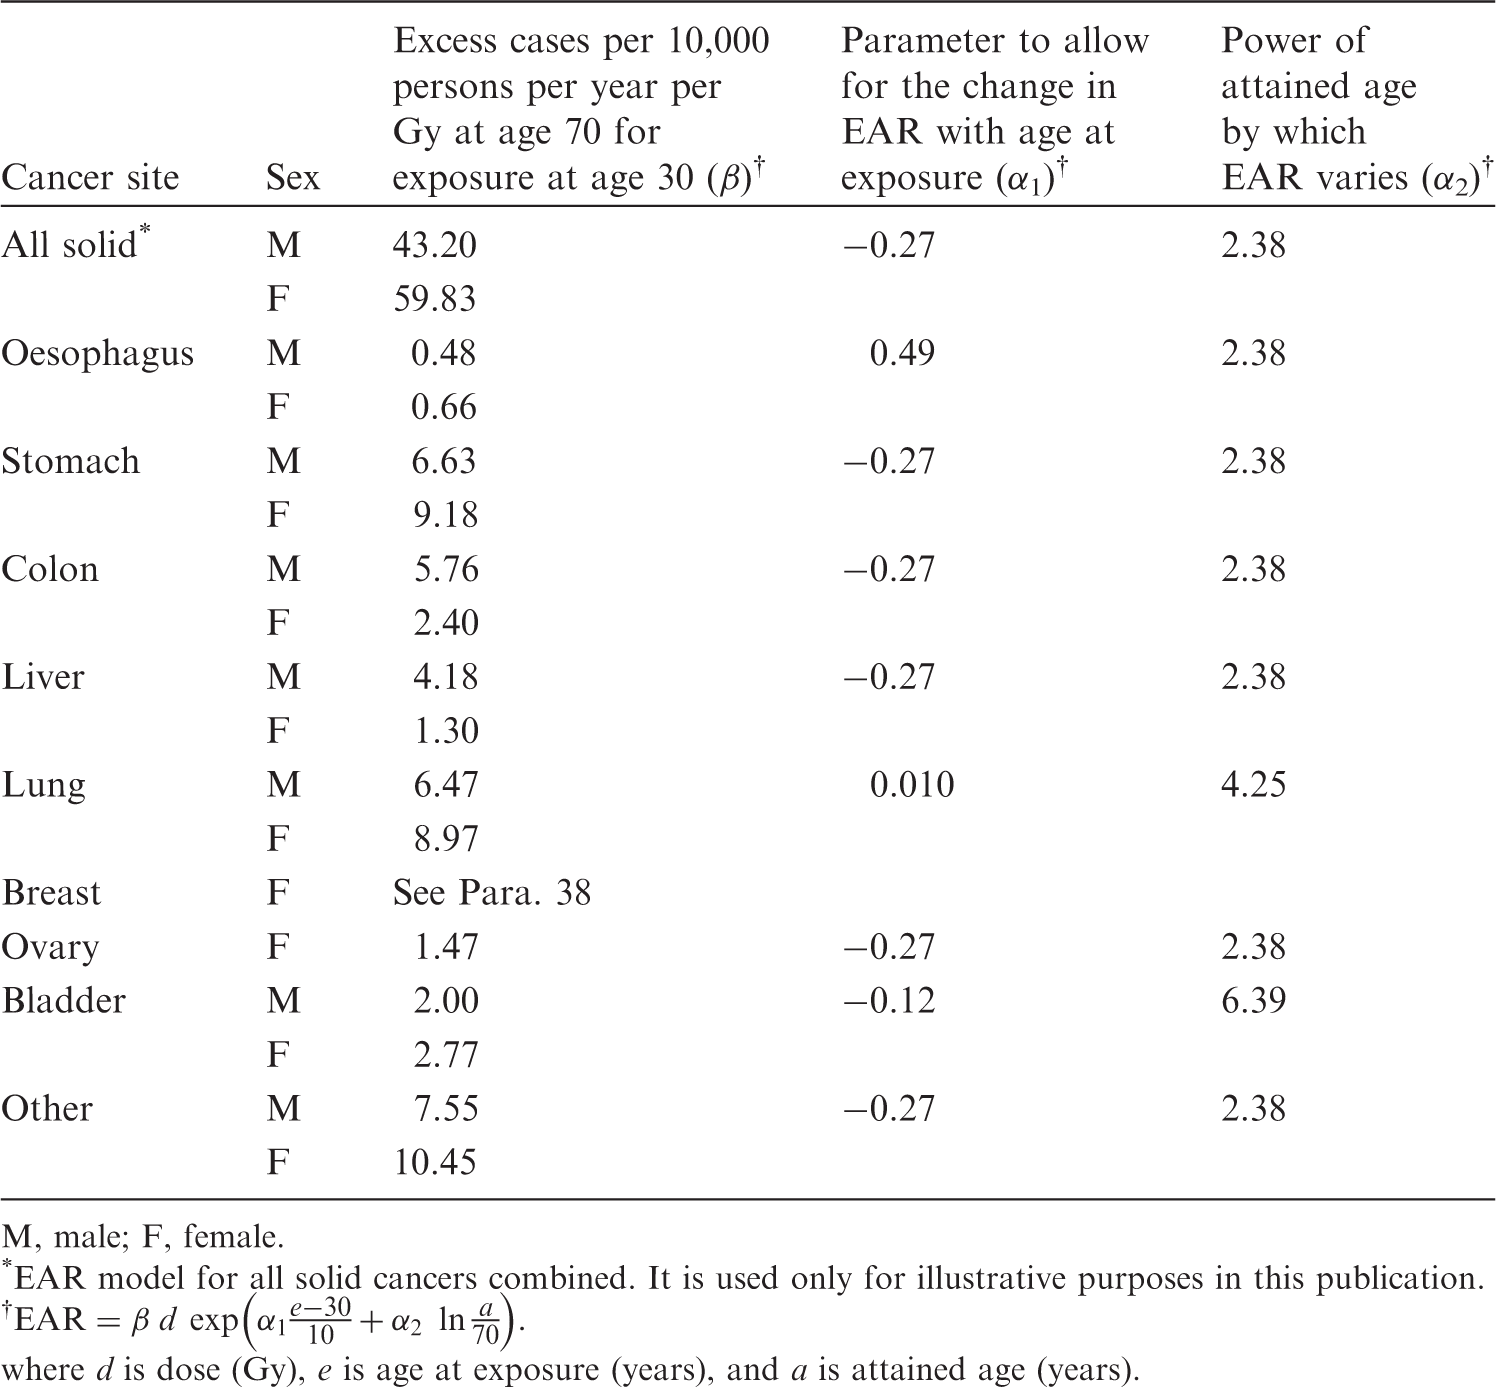
M, male; F, female.
*EAR model for all solid cancers combined. It is used only for illustrative purposes in this publication.
Parameter values for the incidence-based excess relative risk (ERR) models for solid cancers (ICRP, 2007).
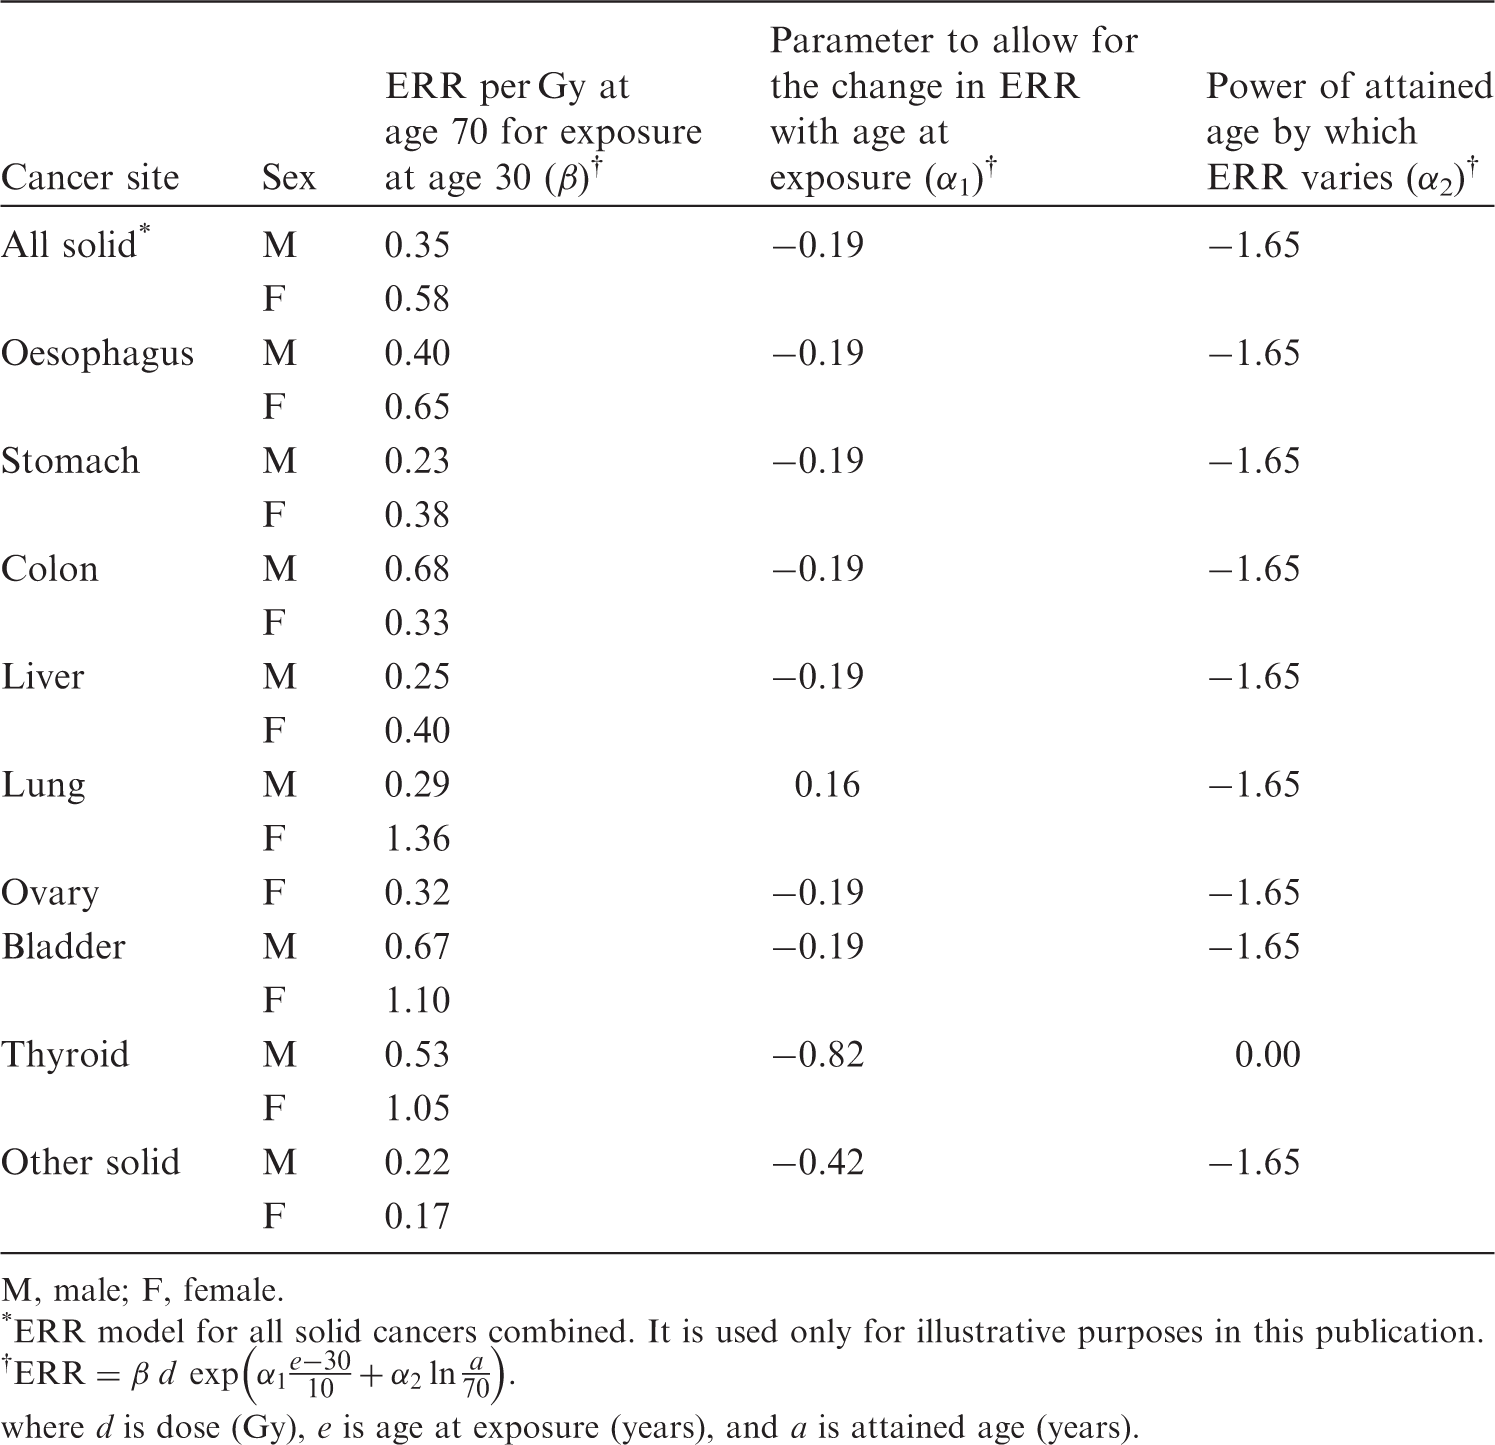
M, male; F, female.
*ERR model for all solid cancers combined. It is used only for illustrative purposes in this publication.
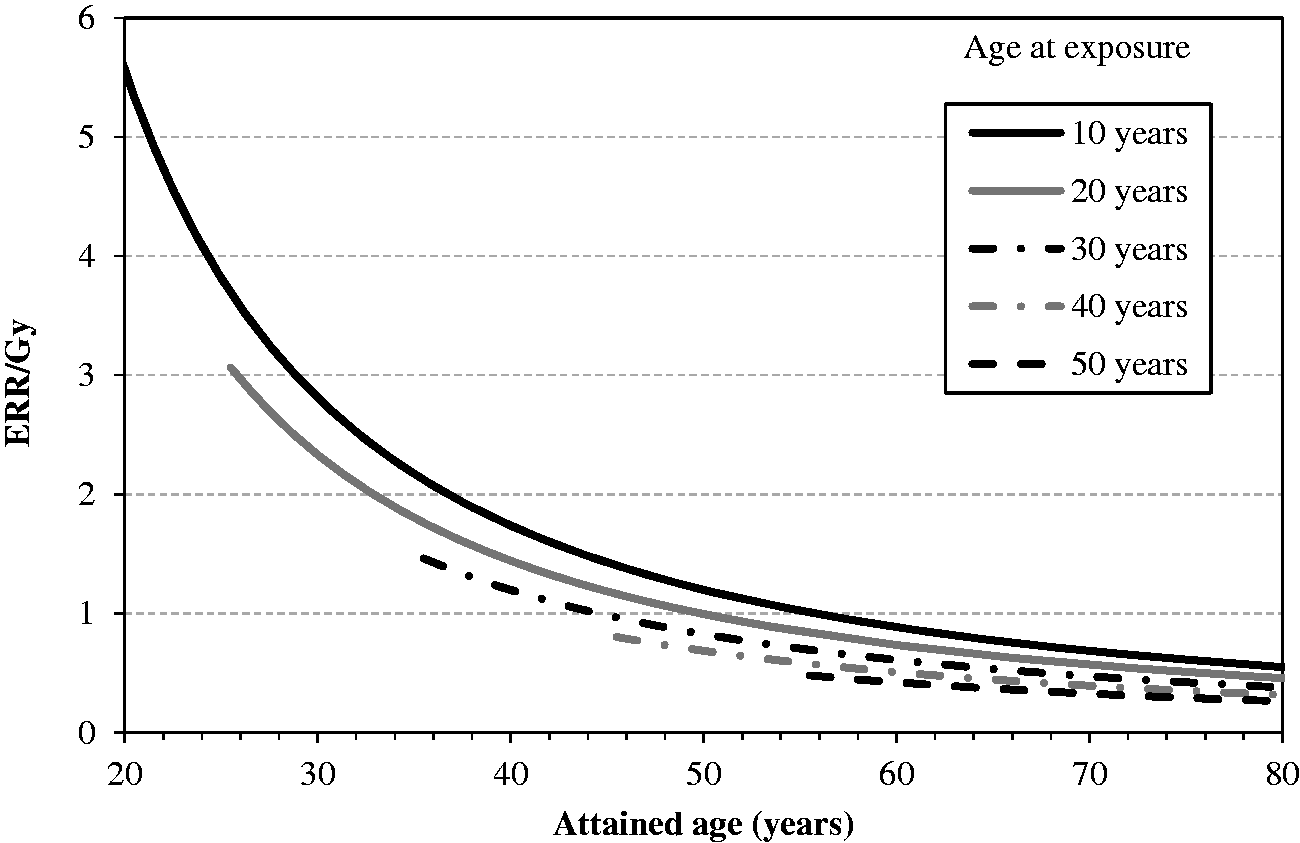
Modification of sex-averaged excess relative risk (ERR) for all solid cancers by age at exposure and attained age.
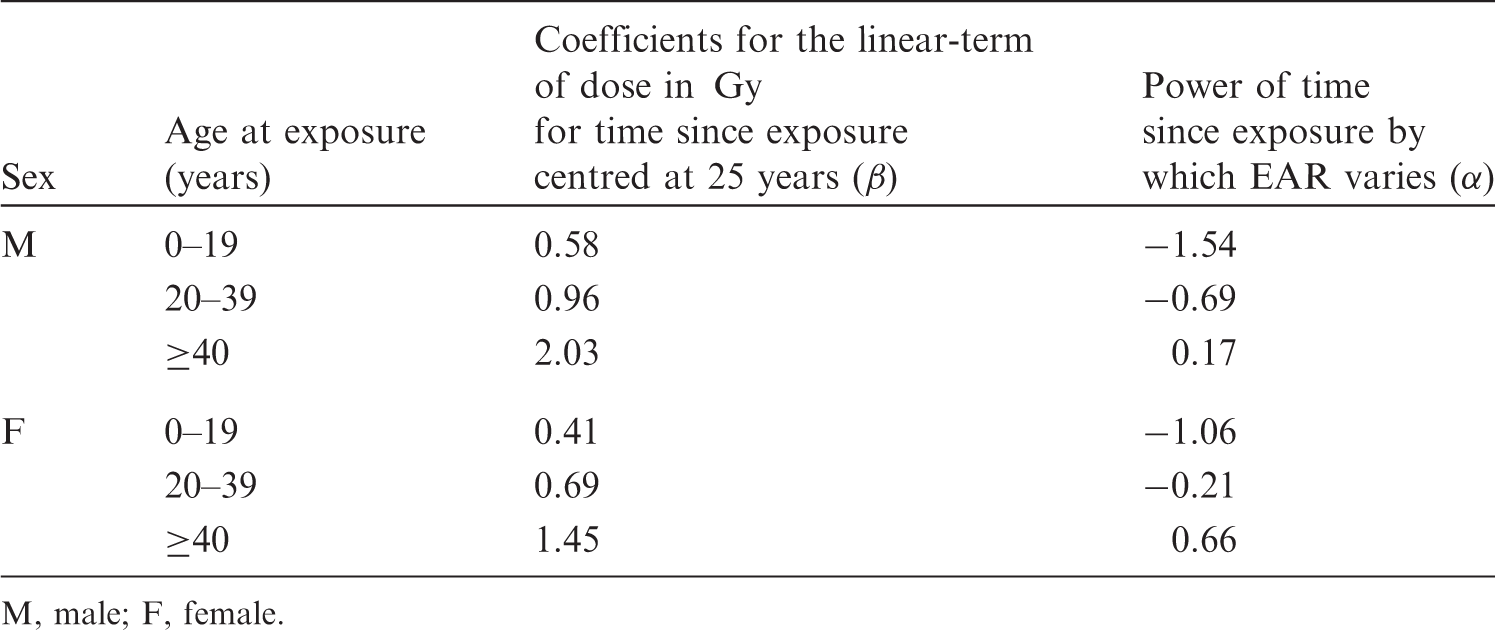
3.1.2.2. Leukaemia
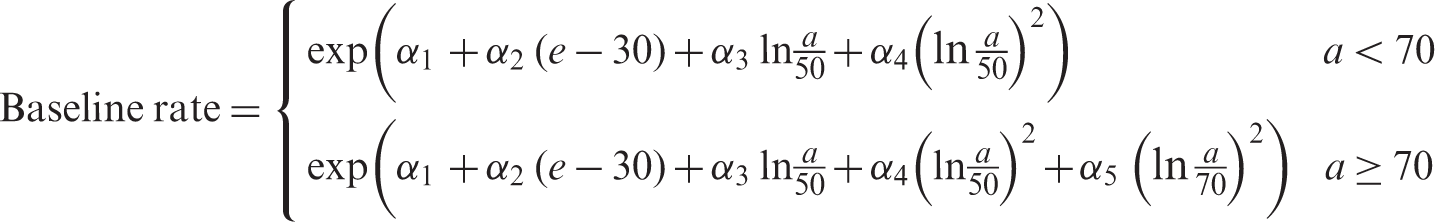
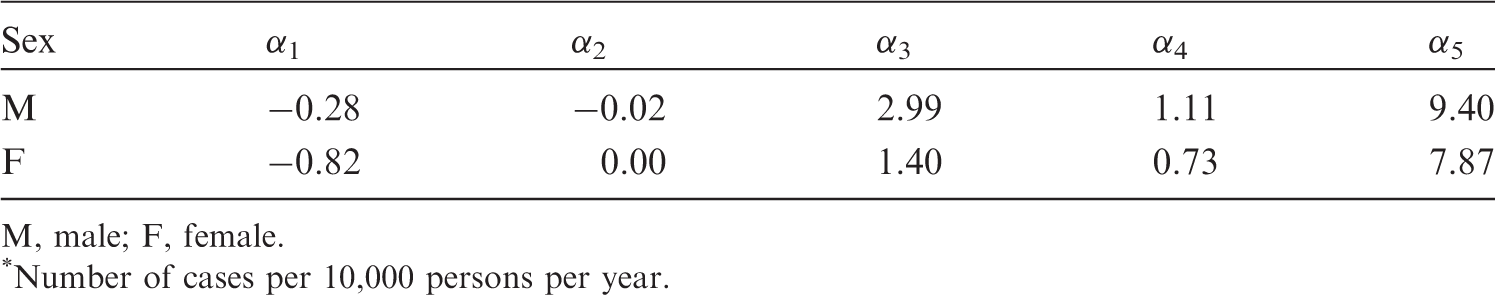
(40) Risk of leukaemia other than chronic lymphocytic leukaemia (non-CLL leukaemia) was modelled based on an analysis of unpublished incidence data among the LSS cohort for the period from 1950 to 2000. The EAR model was similar to that derived from the LSS in 1994 (Preston et al., 1994), with an LQ dose response that allows for effect modification by sex, exposure age, and time since exposure. (41) Mathematical expression of the EAR model for leukaemia (hereafter, the term ‘leukaemia’ refers to non-CLL leukaemia unless otherwise stated) is as follows: (42) Instead of developing an ERR model for leukaemia, ERRs for certain attained ages and ages at exposure were computed by taking the ratio of EAR to the baseline rate. For this purpose, baseline incidence of leukaemia in the LSS cohort was modelled as: Parameter values for the incidence-based excess absolute risk (EAR) model for leukaemia. M, male; F, female. Parameter values for the baseline incidence model for leukaemia
*
. M, male; F, female. *Number of cases per 10,000 persons per year.
where d is dose (Gy), t is time since exposure (i.e. attained age minus age at exposure, in years), and α and β are parameters. As presented in Table 3.4, the values of the parameters differed according to sex and age at exposure category. The coefficient of the quadratic term of dose was kept constant irrespective of sex and age at exposure category. The minimum latency period was set at 5 years.
3.1.2.3. Bone cancer
(43) Although there was evidence that bone tumours could be induced by radiation, the LSS provided no data, and other data sources were extremely limited. Due to difficulty developing a specific risk model, the nominal risk estimate was taken from Publication 60 (ICRP, 1991), which made reference to BEIR IV (NAS/NRC, 1988). Based on the estimate of 133 × 10−4 Gy−1 for alpha emitters and a quality factor of 20, the nominal risk coefficient was calculated to be seven cases per 10,000 persons per Gy for low-LET radiation as a common value for both sexes. It should be noted that this risk estimate was based on average bone dose from radium-224, while the Commission’s dosimetric models estimate doses to bone surfaces. Nevertheless, the risk estimate based on average bone dose was used, being aware of its possible conservatism.
3.1.2.4. Skin cancer
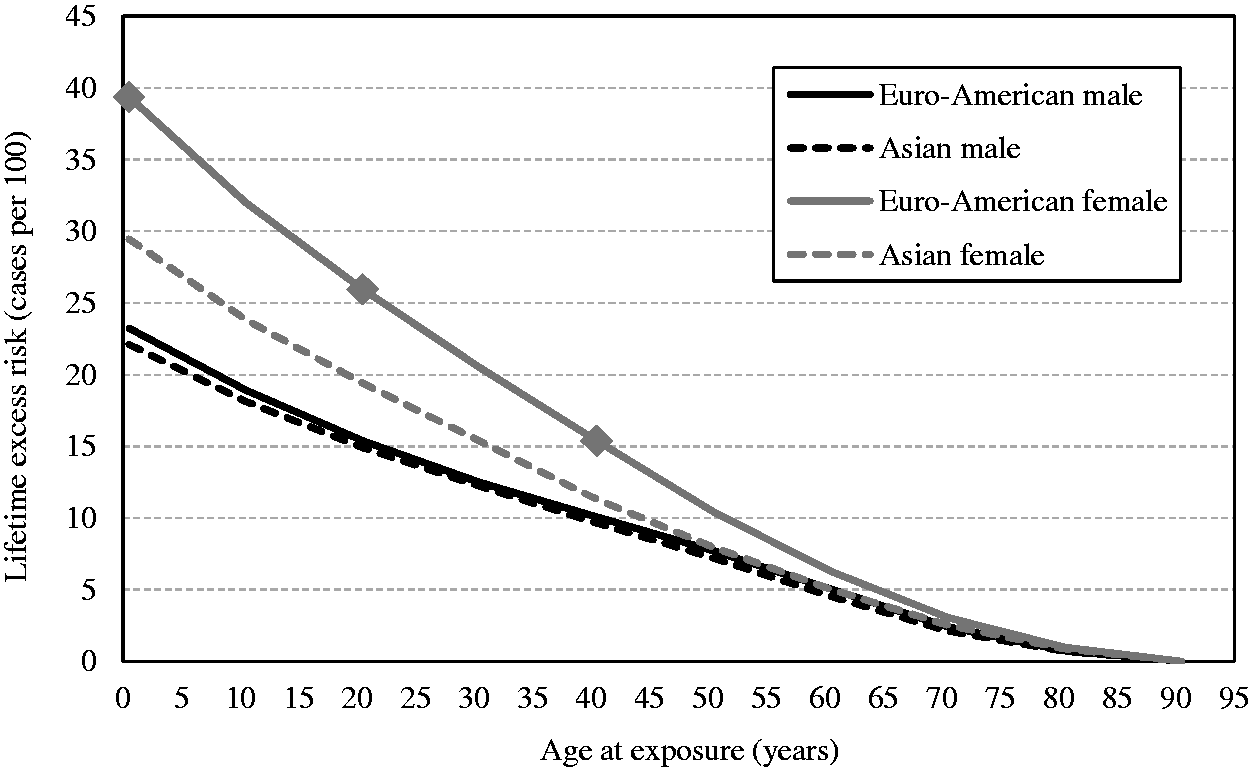
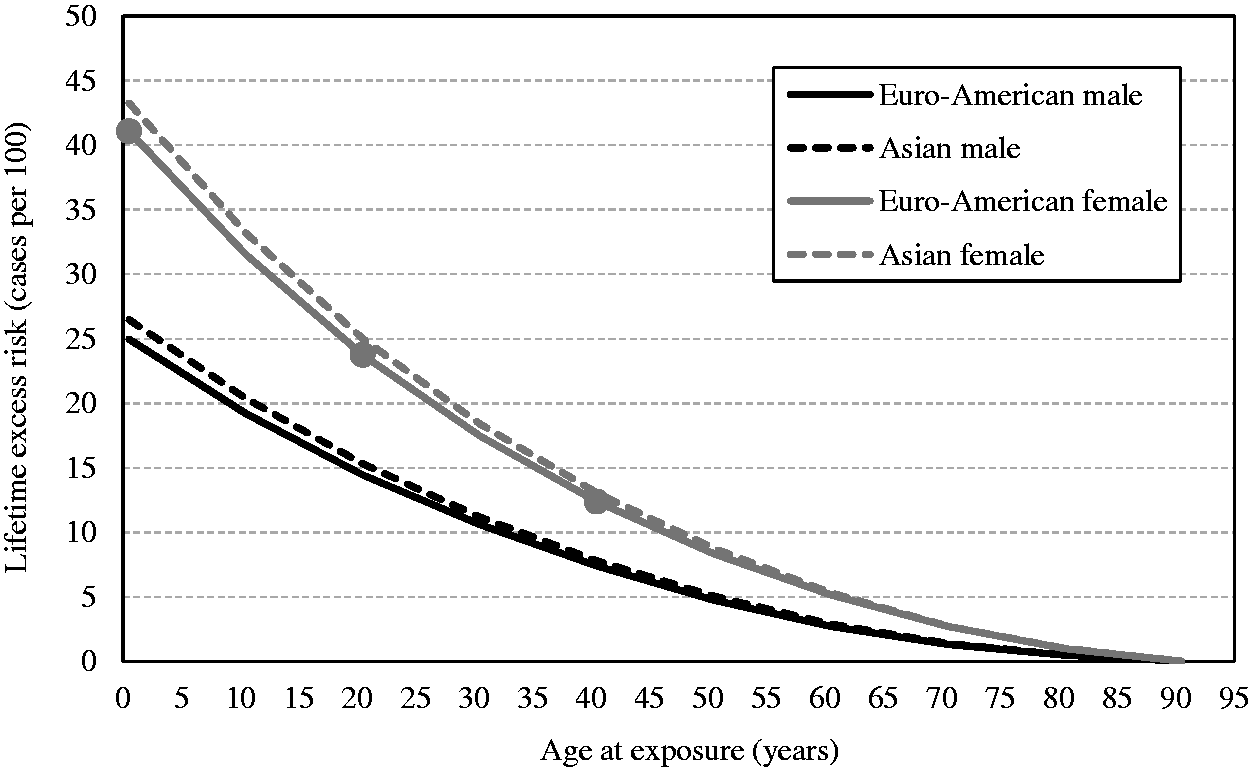
(44) While the LSS provides some information on the risk of non-melanoma skin cancer, it was judged that this may not be adequate for a general population because of differences in risk related to skin pigmentation. Therefore, the Commission used the nominal skin cancer risk estimate in Publication 59 (ICRP, 1992). This estimate was also used in Publication 60 (ICRP, 1991). In Publication 59, incidence and mortality risks were estimated using a constant additive risk model and a constant relative risk model (with no modifying effects of age or time since exposure). Of these, sex-averaged incidence risk of 9.8 × 10⁻² Sv−1 estimated by the relative risk model was adopted as the basis for the nominal risk coefficient of 1,000 cases per 10,000 persons per Gy.
3.1.3. Calculation of lifetime excess cancer risk
3.1.3.1. Survival function
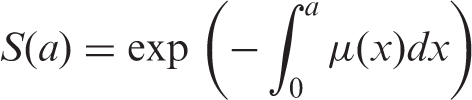
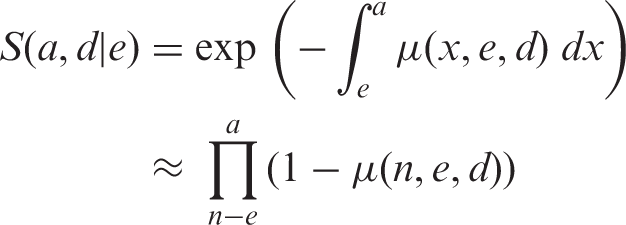
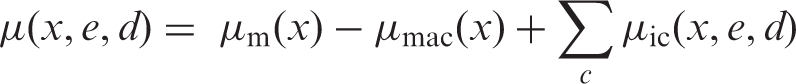
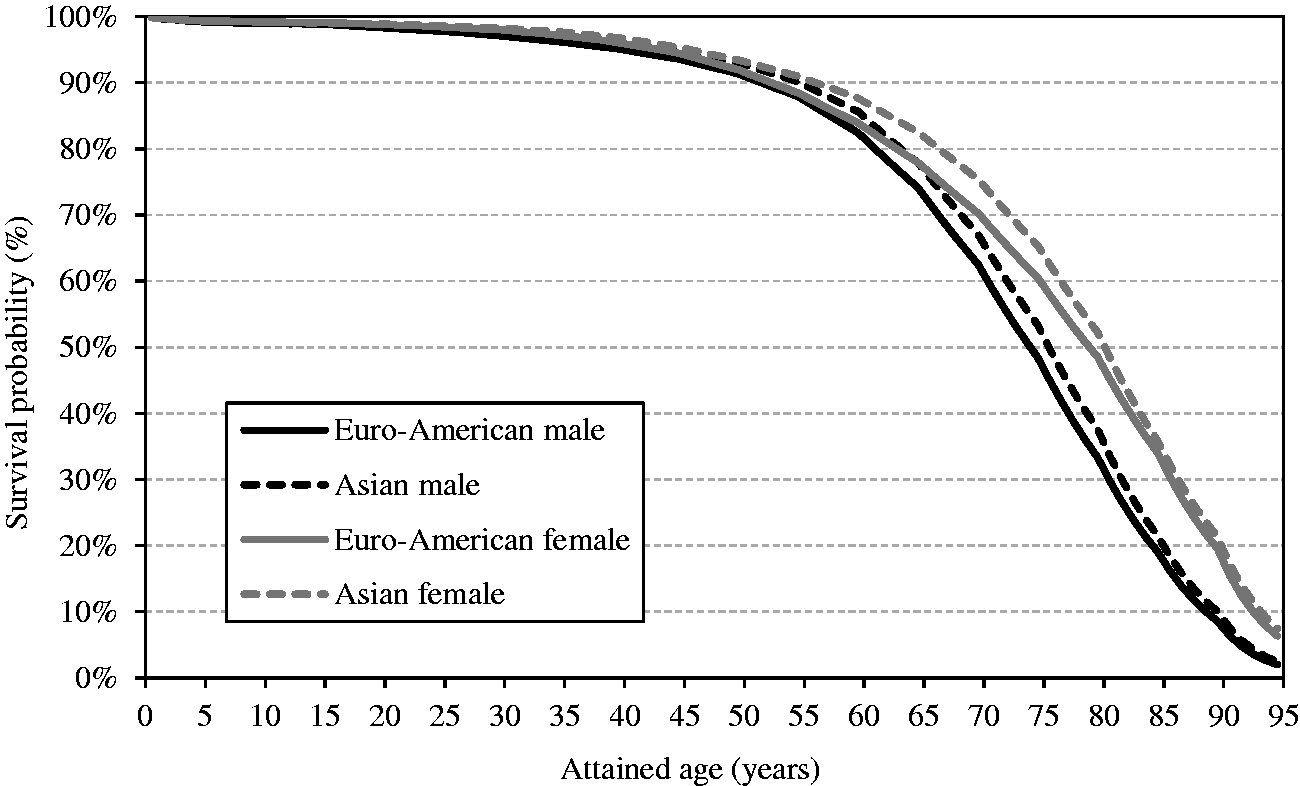
(45) As the analysis of the LSS data, the main source of the risk models, was based on the incidence of first primary cancers, cancer-free survival was used as the survival function in the calculation of lifetime cancer risk. Cancer-free survival was computed for the four reference populations (males and females of Asian and Euro-American populations) using all-cause mortality rates, cancer mortality rates, and cancer incidence rates obtained from the 8th edition of Cancer Incidence in Five Continents (Parkin et al., 2002). (46) The cancer-free survival at age a is calculated as: (47) When exposed to dose d at age e, cancer-free survival is a conditional probability of surviving until age a without cancer for those who were alive at age e (a ≥ e). It can be written as: In this formulation, μic(x,e,d) denotes the incidence rate for cancer site c at age x following an exposure to dose d at age e. With the ERR model, it is expressed as: and with the EAR model: (48) In calculating lifetime risk for each cancer site using an ERR model (ERR lifetime risk estimate), cancer-free survival was computed applying ERR models to all sites. Similarly, for EAR lifetime risk estimates, cancer-free survival was computed applying EAR models to all cancer sites. Exceptions are female breast and thyroid cancers, for which an EAR model and an ERR model, respectively, were used. Fig. 3.4 illustrates the cancer-free survival of the reference populations for the EAR estimate with an exposure to 0.1 Gy at age 0. The survival curves for the ERR and EAR estimates are almost identical at this level of dose, as the risk increase by radiation exposure is relatively small compared with the baseline rate. Cancer-free survival of reference populations after an exposure to 0.1 Gy at age 0.


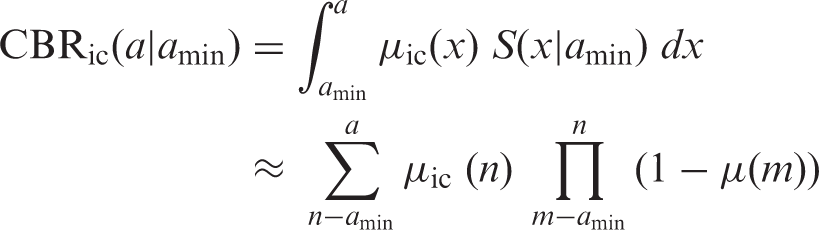
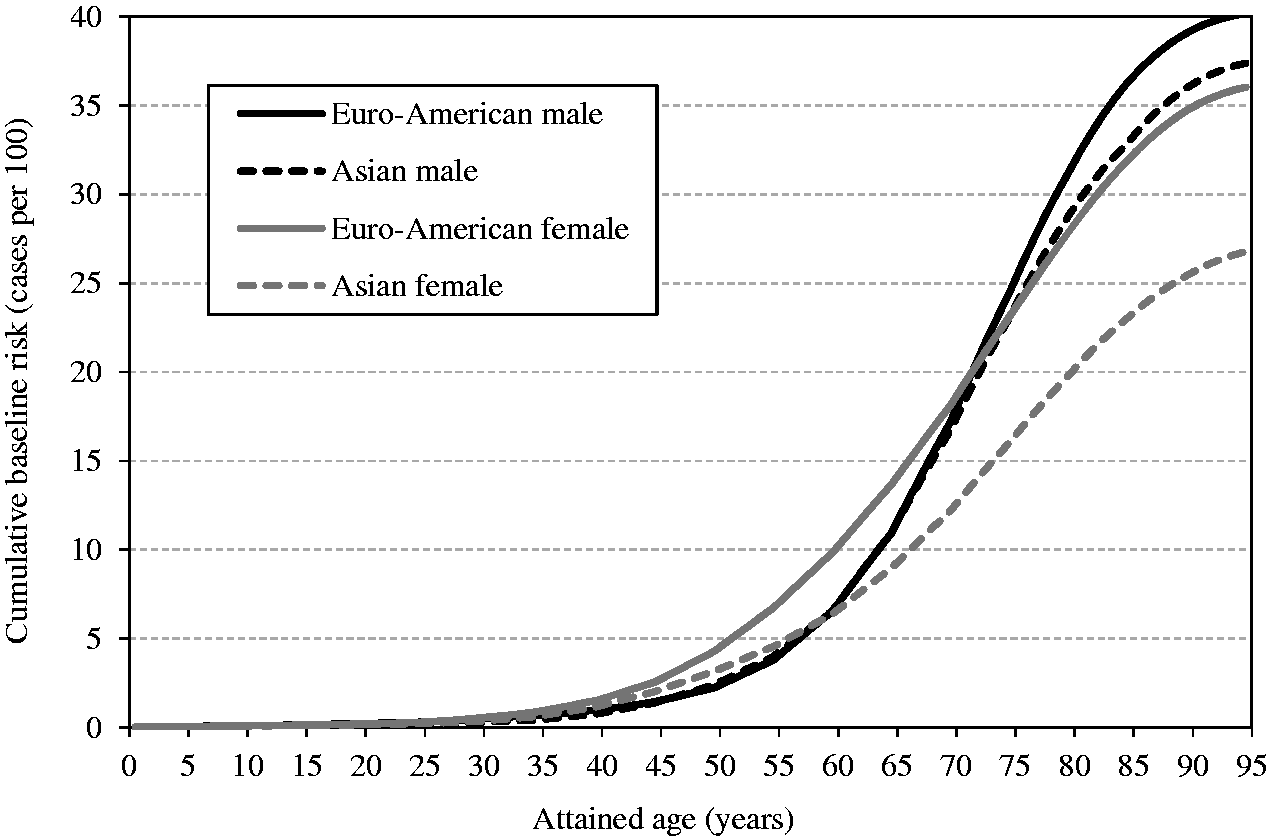
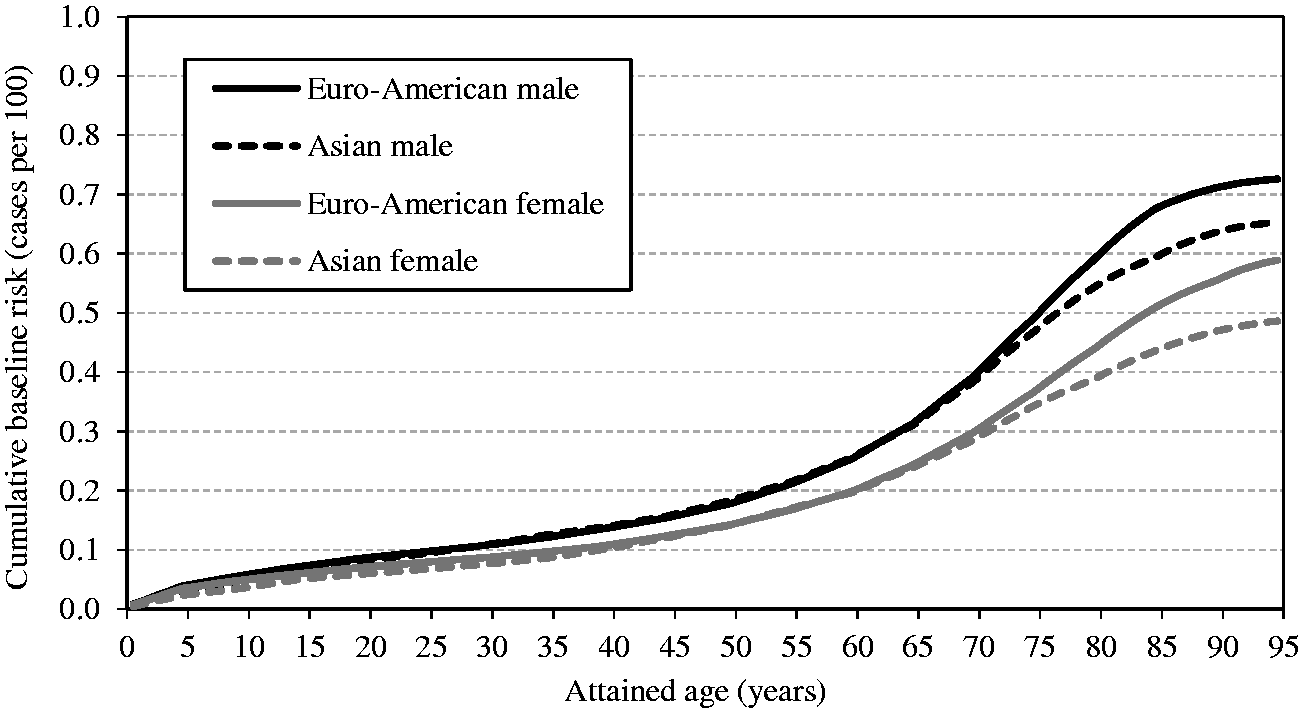
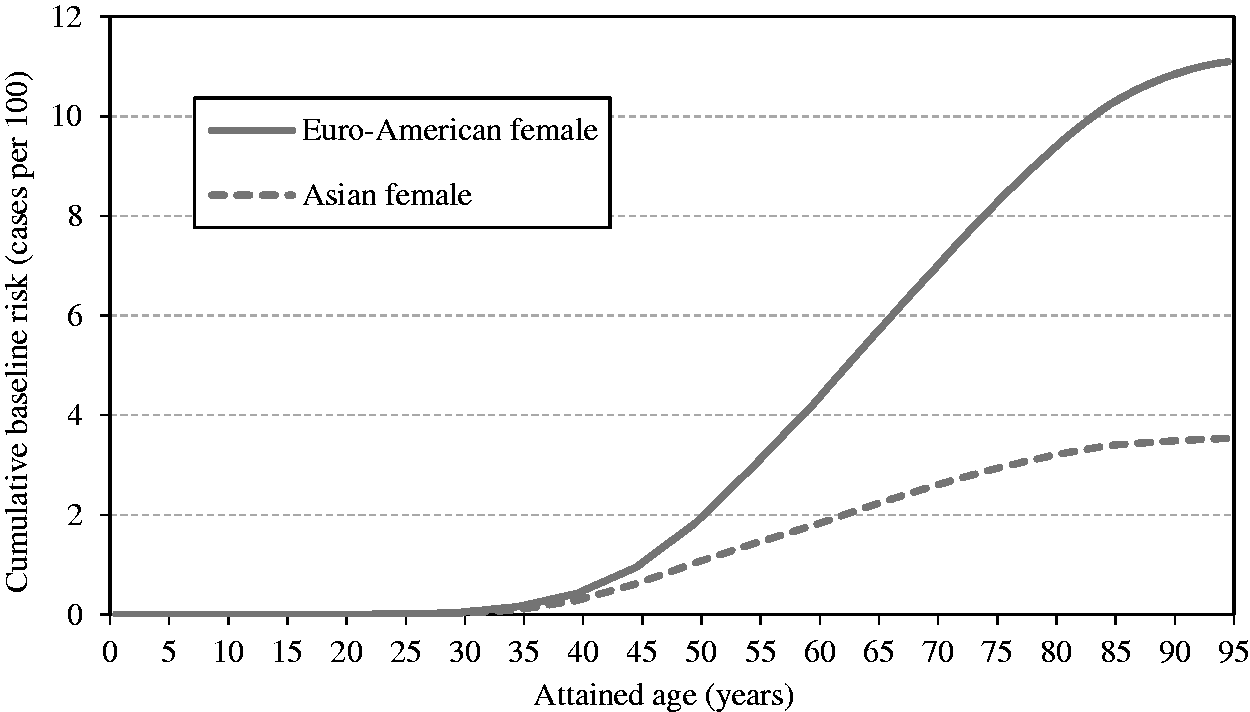
3.1.3.2. Cumulative baseline cancer risk
(49) Cumulative baseline cancer risk is the cancer risk cumulated up to a certain age in the absence of radiation exposure. It is described as: (50) While cumulative baseline risk is not a requisite component for the calculation of nominal risk, it could serve as a reference to assess the magnitude of the lifetime excess cancer risk. For illustrative purposes, the cumulative baseline risks for the whole population are presented in Figs 3.5–3.7 for all solid cancers, leukaemia, and female breast cancer. Females show higher risk for all solid cancers up to middle age, but males show higher peak risk at older ages (Fig. 3.5). This is mainly due to the relatively early onset of female breast cancer. For most cancer sites, cumulative baseline risk is consistently higher in males, as demonstrated by leukaemia (Fig. 3.6). For female breast cancer, the risk is markedly high in Euro-Americans compared with Asians (Fig. 3.7). Cumulative baseline risk for incidence of all solid cancers in reference populations. Cumulative baseline risk for incidence of leukaemia in reference populations. Cumulative baseline risk for incidence of female breast cancer in reference populations.
3.1.3.3. Lifetime excess cancer risk
(51) There are several ways of expressing lifetime risk for an individual of developing or dying from a specific disease. The lifetime risk calculated in Publication 103 (ICRP, 2007) for the nominal risk coefficients is the risk of exposure-induced cancer incidence (REIC). For an exposure to dose d at age e, REIC for a cancer site c is expressed as: (52) Risk models and the survival function described above were used to compute sex-specific lifetime risk estimates for the Asian and Euro-American composite populations. For each cancer site, REIC at 0.1 Gy was computed and multiplied by 10 to express the result as the number per Gy. As an exposure to 0.1 Gy does not bring about a significant decrease in survival, this calculation methodology gives a very similar result to the lifetime attributable risk (LAR), which does not take into account the decrease in survival due to the exposure (Zhang et al., 2020; see Section 4.2 for more discussion). (53) Two nominal populations were considered: the whole population (ages at exposure of 0–89 years
5
5In Publication 103 (ICRP, 2007), the lifetime risk estimates were computed for ages at exposure of 0–85 years in 5-year intervals, and then averaged using weights reflecting the age distribution. This assumes an exposure of the population aged <90 years.
(54) For the calculation of lifetime risk of leukaemia, the risk models derived from the LSS considered all leukaemias, whereas the baseline incidence rates for reference populations did not include CLL. This difference has little impact as CLL cases are very rare in Japan.
3.1.3.4. Age dependence of lifetime excess risk
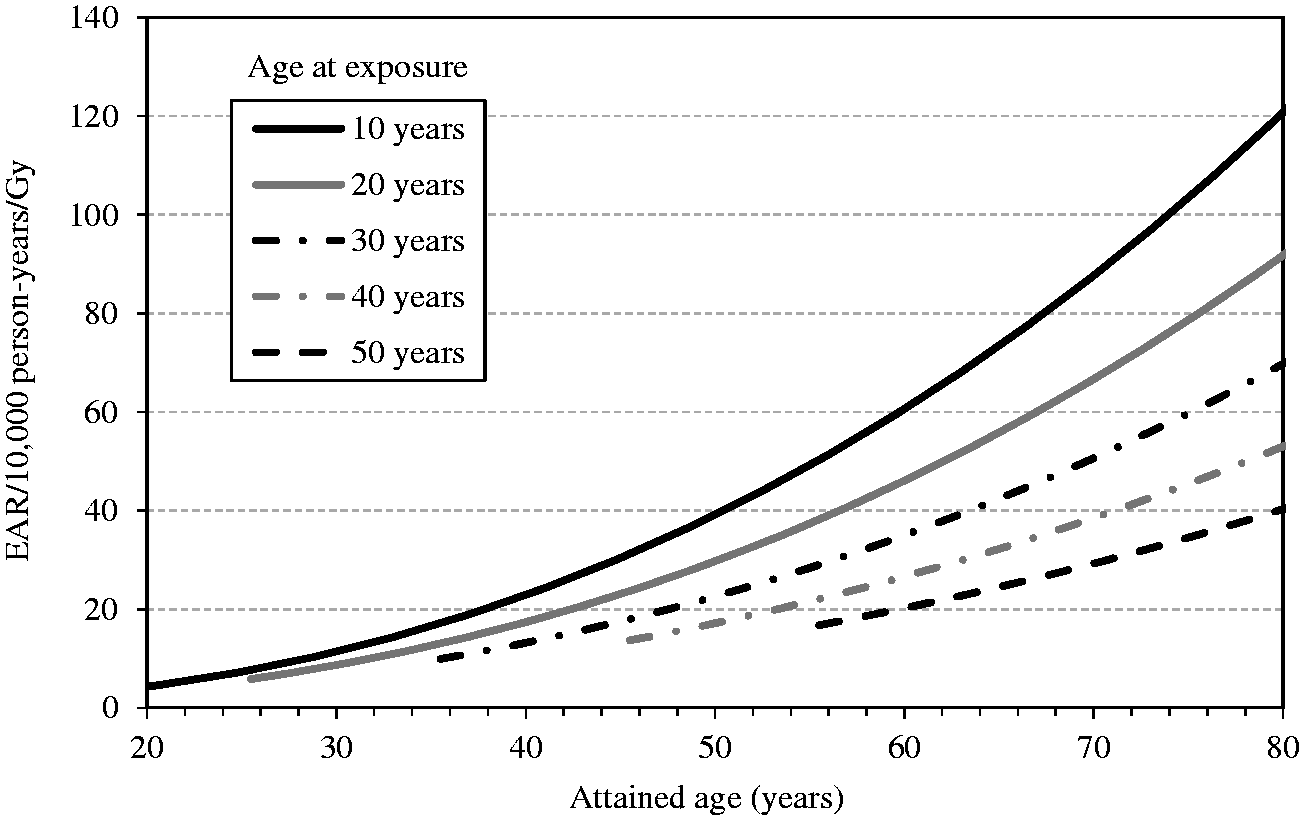
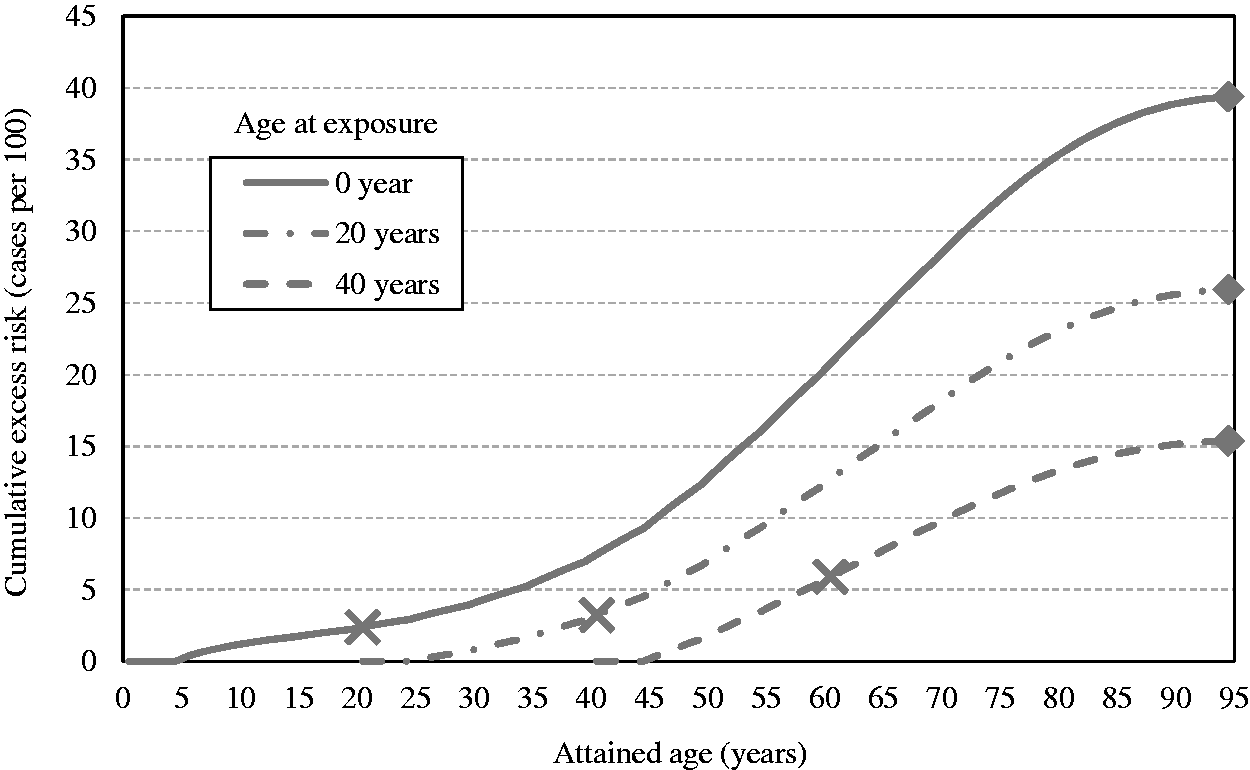
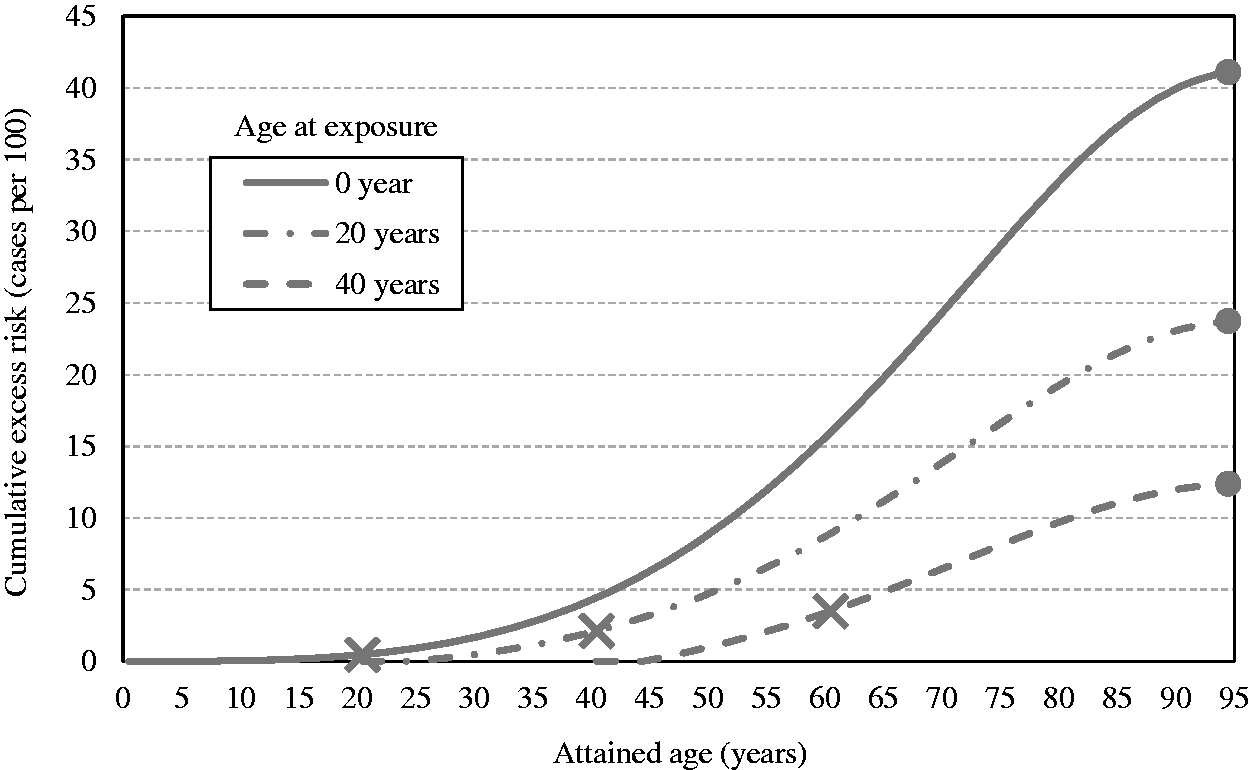
(55) Figs 3.8 and 3.10 show the estimates of cumulative excess risk of all solid cancers in Euro-American females with a single exposure at different ages (0, 20, and 40 years) using the ERR and EAR models, respectively. Figs 3.9 and 3.11 show the estimates of lifetime excess risk of all solid cancers vs age at exposure in the reference populations, using the ERR and EAR models, respectively. All these estimates are 10 times the value calculated for an exposure to 0.1 Gy. (56) Figs 3.8–3.11 illustrate the dependence of the cumulative excess risk on the attained age and age at exposure. The data points shown by diamonds in Fig. 3.8 for an exposure at 0, 20, or 40 years of age correspond to those on the curve for Euro-American females in Fig. 3.9. Similarly, the data points marked by circles in Fig. 3.10 correspond to those in Fig. 3.11. The cross markers in Figs 3.8 and 3.10 indicate the cumulative excess risk 20 years after the exposure. (57) Figs 3.8 and 3.10 show that the cumulative excess risk increases gradually following the minimum latency period of 5 years, and the upward trend becomes notable after middle age in both the ERR and EAR estimates. This pattern is similar to that of the cumulative baseline risk shown in Fig. 3.5. It should also be noted that the cumulative excess risk 20 years after exposure (represented by the crosses) is slightly higher for an exposure age of 40 years compared with younger exposure ages. This demonstrates a counter-balancing effect between the increase in the baseline risk with attained age and the decrease in excess risk coefficient with attained age for the ERR model (Fig. 3.2), or with age at exposure for the EAR model (Fig. 3.3). The cumulative excess risk is consistently lower for an exposure age of 40 years compared with younger exposure ages. This is attributed to the shorter remaining period of life for older ages at exposure. (58) Figs 3.9 and 3.11 show that the lifetime excess risk declines gradually with age at exposure. This decline is partly due to the age-dependent changes in ERR and EAR shown in Figs 3.2 and 3.3, but is mainly due to the reduction of remaining period of life at older ages. These figures also illustrate the difference between sexes and geographical regions. The lifetime excess risk is higher among females than among males irrespective of population or model. The ERR lifetime risk estimate is higher in the Euro-American population than in the Asian population (Fig. 3.9), whereas such difference is less clear with the EAR model (Fig. 3.11). Modification of sex-averaged excess absolute risk (EAR) for all solid cancers by age at exposure and attained age. Cumulative excess risk per Gy for all solid cancers in Euro-American females estimated by the excess relative risk model. The risk calculated for 0.1 Gy was multiplied by 10, which is expressed as the risk per Gy. The data points shown by diamonds correspond to those in Fig. 3.9. The cross markers indicate the cumulative excess risk 20 years after the exposure. Cumulative excess risk per Gy for all solid cancers in Euro-American females estimated by the excess absolute risk model. The risk calculated for 0.1 Gy was multiplied by 10, which is expressed as the risk per Gy. The data points marked by circles correspond to those in Fig. 3.11. The cross markers indicate the cumulative excess risk 20 years after the exposure. Lifetime excess risk (cumulated up to age 94 years) per Gy for all solid cancers estimated by the excess relative risk model. The risk calculated for 0.1 Gy was multiplied by 10, which is expressed as the risk per Gy. The data points shown by diamonds correspond to those in Fig. 3.8. Lifetime excess risk (cumulated up to age 94 years) per Gy for all solid cancers estimated by the excess absolute risk model. The risk calculated for 0.1 Gy was multiplied by 10, which is expressed as the risk per Gy. The data points marked by circles correspond to those in Fig. 3.10. Comparison of reference detriment with detriments calculated with a lethality fraction (k) set uniformly at 1. Reference detriment uses cancer-site-specific values of lethality fraction that vary between 0.07 for thyroid cancer and 0.95 for liver cancer.
3.1.3.5. Averaging lifetime excess risk across ages
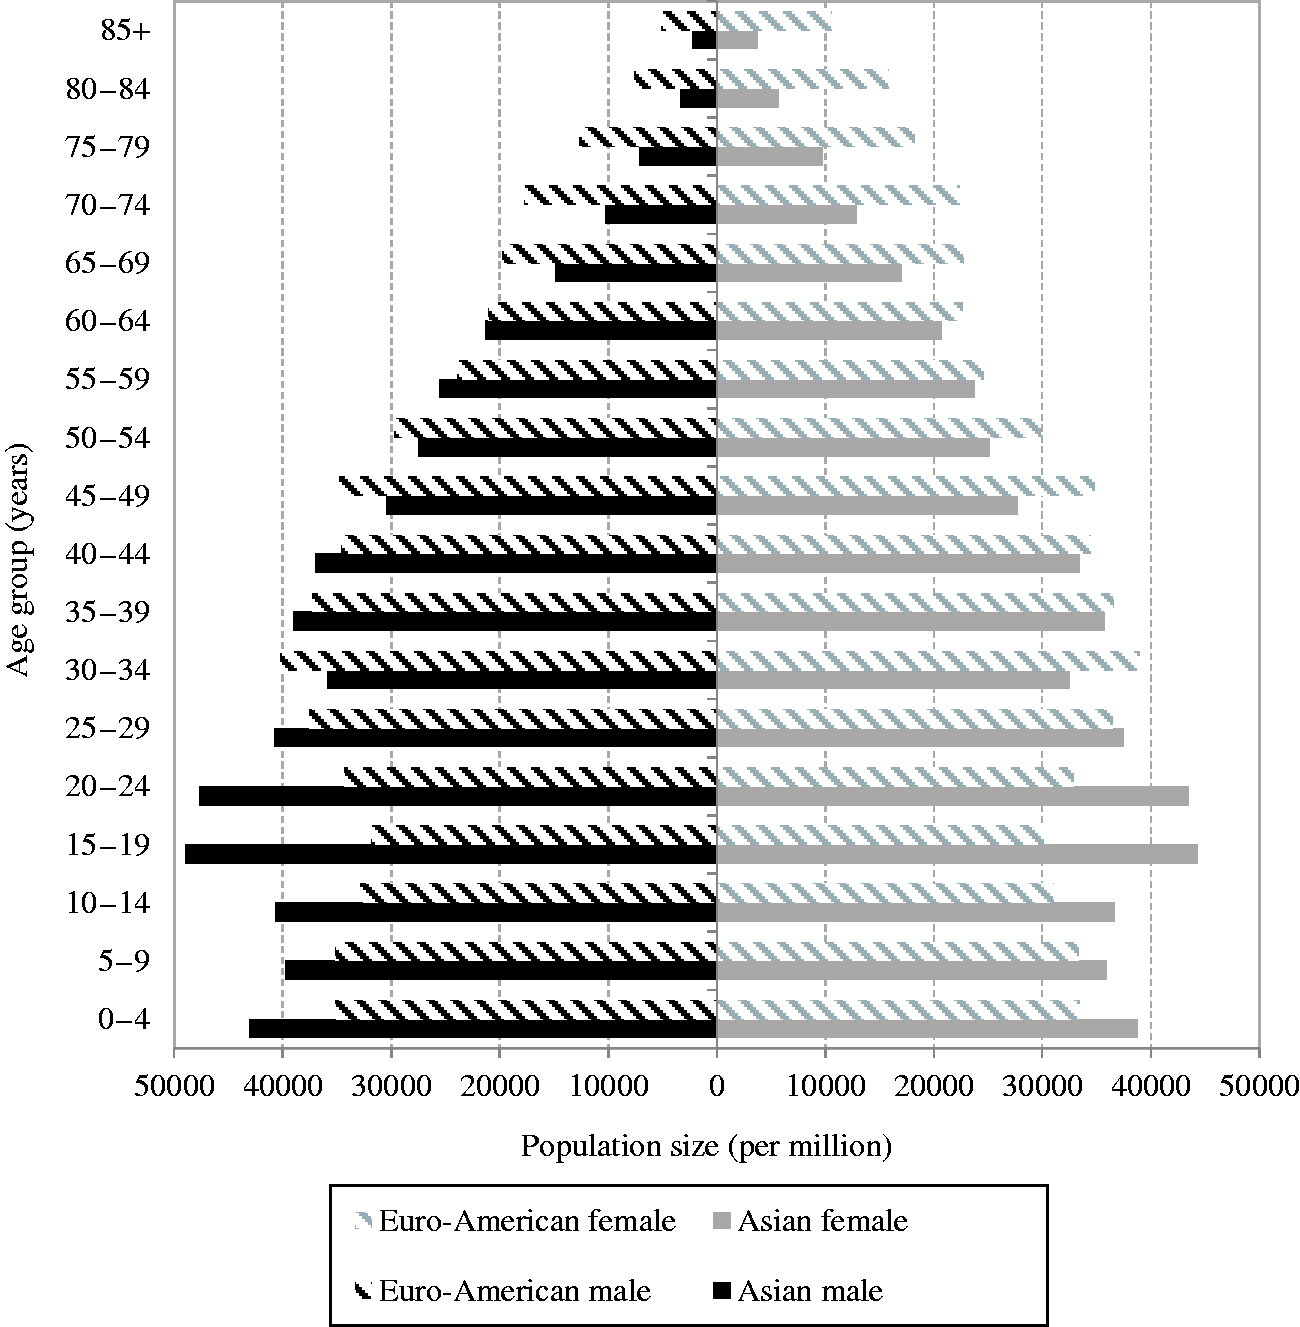
(59) The age-averaged lifetime excess risk was calculated for each combination of geographical region (Asian and Euro-American), sex (males and females), and model (ERR and EAR) as a weighted mean of REIC across ages at exposure. The weight was assigned in proportion to the population of each age group in the composite reference population. Fig. 3.12 illustrates the age distribution of the reference populations by 5-year age group (numbers are given in Annex A, Table A.7). Population size data were obtained from the World Health Organization international mortality statistics database
6
6Population data were downloaded on 22 April 2003 from http://www.who.int/healthinfo/mortality_data/en/.
Age distribution of the reference populations.
Age-averaged lifetime excess risk for the whole population.
ERR, excess relative risk; EAR, excess absolute risk.
3.1.4. Transfer of risk estimates across populations
(60) It is problematic to transfer risk estimates of radiation-associated cancers from one population to another if the corresponding baseline rates differ. To address this issue, the population risks were calculated as weighted averages of the ERR and EAR lifetime risk estimates with weights based on judgements concerning the relative applicability of the two risk estimates (Table 3.1). As a general rule, weights of 0.5 were assigned to each of the ERR and EAR estimates, unless there was sound evidence of preferred model. This equal weighting was applied to all cancer sites, except for breast, thyroid, lung, bone, and skin cancers
7
7The equal weighting was also applied to bone marrow cancer (leukaemia). It was mistakenly described as 100% EAR transfer in Publication 103 (ICRP, 2007).
(61) As a pooled analysis of radiation effects on the risk of breast cancer (Preston et al., 2002) provides evidence against the use of common ERR models, the risk of female breast cancer was based solely on an EAR model. For thyroid cancer, the use of EAR models appeared to be problematic because variation in screening intensity has a marked effect on the rate of radiation-associated thyroid cancers. Therefore, the risk of thyroid cancer was based solely on an ERR model. For lung cancer, the atomic bomb survivor data suggest that the EAR model is more comparable across sexes than the ERR model, and that radiation dose and smoking history interact additively as risk factors for lung cancer (Pierce et al., 2003). On this basis, the ERR and ERA models were given weights of 0.3 and 0.7, respectively. While lifetime risks for bone and skin cancers were not calculated in Publication 103 (ICRP, 2007), a constant absolute risk model and a constant relative risk model were used, respectively, in the past publications to estimate nominal risk (ICRP, 1991, 1992).
(62) In summary, ERR:EAR weights were 0%:100% for breast and bone cancers, 100%:0% for thyroid and skin cancers, 30%:70% for lung cancer, and 50%:50% for all other cancers (Table 3.1).
3.1.5. Application of DDREF
(63) Experimental studies show that the biological effectiveness of radiation exposure at low doses and low dose rates is usually lower compared with exposures at high doses and high dose rates, suggesting that dose-specific estimates based on acute high-dose exposure data should be reduced for applications to low-dose, continuous, or fractionated exposures. In its 1990 Recommendations, the Commission made the broad judgement for the practical purposes of radiological protection that a DDREF of 2 should be applied as the reduction factor for doses of <0.2 Gy and for higher doses when the dose rate is <0.1 Gy h–1 (ICRP, 1991; Rühm et al., 2016). This decision remains unchanged in the 2007 Recommendations, while the Commission emphasises that the choice of the DDREF value continues to be a broad judgement including elements of both subjectivity and probabilistic uncertainty (ICRP, 2007). (64) The lifetime risk estimates were adjusted downward by a factor of 2 to account for a DDREF regardless of sex and age at exposure. The DDREF was not applied to bone marrow cancer as the LQ dose response for leukaemia took into account the risk modification at low doses. No adjustment was made for bone and skin cancers, either.
3.1.6. Integration of heritable effects
(65) To estimate the risk of heritable effects, the relative importance of genetic components as well as the frequency of transmissible mutations needs to be taken into account. The UNSCEAR 2001 Report provided risks expressed as the predicted number of additional cases (i.e. over the baseline) of different classes of genetic disease per million live births per Gy for a population exposed to low-LET, low-dose, or chronic irradiation, generation after generation (UNSCEAR, 2001). For all classes except congenital abnormalities, the estimates were based on a doubling dose of 1 Gy and the respective values of baseline frequency, mutation component, and potential recoverability correction factor for the different classes of genetic diseases. For congenital abnormalities, the risk estimate came from mouse data and was not based on the doubling dose method. (66) On the basis of UNSCEAR (2001), the Commission estimated risks for all classes of genetic diseases: Mendelian diseases, chronic diseases, and congenital abnormalities [Tables A.6.4 and A.6.6, Publication 103 (ICRP, 2007)]. While the estimates were based on the state of knowledge in this area, the strengths and limitations of these estimates need to be borne in mind, in view of various underlying assumptions. (67) The Commission used risk estimates for the first two generations in Publication 26 (ICRP, 1977a) and the equilibrium estimate in Publication 60 (ICRP, 1991). In Publication 103 (ICRP, 2007), it was decided to use the risk estimate up to the second generation because the equilibrium estimate in Publication 60 centred on the unsupported assumptions on selection coefficients, mutation component, and population changes over hundreds of years. As a result, the risk of heritable effects in the whole population associated with gonadal dose was estimated to be approximately 20 cases per 10,000 persons per Gy. The same risk estimate was applied to both males and females.
3.1.7. Nominal risk coefficients
3.1.7.1. Nominal risk coefficients for the whole population
(68) The lifetime risk estimates calculated through the above-mentioned methodology were averaged across populations and sexes to obtain the nominal risk coefficients for 14 organs or tissues, which include 12 cancer sites (oesophagus, stomach, colon, liver, lung, bone, skin, breast, ovary, bladder, thyroid, bone marrow), a set of remaining cancer sites grouped as ‘other solid cancers’, and the gonads for heritable effects. (69) Some radiation-related cancers are sex-specific, and for many others, sex is a major modifier of radiation-related risk. As the most extreme examples, ovarian cancer is specific to females, and the risk of breast cancer among males was assumed to be zero because of the rare occurrence
8
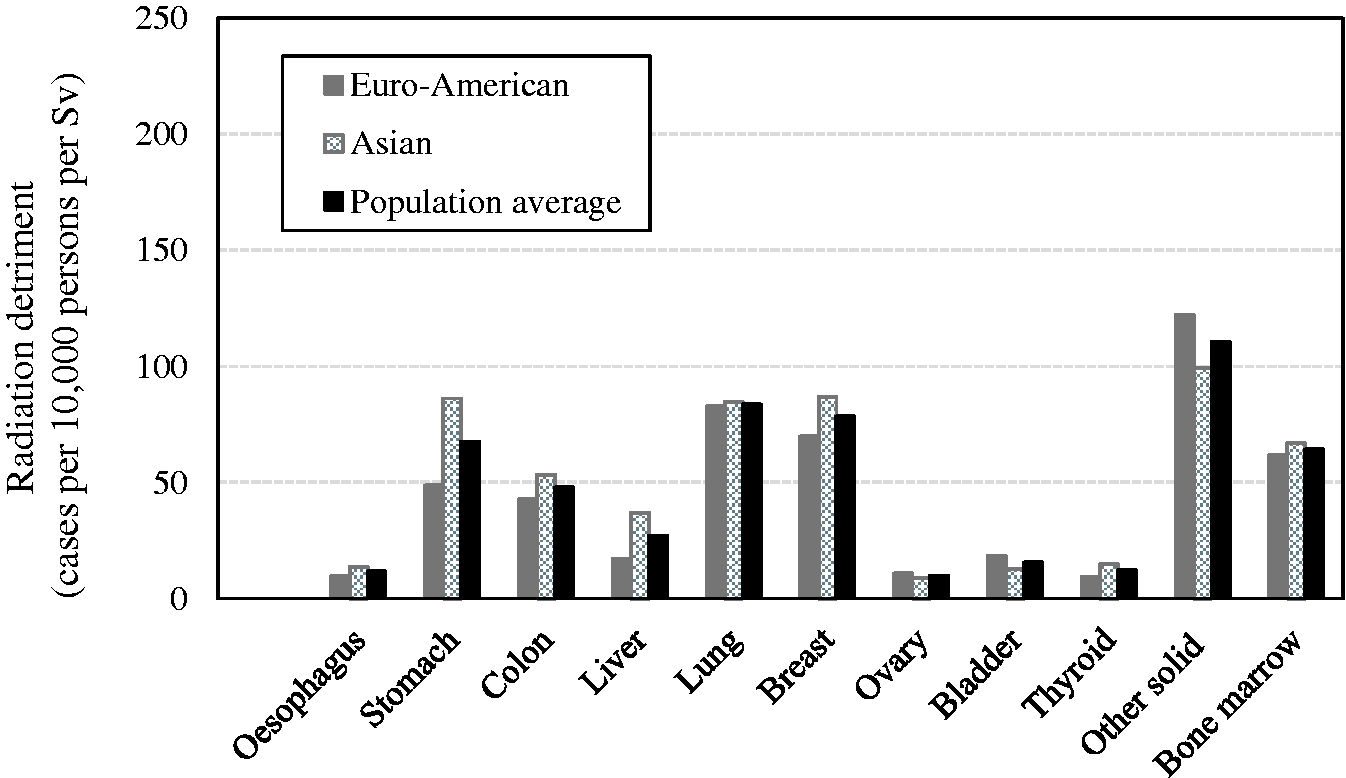
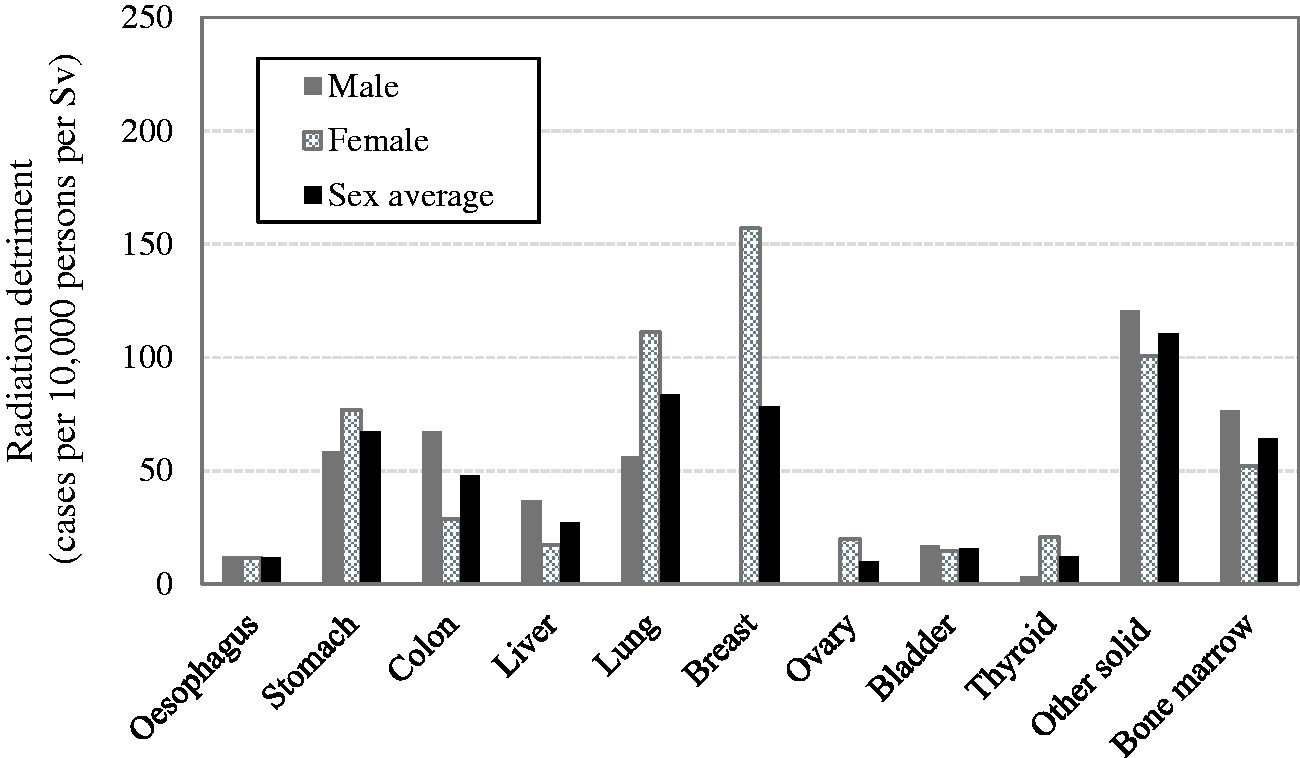
8Although a recent analysis of the LSS data (Brenner et al., 2018) suggested a significant positive dose response for male breast cancer, this assumption continues to be valid considering the very small number of cases.
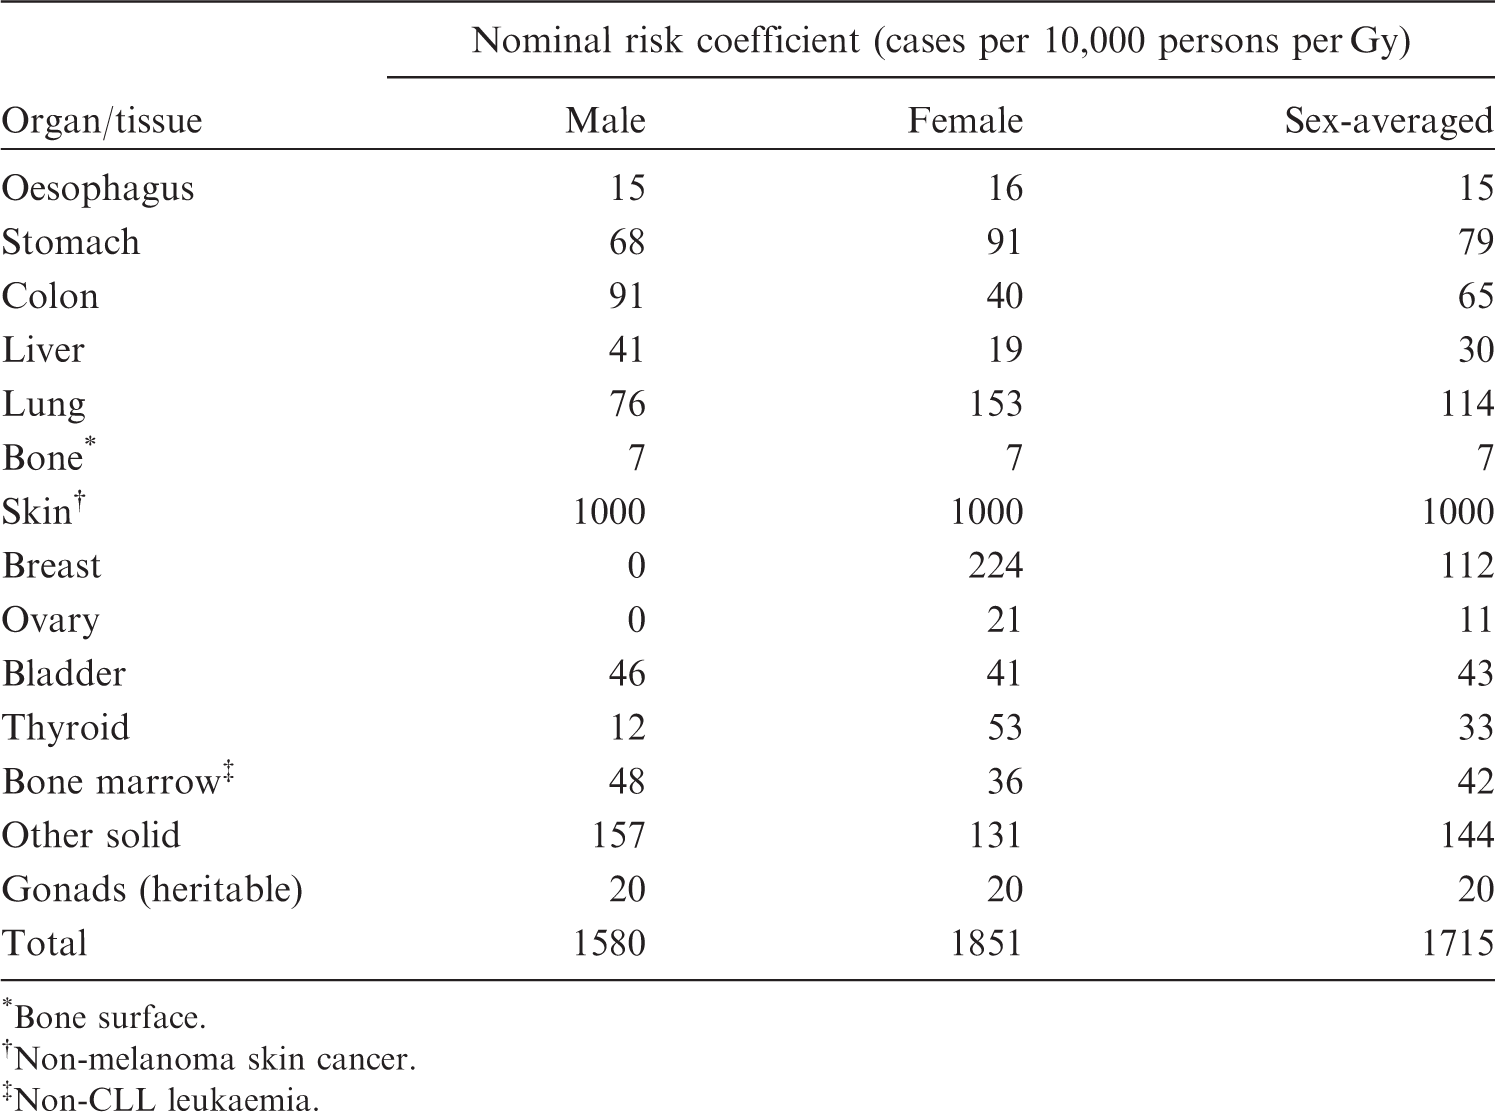
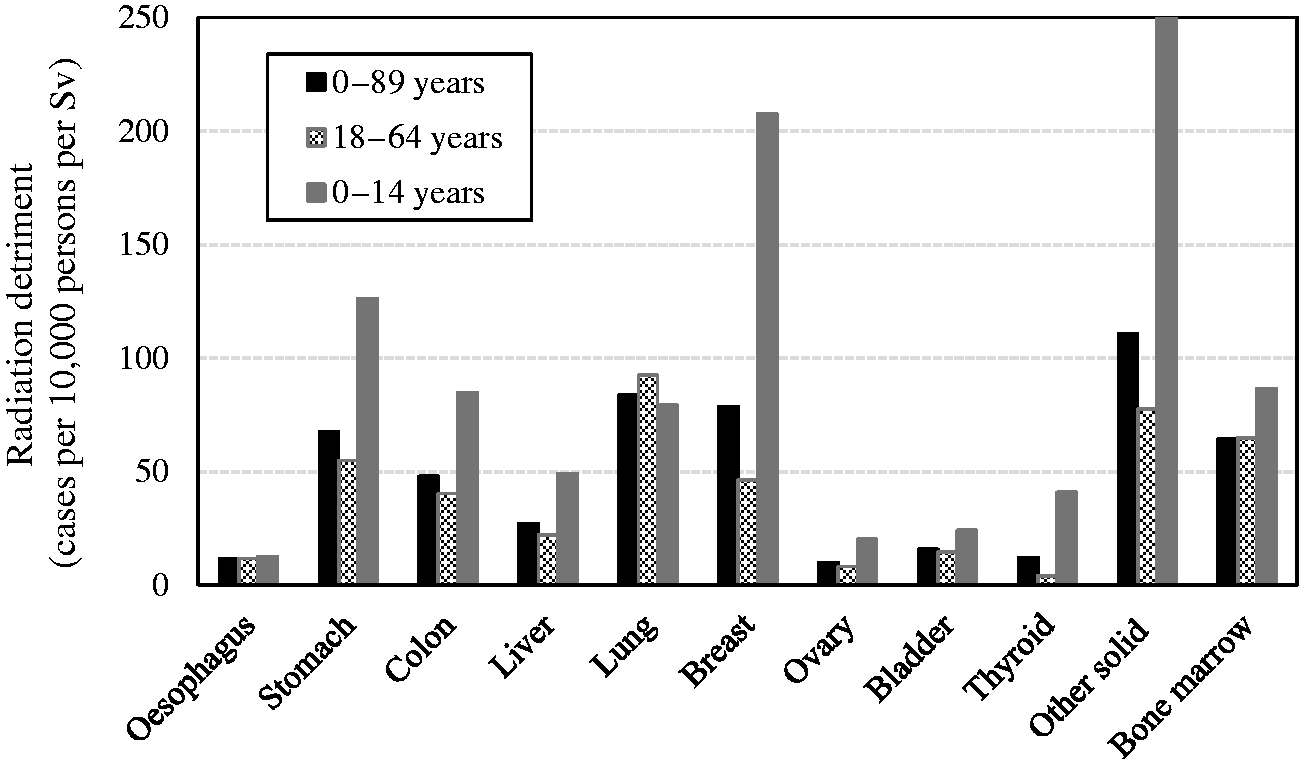
(70) In recalculating nominal risks for this publication, the procedure in Publication 103 (ICRP, 2007) was followed as described thus far, but the methods of data processing and computation were refined as appropriate. Consequently, the recalculated nominal risk coefficients (calculated from the intermediate values in Table 3.6) do not agree completely with those in Publication 103, which are given in Table 3.7. Nevertheless, the risk coefficients in this table remain unchanged as the difference is not substantial.
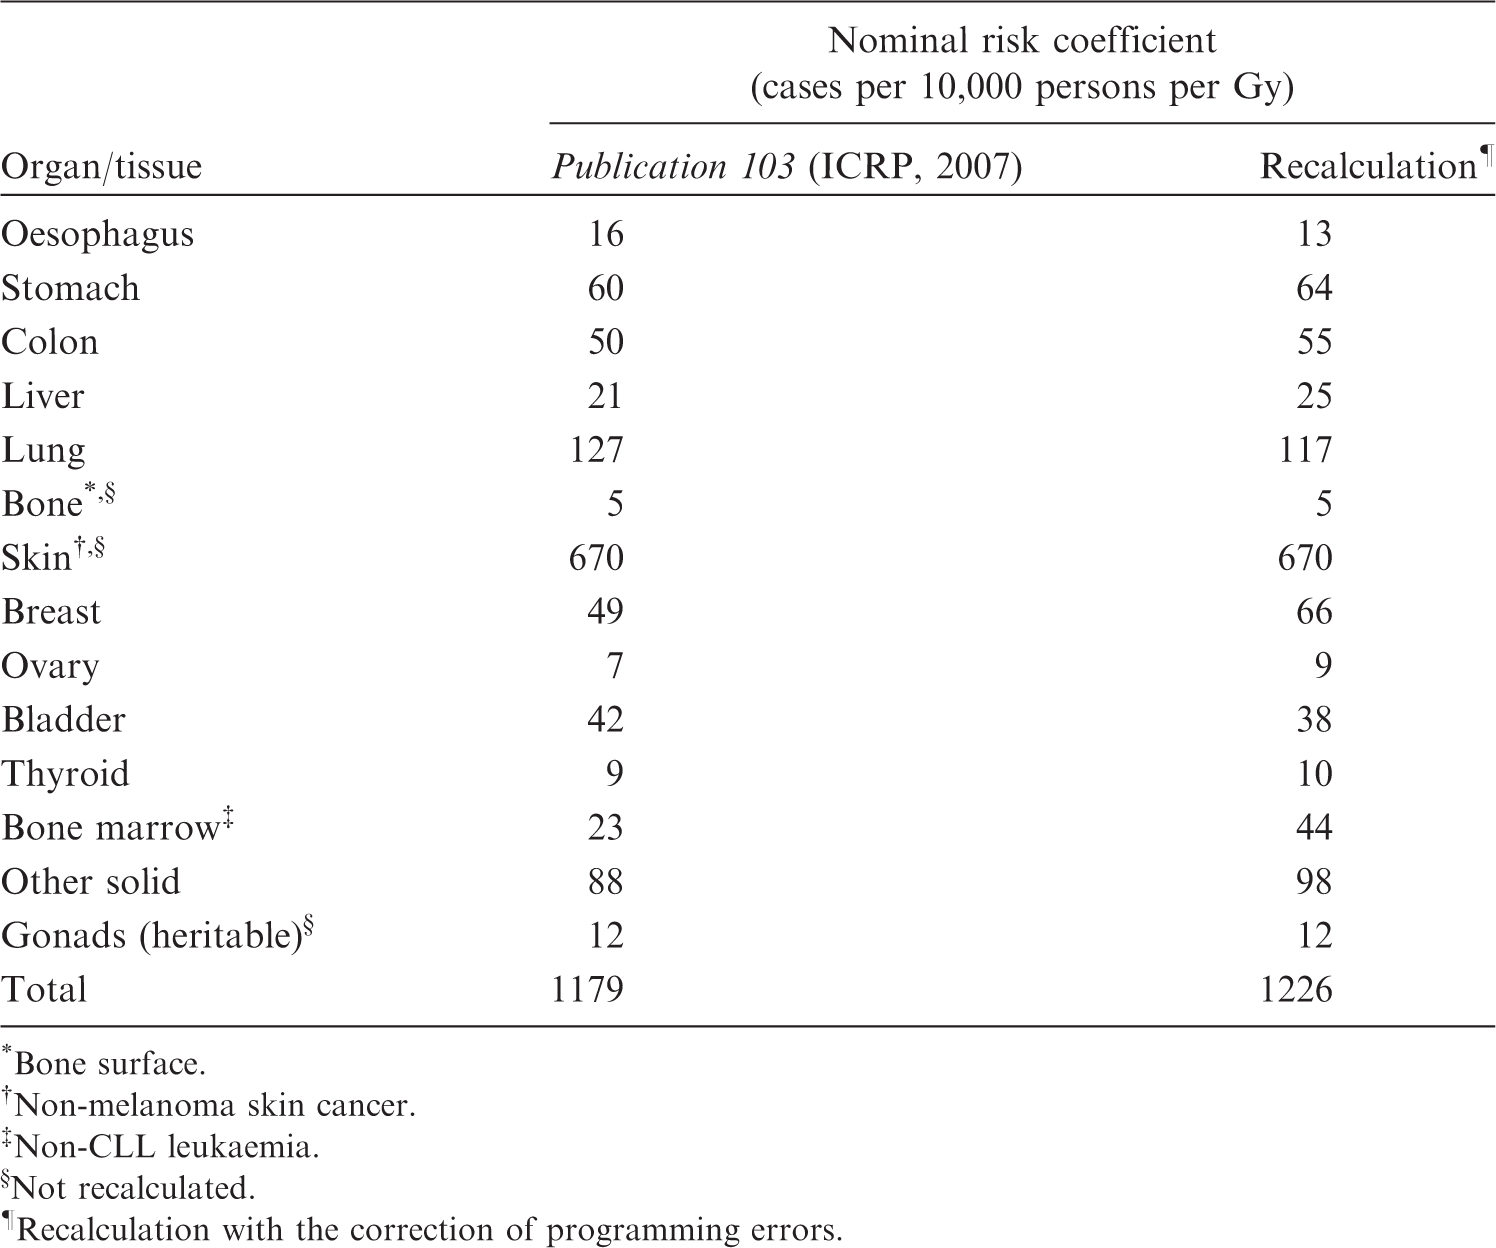
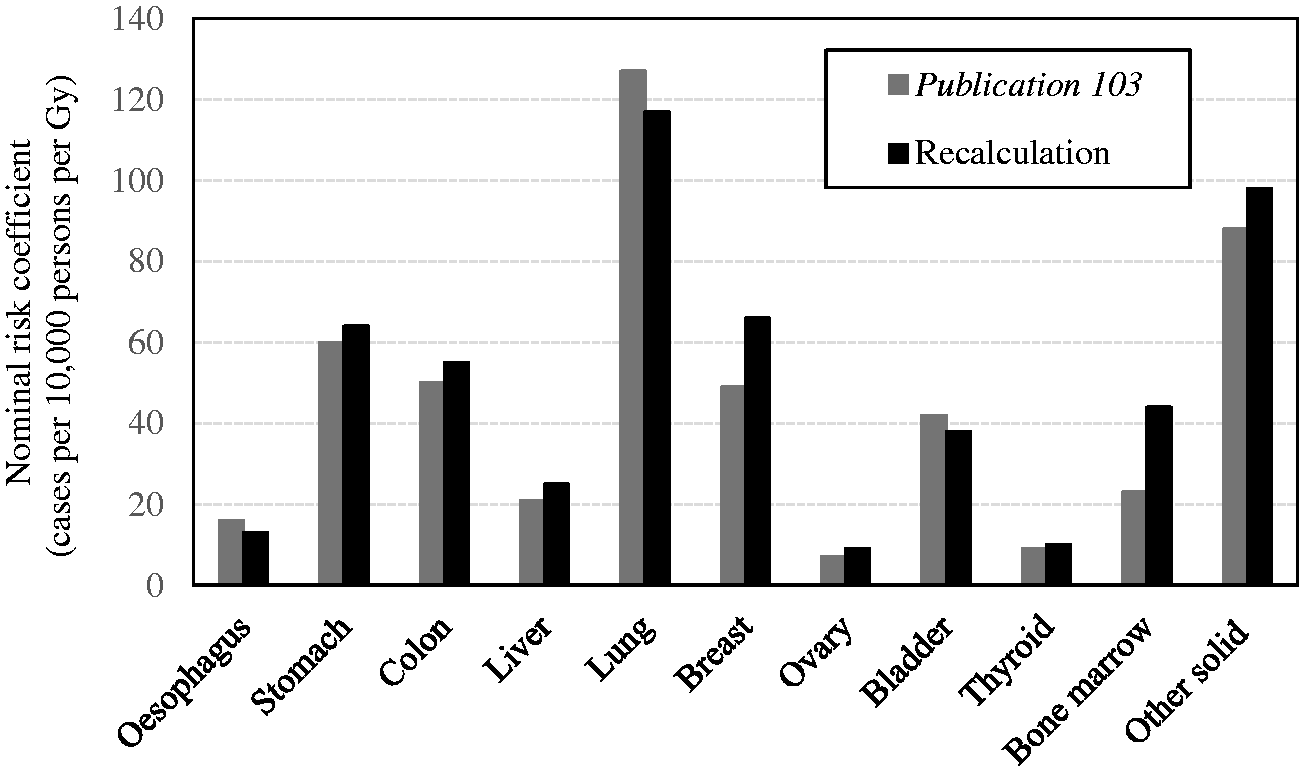
Nominal risk coefficients for the whole population in Publication 103 (ICRP, 2007).
*Bone surface.
Non-melanoma skin cancer.
Non-CLL leukaemia.
3.1.7.2. Nominal risk coefficients for the working-age population
(71) Nominal risks for the working-age population were calculated in the same way for subpopulations consisting of those aged 18–64 years at exposure. The excess risk was cumulated up to age 94 years to compute REIC, as in the case of the whole population. In verifying the calculation of nominal risk in Publication 103 (ICRP, 2007), however, programming errors have been found. As illustrated in Fig. 3.13, a recalculation has revealed that correcting these errors would increase the nominal risk coefficients considerably for bone marrow (+91%), breast (+35%), and ovarian (+29%) cancers, but the difference is within ±20% for other organs and tissues. (72) Table 3.8 compares the entire nominal risk coefficients for the working-age population between Publication 103 (ICRP, 2007) and the recalculation. It appears that, while the miscalculation is unfortunate, the impact of the errors on the overall nominal risk is limited (4% in total). Moreover, these errors do not affect tissue weighting factors, which derive from radiation detriment for the whole population. (73) In Publication 103 (ICRP, 2007), nominal risks were calculated based on cancer incidence, using the most up-to-date information at the time. Nevertheless, when adjusted for severity, the resulting detriment values were quite similar to those in Publication 60 (ICRP, 1991). It was therefore concluded that the approximated overall fatal risk coefficient of 5% per Sv on which international radiation safety standards were based continued to be appropriate for the purposes of radiological protection [see Para. 87 in ICRP (2007)]. As demonstrated in Table 3.8, the correction of errors does not change this conclusion. Therefore, the Commission concludes that the miscalculations of the nominal risk coefficients and radiation detriments have no implications for operation of the System of Radiological Protection. Nominal risk coefficients for the working-age population. *Bone surface. Non-melanoma skin cancer. Non-CLL leukaemia. Not recalculated. Recalculation with the correction of programming errors. Comparison of nominal risk coefficients for the working-age population between Publication 103 (ICRP, 2007) and recalculation.
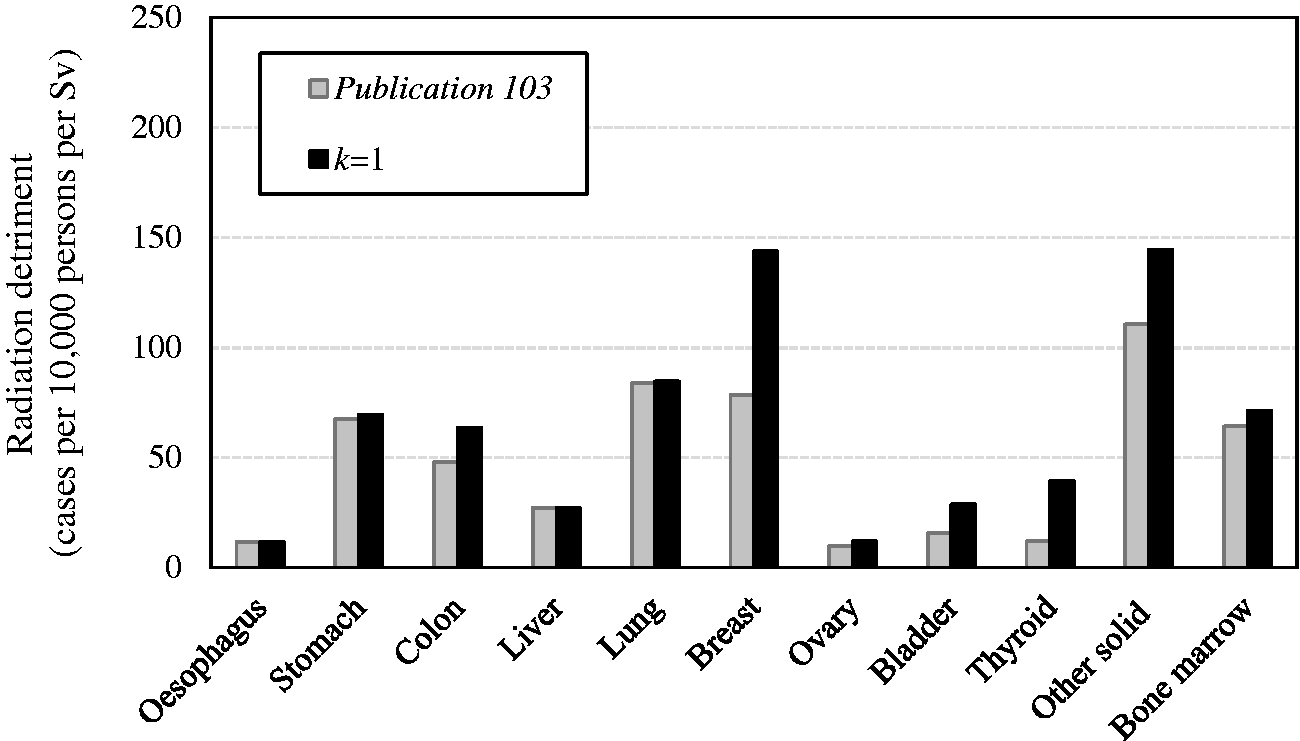
3.2. Severity adjustment
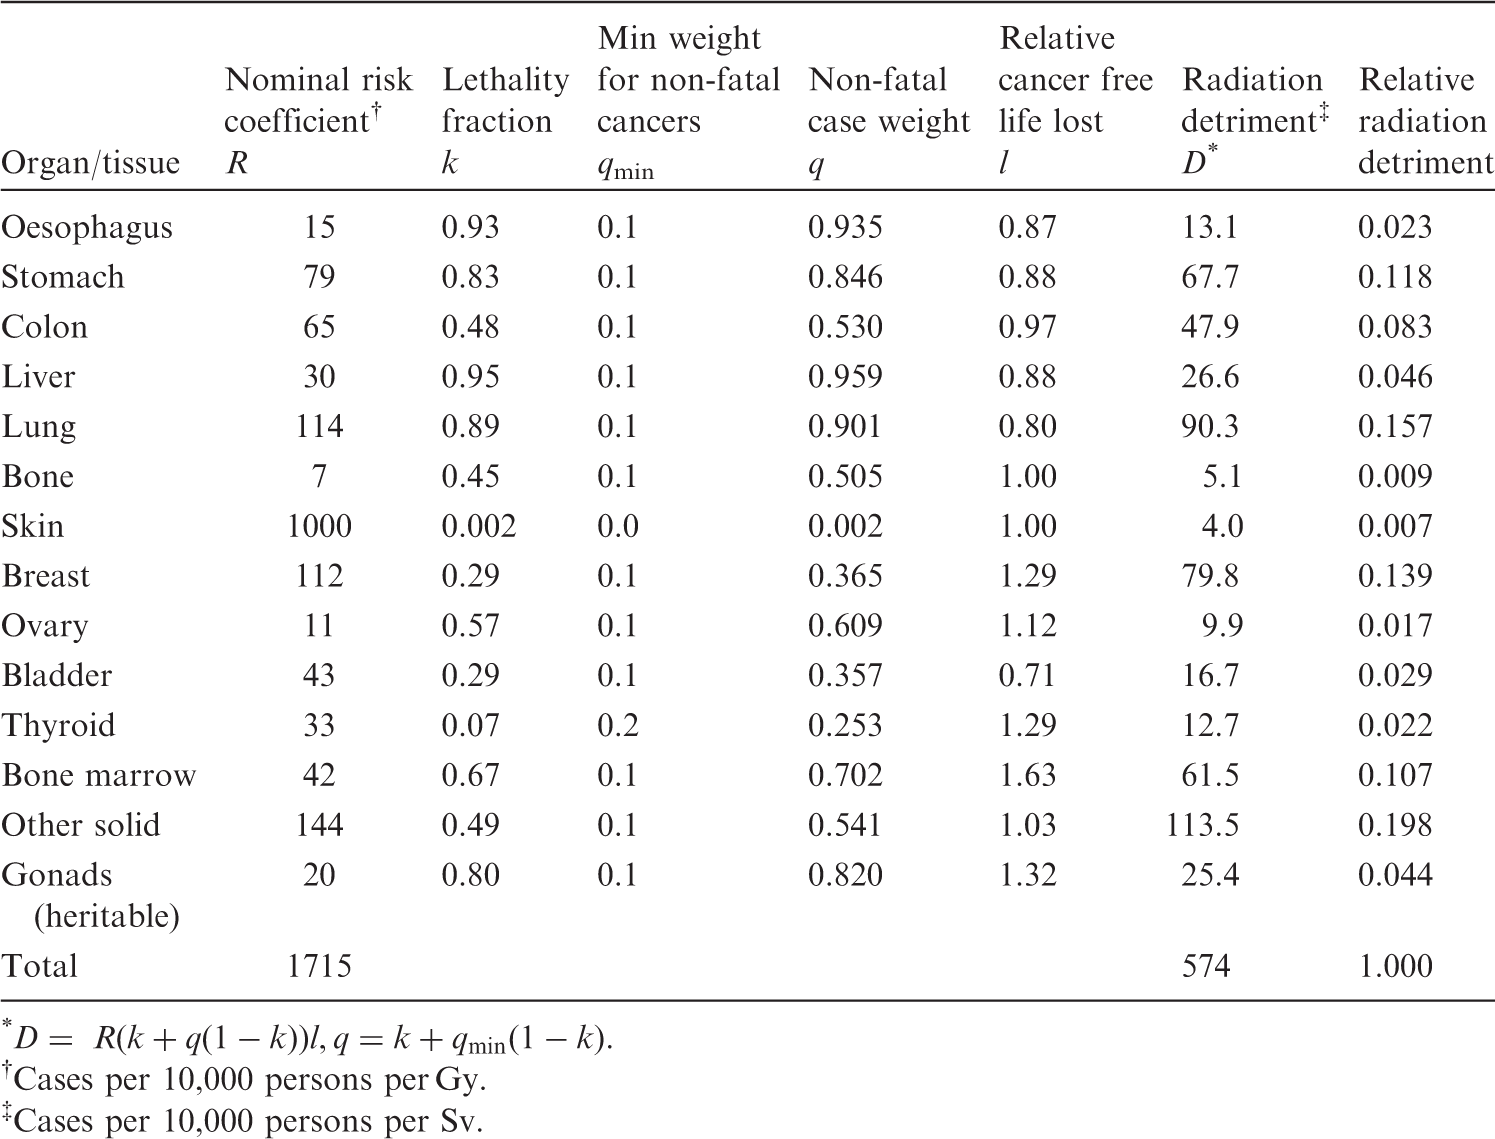
(74) Table 3.9 summarises the parameters for severity adjustment by which nominal risk was converted into radiation detriment. Construction of radiation detriment from nominal risk coefficients for the whole population
(ICRP, 2007). * Cases per 10,000 persons per Gy. Cases per 10,000 persons per Sv.
3.2.1. Adjustment for lethality
(75) Since the nominal risk coefficient was calculated based on excess incidence, the lethality fraction (k) was applied to take account of cancer severity. (76) Lethality fractions were derived as judgement-based values reflecting the impact of medical treatment for some types of cancer. In Publication 60 (ICRP, 1991), the choice of values was based on the analysis of two sets of data from the US SEER Program: 5-year survival rates by cancer site for 1980–1985, and 20-year survival rates for 1950–1970 (US DHHS, 1989). They were updated in Publication 103 (ICRP, 2007), but remained close to the previous values for most organs and tissues. The same set of values was applied to males and females. (77) The lethality adjustment was performed by multiplying the nominal risk coefficient R by the factor k. In this manner, highly lethal cancers received a relatively greater weight (e.g. 0.95 for liver cancer, 0.89 for lung cancer) than those that seldom cause death (e.g. 0.002 for skin cancer, 0.07 for thyroid cancer) (Table 3.9).
3.2.2. Adjustment for quality of life
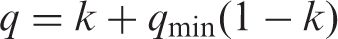
(78) Cancer survivors generally experience adverse effects on their QOL. Thus, the Commission judged that cancers should be weighted not only for lethality but also for pain, suffering, and any adverse effects of cancer treatment. To achieve this, a factor termed qmin was applied to the non-lethal fractions of cancers to produce a QOL factor termed q. It is expressed in a formula: (79) qmin is a judgement-based parameter. The value of qmin was set equal to 0.1 except for skin and thyroid cancers. The qmin adjustment has an impact upon radiation detriment calculations in proportion to the fraction of cancers that are non-lethal. Accordingly, highly lethal cancers, such as lung and stomach cancers, are little affected by qmin compared with less lethal cancers, such as breast or thyroid cancers. (80) No qmin adjustment was used for skin cancer because radiogenic skin cancers (i.e. non-melanoma skin cancers) are almost exclusively of the basal cell type, which is usually associated with very little pain, suffering, or treatment sequelae. For thyroid cancer, qmin was set to 0.2.
3.2.3. Adjustment for years of life lost
(81) As the age distribution of patients differs by cancer sites, the average ages of onset were estimated for several primary sites from national cancer data and converted to average YLL when a cancer occurs. They were computed for each sex in each composite population as the weighted average over ages at exposure and subsequent attained ages of the residual lifetime. The number of years was converted to relative values (factor l) by division by the average YLL for all cancers. The factor l reflects the relative years of cancer-free life lost, with values of <1 for cancers occurring late in life (e.g. 0.71 for bladder cancer, 0.80 for lung cancer) and >1 for cancers occurring early in life (e.g. 1.63 for bone marrow cancer, 1.29 for thyroid and breast cancers). (82) The YLL for bone and skin cancers cannot be obtained in the same way, and therefore were arbitrarily set at the average YLL for all cancers. The value of l was therefore equal to 1 for these two cancer sites.
3.2.4. Calculation of radiation detriment
(83) As shown in Table 3.9, radiation detriment (D) for each organ or tissue was calculated by applying the above-mentioned factors to the nominal risk coefficient (R). It is expressed in the formula: (84) The overall radiation detriment was calculated as an unweighted sum of the 14 tissue-specific detriments. The result is shown in terms of the number of cases per 10,000 persons per Sv. It does not represent the real number, but represents a theoretical estimate of the weighted number of excess cases per unit dose of radiation. ‘Sv’ is used to express the radiation dose as radiation detriment is intended for the purpose of radiological protection at low doses and low dose rates.

3.3. Determination of tissue weighting factors
(85) The relative radiation detriments for the whole population, which are the normalised radiation detriments of respective organs/tissues so that they sum to unity, form the basis of the tissue weighting factor, wT, used for the calculation of effective dose (ICRP, 2007, 2021). Since the detailed relative radiation detriments in Table 3.9 were imprecise because of uncertainties associated with their estimation, they were grouped into four categories broadly reflecting the relative detriments. On this basis, plus the judgements summarised below, the Commission has defined a single set of wT values that is applied to both sexes and all ages (Table 3.10). (86) For the organs or tissues with the highest radiation detriments (lung, breast, stomach, bone marrow, colon, remainder tissues), wT was set to 0.12. The gonads were assigned a wT of 0.08 based on the relative detriments for heritable effects and ovarian cancer. For the organs with intermediate radiation detriments (bladder, oesophagus, liver, thyroid), wT was set to 0.04. In particular, the wT value for the thyroid was set to 0.04 to take into account the concentration of cancer risk in childhood (i.e. young children are considered to be a particularly sensitive subgroup for thyroid cancer). For the organs with the lowest radiation detriments (skin, bone), wT was set to 0.01. (87) The risks of cancer in salivary glands and brain, whilst not specifically quantifiable, were judged to be greater than that of any other remaining tissue. For this reason, they were treated separately from the remainder category, each being assigned a wT of 0.01. (88) The remaining value (0.12) was assigned to ‘remainder tissues’ to make the sum of wT equal to unity. This category was included to account for radiation detriments to organs or tissues for which detailed radiation risk calculations were uninformative. The ‘remainder tissues’ consist of 14 organs and tissues, among which prostate and uterus/cervix are sex-specific. The wT value of 0.12 is equally distributed between the 13 organs and tissues for each sex.
4. SENSITIVITY OF RADIATION DETRIMENT CALCULATION
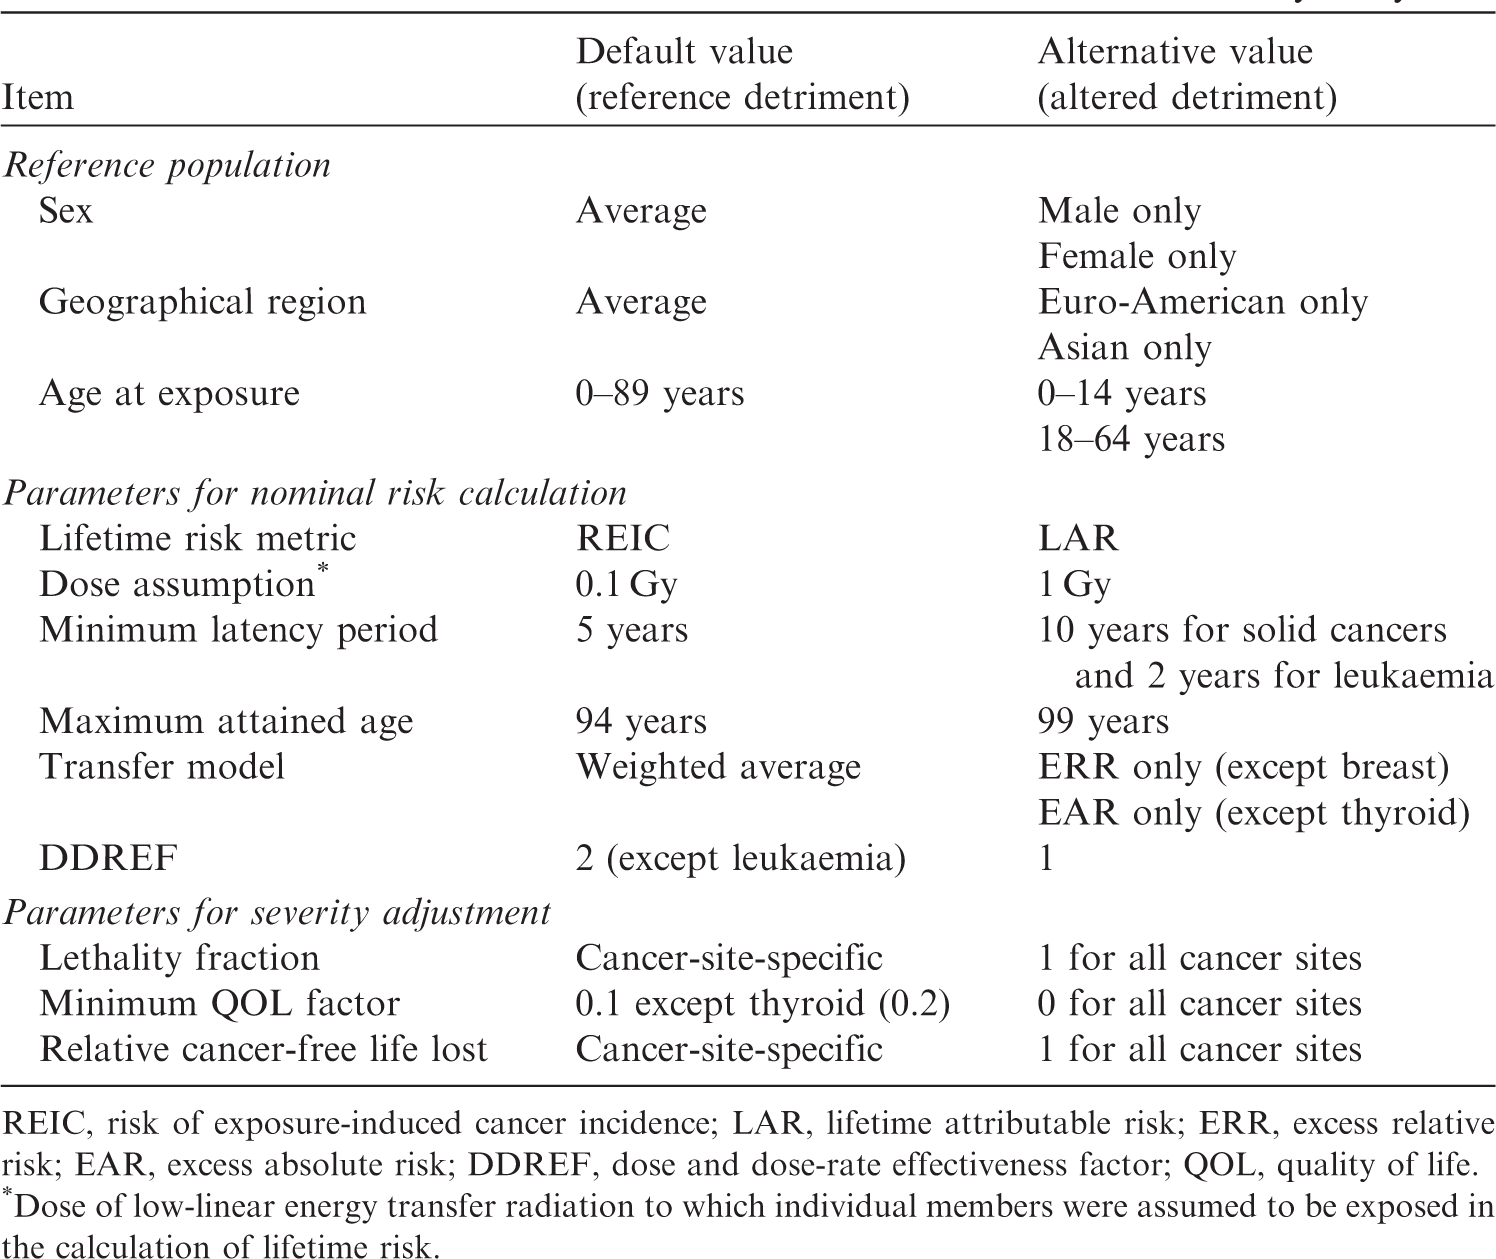
(89) Many parameters are involved in the calculation of radiation detriment from cancers, and the variation in the values adopted for these parameters can have effects on the result, which eventually would have implications for radiological protection practice. In order to examine the effects of these variations, a selected sensitivity analysis was conducted by assigning alternative values to the parameters. The analysis focuses on cancers listed in Table 3.6. Bone and skin cancers were excluded because the risk of these cancers was estimated differently (see Section 3.1.2), and the same level of analysis was not applicable. (90) In the selected sensitivity analysis, the calculation methodology described in Section 3 was used, but the parameters were altered as listed in Table 4.1. Alternative values or conditions were applied one at a time to examine the impact of each parameter on radiation detriment. (91) The impact of the parameters was evaluated based on the ratio of the altered detriment (calculated with an alternative setting) to the reference detriment (calculated with the default setting), and classified according to the following criteria: minimal impact: a factor change of <1.5 (ratio in the range of 1/1.5–1.5); moderate impact: a factor change of ≥1.5 and <2 (ratio in the range of 1/2–1/1.5 or 1.5–2) for some organs or tissues; and substantial impact: a factor change of ≥2 (ratio ≤1/2 or ≥2) for some organs or tissues. Parameter values and calculation conditions in the selected sensitivity analysis. REIC, risk of exposure-induced cancer incidence; LAR, lifetime attributable risk; ERR, excess relative risk; EAR, excess absolute risk; DDREF, dose and dose-rate effectiveness factor; QOL, quality of life. *Dose of low-linear energy transfer radiation to which individual members were assumed to be exposed in the calculation of lifetime risk.
4.1. Reference population
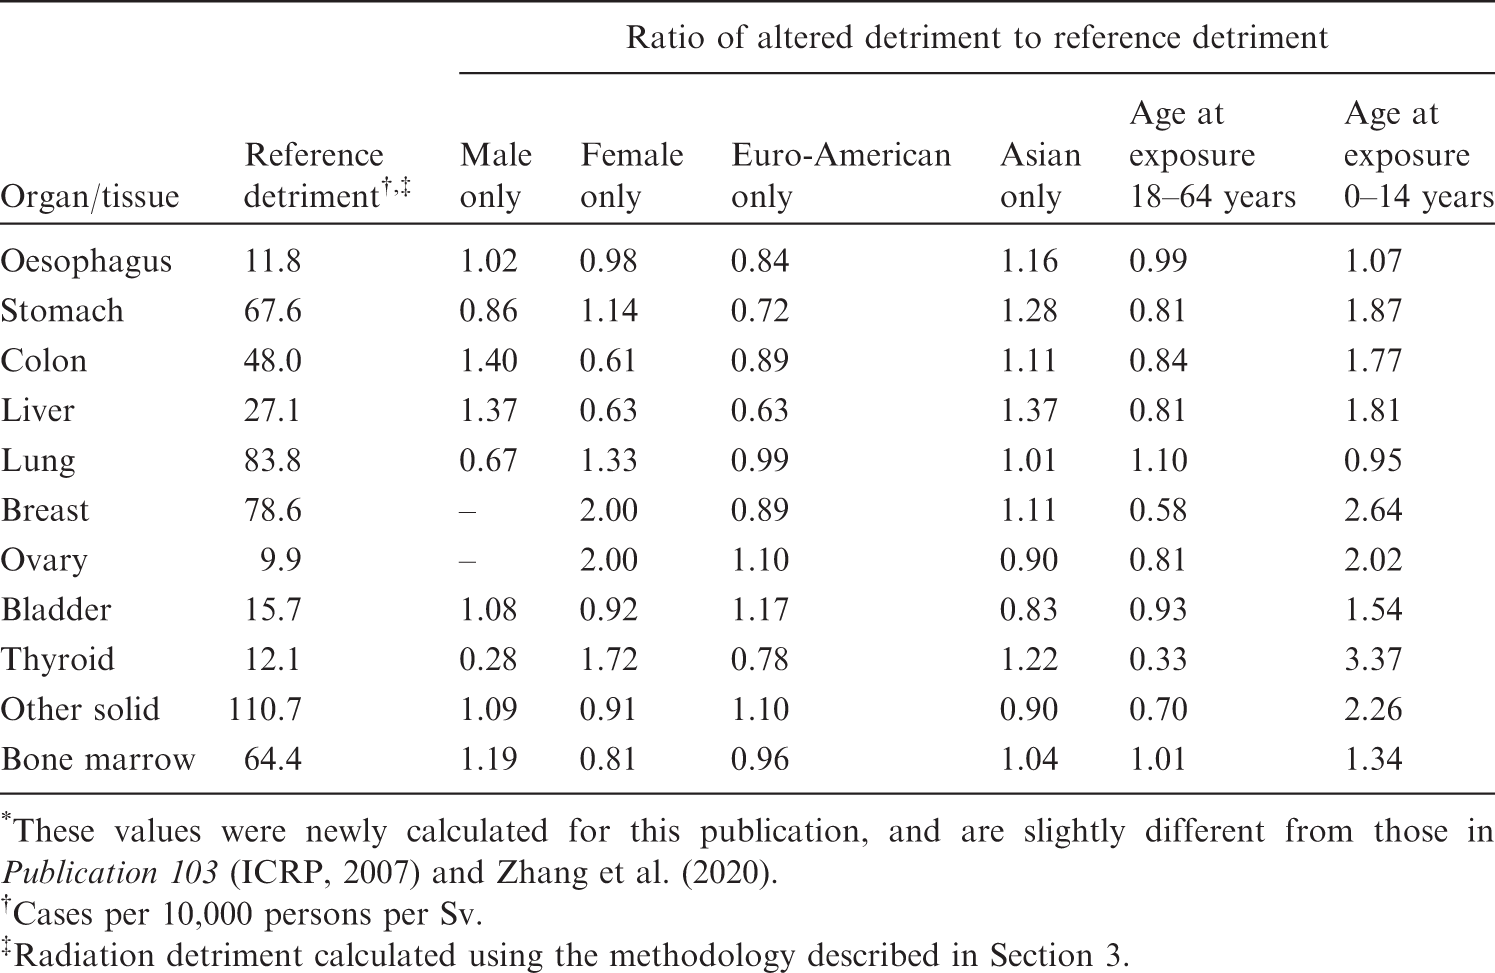
(92) Radiation detriment was averaged over sexes and two composite populations which were derived from four Asian and three Euro-American populations in Publication 103 (ICRP, 2007). This methodology was applied to all cancer sites despite the fact that some cancer incidences are highly variable between populations and some cancers are sex-specific, such as ovarian cancer and female breast cancer. Fig. 4.1 shows radiation detriment calculated separately for each sex, and Fig. 4.2 shows radiation detriment calculated separately for the Euro-American and Asian populations. Aside from female-specific cancer sites, a marked sex difference is found for colon, liver, lung, and thyroid cancers. Stomach and liver cancers show a noticeable population difference, demonstrating higher detriment in the Asian population than in the Euro-American population. For breast and ovarian cancers, the difference in radiation detriment between the populations is relatively small. (93) Nominal risk was averaged over age at exposure 0–89 years in Publication 103 (ICRP, 2007). Fig. 4.3 shows radiation detriment for three different age at exposure categories: 0–14 years, 18–64 years, and 0–89 years, representing the young population, working-age population, and whole population, respectively. Although age at exposure also influences life lost, relative years of cancer-free life lost for the whole population were applied to all three groups in order to highlight the changes in nominal risk. For most organs and tissues, detriment for the population aged 0–14 years at exposure is higher than that for the whole population (aged 0–89 years at exposure). In some tissues (i.e. stomach, breast, thyroid, and other solid cancers), detriment for the population aged 0–14 years at exposure is more than 2-fold higher than that for the whole population (aged 0–89 years at exposure). (94) The effects of changing population setting on the values of radiation detriment are summarised in Table 4.2. The second column of this table shows the reference detriment: radiation detriment that was calculated using the methodology described in Section 3. In other columns, the results of calculations with the modified settings are shown as values relative to the reference detriment. Overall, the increase in radiation detriment for the population aged 0–14 years at exposure is remarkable. It should be noted that the detriment value for breast cancer is higher for the Asian population, although the baseline rate is higher in Euro-American females than in Asian females. This is because the EAR model produces the same excess risk for both populations, but the survival probability decreases more slowly in the Asian population between ages of 50 and 75 years, as illustrated in Fig. 3.4. Effects of alternative reference populations on the values of radiation detriment
*
. *These values were newly calculated for this publication, and are slightly different from those in Publication 103 (ICRP, 2007) and Zhang et al. (2020). Cases per 10,000 persons per Sv. Radiation detriment calculated using the methodology described in Section 3. Comparison of radiation detriments calculated for different age at exposure categories. Reference detriment is based on the whole population (aged 0–89 years at exposure). Comparison of radiation detriments between Euro-American population, Asian population, and the average for both populations. Reference detriment is the average for both populations. Comparison of radiation detriments between males, females, and the average for both sexes. Reference detriment is the average for both sexes.
4.2. Parameters for nominal risk calculation
(95) Nominal risk is calculated based on REIC at 0.1 Gy and multiplied by 10 (see Section 3.1.3.3). REIC takes into account the decrease in cancer-free survival due to the extra cancer incidence caused by radiation exposure, while LAR uses the normal cancer-free survival curve (Thomas et al., 1992). Fig. 4.4 compares radiation detriments calculated with these two lifetime risk metrics, showing that the use of LAR instead of REIC gives a similar result. This is because a single exposure to 0.1 Gy does not cause a significant change to the survival curve. Consequently, lifetime risk expressed as REIC per Gy in Publication 103 (ICRP, 2007) is almost equivalent to LAR at 1 Gy for solid cancers (Zhang et al., 2020). (96) At higher doses, REIC per unit dose decreases as the exposure-induced change in cancer-free survival becomes noticeable. This is demonstrated by Fig. 4.5, in which radiation detriment based on REIC at 1 Gy is significantly lower than the reference detriment for solid cancers, with a difference of up to 21%. For leukaemia, on the other hand, detriment based on REIC at 1 Gy is approximately 2.5 times higher than the reference detriment. This is due to the effect of the quadratic term in the dose–response model for leukaemia, which is negligible at 0.1 Gy. (97) There is a minimum length of time between exposure and subsequent development of cancer. This latent period is expected to differ with cancer site, but information is limited to only a few types of cancer. There are uncertainties associated with this parameter as it can depend on the diagnostic techniques available, and power to detect an increase in epidemiological studies. The minimum latency period is considered to be 5–10 years for solid cancers and 2–5 years for leukaemia. Fig. 4.6 compares radiation detriments using different minimum latency periods. The minimum latencies of 5 and 10 years produce little difference for solid cancers, but detriment for leukaemia can increase by 48% if the latency decreases from 5 years to 2 years. (98) As life expectancy increases, the period for cumulating radiation risk also increases, and this results in additional cases of radiation-associated cancer. In Fig. 4.7, the maximum attained age was set at 99 years instead of 94 years to examine its impact. The increase in radiation detriment is only 1–2% with the maximum attained age of 99 years for all cancer sites. (99) In Publication 103 (ICRP, 2007), nominal risk was calculated as weighted averages of the ERR and EAR lifetime risk estimates, with ERR:EAR weights of 100%:0% for thyroid cancer, 0%:100% for breast cancer, 30%:70% for lung cancer, and 50%:50% for other solid cancer sites and leukaemia (Table 3.1). This weighting scheme was introduced to provide a reasonable basis for transferring risk estimates across populations with different cancer baseline rates. It implies that the resultant value is sensitive to the ERR:EAR weight in the case where the risk estimates from the two models differ significantly. Fig. 4.8 compares radiation detriment values calculated using the 100% ERR model, the 100% EAR model, and the method described in Publication 103 (weighted average). A relatively large difference is observed for stomach cancer and lung cancer. (100) Nominal risk for solid cancers is divided by a DDREF of 2 to take into account the possible effects of low-dose and low-dose-rate exposures. However, the choice of DDREF value has been a topic of discussion in recent years within the radiological protection community (Rühm et al., 2015, 2016; Shore et al., 2017; Hoel, 2018; Wakeford et al., 2019). The National Academy of Sciences/National Research Council proposed a DDREF value of approximately 1.5 in BEIR VII (NAS/NRC, 2006), and some even consider that DDREF should not be used (SSK, 2014). Based on these discussions, radiation detriment has been calculated with a DDREF of 1 and 2, as presented in Fig. 4.9. As radiation detriment is inversely proportional to DDREF, changing its value from 2 to 1 results in an increase by a factor of 2 for solid cancers. There is no change for bone marrow cancer as DDREF is not applied to leukaemia. (101) Table 4.3 summarises the effects of alternative parameter values for the calculation of nominal risk that are illustrated in Figs 4.4–4.9. At a glance, changing DDREF from 2 to 1 appears to have a major effect, as it doubles the detriment for all solid cancers. For individual organs and tissues, the greatest effect is observed in bone marrow when REIC is calculated for exposure to 1 Gy. Effects of alternative parameter settings for the calculation of nominal risk on the values of radiation detriment
*
. *These values were newly calculated for this publication, and are slightly different from those in Publication 103 (ICRP, 2007) and Zhang et al. (2020). Cases per 10,000 persons per Sv. Radiation detriment calculated using the methodology described in Section 3. Comparison of radiation detriments calculated using different dose and dose-rate effectiveness factor (DDREF) values. Reference detriment is based on a DDREF of 2. Comparison of radiation detriments calculated using different risk transfer models. Reference detriment is based on weighted averages of the excess relative risk (ERR) and excess absolute risk (EAR) lifetime risk estimates (ERR:EAR weights of 100%:0% for thyroid cancer, 0%:100% for breast cancer, 30%:70% for lung cancer, and 50%:50% for other solid cancers and leukaemia). Comparison of radiation detriments calculated for different maximum attained ages. Reference detriment cumulates the risk up to 94 years of age. Comparison of radiation detriments calculated using different minimum latency periods. Reference detriment assumes minimum latency of 5 years for all cancer sites. Comparison of radiation detriments calculated with different dose assumptions. Reference detriment is based on risk of exposure-induced cancer incidence (REIC) at 0.1 Gy multiplied by 10. Comparison of radiation detriments calculated using different lifetime risk metrics. Reference detriment is based on risk of exposure-induced cancer incidence (REIC) at 0.1 Gy multiplied by 10. LAR, lifetime attributable risk.
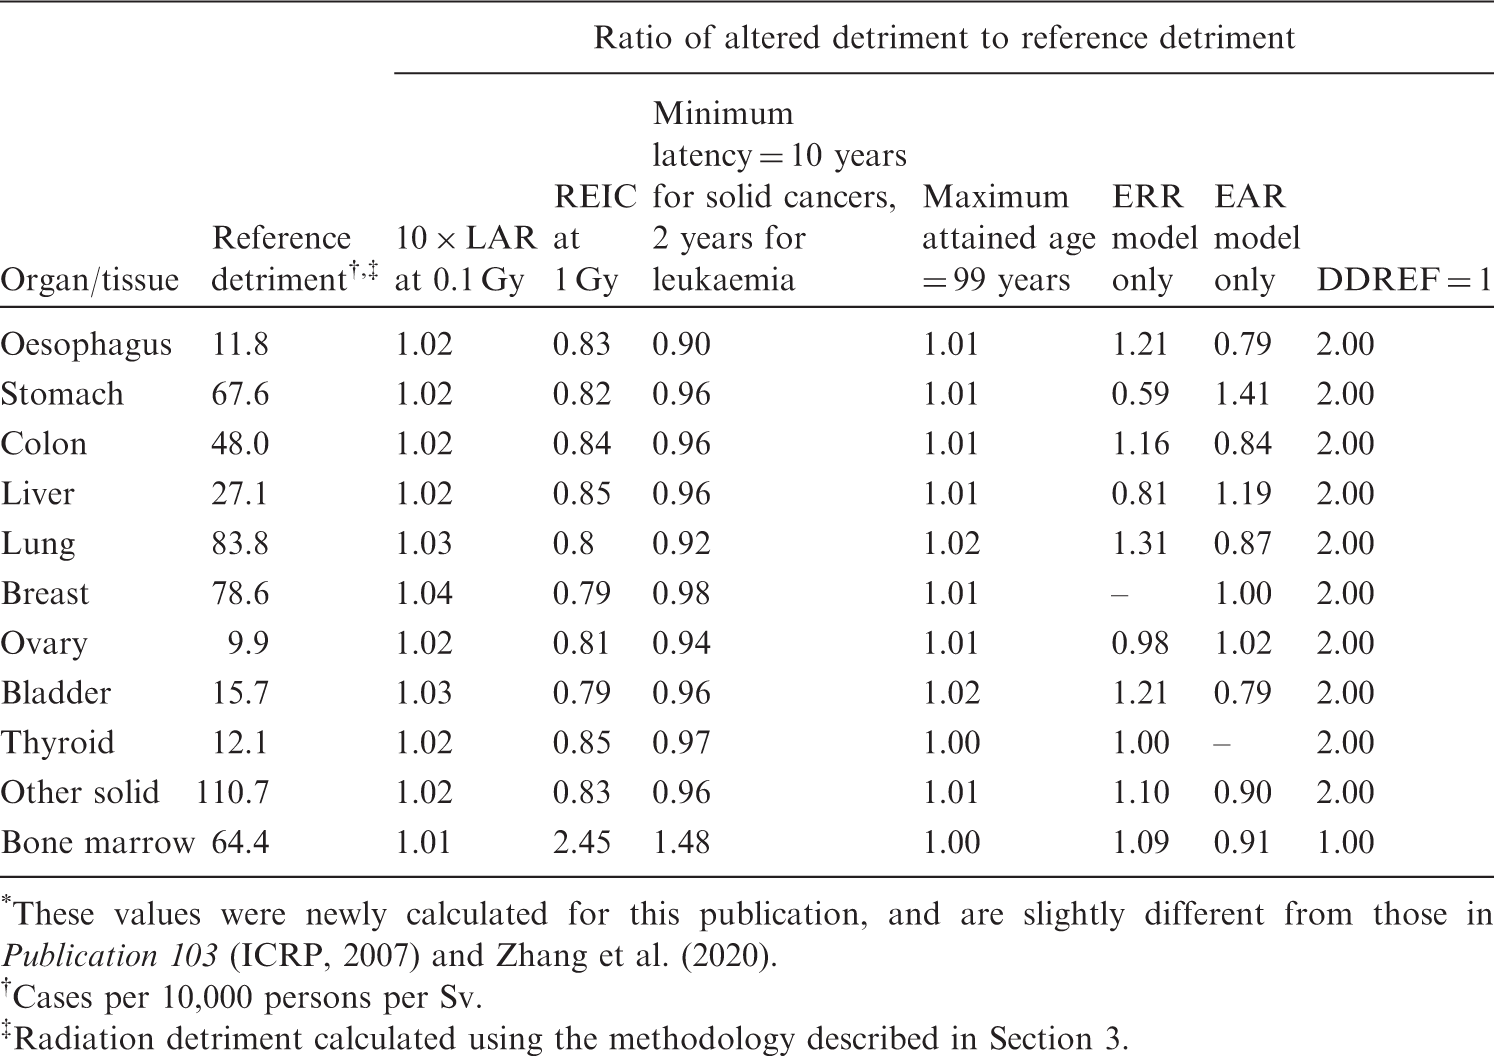
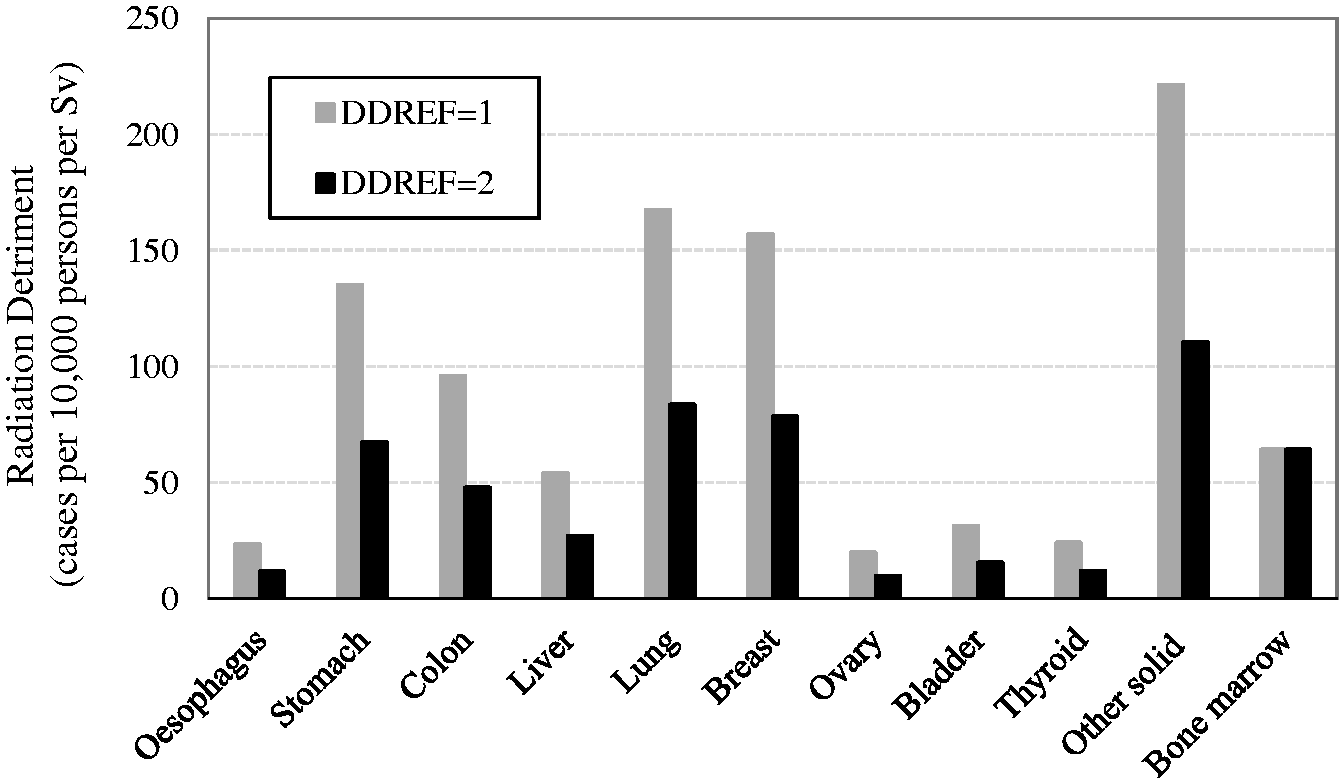
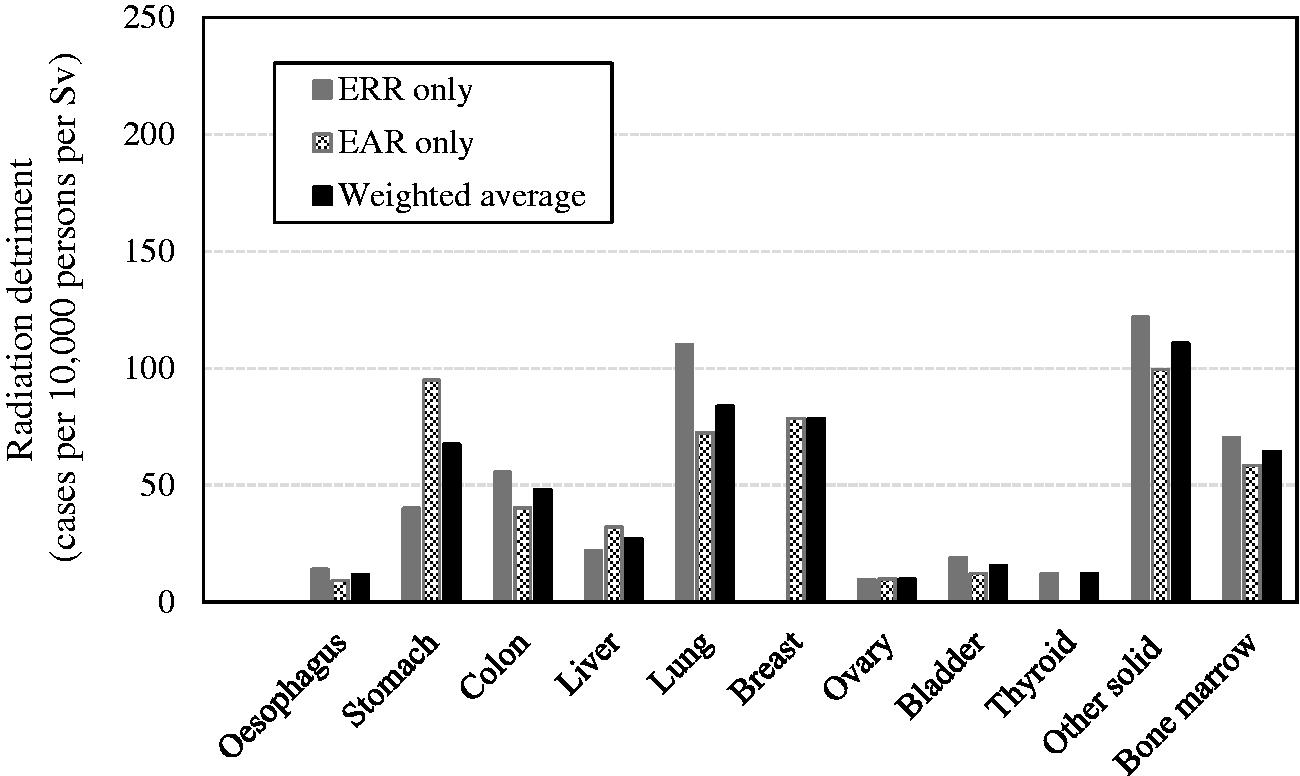
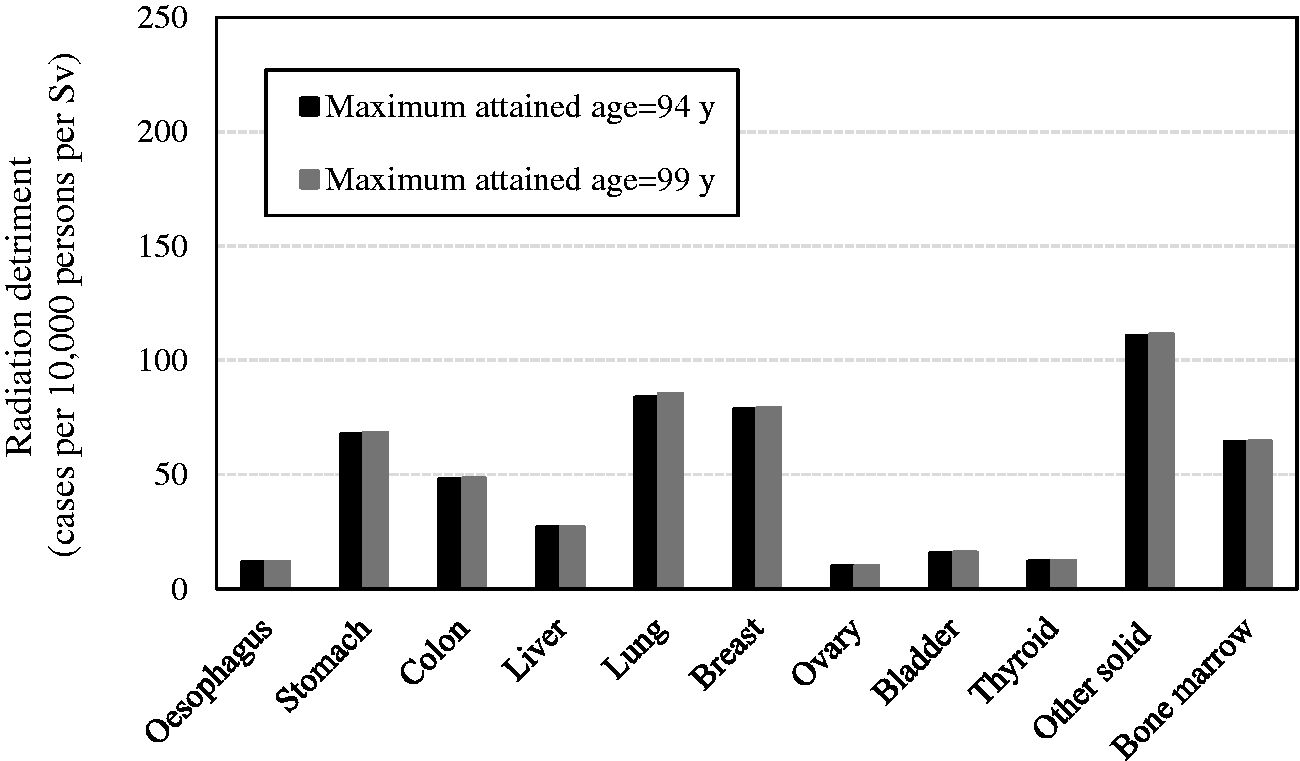
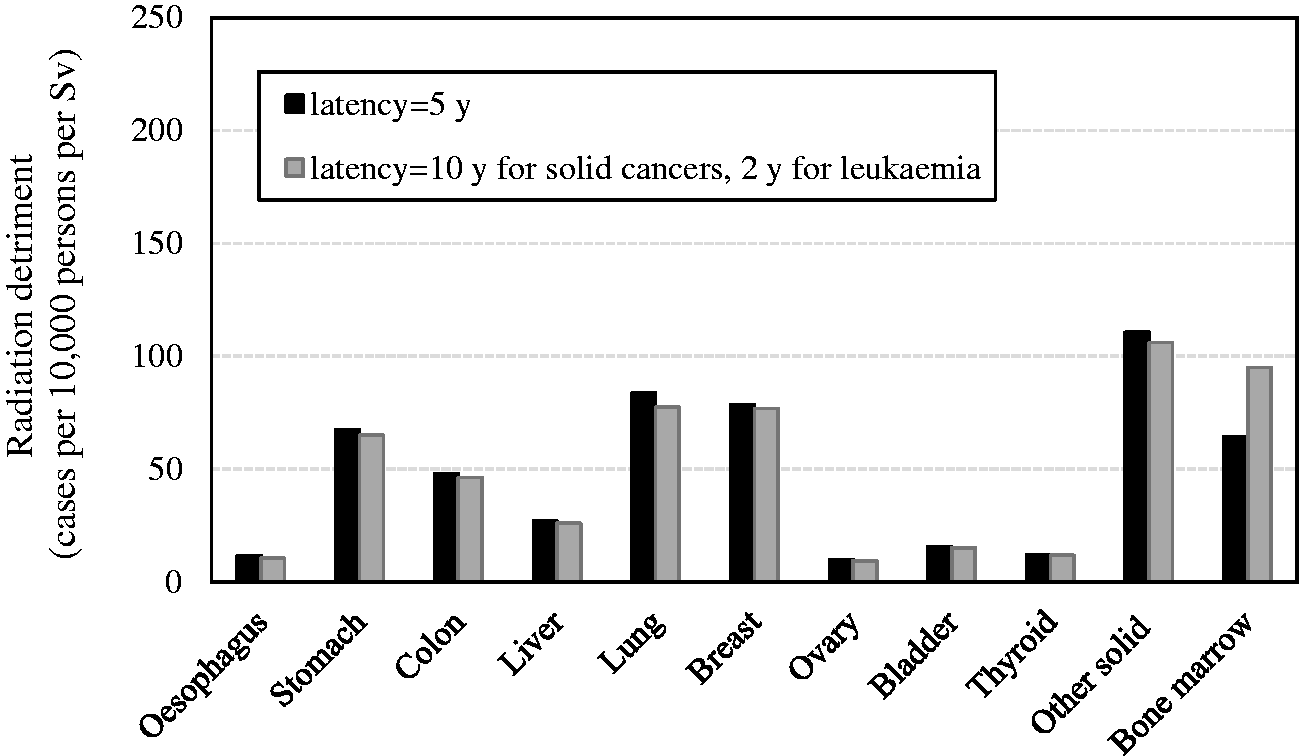
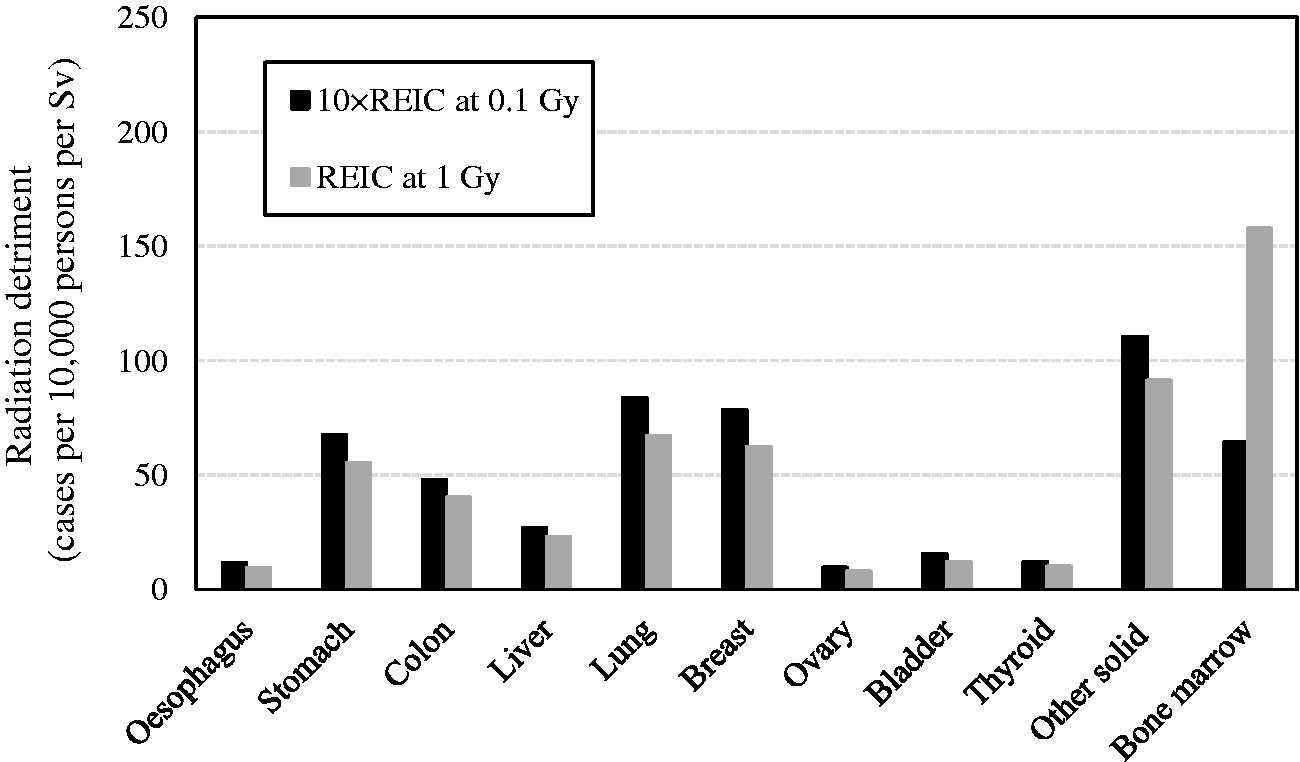
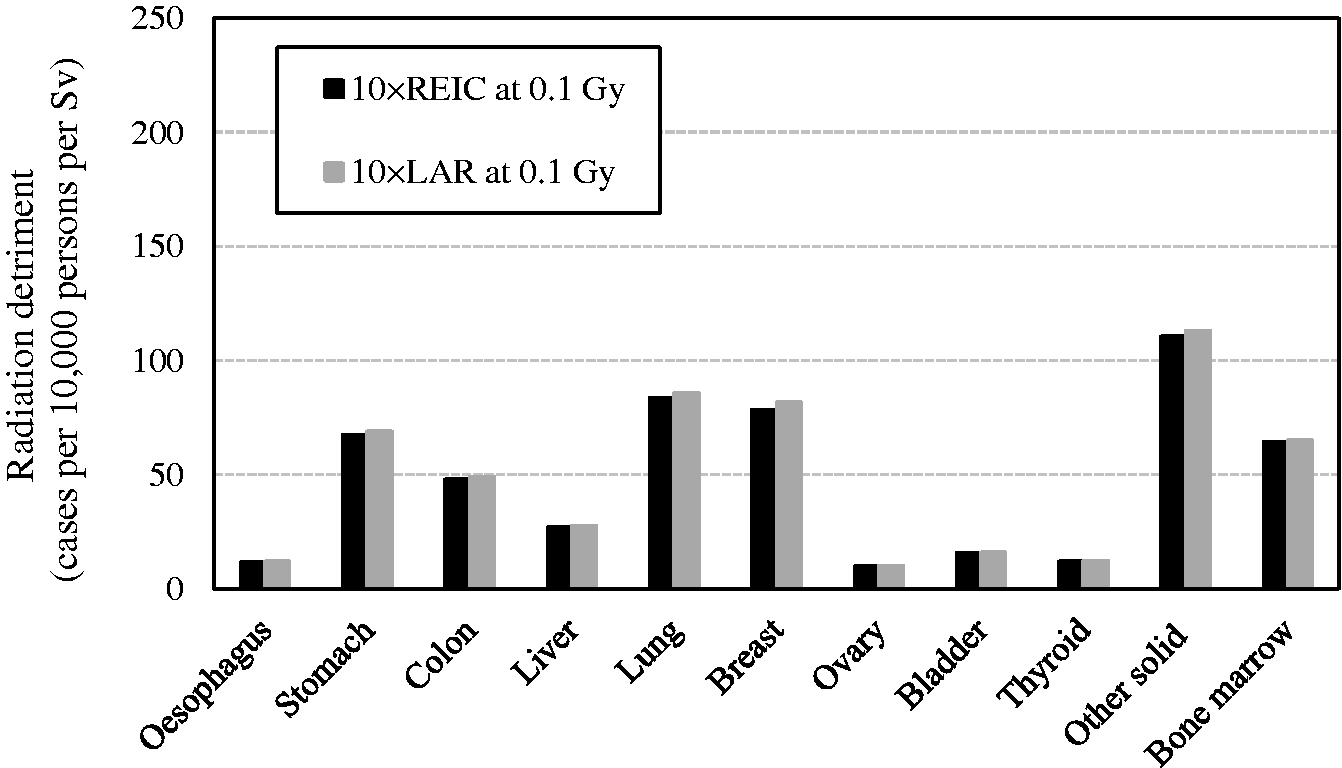
4.3. Parameters for severity adjustment
(102) While nominal risk estimates are a vital component of radiation detriment, the parameters for severity adjustment applied can also have an impact on the values of detriment. These include the lethality fraction (k), minimum QOL factor (qmin), and relative years of cancer-free life lost (l). The lethality fraction is used to compute the nominal risk of fatal cancers, and, at the same time, it serves as a parameter to adjust the QOL for non-fatal cancers. The parameter qmin represents the minimum weight due to pain, suffering, and any adverse effects of treatment that are commonly experienced by cancer survivors. According to the formulation in Section 3.2.2, the adjustment factor q increases with the values of k and qmin, both of which are expressed as a value between 0 and 1. Setting qmin at the maximum value (qmin = 1) produces the same effect as k = 1, demonstrating the worst level of QOL that is comparable to the loss of life (fatal cancers). In view of this relationship, the potential impact of these parameters has been tested for two extreme scenarios: k = 1 and qmin = 0, respectively. The values of relative cancer-free life lost vary between cancer sites, ranging from 0.71 to 1.63 as shown in Table 3.9. To illustrate the effect of changes in this parameter, a calculation was made by setting l at 1 for every cancer site. (103) Fig. 4.10 shows the comparison between reference detriment and detriments calculated with a lethality fraction of 1 (i.e. all cancers were assumed to be fatal). For colon, breast, bladder, thyroid, and other solid cancers, there is a noticeable increase in radiation detriment using a lethality fraction of 1 compared with detriment using the lethality data from Publication 103 (ICRP, 2007). (104) The Commission assigned qmin of 0.2 to thyroid cancer and 0.1 to cancers of other sites in Publication 103 (ICRP, 2007). Fig. 4.11 shows the comparison between the use of these values and qmin of zero, showing that the differences in radiation detriment are small for most organs and tissues, except for thyroid cancer, for which qmin of zero results in >50% decrease in detriment. (105) Fig. 4.12 shows the comparison between reference detriment and detriments calculated with relative cancer-free life lost set uniformly at 1. While its impact varies between organs and tissues, the increase is noticeable for stomach, lung, and bladder cancers, and the decrease is noticeable for breast and bone marrow cancers. (106) Table 4.4 summarises the effects of varying parameters for severity adjustment in the calculation of radiation detriment. The most notable is the impact on thyroid cancer, showing a >3-fold increase with a lethality fraction of 1 and a >2-fold decrease with the minimum QOL factor of zero. Regarding the relative cancer-free life lost, values in the rightmost column of Table 4.4 represent the reciprocal of this adjustment factor for each organ or tissue in Publication 103 (ICRP, 2007). There is an increase or decrease of up to approximately 40%, demonstrating a relatively large impact for cancers of early or late onset. (107) With improvements in diagnostic techniques and treatment, the cancer death rate has declined over recent decades. US cancer statistics (Siegel et al., 2021) show that the cancer death rate decreased by 31% between 1991 and 2018. The decline is pronounced in cancers with high lethality: in the case of lung cancer, the death rate decreased by 54% in men from 1990 to 2016, and by 30% in women from 2002 to 2018. The situation may lead to a considerable change in the parameters for severity adjustment, particularly the lethality fraction values. This trend should be taken into consideration in the future. A more detailed discussion about this issue can be found in Breckow et al. (2018) and Zhang et al. (2020). Effects of alternative parameter settings for severity adjustment on the values of radiation detriment
*
. QOL, quality of life. *These values were newly calculated for this publication, and are slightly different from those in Publication 103 (ICRP, 2007) and Zhang et al. (2020). Cases per 10,000 persons per Sv. Radiation detriment calculated using the methodology described in Section 3. Comparison of reference detriment with detriments calculated with relative cancer-free life lost (l) set uniformly at 1. Reference detriment uses cancer-site-specific values of relative cancer-free life lost that vary between 0.71 for bladder cancer and 1.29 for thyroid cancer. Comparison of reference detriment with detriments calculated using minimum quality-of-life factor (qmin) set uniformly at zero. Reference detriment assumes qmin of 0.2 for thyroid cancer and 0.1 for other cancer sites.
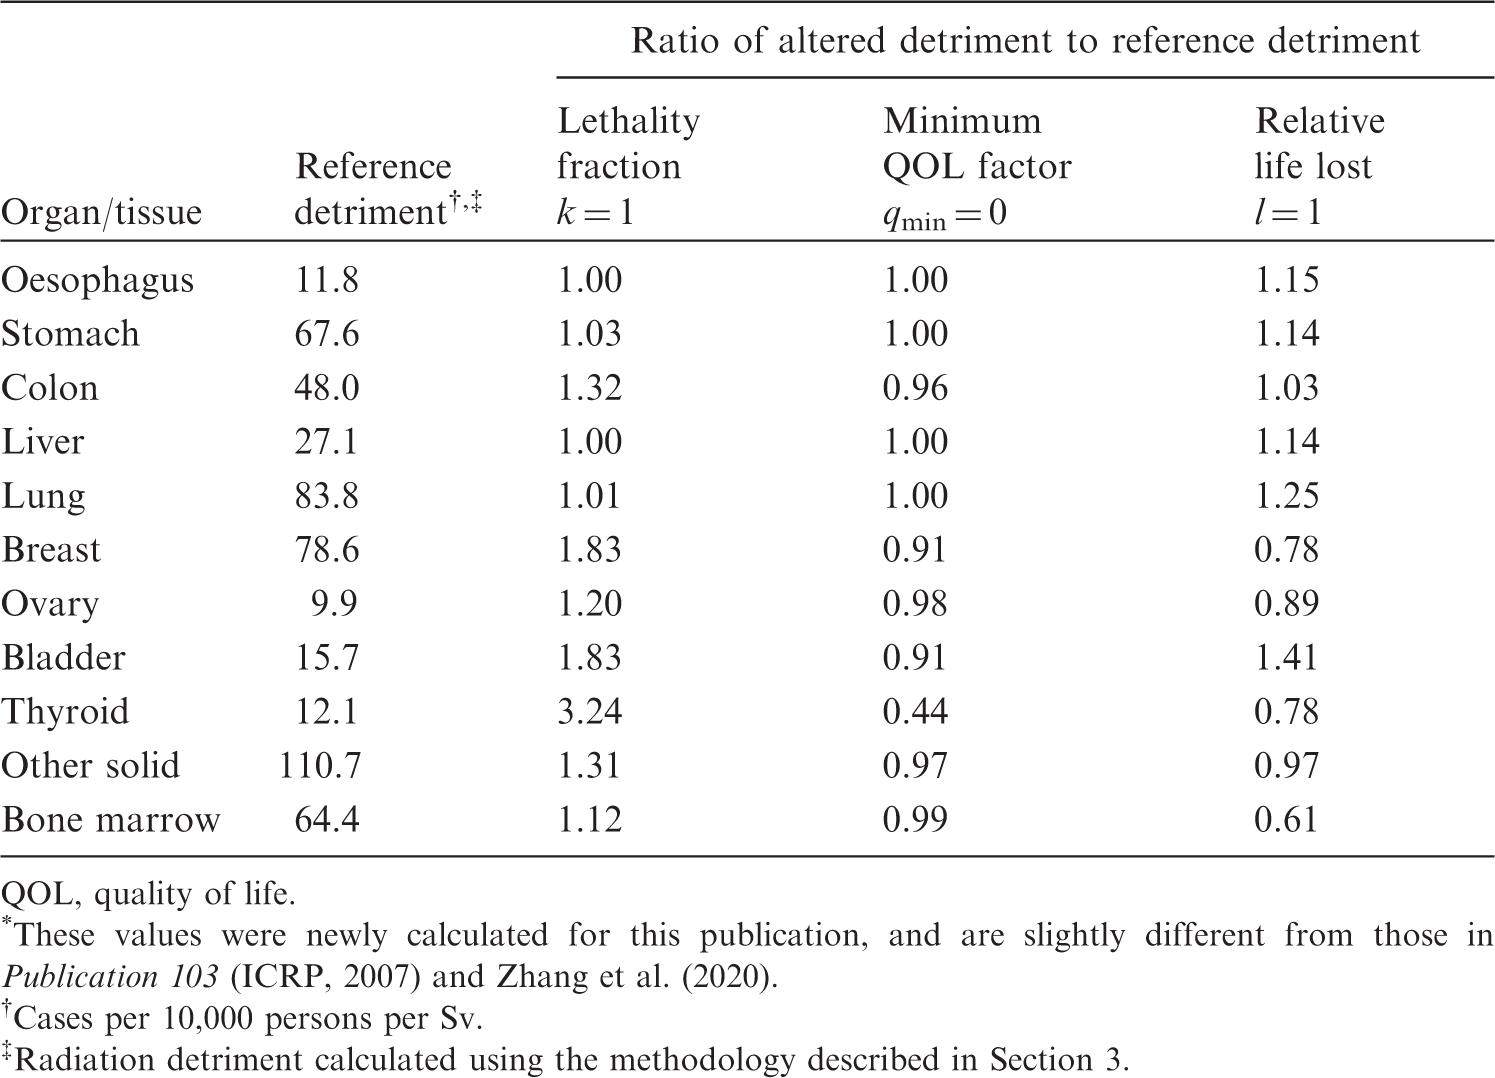
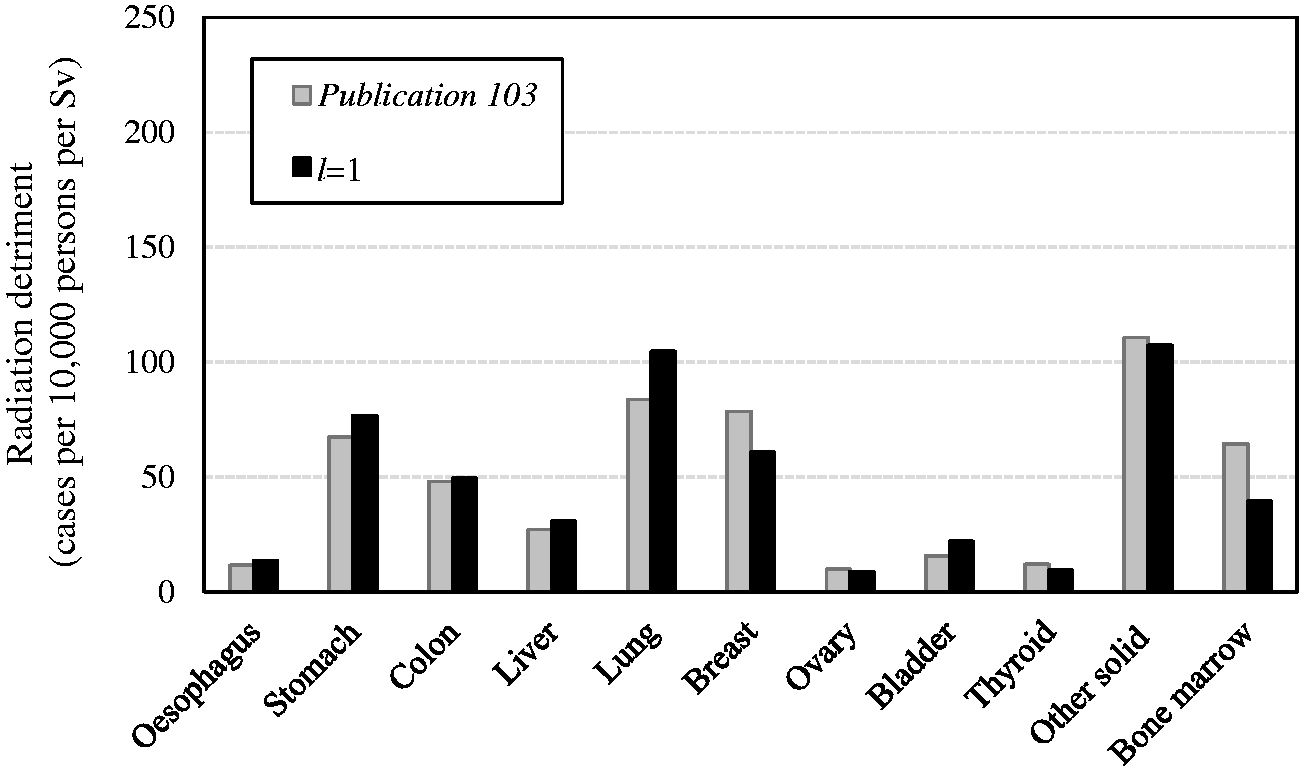
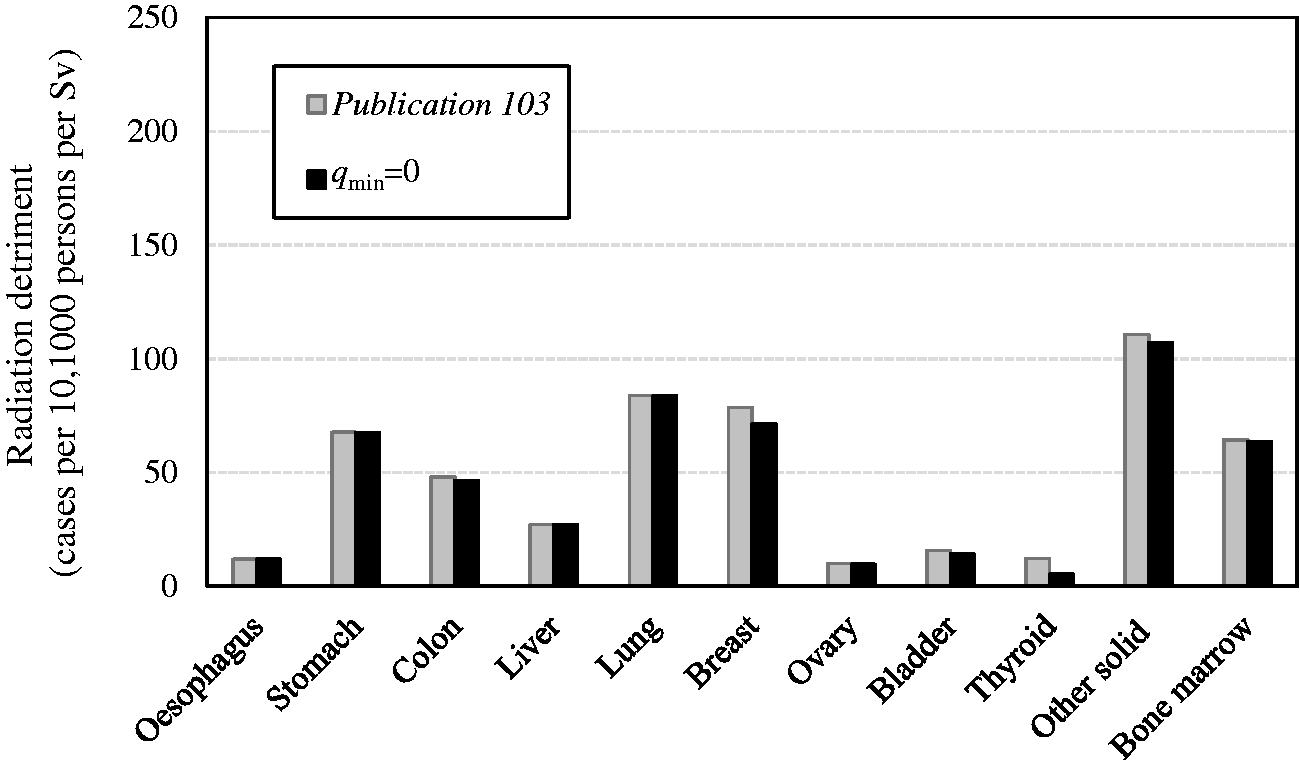
4.4. Summary of selected sensitivity analysis
(108) Based on the results presented above, the parameters have been classified into three categories according to the criteria described in Para. 89. (109) Parameters of minimal impact are lifetime risk metric, minimum latency period, maximum attained age, and minimum QOL factor. Altering these parameters resulted in changes in radiation detriment by a factor of <1.5. An exception is the minimum QOL factor for thyroid cancer, but this has little influence on overall detriment. (110) Parameters of moderate impact are geographical region (geographical coverage of the reference population), transfer model, and relative years of cancer-free life lost. Altering these parameters showed changes in radiation detriment by a factor of ≥1.5 and <2 for some organs or tissues. To transfer radiation risk from one population to another, both additive and multiplicative projections are plausible in terms of biological mechanism. Nevertheless, for most cancer sites, the best way to transfer estimates of risk from radiation exposure between populations remains unknown (UNSCEAR, 2012). The choice of transfer model is particularly important for cancers with varying baseline risks between populations. In this regard, there is a significant difference in baseline rates between Asian and Euro-American populations for female breast, stomach, and liver cancers. Depending on the combination of transfer model and population, radiation detriment can vary considerably for these cancers. (111) Parameters of substantial impact are sex, age at exposure, DDREF, dose assumption, and lethality fraction. Varying these parameters demonstrated changes in radiation detriment by a factor of ≥2 for some organs and tissues. Assuming a female-only population doubles the radiation detriment for breast and ovarian cancers in comparison with sex-averaged detriment. Age at exposure is another influential factor: exposure of children at 0–14 years of age shows larger detriments, with >3-fold increase for the thyroid, 2.6-fold increase for the breast, and almost 2-fold increase for several organs. This is because children are generally more susceptible to radiation and have longer remaining life expectancy during which adverse health effects may develop. The choice of DDREF value has a direct impact, resulting in a 2-fold increase in detriment for solid cancers when it is set to 1 instead of 2. In a broad sense, the issue is not limited to the choice of DDREF value, but is related to the shape of the dose–response curve. UNSCEAR assumed an LQ dose–response relationship in estimating the risk of solid cancers instead of using the LNT model combined with DDREF (UNSCEAR, 2006). In that approach, however, dose assumption in the calculation of lifetime risk would be important because it was demonstrated that radiation detriment for bone marrow cancer based on REIC at 1 Gy was 2.5 times higher than the reference detriment due to the effect of the quadratic term of dose. Finally, the lethality fraction can have a large impact on radiation detriment. Increasing the lethality fraction to 1 results in a significant increase in detriment, mainly for relatively non-lethal cancers such as thyroid, bladder, and breast cancers. Conversely, the progress in diagnostic techniques and treatment should bring about a decrease in radiation detriment, and may lead to a significant decrease in the future. (112) There is growing interest in identification of the major sources of uncertainty in radiation risk assessment, and quantification of their impact (UNSCEAR, 2015, 2020). The sensitivity analysis presented here is not intended to be a comprehensive uncertainty assessment, but to be illustrative of the potential impact of the various factors involved in the calculation of radiation detriment. In this regard, it should be noted that the parameter settings were not necessarily realistic. For example, the lethality fraction and relative cancer-free life lost were set at 1, and the minimum QOL factor was set at 0, which oversimplifies the real-life scenarios. There are also factors that were not considered in the analysis, such as the change in baseline rates over time. An analysis of other parameter settings can be found in Zhang et al. (2020).
5. POTENTIAL EVOLUTION
(113) As described in Sections 2 and 3, the Commission has refined the methodology for calculating radiation detriment to incorporate the latest scientific findings and health statistics. Table 5.1 summarises the estimates and methodological features of radiation detriment adopted in the Commission’s General Recommendations. In Publication 26 (ICRP, 1977a), detriment was provided as a rough estimate of the likelihood of fatal cancers and serious hereditary abnormalities. Age and sex dependence of cancer risk, as well as the contribution of the non-fatal component, were taken into account in Publication 60 (ICRP, 1991). It should be noted that the substantial increase in the lifetime risk estimate of fatal cancer was due to the longer follow-up of the atomic bomb survivors and the adoption of the relative risk model. In Publication 103 (ICRP, 2007), incidence-based cancer risk models were introduced, and the basis of estimating the risk of heritable disease was revised based on updated knowledge of human genetic diseases and the process of germline mutagenesis. These modifications are considered reasonable, and changes in the estimated values reflect scientific understanding and data available at the time. (114) Despite efforts to assess the non-fatal component, fatal cancer risk accounts for a substantial fraction of radiation detriment (Breckow, 2020). This is because cancer constitutes a major part of stochastic effects, and the current scheme of severity adjustment relies mainly on the lethality fraction. However, the situation may change with advances in scientific understanding of radiation effects, progress in medical care, and lifestyle changes. Considering that the concept of detriment was introduced to assess the overall burden from radiation exposure, efforts to integrate different aspects of the health impact should be continued in the future. (115) Although the current scheme of radiation detriment calculation is carefully designed to achieve this aim, it needs to evolve according to advances in health care and scientific understanding of radiation health effects, as described above. Upcoming challenges include the revision of parameters and risk models to improve the quality of estimates, and better handling of the variation with sex and age, as well as the exposure scenario. Accumulation of scientific data of non-cancer effects, specifically diseases of the circulatory system (DCS) and cataracts, prompts consideration of whether to include them in the calculation. There is also scope for further improvement in transparency and comprehensibility. (116) This section discusses how these issues can be addressed. The aim is not to propose new numerical values or to make changes in the calculation methodology, but to identify possible ways of improvement. These discussions are expected to provide directions for future evolution of radiation detriment, which could be a crucial part in the development of the Commission’s General Recommendations. Radiation detriment in the Commission’s General Recommendations. *Ovarian cancer. Heritable effects. Values for the whole population.
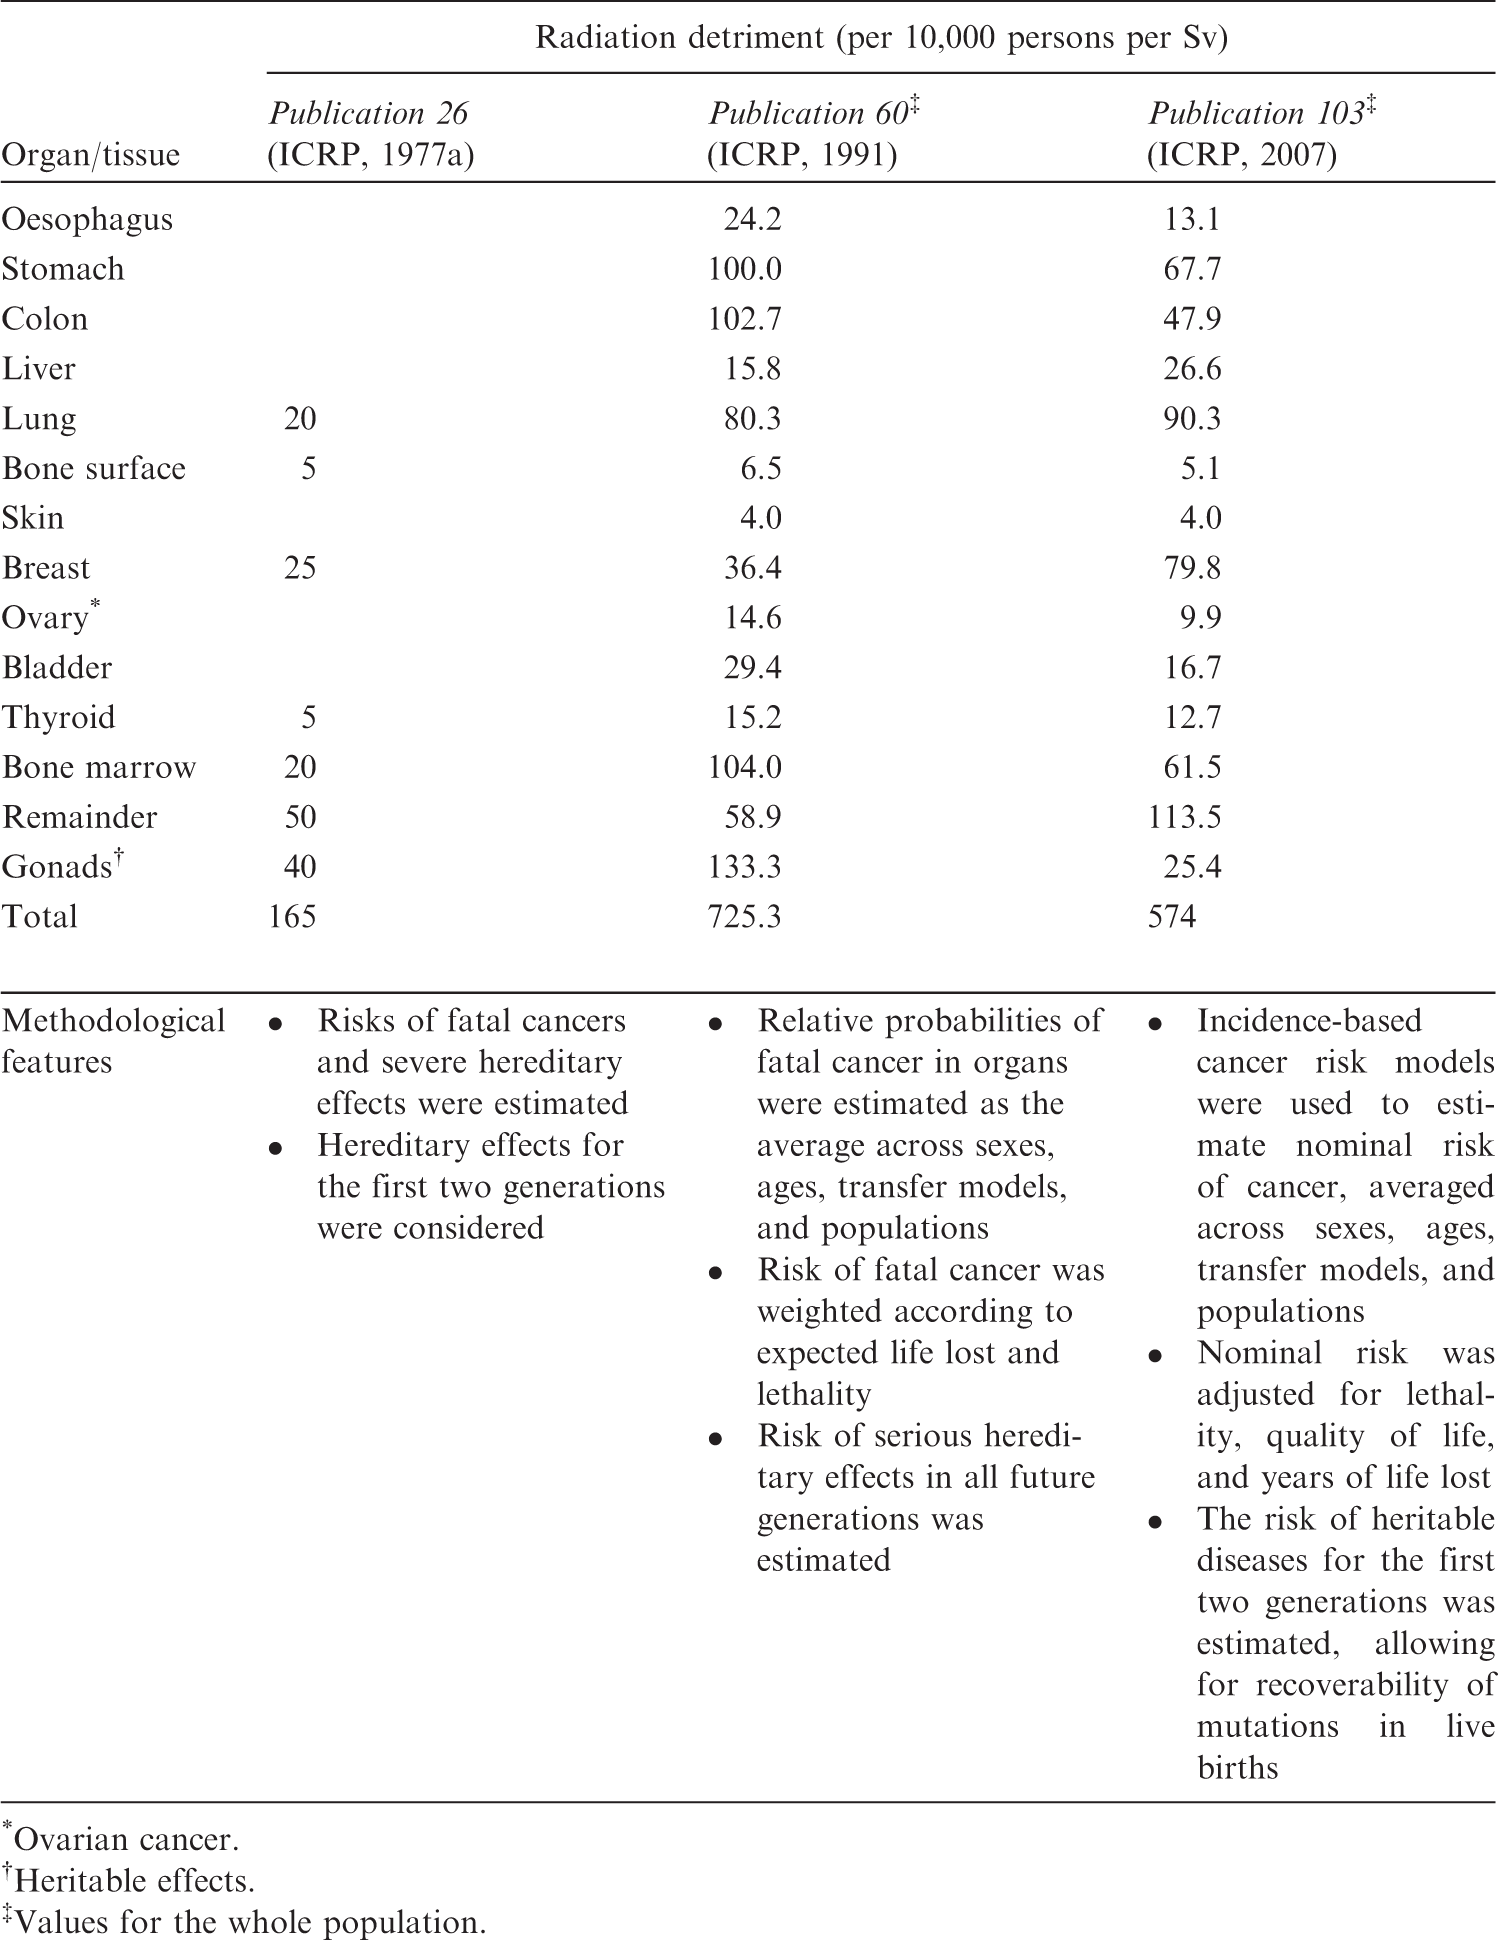
5.1. Revision of parameters and risk models
5.1.1. Reference population data
(117) Calculation of radiation detriment requires the use of reference population data for baseline cancer rates, mortality, and age and sex structures. • The baseline rates used in Publication 103 (ICRP, 2007) correspond to the period 1993–1997 (Parkin et al., 2002). Cancer incidence rates and mortality rates have changed significantly since then due to changes in lifestyle, advances in diagnostic methods, and improvement in cancer treatment, especially for certain cancers. Updating these reference rates will provide a more realistic basis for the System of Radiological Protection in the future (Breckow et al., 2018). Furthermore, no baseline rates were provided in Publication 103 for skin and bone cancers as the nominal risk estimates in previous publications were used for these cancer sites. • It should be noted that incidence and mortality rates vary considerably around the world, reflecting differences in genetics, lifestyles, and healthcare provision. In Publication 103 (ICRP, 2007), two composite reference populations were considered: Asian [composite rates from China (Shanghai), Japan (Osaka, Hiroshima, and Nagasaki)] and Euro-American (composite rates from Sweden, UK, and the SEER Program of the US National Cancer Institute). The inclusion of other geographical populations would provide a broader representation of the world population based on available data.
5.1.2. Cancer risk models
(118) Calculation of radiation detriment requires the use of models describing the relationship between the organ/tissue dose and cancer risk for specific cancer sites. The following points provide a summary of cancer risk models in Publication 103 (ICRP, 2007) and possible ways of updating them. • Radiation-associated cancer risk models were mainly derived from the LSS, based on follow-up from 1958 to 1998 (Preston et al., 2007). Since then, new models with longer follow-up have been published that can be used to update the risk models. • For most solid cancers, risk-modifying factors (age at exposure and attained age) were parameterised as all solid cancers as a group, and the same values were used for both sexes. The longer follow-up of the LSS will provide more detailed information to establish models that better reflect the variation of risk with sex, age at exposure, and attained age for respective cancer sites. • Current risk models consider effect modification by sex, age at exposure, and attained age. Other modifying factors may be worth considering for some cancer sites to obtain a more accurate picture of the variation of risk. For example, radiation and cigarette smoking were previously considered to interact additively as risk factors for lung cancer, but recent studies found complex interaction between them. Based on these findings, risk models for lung cancer that take into account the effect of smoking have been proposed (Furukawa et al., 2010; Cahoon et al., 2017). • The bone marrow category includes leukaemias other than CLL. It is desirable to explore the possibility of extending this category to other types of haematological malignancy, such as lymphoma and multiple myeloma. • Nominal risk estimates for bone cancer and non-melanoma skin cancer were taken from Publications 60 and 59 (ICRP, 1991, 1992), respectively. These risk estimates are based on early studies with large uncertainties, and do not allow for variation of risk with sex and age. For better internal consistency in the calculation, it is desirable to investigate whether more up-to-date risk models are available for these two tissues. • Lifetime risk estimation using a specific risk model was not employed for the brain and salivary glands, whereas tissue weighting factors were assigned specifically to these two organs. To clarify the rationale for these values, it is also desirable to explore the possibility of developing risk models for these two organs. • The category ‘other cancer sites’ accounts for approximately 20% of total radiation detriment. When additional data are accumulated in the future, it is desirable to quantify the risk for some of them as separate cancer sites in order to reduce the contribution of this heterogeneous category. • Most risk models were derived from the LSS without incorporating findings from other sources. During the last decade, many reports provided risk models derived from other epidemiological studies, especially for populations with protracted exposures (e.g. nuclear workers, Mayak workers, residents of the Techa riverside, and Chernobyl clean-up workers). Evaluation of the models derived from these studies should be performed based on a detailed analysis of their respective limitations and advantages, and discussion of the consistency of their results. At the same time, it is desirable to promote epidemiological studies of populations exposed to chronic radiation exposure with good individual records, both for incidence and mortality data. • The models to calculate nominal risks rely on several assumptions, including the LNT model, application of a DDREF, and the use of a transfer scheme based on the weighting of ERR and EAR models. The validity of these assumptions must be examined in the light of the latest scientific findings. In this regard, recent epidemiological literature has been reviewed by the National Council on Radiation Protection and Measurements to examine the validity of the LNT model (NCRP, 2018; Shore et al., 2018, 2019). A dedicated task group has been reviewing the scientific basis of DDREF in terms of epidemiology, animal experiments, and cell biology. Several papers have been published (Rühm et al., 2015; Shore et al., 2017; Little et al., 2020), and a dedicated report will be released in due course.
5.1.3. Cancer severity parameters
(119) Calculation of radiation detriment from nominal risks involves three parameters reflecting the severity of disease: lethality, QOL, and YLL. • Lethality fractions per cancer site have been provided as judgement-based values derived from US population data for the 1980–1985 and 1950–1970 periods (US DHHS, 1989). The same lethality fraction values were used for males and females, the whole population, and the working-age population. Recent data exist that provide much better estimates of current cancer lethality, with variations with age and sex. Also, collection of lethality estimates from other populations outside of the USA is desirable to better reflect variation of lethality among geographical regions in the world. • Adjustment for QOL of patients with cancer was based on arbitrary value judgements. More universal metrics such as quality-adjusted life years (QALYs) and disability-adjusted life years (DALYs) are now available to estimate and characterise QOL for a wide range of conditions (Vergel and Sculpher, 2008; Chen et al., 2015). A review of these methods and of available data will be helpful, taking into account the variation with age, sex, and geographical region. Some of these approaches combine QOL with lethality and YLL indicators. Such methods should make the severity adjustment simpler and more reliable. • Relative years of cancer-free life lost reflect the difference in the distribution of age of onset between cancer sites, and they are influenced by the changes in lifestyle and advances in diagnostic techniques. As in the case of the lethality fraction, the computation based on recent data will provide better estimates, with variations with age and sex, and among different populations. • The current scheme of severity adjustment relies mainly on the lethality fraction, and this method gives little weight to non-lethal cancers such as thyroid cancer. Non-lethal cancers would be better handled by considering the characteristics of each type of cancer.
5.1.4. Heritable effects
(120) The risk of heritable effects in the calculation of radiation detriment is derived from the estimate in the UNSCEAR 2001 report for all classes of genetic diseases up to the first two generations (UNSCEAR, 2001). In recent years, new findings have been obtained, including epigenetic inheritance (Miska and Ferguson-Smith, 2016; Yamada et al., 2021; Yeager et al., 2021). It is desirable to review the current literature on the mechanism of inheritance, available data, and the methods that can be used for estimating the risks of heritable diseases. Advances in this field should help to integrate heritable effects into detriment calculation in a manner more consistent with the current methodology that was developed for cancer.
5.2. Variation with sex and age
(121) As discussed in Publication 138 (ICRP, 2018), dose constraints and reference levels reduce the range of exposure to individuals subject to the same exposure situation, and dose limits ensure that all members of the public, and all occupationally exposed workers, do not exceed the level of risk deemed tolerable. While the control of individual doses is of interest in this framework, what matters is the risk of individuals in a strict sense. Considering that these protection criteria are expressed in effective dose, and that radiation detriment serves as an approximate measure of risk for a given dose, it is important to understand how detriment varies with sex and age. (122) The sensitivity analysis in Section 4, as well as the cancer risk estimates in Publication 147 (ICRP, 2021), has demonstrated that age at exposure has a large impact on radiation detriment. In particular, an exposure during childhood substantially increases the lifetime risk for most cancer sites compared with exposure during adulthood, which therefore results in larger calculated detriment values than those for adult exposure. Differences due to sex are also notable for some tissues, with the most extreme examples of the ovary and the breast. It is desirable to calculate lifetime risks separately for sexes and selected ages (age groups), and to average these estimates in the last stage. While this approach requires handling of sex- and age-specific values throughout the computational process (as far as possible) to avoid averaging at intermediate steps, the resulting risk estimates will demonstrate the variation of risk with sex, age at exposure, and attained age. (123) The same applies to other influential factors, including modifiable lifestyle factors. The Commission defines the nominal population as a mixture of people with different factors governing individual response to radiation. A new ICRP task group has been set up to review scientific information relevant to the topic of individual response. If factors that greatly influence the sensitivity to cancer induction are identified in the future, whether modifiable or not, the variation of risk with them should be assessed. In any case, the above-mentioned approach is expected to make clear distinction between science-based risk assessment and the subsequent integration of information for radiological protection purposes, thus providing better understanding of the construction of radiation detriment. (124) For estimating risk to a particular individual or population, it is preferable to use specific data relating to the exposed individuals when they are available. Nevertheless, the reality is that nominal risk and radiation detriment are often used for approximate risk estimation (ICRP, 2021). In this regard, illustrating the variation of lifetime risk estimates with sex and age will be useful to raise awareness about possible deviations from individual risks in some circumstances. This applies particularly to healthcare situations where individual patients or specific groups of patients are involved. (125) The current set of tissue weighting factors, wT, was determined by categorising organs or tissues and a group of tissues according to sensitivity represented by relative radiation detriments for the whole population (ICRP, 2007). Although the values of relative radiation detriment are not used directly, the contribution of each cancer site to total detriment varies considerably with sex and age at exposure. A detailed description of them, providing different sets of relative detriments, will aid understanding of the distribution range and the representativeness of wT.
5.3. Exposure scenario
(126) Lifetime risks are particularly high for childhood exposure, but the inclusion of adults in the radiation detriment calculation dilutes and offsets the higher lifetime risks in children. A similar situation could occur in a protracted exposure that lasts beyond young ages. The relative contribution of childhood exposure to total risk becomes smaller as years go by. (127) Radiation detriment for an acute exposure averaged over the whole population is regarded to be equivalent to that for lifelong continuous exposure of an individual unless the age distribution differs greatly between the reference population and the static population. Similarly, radiation detriment for the working-age population represents a constant occupational exposure throughout the working life. While these two are the most typical patterns, other exposure scenarios may be possible. In some circumstances, there might be a particular group of individuals who require special attention. For example, special considerations might be necessary for children, pregnant women, and elderly people when planning and implementing protective measures in post-accident situations. In this regard, scenarios of protracted exposure over a certain period of time may be worth considering. (128) In-utero exposure is not considered currently in the calculation of radiation detriment. If there is not much difference in cancer risk between antenatal exposure and childhood exposure, the lifetime risk for the fetus can be regarded as comparable to that for the newborn. This suggests a limited impact on nominal risk, but nevertheless, special consideration may be needed from an ethical point of view. (129) The lifetime risk metric used for calculating radiation detriment is REIC, and a single exposure to 0.1 Gy of low-LET radiation is assumed in the computation process. As indicated in Section 4, the dose assumption to compute REIC has a substantial impact on the final result. Considering the applicable dose range of radiation detriment, setting the dose at 0.1 Gy will remain appropriate. In this regard, the expression of radiation detriment and nominal risk coefficient in ‘per Sv’ could be misleading. It might be more appropriate to show them in terms of the numbers per smaller dose. (130) The sensitivity analysis demonstrated that increasing the maximum attained age has little impact on the values of radiation detriment. Nevertheless, to reflect increased longevity in recent decades, extension of the lifetime beyond 95 years will be reasonable. Future demographic changes may also have an impact on radiation detriment through the alteration of age distribution in the reference populations.
5.4. Consideration of non-cancer effects
(131) In Publication118 (ICRP, 2012), the Commission made a comprehensive review of accumulating evidence that DCS and cataracts might be induced at much lower doses than previously considered, and therefore recommended a threshold dose of 0.5 Gy for the heart, brain, and the lens of the eye, irrespective of dose rate. Some recent epidemiological studies suggest a dose-dependent increase in risk for these effects below 0.5 Gy, but there is considerable uncertainty about the shape of the dose–response curve at doses below this value, and the existence or not of a threshold (Baselet et al., 2016; NCRP, 2016). (132) For DCS, epidemiological data at low doses vary according to the health outcome considered, and whether analyses are based on incidence or mortality (Yamada et al., 2004; Ozasa et al., 2016; NCRP, 2018). Difficulties are also encountered in quantifying the baseline risk. Health statistics on mortality from DCS exhibit large variations between countries and within each country over time. Data sources of morbidity or incidence are limited, and not as standardised as those for cancer. Adjustment for severity is not straightforward, considering the large variation of symptoms and conditions of DCS among patients. (133) For cataracts, evidence of the increase in risk due to radiation exposure is more compelling than for DCS. However, heterogeneity of epidemiological data is reported for lens opacities (NCRP, 2016), and the choice of the endpoint and diagnostic method greatly influence the shape and slope of the dose–response curve. There is no reliable source for baseline statistics on vision-impairing cataracts. Furthermore, regional variation in healthcare development is a significant factor in adjusting for QOL, as cataract is a leading cause of blindness in many developing countries where surgery is hardly accessible. (134) In addition to the aspects described above, further discussions will be necessary on the underlying biological mechanism and the target tissues related to these effects. Whether or not to include them in the calculation of radiation detriment currently remains an open question. New ICRP task groups have been set up to review scientific information on radiation-induced health effects, including DCS, and to provide advice on how to reflect current knowledge about the System of Radiological Protection.
5.5. Transparency and comprehensibility
(135) As described in Section 3, the calculation of radiation detriment involves many steps in which a wide range of information is processed, including risk models, health statistics, and various other parameters. As the methodology becomes increasingly elaborate, it becomes important to accurately document and publish the calculation procedure to ensure transparency and traceability. A full description of the calculation steps is necessary, and it is desirable to develop and share open-source software to perform these calculations. Efforts should also be made to identify the major sources of uncertainty, and quantify their impact. (136) Radiation detriment relates to stochastic effects and requires probabilistic representation. In the current method, it takes the form of a severity-adjusted expected number of cases, which gives each case a different weight depending on the severity of disease among an exposed population. However, the resulting numbers are difficult to grasp for non-specialists, and also incompatible with the risk assessments for hazards other than radiation. Another possible method is to express detriment in terms of the length of time lost from normal health and activity as a result of the harmful effects of radiation. This approach was taken in the assessment of the Index of Harm, which was defined as years lost per 1000 worker-years (ICRP, 1977b, 1985). However, expressing detriment in this manner may give the wrong impression as if the burden of disease was distributed evenly in the population. Nevertheless, it is much more intelligible and applicable to a wide range of health problems. Indeed, a similar concept, DALY, is widely used in the fields of welfare, public health, and medical services. DALY combines mortality and morbidity in a single metric, and efforts have been made to assign reasonable weights to a wide range of non-fatal conditions and impairments (Chen et al., 2015). It is suggested that this risk metric could be used as an alternative to radiation detriment (Shimada and Kai, 2015). (137) While it is not straightforward to express the multi-dimensional nature of detriment, it will be necessary to improve the method of communication so that the construction of radiation detriment becomes more comprehensible. It is desirable to provide graphical presentation of key components of detriment, which will give a wider, balanced perspective on the health risks of radiation. These components include information about reference populations, absolute years of cancer-free life lost, and the baseline for the calculation of radiation detriment (calculation using lifetime baseline risk instead of lifetime excess risk).
6. SUMMARY AND CONCLUSIONS
6.1. Calculation of radiation detriment
(138) The concept of detriment was first introduced in Publication 22 (ICRP, 1973). In a broad sense, it includes any form of deleterious effects, but the methodology has been developed to quantify the harmful health effects of radiation exposure at low doses and low dose rates for radiological protection purposes. Its principal components are probability of attributable cancer, probability of adverse heritable effects, and weighting to adjust for the severity of these conditions. When detriment is calculated as an adjusted excess risk from radiation exposure using the Commission’s methodology, it is specifically called ‘radiation detriment’. (139) The calculation of radiation detriment consists of two main parts. The first part is calculation of nominal risk, which is an estimate of lifetime risk of stochastic effects averaged across sexes, ages at exposure, and geographical regions. The second part is adjustment for severity, which is virtually independent of radiation dose. (140) Section 3 of this publication has provided full details of the current detriment calculation procedure, clarifying and correcting the following points. The mathematical expression of the risk model for leukaemia, which was not available in Publication 103 (ICRP, 2007), has been provided. ERR:EAR weights for transferring lifetime risk of leukaemia have been corrected to 50%:50%. It has also been noted that the minimum latency period for leukaemia is 5 years. The EAR model for breast cancer was not described correctly in Publication 103. The corrected mathematical formula of the model has been provided. To estimate lifetime risk per Gy for each age at exposure, REIC up to age 94 years following a single exposure to 0.1 Gy was calculated and multiplied by 10. The lifetime risk estimates were computed for ages 0–89 years at exposure for the whole population (not 0–85 years as described in Publication 103). The age-averaged lifetime risk was calculated for each of the four reference populations (males and females of Asian and Euro-American populations) as a weighted mean of the lifetime risk estimate for each age at exposure, the weights being proportional to the age distribution. (141) Programming errors were found in the calculation of nominal risk for the working-age population in Publication 103 (ICRP, 2007). The Commission notes that these errors do not impact overall detriment values, and have no implications for the System of Radiological Protection.
6.2. Sensitivity of radiation detriment
(142) Radiation detriment is intended to represent the risk for a nominal population. Among attributes that define the nominal population, sex and age at exposure have a substantial impact on the values of radiation detriment. Sex averaging results in halving the risks from ovarian and breast cancers. There are also significant differences in lifetime risk between males and females for other organs, such as lung, liver, colon, and thyroid cancers. Radiation detriment for the population exposed at a young age (0–14 years) is higher than that for the whole population (exposed at 0–89 years of age) by more than a factor of 2 for some organs and tissues (stomach, breast, thyroid, and other solid cancers). (143) With regard to the parameters involved in the calculation of detriment, DDREF, dose assumption, and lethality fraction were identified as having substantial impact. The choice of the DDREF value has a direct effect, resulting in a 2-fold increase in radiation detriment for solid cancers when it was set at 1 instead of the default value of 2. The dose assumption in the calculation of lifetime risk is 0.1 Gy, but changing it to 1 Gy resulted in radiation detriment of >2-fold higher for bone marrow. The selected sensitivity analysis also demonstrated a potentially large impact of the lethality fraction on radiation detriment. (144) Another important finding from the sensitivity analysis was the relevance of the transfer model. As is indicated in Section 4, the transfer model has a moderate impact on the calculation of radiation detriment. This could be important for cancers with varying baseline risks between populations.
6.3. Suggestions for future improvement
(145) Radiation detriment needs to evolve depending on changes in cancer incidence and survival rates, and on advances in scientific understanding of radiation health effects. From this viewpoint, reference population data and cancer severity parameters need to be updated and improved. Specifically, baseline cancer incidence rates and mortality rates are based on data from the 1990s, and these rates have changed significantly over recent decades for some cancer sites. Also, the lethality fractions currently used in the calculation of detriment rely on data from the USA in the 1980s. Subsequent progress in diagnostic techniques and treatments may lead to a substantial decrease in the lethality fraction (Breckow et al., 2018; Siegel et al., 2021). (146) There is also scope for improvement in cancer risk models, including use of the LSS data with longer follow-up; models derived from other epidemiological studies, especially for populations with protracted exposures; and specific risk models for bone, skin, brain, salivary gland, and haematological malignancies other than leukaemia. Consideration of recent findings regarding heritable effects of radiation is also necessary. (147) There is growing interest in identification of the major sources of uncertainty in radiation risk assessment, and quantification of their impact (UNSCEAR, 2015, 2020). The selected sensitivity analysis has identified sex, age at exposure, DDREF, dose assumption in the calculation of lifetime risk, lethality fraction, and transfer model as key factors to be considered to improve radiation risk estimation in the future. In this context, elucidating the difference in sensitivity between males and females is an important priority. More research is needed to refine the risk estimates for childhood exposures. Efforts should also be made to better characterise the dose–response relationship for each cancer site at low doses and low dose rates. The choice of the transfer model, together with how to define the reference populations, continues to be a fundamental issue in the estimation of radiation-associated cancer risks, and requires further research with updated information. (148) Considering the variation in cancer risk with sex and age, it is desirable to calculate lifetime risks for both sexes and selected ages separately, and then to average them only in the last stage. This may also apply to other influential factors, including modifiable lifestyle factors. If factors that greatly influence sensitivity to cancer induction are identified in the future, the variation of risk with them should be assessed. (149) Age dependence of risk also has relevance for the representativeness of the nominal population. If a situation arises in which children and young people are mainly exposed, due consideration should be given to the validity of radiation detriment for the whole population. (150) The Commission cautioned in Publication 118 (ICRP, 2012) that DCS and cataracts could occur at lower doses than previously thought. Nevertheless, there is considerable uncertainty about the shape of the dose–response curve at low doses, and the existence or not of a threshold for these effects. Whether or not to include them in the calculation of radiation detriment currently remains an open question. (151) As the methodology of detriment calculation changes, it is important to ensure transparency and traceability. A full description of calculation steps is necessary, and consideration should be given to the development of open-source software for calculating radiation detriment. It is also desirable to improve the way in which radiation detriment is expressed and communicated so that non-specialists can have a balanced perspective on the health risks of radiation. (152) These suggestions for future improvement should not be interpreted as the decision to replace or modify the framework and methods for the calculation of radiation detriment in Publication 103 (ICRP, 2007). The Commission has launched task groups and working parties to give in-depth consideration to the identified issues. Results of all those considerations will be integrated into the Commission’s ongoing process of reviewing and updating the System of Radiological Protection (Clement et al., 2021).