
Abstract
In this study, the energy performance analysis of a representative residential building located in Izmir, Turkey, was carried out, utilizing the DesignBuilder energy simulation program. Heating, ventilation, and air conditioning systems are modeled as detailed in Design Builder in order to consider parameters such as thermal properties of materials, duct layout and airflow dynamics of the system in detail in the analysis. The technical and economic analysis of transforming the building into a nearly zero energy building (NZEB) was performed for eight different retrofit scenarios, including passive and active energy efficiency measures. The most effective scenario, Scenario 8 (S8), reduced the building's annual net primary energy consumption by 96.08% to 7.45 kWh/m²/year. S8's annual CO2 emissions decreased by 100.07% compared with the reference scenario, resulting in −0.042 kg CO2/m²/year. The overall energy performance class of the building was determined using Turkey's national calculation program for the preparation of the energy identity certificate. The energy performance class of the reference building was determined as D, and the class of the building designed according to S8 as A. Investment evaluations were carried out for the retrofit scenarios, revealing that the investment cost for S8, having the lowest net primary energy consumption, amounted to USD 17,565.87. This finding establishes S8 as a more financially viable option in the short term. This study demonstrates the potential of NZEBs in reducing greenhouse gas emissions and achieving sustainable development goals.
Keywords
Introduction
Buildings account for a significant portion of the total energy consumption. In 2021, the amount of energy consumed by the operation of buildings (space heating and cooling, water heating, lighting, cooking, etc.) was approximately 30% of the total global energy consumption, amounting to 135 EJ (UNEP, 2022). In the world, buildings consume 40% of natural resources and 25% of water (UNEP, 2023). Most of the energy consumed in buildings is used for heating and cooling purposes. Fossil fuels are typically used for heating and electricity for cooling. Heating and cooling systems consume an average of 38% of the energy consumed in buildings globally. This rate reaches 32% in residential buildings and 47% in the service sector. The energy consumed by heating and cooling systems varies from country to country according to the climatic conditions and the level of development of each country. In both developed and cold countries, the proportion of energy consumed by heating and cooling system increases. Of the energy used in buildings, 13% is used for hot water, 8% for cooking, 5% for lighting, and 36% for other equipment consumption (González-Torres et al., 2022). The main indicator of the energy performance of buildings is the building energy intensity. Building energy intensity refers to the total amount of energy consumed per m². This value has not changed in the last three years and has been around 150 kWh/m²/year globally. The energy intensity of buildings in 2021 was 152 kWh/m2/year. To achieve the zero net carbon targets, the building energy intensity needs to be reduced to around 95 kWh/m²/year (UNEP, 2022).
Buildings are important sources of emissions. Energy-related CO2 emissions account for 65% of global greenhouse gas (GHG) emissions. Fossil fuel burning and industrial processes are the primary sources of energy-related CO2 emissions. Energy-related CO2 emissions consist of electricity and heat generation, transportation, industry, and building sector emissions (EPA, 2023). In 2021, the value of global energy-related CO2 emissions is 36.3 GtCO2 (IEA, 2021). This value increased by 0.9% compared to the previous year and was realized as 36.8 Gt in 2022 (IEA, 2022). Approximately 37% of global energy-related CO2 emissions in 2021 came from buildings. Of the CO2 emissions from buildings, 27% came from the operation of buildings and 10% from the production of materials used in building construction. Of the 27% emissions from the operation of buildings, 8% are direct CO2 emissions from the direct use of fossil fuels in buildings. Another 19% of emissions from the operation of buildings are indirect emissions from electricity consumption. The emission intensity of buildings in 2021 was 40 kg CO2/m²/year (UNEP, 2022).
Buildings account for 40% of the energy consumed in the European Union (EU) and 36% of energy-related GHG emissions (EC, 2020). Eighty percent of the energy consumed in buildings in Europe is produced using fossil fuels (UNEP, 2022). To reduce the EU's energy dependence and GHG emissions, it is essential to reduce energy consumption and use renewable energy sources (RESs) in the building sector, as emphasized in Directive 2010/31/EU (OJEU, 2010). The EU issued the EU Energy Performance of Buildings Directive (EPBD) 2002/91/EC to control energy consumption from buildings, improve the energy performance of buildings, and reduce their negative environmental impacts. The directive assesses the applicability of RESs, improves energy service standards, limits GHG emissions, and protects the environment through the efficient use of energy (OJEU, 2003). In 2010, with the update of the EPBD, the concept of nearly zero energy building (NZEB) was introduced in the EU. Member states should increase the number of NZEBs to reduce GHG emissions and promote sustainable development. To achieve this, national plans should be created by member states, including an increase in NZEBs and varying goals for each type of building.
In Turkey, which has a high level of urbanization, urbanization has increased over the years, resulting in significant increases in the urban population. As of 2022, compared to 2002, the annual number of newly constructed buildings increased by 107.7%, the annual number of newly constructed dwellings increased by 291.5%, and the annual area of newly constructed buildings increased by 300.5% (UNFCCC, 2023a). With the residential building stock in Turkey expected to grow by over 50% by 2050, the building sector in Turkey plays a pivotal role in achieving national climate protection targets (MEUCC, 2021). Due to urbanization and an increasing number of buildings, the amount of energy consumed in buildings is also increasing. In 2021, Turkey's total final energy consumption was 123.859 million tons of oil equivalent (Mtoe). Approximately 30% of the energy consumed was consumed in buildings (Ministry of Energy and Natural Resources [MENR], 2022). In 2021, 59.85 billion Sm3 of natural gas was consumed in Turkey. Buildings accounted for about 36% of the natural gas consumed (Energy Market Regulatory Authority [EMRA], 2023a). Invoiced electricity consumption in Turkey in 2021 was 253,033.9 GWh. The rate of electrical energy consumed in buildings was 48.49% (EMRA, 2021).
Turkey's fossil fuel dependency is high. Turkey's primary energy supply increased by 8.33% compared to the previous year and reached 159.432 Mtoe in 2021. The share of fossil fuels in the primary energy supply was 83%, and the share of RESs was 17%. Solid fuel supply amounted to 41.5 Mtoe, oil supply to 44 Mtoe, natural gas supply to 49.2 Mtoe, and renewable energy supply to 24.9 Mtoe (MENR, 2022). Turkey's installed power capacity is 104,348 MW. Of the total installed capacity, 30.3% is hydro, 24.4% is natural gas, 20.9% is coal, 11% is wind, 9.43% is solar, 1.6% is geothermal, and 2.5% is other resources (TEİAŞ, 2022).
Turkey's total GHG emissions in 2021 were calculated as 564.4 MtCO2 equivalent (MtCO2-eqv.). Of the total, 71.3% of GHG emissions were caused by energy-related emissions. The energy sector accounted for 85.2% of total CO2 emissions. The value of CO2 emissions from the energy sector was 452.7 Mt CO2 eqv. (TÜİK, 2023). Considering that approximately 37% of global energy-related CO2 emissions in 2021 originate from buildings, the value of Turkey's CO2 emissions from buildings can be considered to be approximately 37% of energy-related CO2 emissions (UNEP, 2022). By 2030, global energy demand is projected to increase by 30%, with approximately 83% coming from fossil fuels. Turkey is 74% dependent on foreign energy and must minimize its dependence on foreign energy to ensure energy supply security (Özcan, 2013). Reducing the amount of energy used in buildings will reduce the amount of fossil fuels utilized and consequently reduce emission values. For NZEB design, renewable power plants installed on-site or near the building will reduce fossil fuel dependency.
The use of RESs and energy efficiency has become a priority to reduce energy consumption in buildings. Turkey has followed these innovations and added the national NZEB definition to its legislation on February 19, 2022. Turkey defined NZEBs as energy-efficient buildings that derive at least 10% of their energy requirements from RESs and have an energy performance class of B or higher. The 10% RES utilization rate will be 5% through January 1, 2025. According to the regulation, buildings with a total construction area of 2000 m2 or more must be built as NZEBs. It has been agreed to apply this 2000 m2 value as 5000 m2 until January 1, 2025 (Official Gazette, 2022). In 2023, Turkey submitted its Updated First Nationally Determined Contribution to the Secretariat of the United Nations Framework Convention on Climate Change (UNFCCC). With this declaration, Turkey announced that it has increased its commitment to reduce its emission increase by 21%, which it announced in 2015, to 41% by 2030. Accordingly, Turkey committed to reduce its GHG emissions by 41% by 2030 compared to the baseline scenario. In the Updated First Nationally Determined Contribution, the sectoral strategies required for Turkey to achieve its 2030 targets for combating climate change are also included. Among the strategies identified for the building sector are; constructing buildings with high energy efficiency, increasing renewable energy consumption in buildings, and utilizing renewable energy technologies such as heat pumps, photovoltaic (PV) panels, solar collectors, and high-efficiency lighting equipment (UNFCCC, 2023b).
The aim of this study is to transform a sample residential building (reference building) in Izmir, Turkey, into an NZEB using active and passive energy efficiency measures. This study expands the use of RESs and reduces energy consumption and emissions from buildings through NZEBs. In this respect, this study draws attention to the importance of NZEBs in achieving sustainable development goals (SDGs) and reducing GHG emissions. This study consists of five main sections. The Introduction is the first main section of the article. The second section of the study is the literature review. In this section, studies on NZEBs in the literature are examined. In the third section, NZEB is examined conceptually, and information about the legislative arrangements made in Turkey regarding NZEB is given. In the fourth section, the methodology of the study is defined and the structural, lighting, heating, ventilation, and air conditioning (HVAC) and renewable energy parameter inputs of the reference building are explained. In this section, the reference building was simulated using the DesignBuilder program, and different retrofit scenarios, including active and passive energy efficiency measures, were determined. The technical and economic analyses of the eight retrofit scenarios are carried out in this section. In the fifth section, the results of the study are given, and in the sixth section, recommendations are made for the development and implementation of NZEB by considering the results obtained from the study.
Literature review
NZEBs are fundamental components of sustainable architecture and energy-efficient design. The NZEB concept has emerged as a solution to minimize energy consumption and maximize the use of RESs with the growing concern for climate change and the need to reduce GHG emissions. Within the scope of the literature review, studies on NZEB have been examined.
Morelli et al. (2012) investigated the renovation of a typical old Danish building as an NZEB. They selected a test apartment and applied three different retrofit scenarios. After the implementation of two passive energy and one active energy efficiency measure, the final energy use of the building was reduced from 162.5 kWh/m2/year to 51.5 kWh/m2/year.
Wawerka (2015) performed a comprehensive analysis of the transformation of an existing building in Copenhagen with a total gross floor area of 67.1 m2 to NZEB. The energy modeling of the building was carried out using the DesignBuilder program, and building energy modeling was performed for various retrofit scenarios. Active and passive energy efficiency measures were used to improve the building.
Adıgüzel and Javani (2016) examined the situation of meeting the domestic hot water (DHW) and electrical energy needs of a two-storey detached house located in Antalya province and designed to accommodate a family of three people with solar energy. To see the effect of the mounting direction on electricity generation, they changed only the direction without changing the number of PV panels and found that the system mounted on the south facade produced 39.79% more electrical energy than the system mounted on the north facade.
Paoletti et al. (2017) analyzed the structural characteristics of NZEB buildings in 17 European countries within the scope of the IEE ZEBRA2020 project. They determined that 93% of the buildings analyzed have a “heating demand” below 40 kWh/m2/year. In their study, because of their analysis of RES utilization, they stated that the use of PV panels and solar collectors in NZEBs located in cold climate regions is less than that in temperate climates. The rate of PV and solar collector use in NZEBs was determined to be 44% in cold climates and 60% in temperate climates.
Kalaycıoğlu and Yılmaz (2017) conducted a case study at the district level to assess the implementation of the NZEB concept in Turkey. The selected sample district, located in Eskişehir province, comprises 34 residential buildings (182,030.22 m²), seven office buildings (117,618.97 m²), and one industrial building (10,729.13 m²). In their study, the researchers initially modeled each building type as a reference. Subsequently, they determined the annual primary energy consumption for the reference residential building as 158.93 kWh/m²/year, for the reference office building as 251.37 kWh/m²/year, and for the reference industrial building as 1016.04 kWh/m²/year. Once the reference buildings were identified, the impact of active and passive energy efficiency measures on NZEB transformation was examined to improve the energy performance of each building type. Each type of building was upgraded to NZEB after the improvements were made, and the annual primary energy consumption of residential buildings was reduced to 104.08 kWh/m2/year, the consumption of office buildings to 165.2 kWh/m2/year, and the energy consumption of industrial buildings to 740.8 kWh/m2/year.
Salem et al. (2018) examined the retrofit of a residential dwelling in the United Kingdom using thermal analysis simulation (EDSL) software, focusing on building retrofits and on-site RES deployment. PV panels were installed on the roof of the building, a microwind turbine was implemented, and micro-cogeneration (CHP) was applied. The roof, wall, and floor U-values of the building were retrofitted. According to the simulation results, the building's energy consumption was reduced by 122.64 kWh/m2/year (90.24%) when all these improvement possibilities were implemented. An annual reduction of 816.47 kg CO2 (84.59%) was achieved in carbon emissions.
Turhan et al. (2019) analyzed the transformation of an educational building in Ankara, Turkey, into an NZEB by applying different energy-efficient retrofit scenarios. Active energy efficiency measures were used for building retrofits. They defined various energy efficiency retrofit scenarios, such as the addition of PV panels and wind turbines for electricity generation. Energy modeling of the building was performed using the DesignBuilder program. They concluded that the best scenario was to build a 31 m wind turbine. With a payback period of 14 years, they concluded that 95.3% energy savings could be achieved with this retrofit.
Yıldırım (2019) performed building energy modeling of a service building in Malatya using the DesignBuilder software. LED and controllable luminaries were used instead of the fluorescent lamps currently used. Compared with the fluorescent system, the total annual electricity consumption will decrease by 20.8% and the annual natural gas consumption will increase by 4.45%. When using 10 cm rock wool instead of 6 cm rock wool in the exterior wall of the building, it was found that there was an energy saving of 4.72%. When 25-cm rock wool is used instead of 12-cm rock wool in the roof slab, 1.93% energy saving is achieved. The net primary energy consumption decreased from 161 kWh/m²/year to 127 kWh/m²/year when the building envelope was improved, the lighting system was equipped with LED armatures and lighting control, and the existing windows were replaced with low-emissivity (Low-E) coated windows.
Resende et al. (2021) examined in detail the NZEB requirements for the renovation of residential buildings in Portugal and Spain for a specific building typology with low energy performance. In their study, they compared the CO2 emission reduction results of an existing residential building renovated with different retrofit scenarios. When the results were analyzed, they determined that the scenario that meets the NZEB requirements with the lowest CO2 emission value is the 4D scenario where a solar collector with a PV panel (PV/T hybrid panel) for hot water and a heat pump for heating (COP: 4.5) retrofit is applied. The implementation of this scenario resulted in emissions of 1.3 tons CO2/m2/year in Portugal and 2.0 tons CO2/m2/year in Spain.
Kutty et al. (2023) carried out energy modeling of a 102.4 m2 house in Nice, France, using the DesignBuilder software. Active and passive energy efficiency measures were used during building retrofit. After the retrofit, the net primary energy consumption of the house decreased from 194.37 kWh/m2/year to 23.98 kWh/m2/year.
Limited research has comprehensively assessed multiple retrofit scenarios, particularly pertaining to the transformation of existing residential buildings into NZEB in Turkey. There is a limited body of studies that systematically calculate the total annual primary energy consumption of buildings due to incremental enhancements, and an insufficient emphasis on emission analysis is discernible in existing literature. Notably, the reviewed studies reveal a lack of detailed consideration for HVAC system design. In this study, a holistic approach is adopted, analyzing all factors influencing building energy performance—namely HVAC systems, building envelope, windows, lighting systems, and RESs—by incorporating them into retrofit scenarios. Building energy modeling was performed using the DesignBuilder software. HVAC systems were modeled as “Detailed HVAC” through Design Builder. The detailed HVAC system in DesignBuilder considers the details of HVAC design, such as the thermal properties of materials, duct layout, and airflow dynamics of the system. This level of detail provides a more accurate simulation of the HVAC performance of the building. Within the scope of the study, the amount of emissions from the building was analyzed and solutions to minimize the use of fossil fuels were focused on. The energy performance analysis performed for this building will be an example for future studies to improve the energy efficiency of residential buildings in similar climatic conditions.
Nearly zero-energy buildings
Reducing energy consumption within the EU and promoting the utilization of RES within the building sector are pivotal measures that will significantly contribute to the reduction of GHG emissions across the EU. This strategic approach not only diminishes the EU's reliance on fossil fuels overall but also lessens dependency on imports, thereby bolstering the energy supply security of the EU (EP, 2023). In this context, the directive issued by the EU in 2002 holds significant importance. The EU issued the EPBD in 2002 to improve the energy performance of buildings (OJEU, 2010). This directive has been amended over the years. The 2010 directive (Directive 2010/31/EU) was amended by Directive 2018/844 published in 2018. The main reason for the amendment is to accelerate the cost-effective renovation of existing buildings. As a result of the amendment, EU countries must set optimum minimum energy performance requirements and review these requirements every five years. The Directive sets deadlines for existing and new buildings to become almost zero-energy buildings. Directive (EU) 2018/844 sets out the requirement for EU countries to prepare long-term renovation strategies to support the transformation of both residential and nonresidential buildings into an energy-efficient and decarbonized building stock by 2050 (EUR-Lex, 2023).
In December 2021, the EC proposed a revision of the EPBD as part of the Fit for 55 package. This EPBD revision sets out how the EU can achieve a zero-emission and fully decarbonized building stock by 2050. According to the proposed amendment, all new buildings in the EU must be zero-emission by 2030 (EC, 2021). In March 2023, the EP prepared its proposal on the amendment proposed in December 2021. The proposed revision of the EPBD introduces new standards for energy performance to decarbonize the building sector, with changes to the definitions of energy performance standards, revisions to national building renovation plans and a new requirement for life cycle emissions calculations for new buildings. In this context, National Building Renovation Plans will need to be revised. Building energy performance classes will be increased, depending on building types. Realizing the targeted enhancements in building energy performance classes necessitates the renovation of approximately 15% of the entire building stock across the EU (EP, 2023).
An NZEB is a building that has a very high energy performance and meets almost zero or very low amounts of energy required on-site or from nearby renewable power plants. The EPBD obliges EU Member States to require all new buildings to be almost zero-energy by the end of 2020 and all new public buildings to be NZEBs after December 31, 2018 (EC, 2023). Member states will prepare national plans to increase the number of NZEBs, which may include differentiated targets by building category. Article 9 of the EPBD requires EU Member States to define an NZEB that reflects their national, regional, or local circumstances and includes a numerical indicator of primary energy use in kWh/m2/year (OJEU, 2010). Bulgaria, France, Hungary, Ireland, Slovenia, Ireland, Slovenia, and Croatia have specified both primary energy use in kWh/m2/year and a definition that quantitatively or qualitatively assesses the share of RESs required in NZEB applications (BPIE, 2015, 2021; Republika Slovenija Ministrestvo Za Infrastrukturo in Prostor, 2014).
Energy-efficient renovation of buildings is important in terms of reducing the energy consumption of the building sector. Addressing the issue of increasing the renovation rate with new tools is of great importance for the construction sector. In recent years, the Building Renovation Passport (BRP) concept and its current applications have been a means to achieve higher renovation rates. A BRP is a document in electronic or paper format that outlines a long-term step-by-step renovation roadmap for a specific building, determined during the building design phase and in dialogue with building owners. The BRP is to provide building owners and investors with suggestions and recommendations on how to retrofit the building to become almost zero-energy. In addition to including information on energy performance, the BRP supports building owners with personalized instructions on renovation roadmap that quantify potential energy savings and the associated costs of potential measures (Sesana and Salvalai, 2018).
To improve the energy efficiency of buildings, many countries are promoting the use of renewable energy (Sornek et al., 2023). Efficient buildings are needed to contribute to sustainable development. In line with these needs, countries have adopted specific approaches and regulations linked to net zero energy targets (De León et al., 2023). Reducing GHG emissions and promoting sustainable development are two major goals of the NZEB concept. The energy industry strives to reduce the use of fossil fuels and promote renewable energy as a way to combat climate change (Shin et al., 2022). NZEBs are structures that reduce energy consumption, helping to minimize dependence on fossil fuels. NZEBs can also provide economic benefits to building owners and occupants by reducing energy costs over the lifetime of the building. NZEB design can involve a combination of design measures such as optimizing the building envelope, installing energy-efficient lighting and HVAC systems, and heat pumps, and incorporating renewable energy technologies such as PV solar panels and wind turbines.
Turkey's energy policy prioritizes greater use of RESs while reducing external dependence on energy to increase the country's energy supply security (Şentürk, 2023). Issues related to increasing energy efficiency in buildings are included in various policy documents and legal regulations. Improving the energy performance of new buildings is one of Turkey's main policies (UNFCCC, 2023a). In Turkey, many regulations have been made to reduce energy consumption in buildings from the past to the present. The TS 825 standard, known as “Thermal Insulation Rules in Buildings,” is the standard for building insulation in Turkey. On May 24, 2008, it was approved by the Turkish Standards Institution technical committee and officially put into practice with a communiqué published on August 26, 2008. The TS 825 standard mandates energy-efficient insulation starting from the design phase of a building (İzocam, 2013). Another important legal arrangement is the Energy Efficiency Law (EEL) No. 5627, which came into force in 2007. The main objective of the law is to reduce energy consumption in industry, buildings, transportation, and the energy sector by including measures applicable to Turkey (Official Gazette, 2007). The Energy Performance in Buildings (BEP) Regulation was published in 2008 based on the EEL and entered into force one year later (Official Gazette, 2008). The purpose of the BEP regulation is to set minimum energy performance standards for existing buildings. It also establishes guidelines for the assessment of building energy management, focusing on primary energy consumption and CO2 emissions to assess energy savings (Official Gazette, 2022). BEP regulation in Turkey aims to reduce energy consumption and GHG emissions caused by the building sector by setting energy performance requirements for both new and existing buildings. To achieve this, the regulation sets specific energy efficiency standards for various building components such as walls, roofs, floors, windows, doors, and systems such as HVAC and lighting. BEP regulation includes guidelines for calculating energy use, minimum performance standards for the preparation and implementation of energy-related projects for both new and existing buildings, creating Energy Identity Certificate (EKB), use of RESs and cogeneration systems, and keeping up-to-date building inventories (Official Gazette, 2022). Turkey has closely followed the NZEB definition made in Europe and the increasingly important issue of energy consumption in buildings. With the amendment made to the BEP regulation in 2022, the NZEB definition was introduced into the legislation. With the regulation, it is obligatory for buildings with NZEB features to have energy performance class B or better in EID and to use RESs at least 10% of the primary energy need of the building. In addition, it has become mandatory for buildings with a total construction area of 2000 m² or more to be constructed as NZEB. It has been decided that the RES utilization rate, which was determined as 10%, will be applied as 5% until January 1, 2025. Buildings with a construction area of more than 5000 m2 are allowed to be constructed as NZEB until January 1, 2025 (Official Gazette, 2022).
Sample building selection and simulation
The steps followed for selecting, simulating, and transforming the building whose energy performance will be examined and optimized within the scope of this study are given in Figure 1.
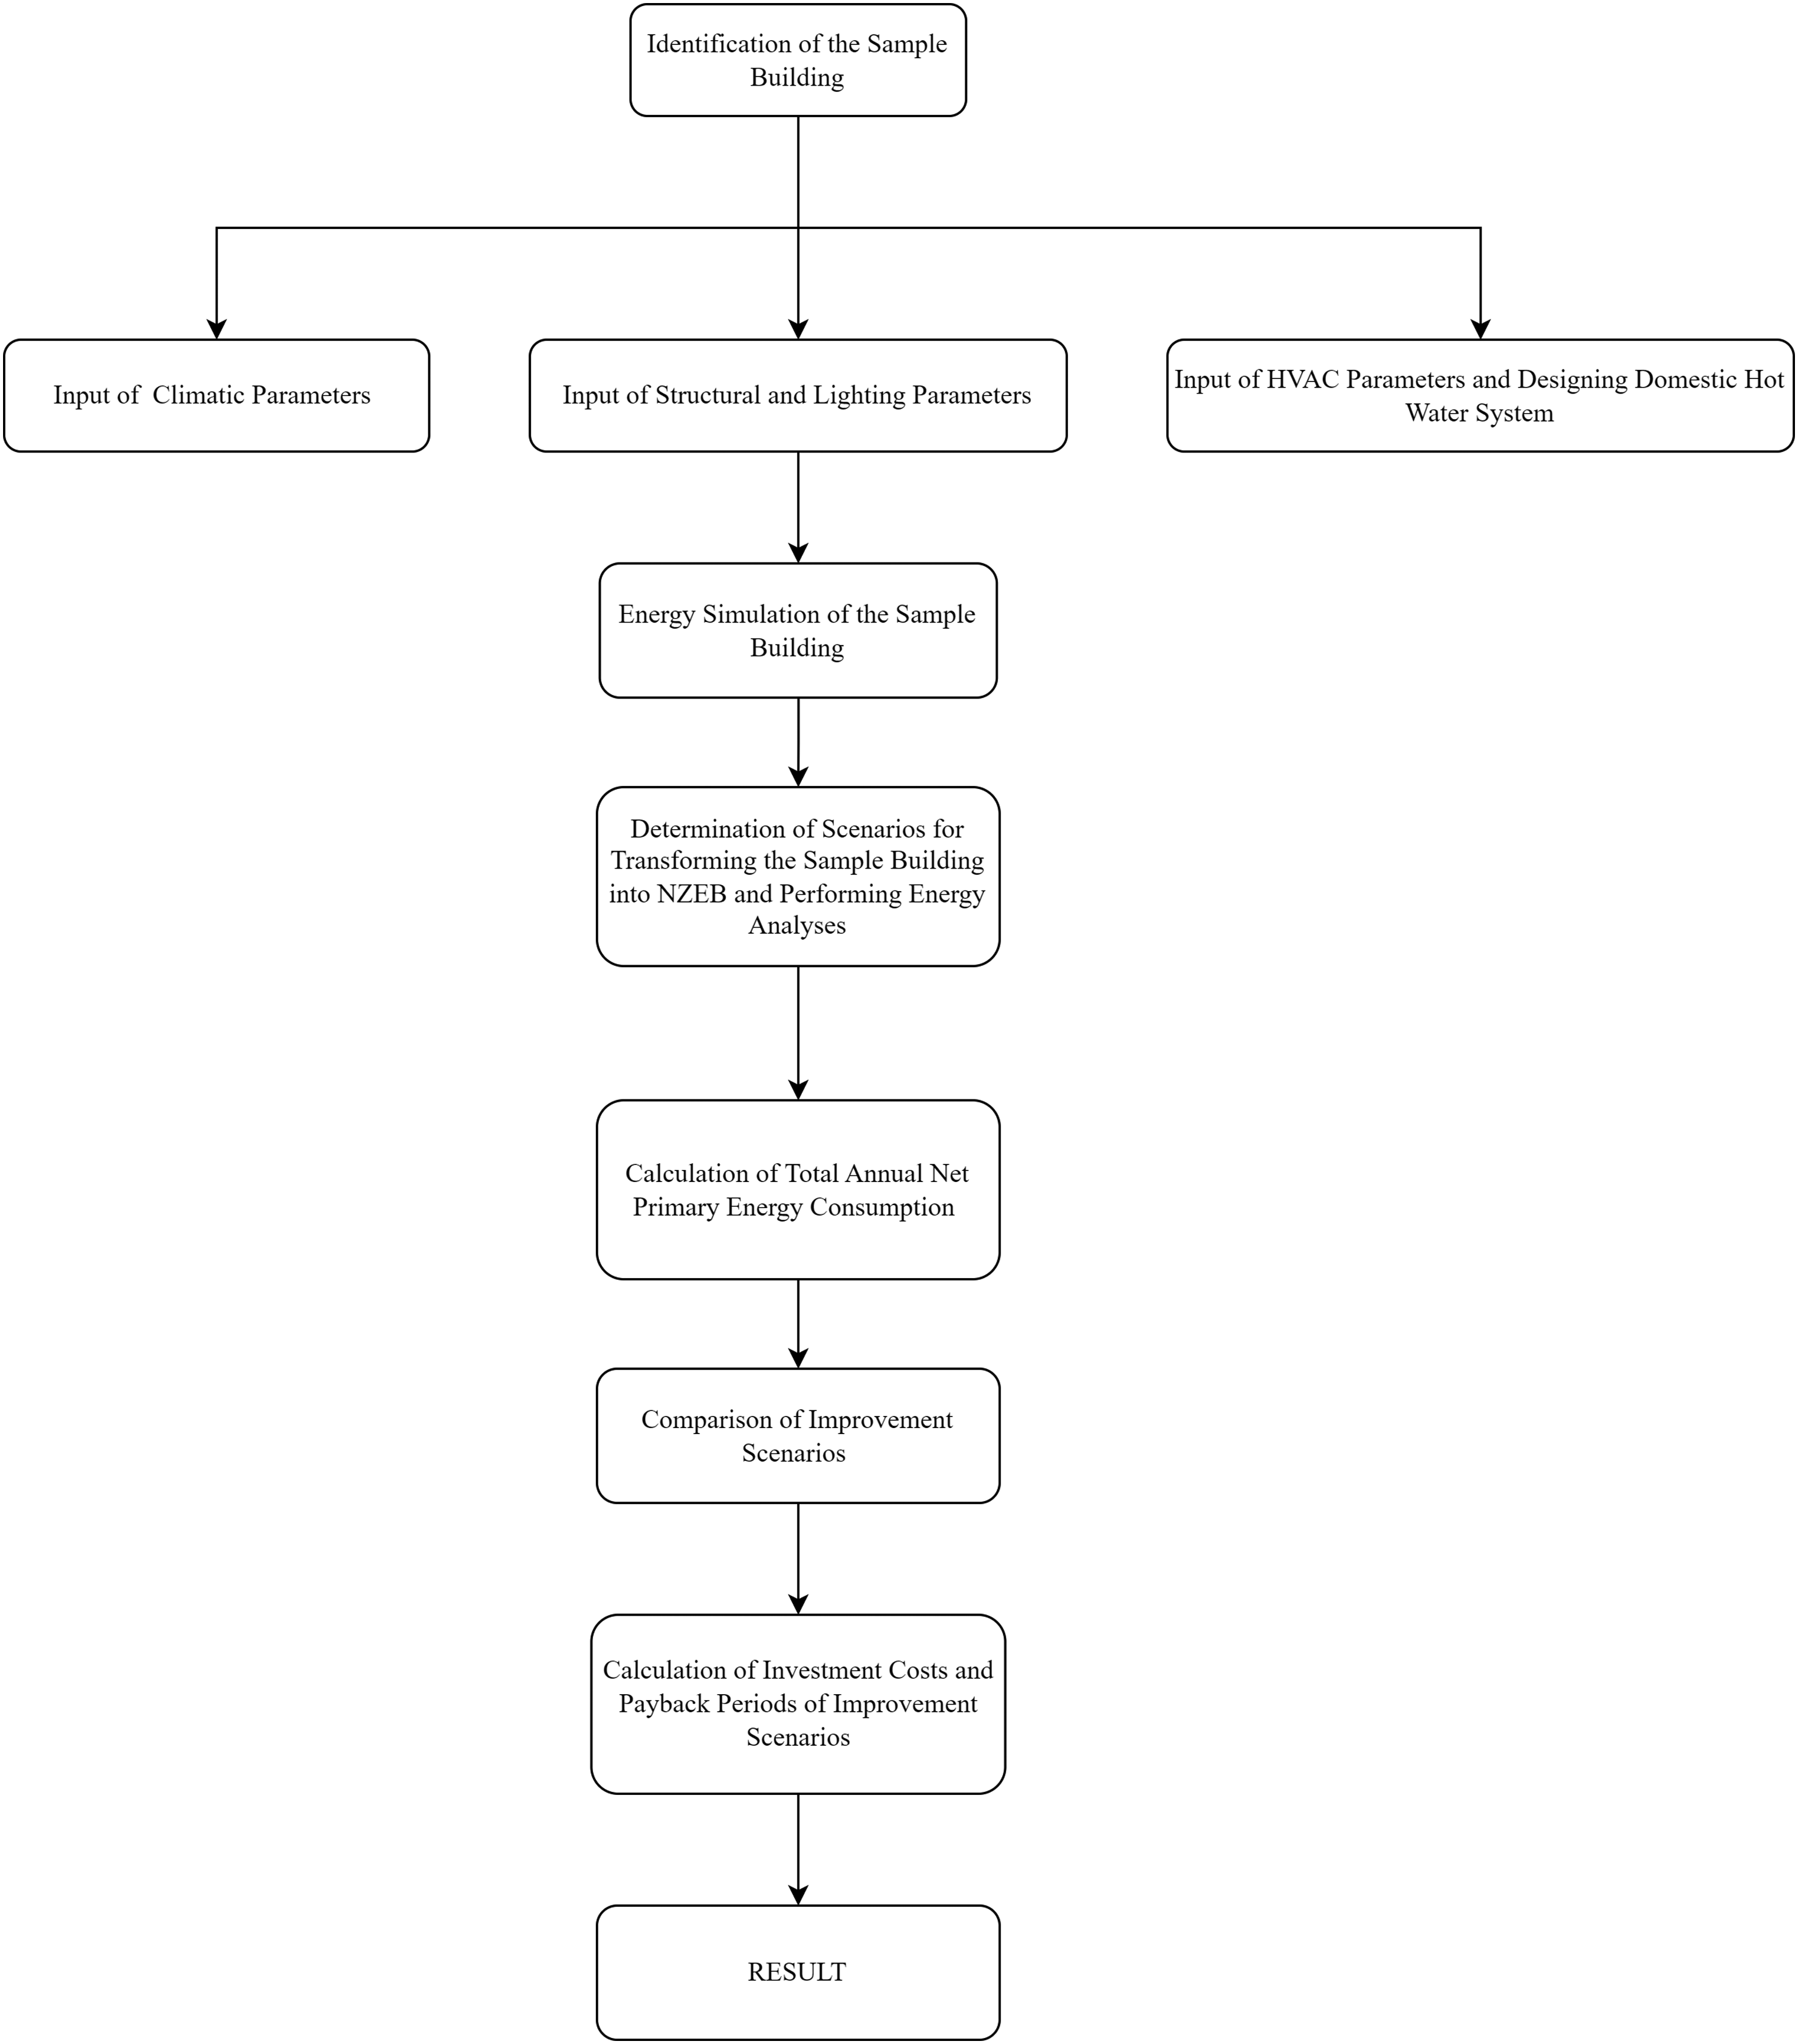
Steps followed to transform sample building to NZEB.
Identification of the sample building
Within the scope of this study, a three-storey residential building located in Çiğli district of İzmir province was selected for NZEB transformation. The location of the building is 38.52 latitude and 27.02 longitude (Şentürk, 2023). Given its location in the Aegean region, the building requires high cooling loads to maintain comfortable indoor conditions and ambient temperatures. Since cooling systems typically account for a significant portion of a building's energy consumption, a residential building in Izmir was chosen to investigate its energy performance.
The DesignBuilder program was used to perform the energy performance analysis of the sample residential building. The DesignBuilder program was preferred because it has a user-friendly interface. The building modeling was performed using the DesignBuilder V7 building energy simulation program, which is available free of charge for a limited time. The simulation was performed between January 1 and December 31, 2022. The sample building is a detached residential building with a rectangular plan shape with a length of 13 m and a width of 10 m. The building consists of three floors, and the height of the building is 9 m, excluding the roof. There is no basement or attic in use in the building. Each apartment in the building has a guest room, bedroom, kitchen, living room, bathroom and toilet, and an entrance hall. The window sizes of the bedrooms are 140 × 150 cm, the living room window size is 140 × 210 cm, 140 × 150 cm for the kitchen, and 40 × 50 cm for the bathroom. Based on standard house dimensions, the entrance door of the building was determined as 100 × 210 cm. Bedrooms, living room, and kitchen doors were fixed at 90 × 210 cm.
The modeling of the sample building was performed in 3D with the DesignBuilder program, as shown in Figure 2. The arrow in the lower left corner indicates the north direction.
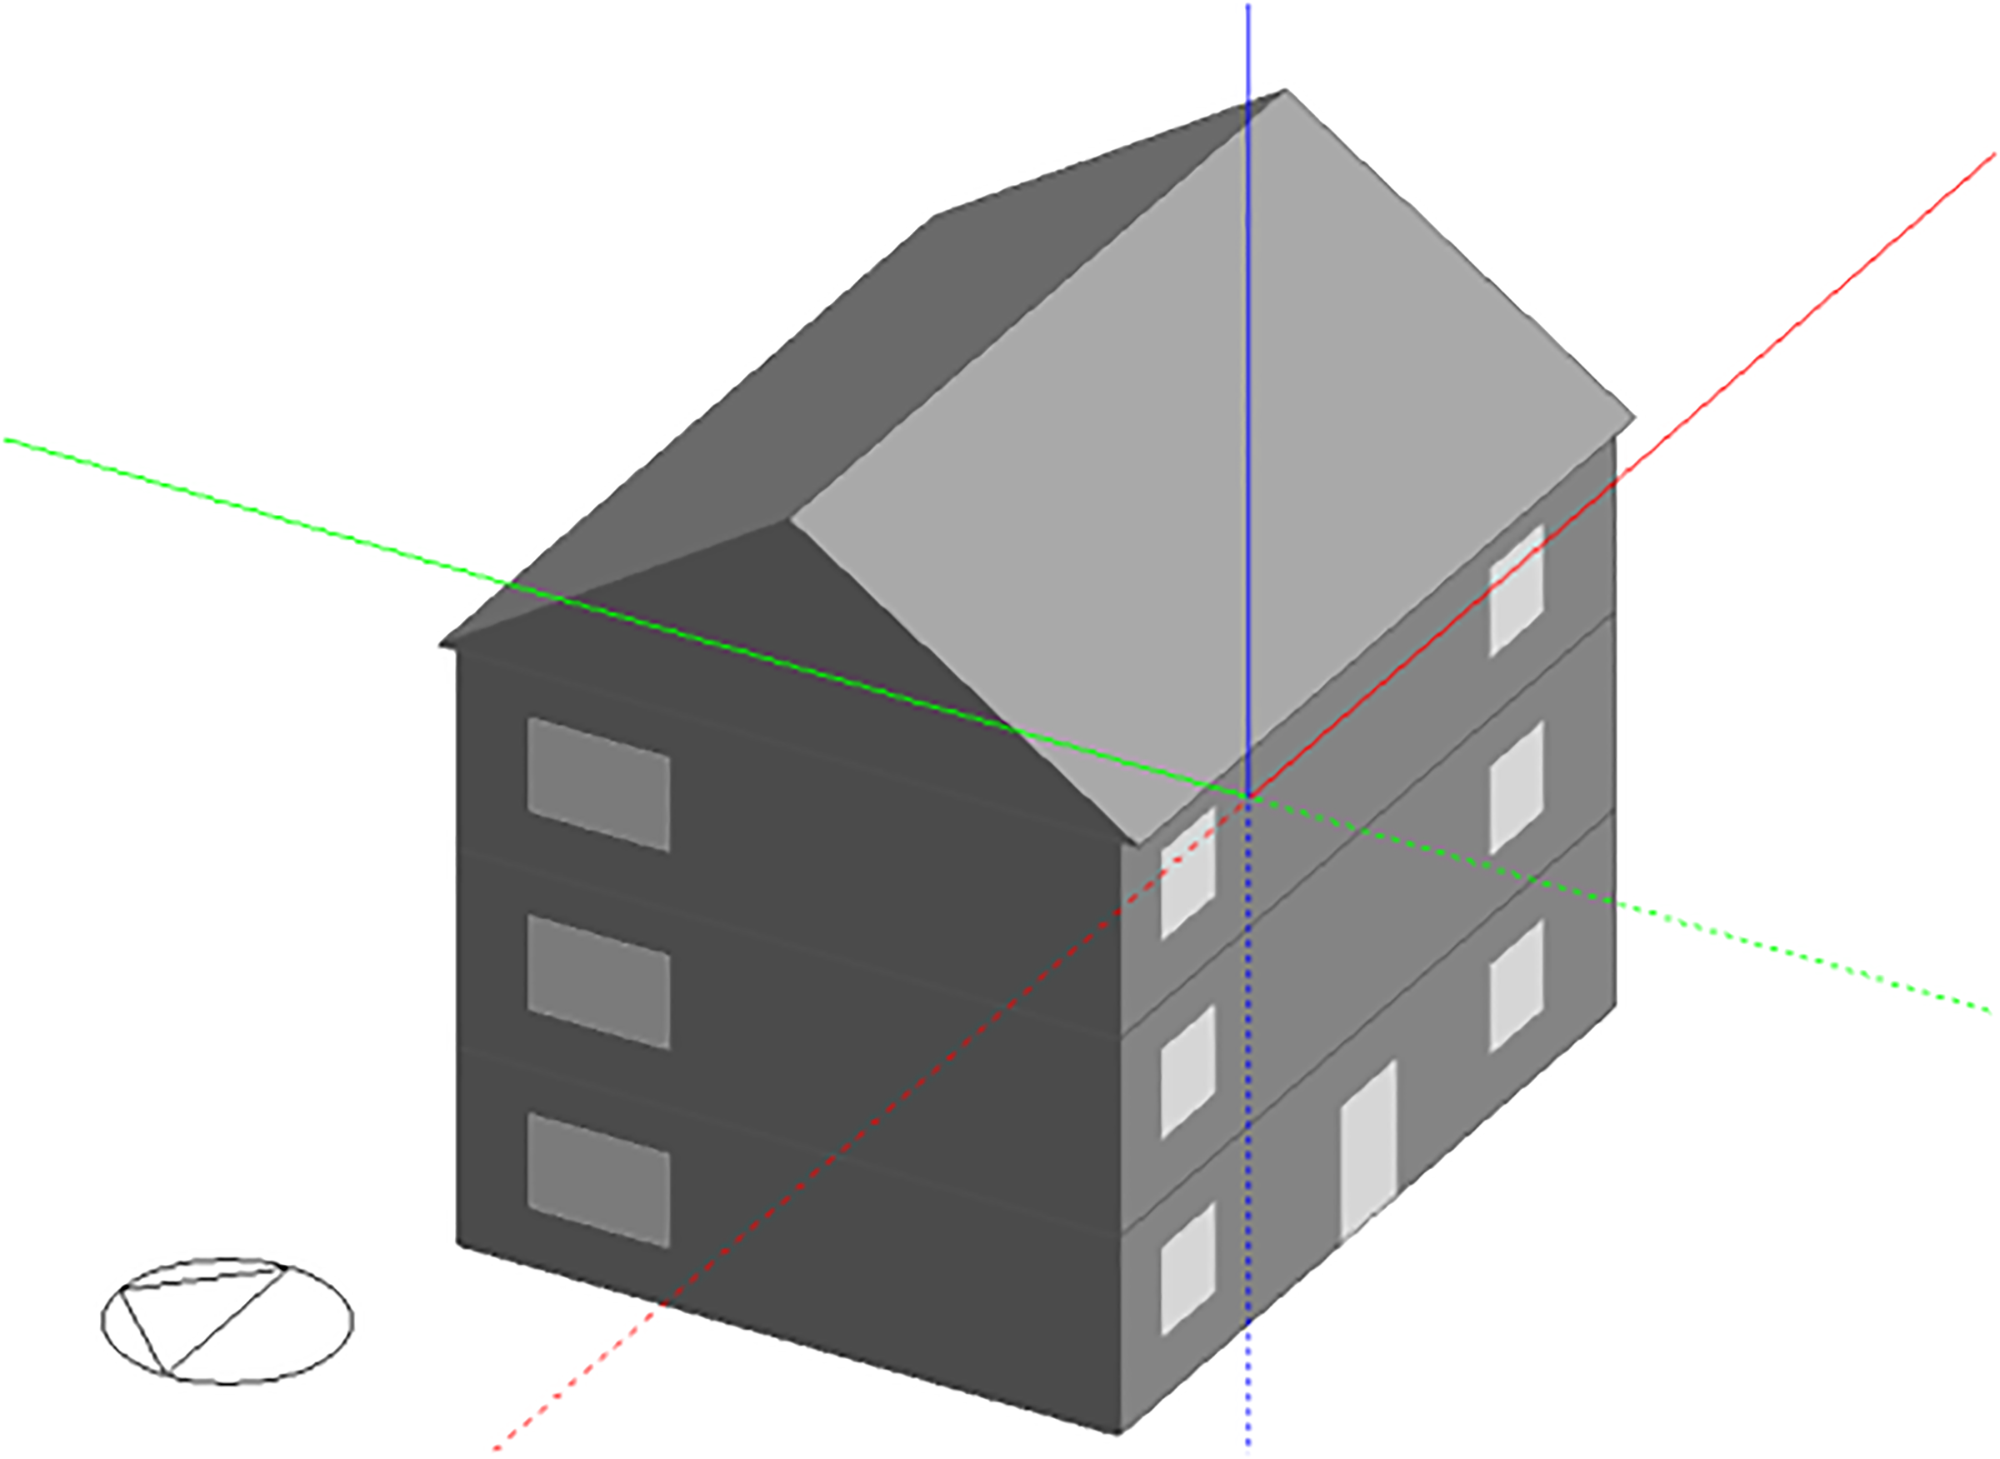
3D model of the sample building.
In DesignBuilder, zones are defined as areas within a building with different thermal properties such as temperature, humidity, and airflow. The building is divided into eight zones, as shown in Figure 3: vestibule, bathroom, bedroom, entrance, guest room, kitchen, living room, and stairs. The entrance refers to the apartment space in the building. The stairs are those located in the apartment void.
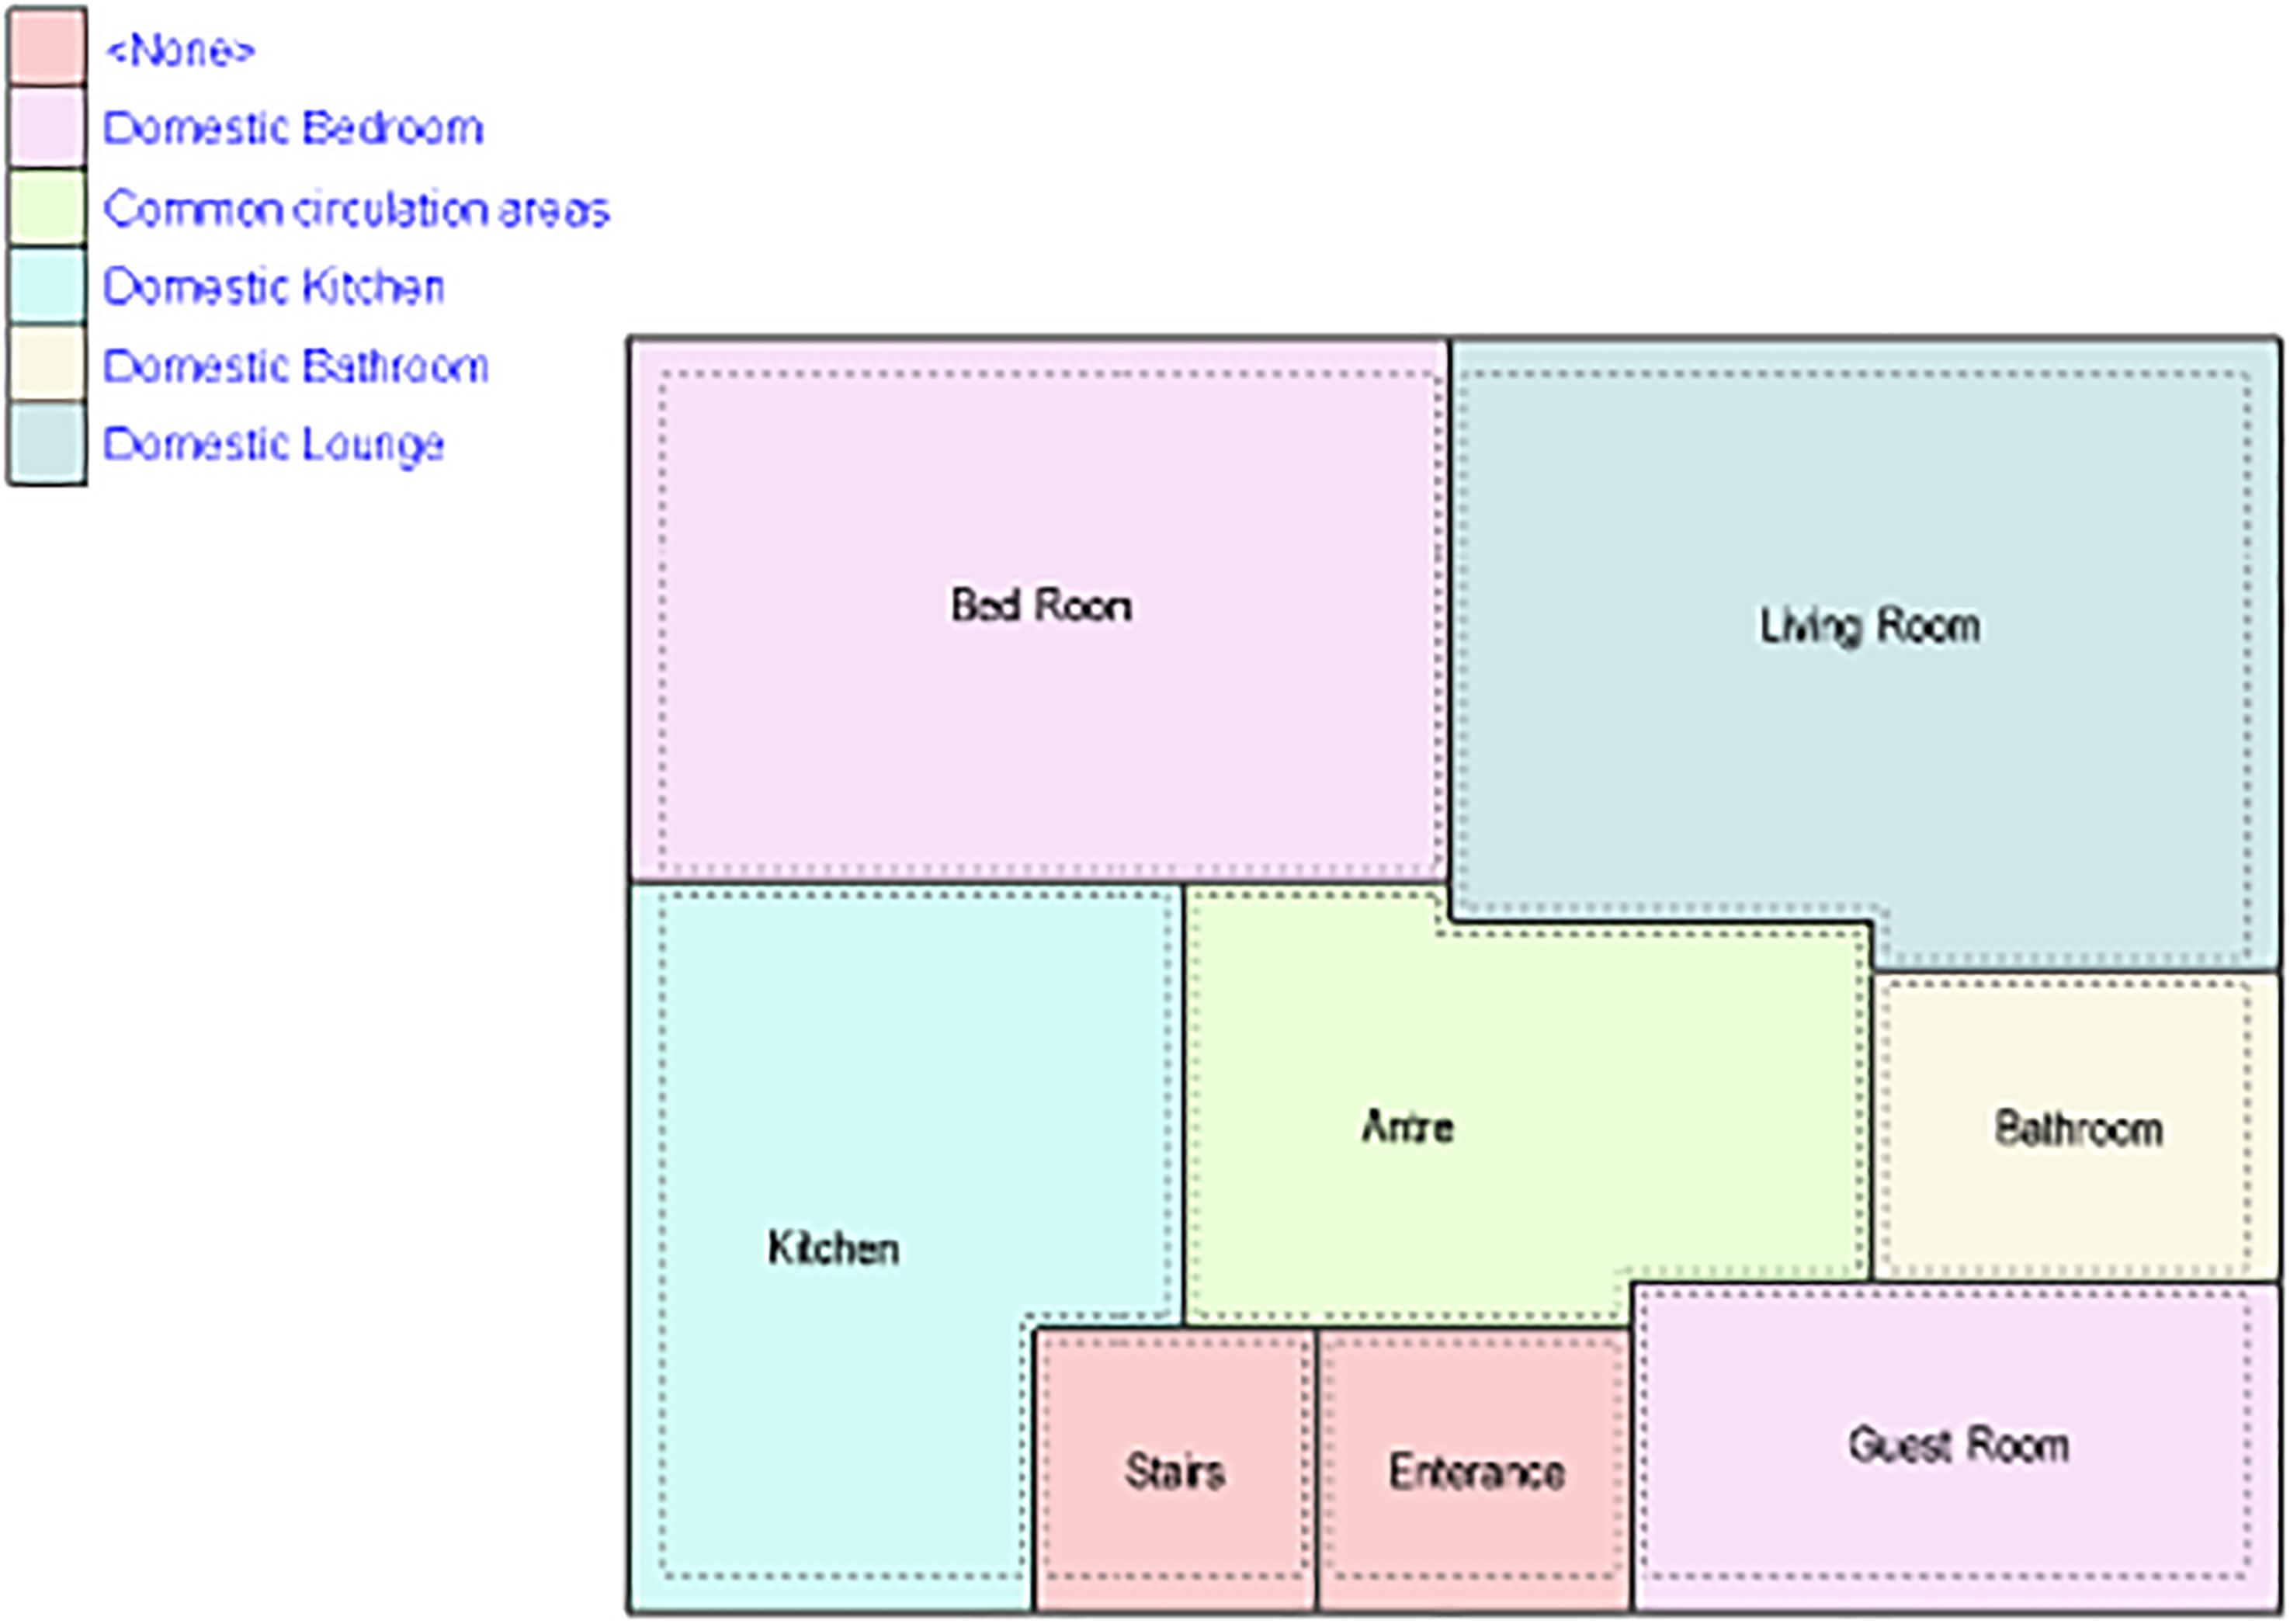
Zones of a sample residential building.
Input of the climatic parameters
Izmir is located in the Mediterranean climate zone, with hot and dry summers and mild and rainy winters. The latitude of Izmir, Turkey is 38.52, and the longitude is 27.02. The average annual temperature in Izmir is between 16 °C and 17 °C (Izmir Governorship, 2022). For climate parameters, climate data with “.epw” extension embedded in the DesignBuilder program were used. These data were created from the climatic design data of the American Society of Heating, Refrigerating and Air Conditioning Engineers (ASHRAE) standards. The DesignBuilder program uses the average of the average climate values over the last 25 years. The sample building is located in the Mediterranean climate zone and in ASHRAE climate zone 3A.
Input of the structural and lighting parameters
The structural parameters include variables such as floor area, height, wall composition, roof type, and window features. These parameters provide important information to accurately model the thermal behavior and energy performance of a building. The structural components of the building were determined using the “Construction,” “Openings,” and “Lightning” tabs in the DesignBuilder program.
The building components and window details of the sample residential building are given in Table 1. The defined building components were determined according to TS 825-Thermal Insulation Rules in Buildings (İzocam, 2013).
Sample building structural components.
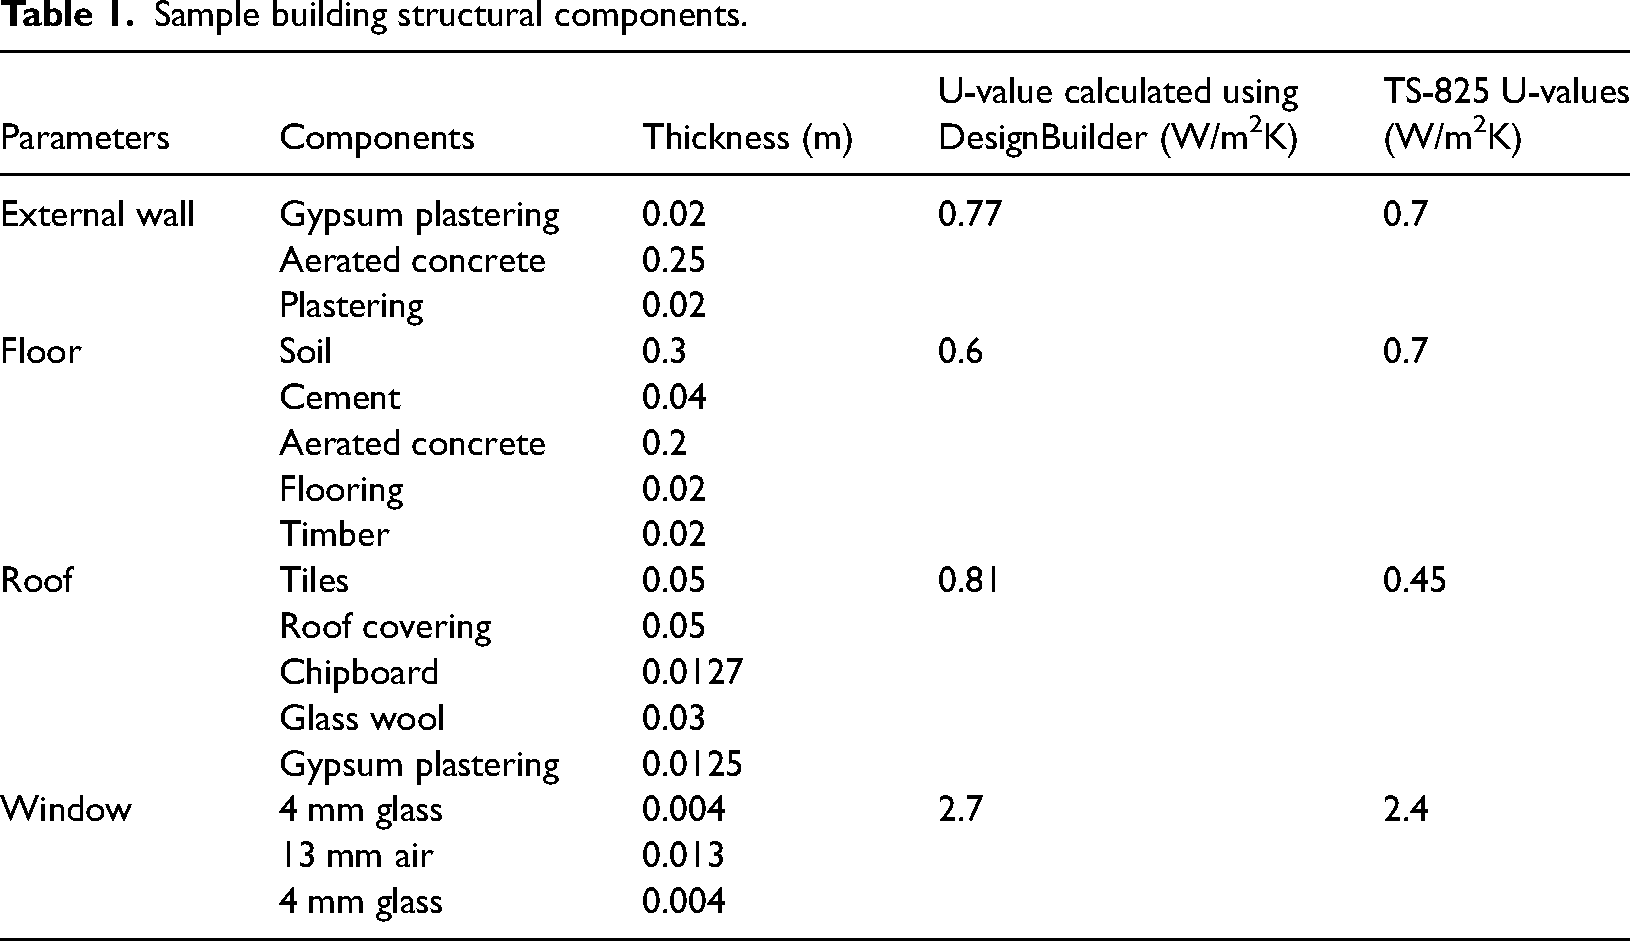
When the sample building structural components given in Table 1 are examined, it can be seen that no insulation material was used on the external wall. There is insulation on the roof with 3 cm of glass wool. The sample building complies with the standards set by TS-825 for walls and flooring, except for windows and roof. Air-filled double-glazed (4/13/4 mm) aluminum-framed windows were used. The calculated U-value for windows is 2.7 W/m2K.
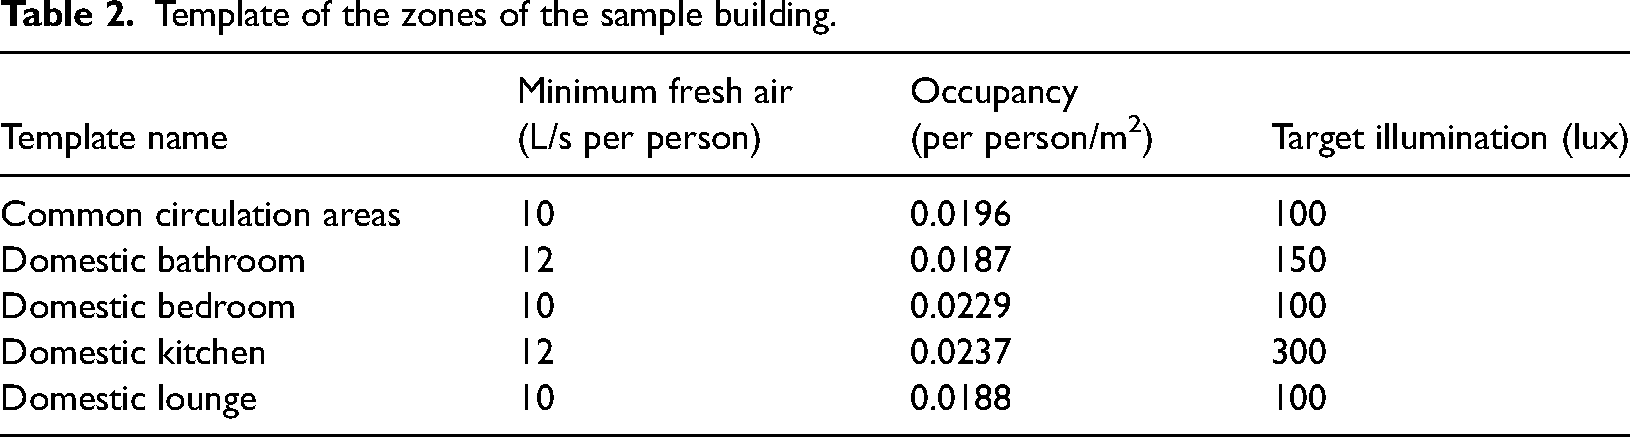
Activity template data provided with DesignBuilder are derived primarily from the U.K. National Calculation Methodology and ASHRAE 90.1 and 62.1 (DesignBuilder, 2022). Although the data are designed for use in the United Kingdom, it is also applicable to other countries. The values defined in each template are given in Table 2.
Template of the zones of the sample building.
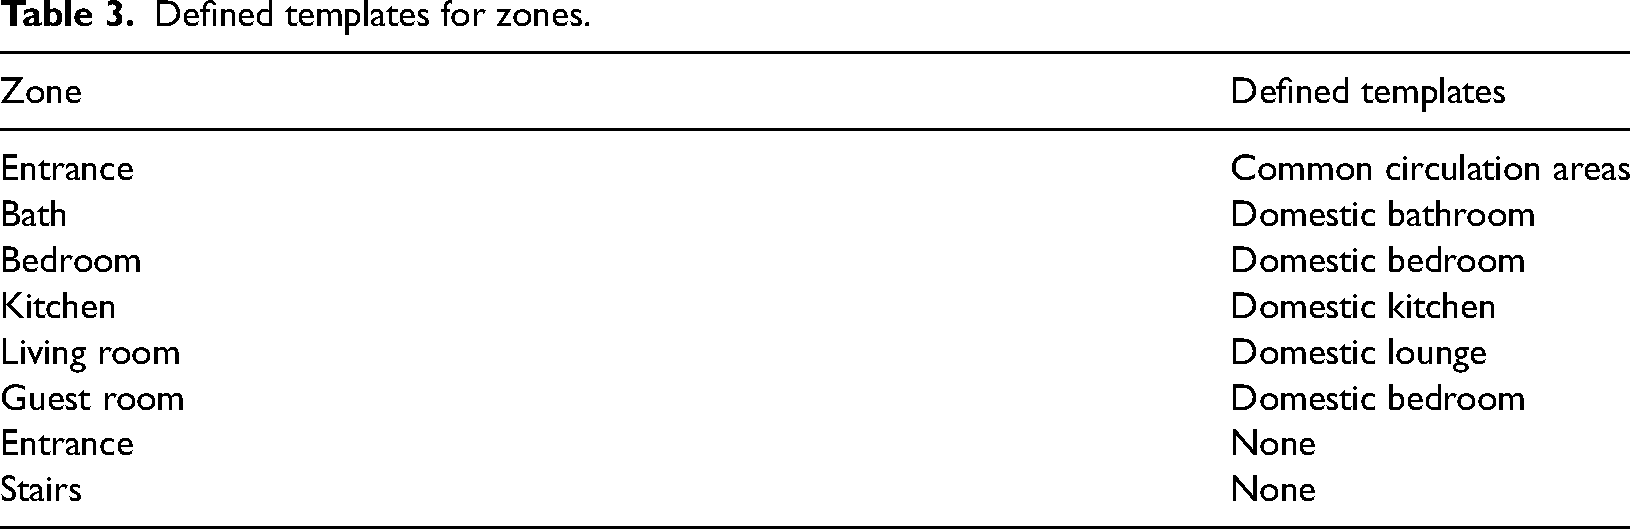
The template names defined for the building zones are given in Table 3. No template is defined for the entrance and staircase zones. The entrance zone represents the entrance of the building. Stairs represent the area where the stairs are located in the apartment. It is assumed that there are no heating and cooling elements, no lighting, and no occupancy in these areas.
Defined templates for zones.
In the simulation data entry of the existing building, the air infiltration rate, which is an indicator of the building occupancy value, is expressed in air changes per hour (ac/h) and is taken as 0.3 ac/h, which is in accordance with the ASHRAE standard.
In the “Lightning” tab of DesignBuilder, the building's lighting power density data entries are included in W/m2. The lighting layout was chosen as the hanging type. In the sample building, tungsten lamps with a normalized power density of 28 W/m2-100 lux are used. The lighting hourly calendar is selected as “Dwell_DomCommonAreas_Light.” For all other zones, data entry was completed by changing only the lighting plan.
Input of HVAC parameters and designing a DHW system
The heating temperature of the sample building is controlled at 20 °C, and when the temperature exceeds 24 °C, the cooling system is activated. It is assumed that a package terminal heat pump (PTHP) is used for cooling. Heating is provided by the forced circulation of 75 °C hot water produced by a centrally system natural gas-fuelled, three-pass, scotch-type steel hot water boiler through panel radiators. Heating is provided through radiators in the entrance, kitchen, and bathroom zones of the sample building, but cooling is not provided. HVAC systems were modeled using the “Detailed HVAC” option in Design Builder. Another option, “Simple HVAC,” was not preferred. The detailed HVAC system in DesignBuilder provides simulation results with a higher level of accuracy by considering thermal properties and airflow dynamics. In the guest room, bedroom, and living room, heating is provided by radiators and cooling is provided by PTHP.
The DHW loop includes one or more water heaters connected in series or parallel, a flow separator, and a circulation pump with a flow mixer. The DHW setting temperature is fixed at 55 °C. The DHW loop includes a flow splitter and flow mixer so that the loop can be connected to hot water outlets (DesignBuilder Software, 2009). DHW design is shown in Figure 4.
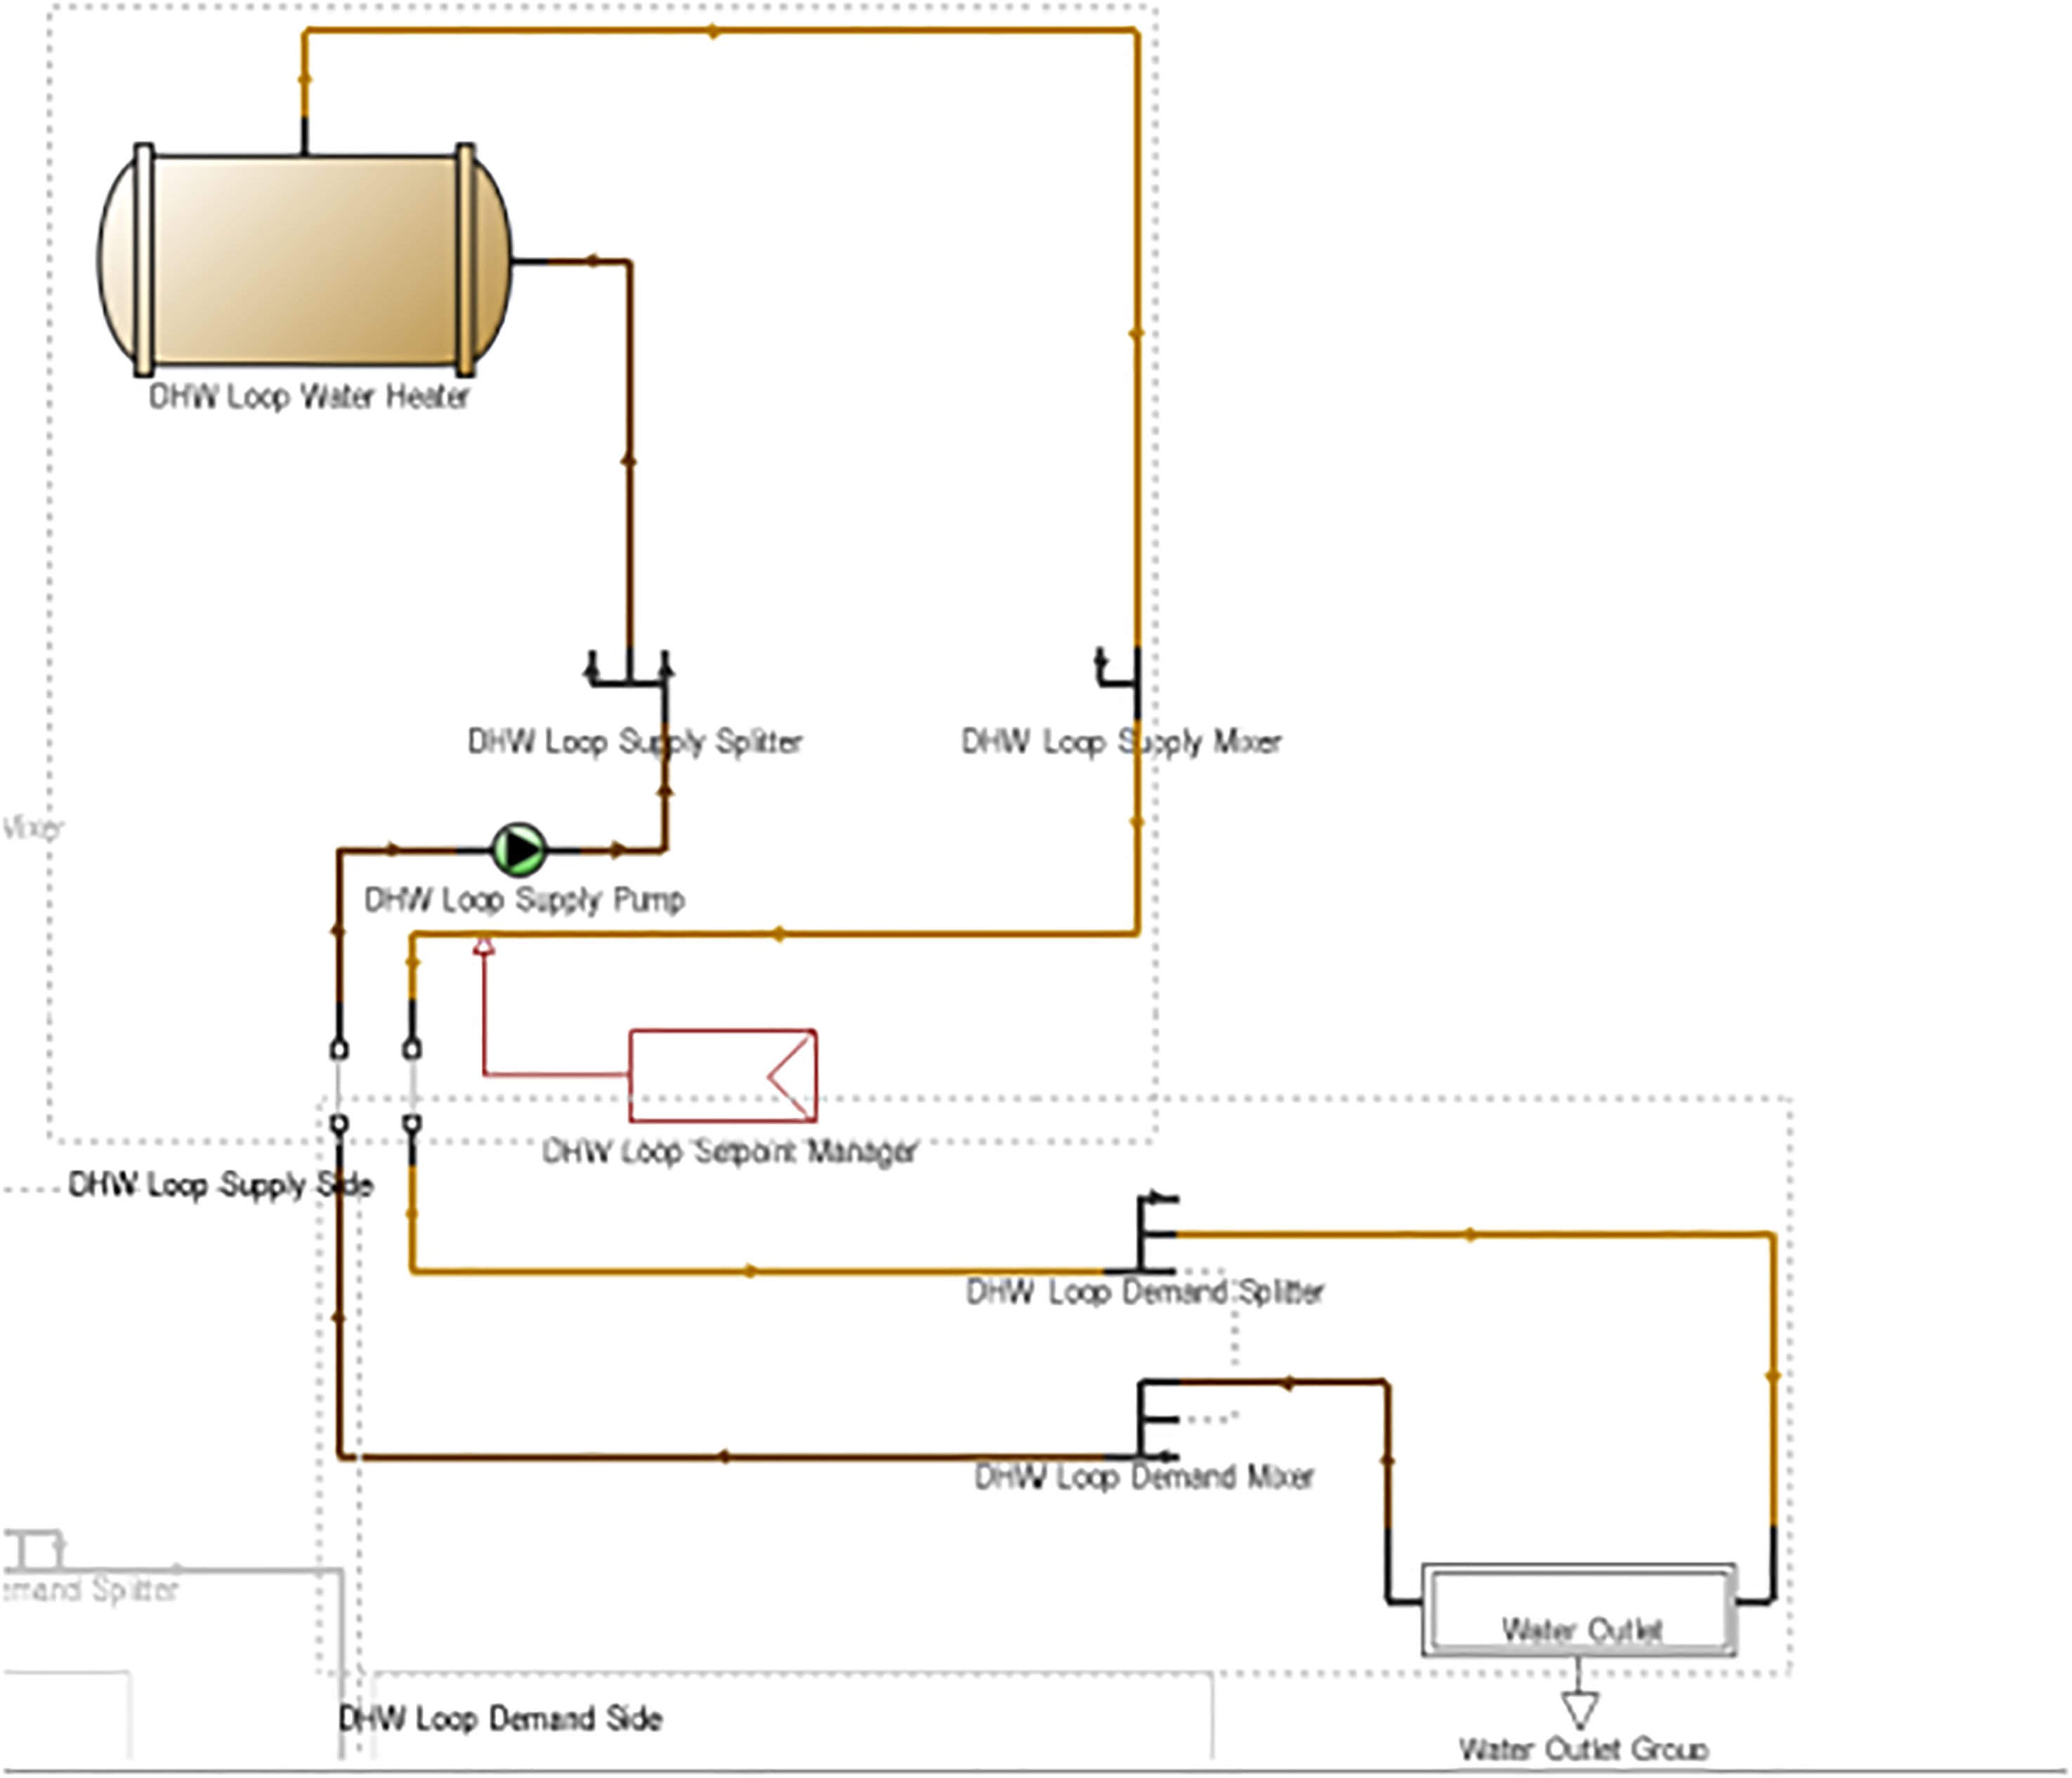
Domestic hot water design.
In DesignBuilder, the term “water outlet” typically refers to a component or fixture in a building's plumbing system that allows water to be discharged. It refers to items such as sinks, faucets, showers, and other similar fixtures through which water is released. The “peak flow rate” was selected as 0.00000100.
Energy simulation of the sample building
The simulation was carried out with the DesignBuilder program for the building reference scenario, and annual energy consumption data for heating, cooling, DHW, lighting, equipment, and fan loads were obtained as shown in Table 4.
Energy consumption and emission values for the reference scenario.
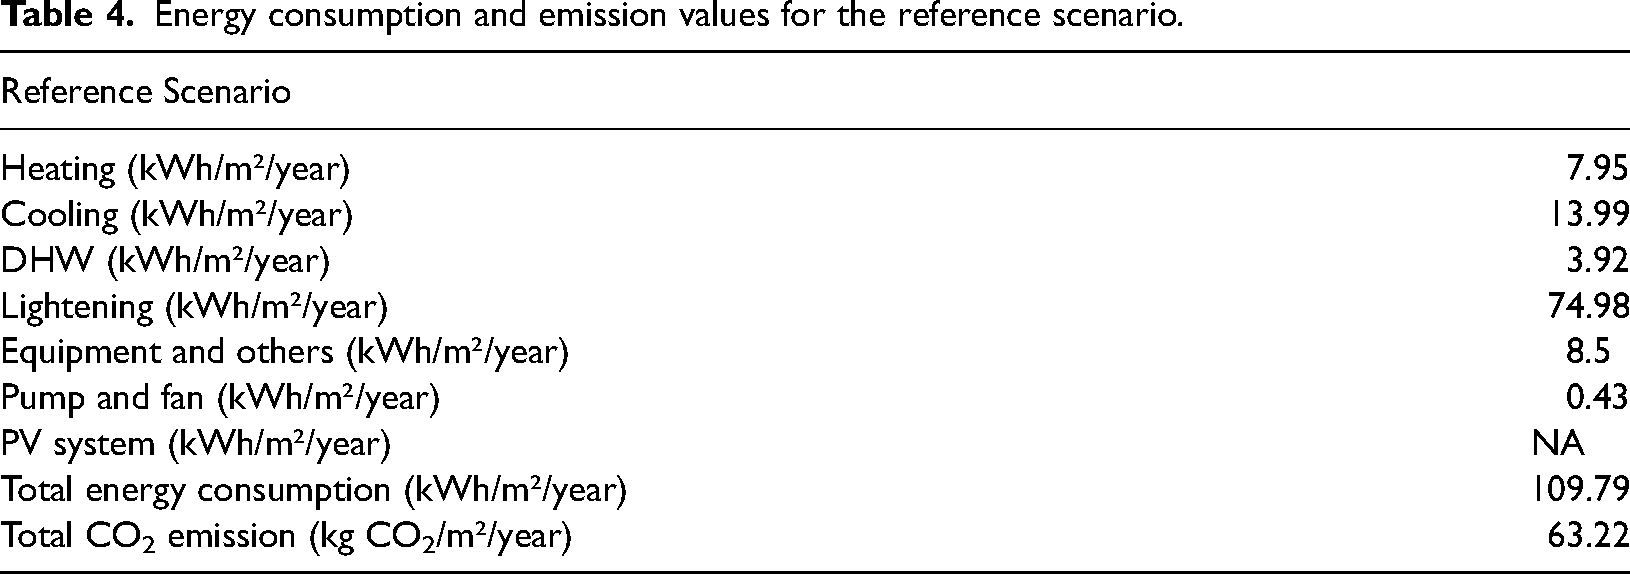
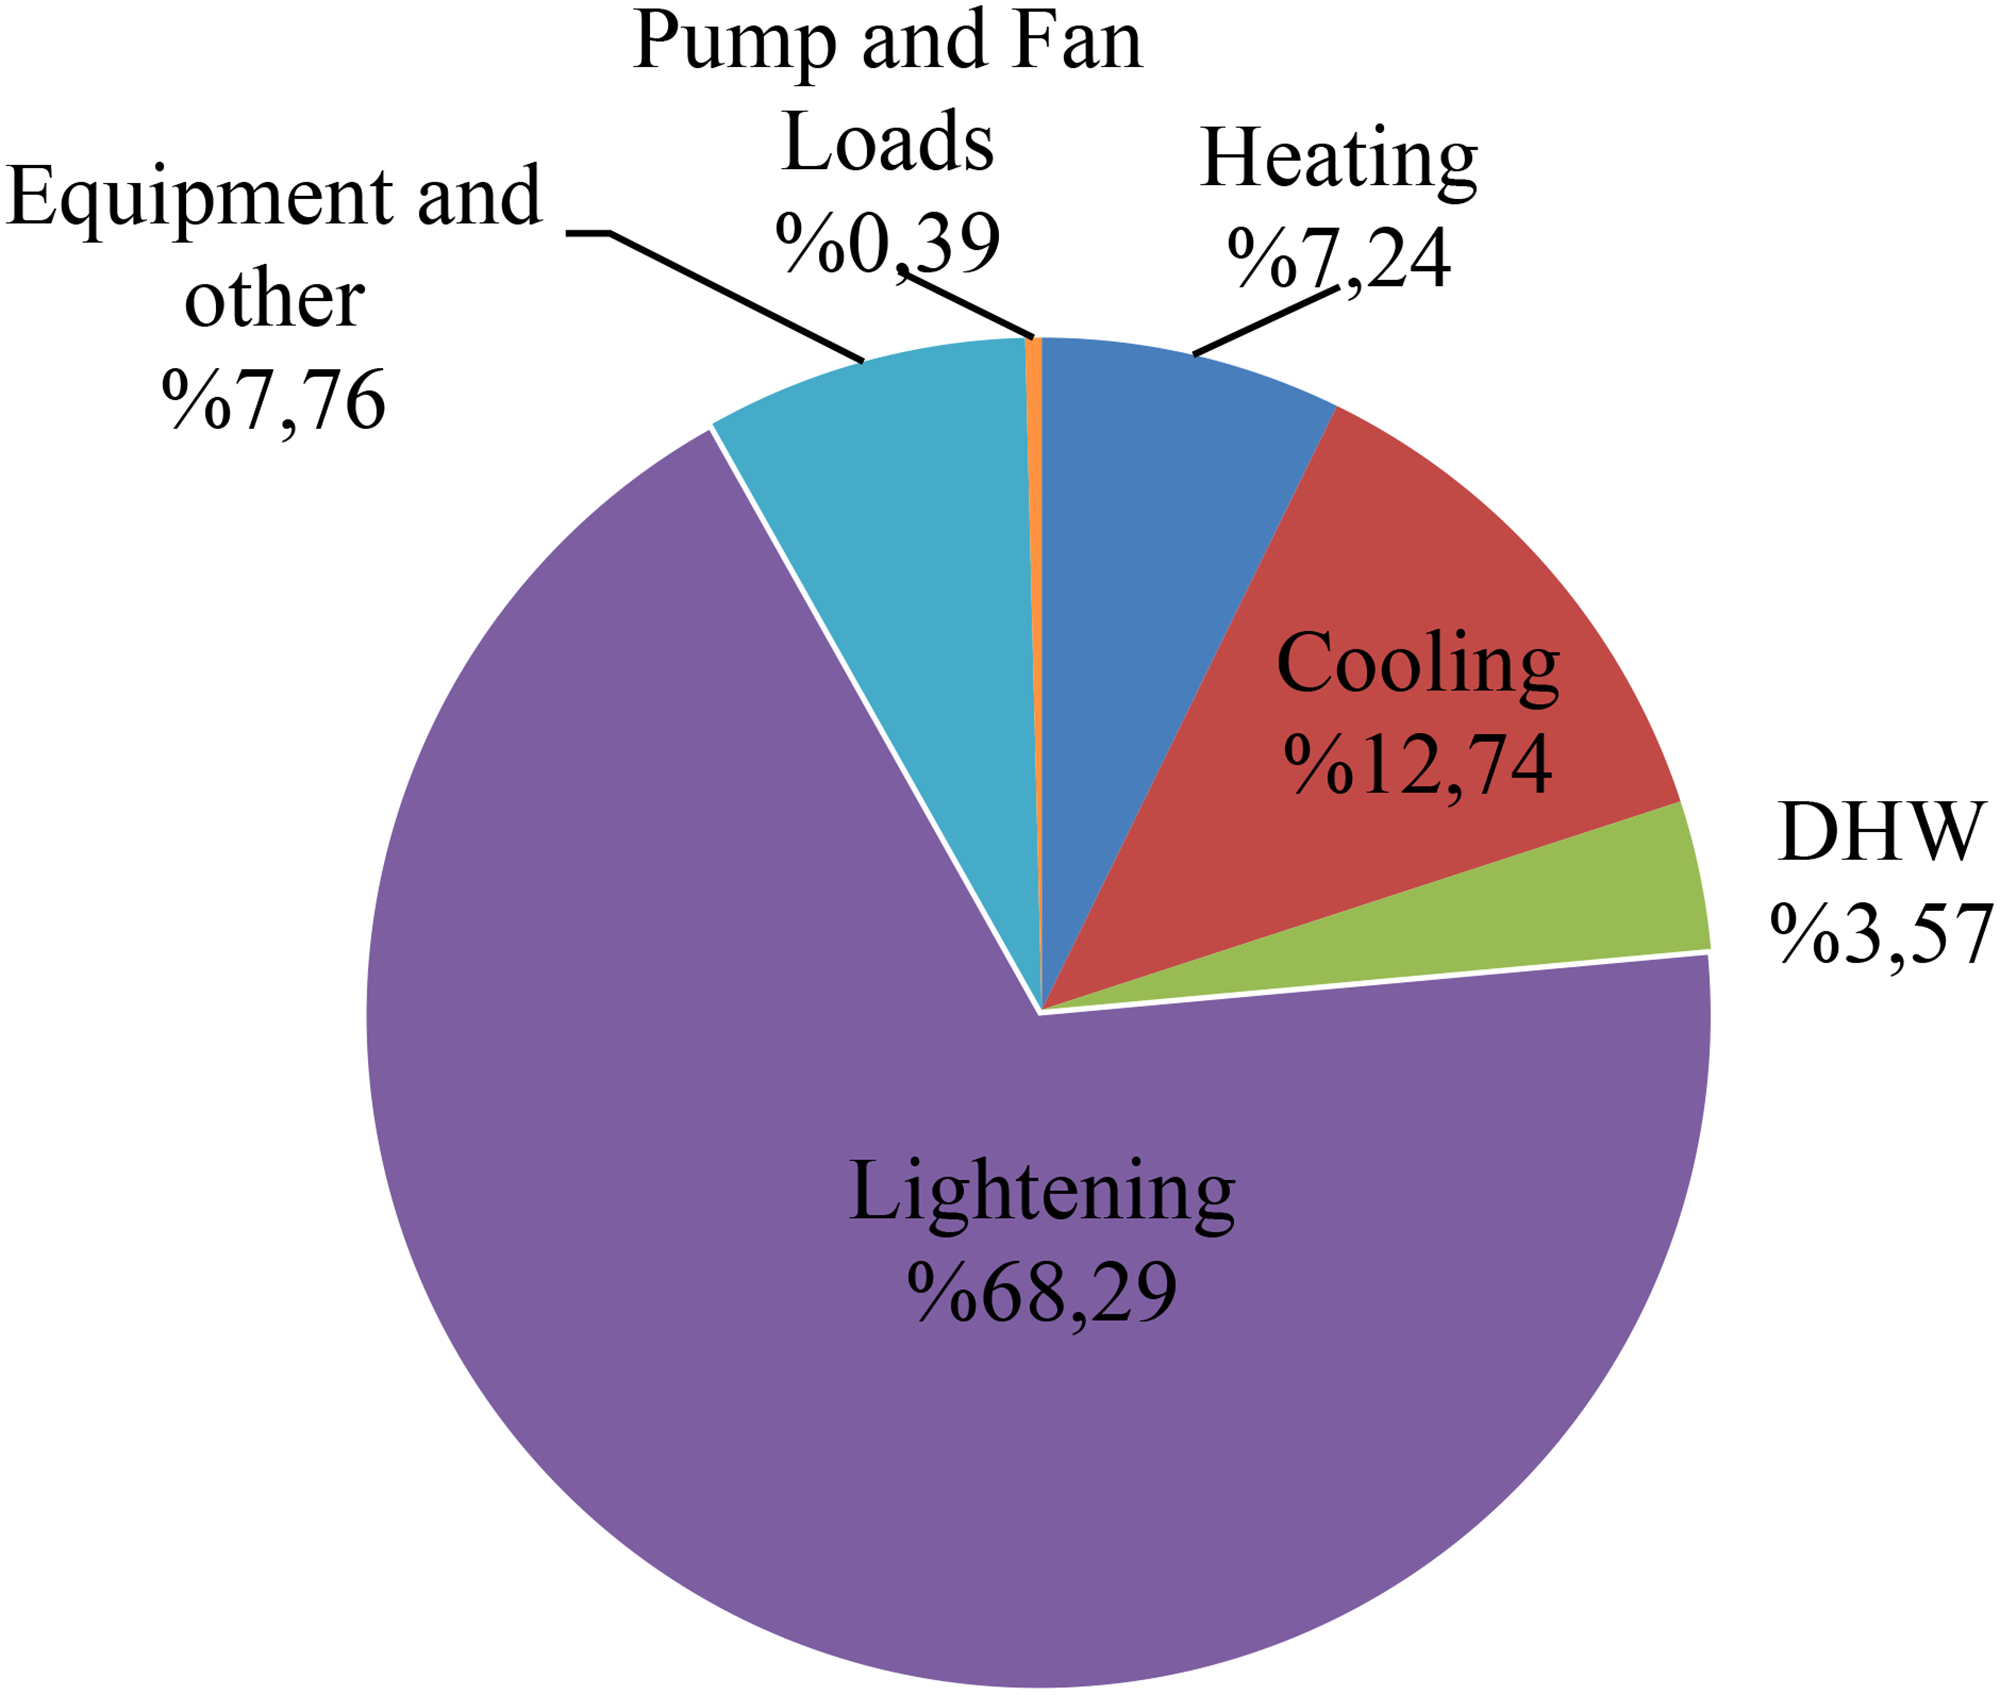
In Table 4, “Equipment and others” refers to the consumption incurred to operate various types of equipment used in the building, such as computers, refrigerators, and other electrical appliances. The power density for computer use is set to 10 W/m2, and the power density for kitchen equipment is set to 15 W/m2. When the breakdown of energy consumption in the reference residential building was examined, it was determined that the total annual energy consumption was 109.79 kWh/m²/year and the annual carbon emission value was 63.22 kg CO2/m²/year. The annual energy consumption from building lighting corresponds to 74.98 kWh/m²/year. The annual energy consumption in the building was 13.99 kWh/m²/year due to cooling systems. The annual equipment-related energy consumption in the building is 8.5 kWh/m²/year, and the heating consumption is 7.95 kWh/m²/year. Equipment and others refers to the power required to operate equipment and other loads in the building, as well as internal hardware equipment such as computers, refrigerators, and other electrical appliances. The total annual energy consumption of the defined device loads is determined to be 8.5 kWh/m²/year. To enter the relevant consumption data, data were entered into the relevant zones in DesignBuilder. DHW caused energy consumption of 3.92 kWh/m²/year and pump and fan loads caused energy consumption of 0.43 kWh/m²/year. There is no renewable energy generation in the reference scenario. The breakdown of energy consumption in the reference residential building is given in Figure 5.
Breakdown of energy consumption in the sample residential building.
Lighting accounted for 68.29% of the existing building's energy consumption, followed by cooling at 12.74%. Equipment loads accounted for 7.76% and energy consumption for heating for 7.24%. The DHW load has a share of 3.57% and the energy consumption for pump and fan loads is 0.39%. Figure 6 shows the simulation results for the annual variation in heating and cooling energy consumption.
Simulation results of the annual variation of heating and cooling energy consumption.
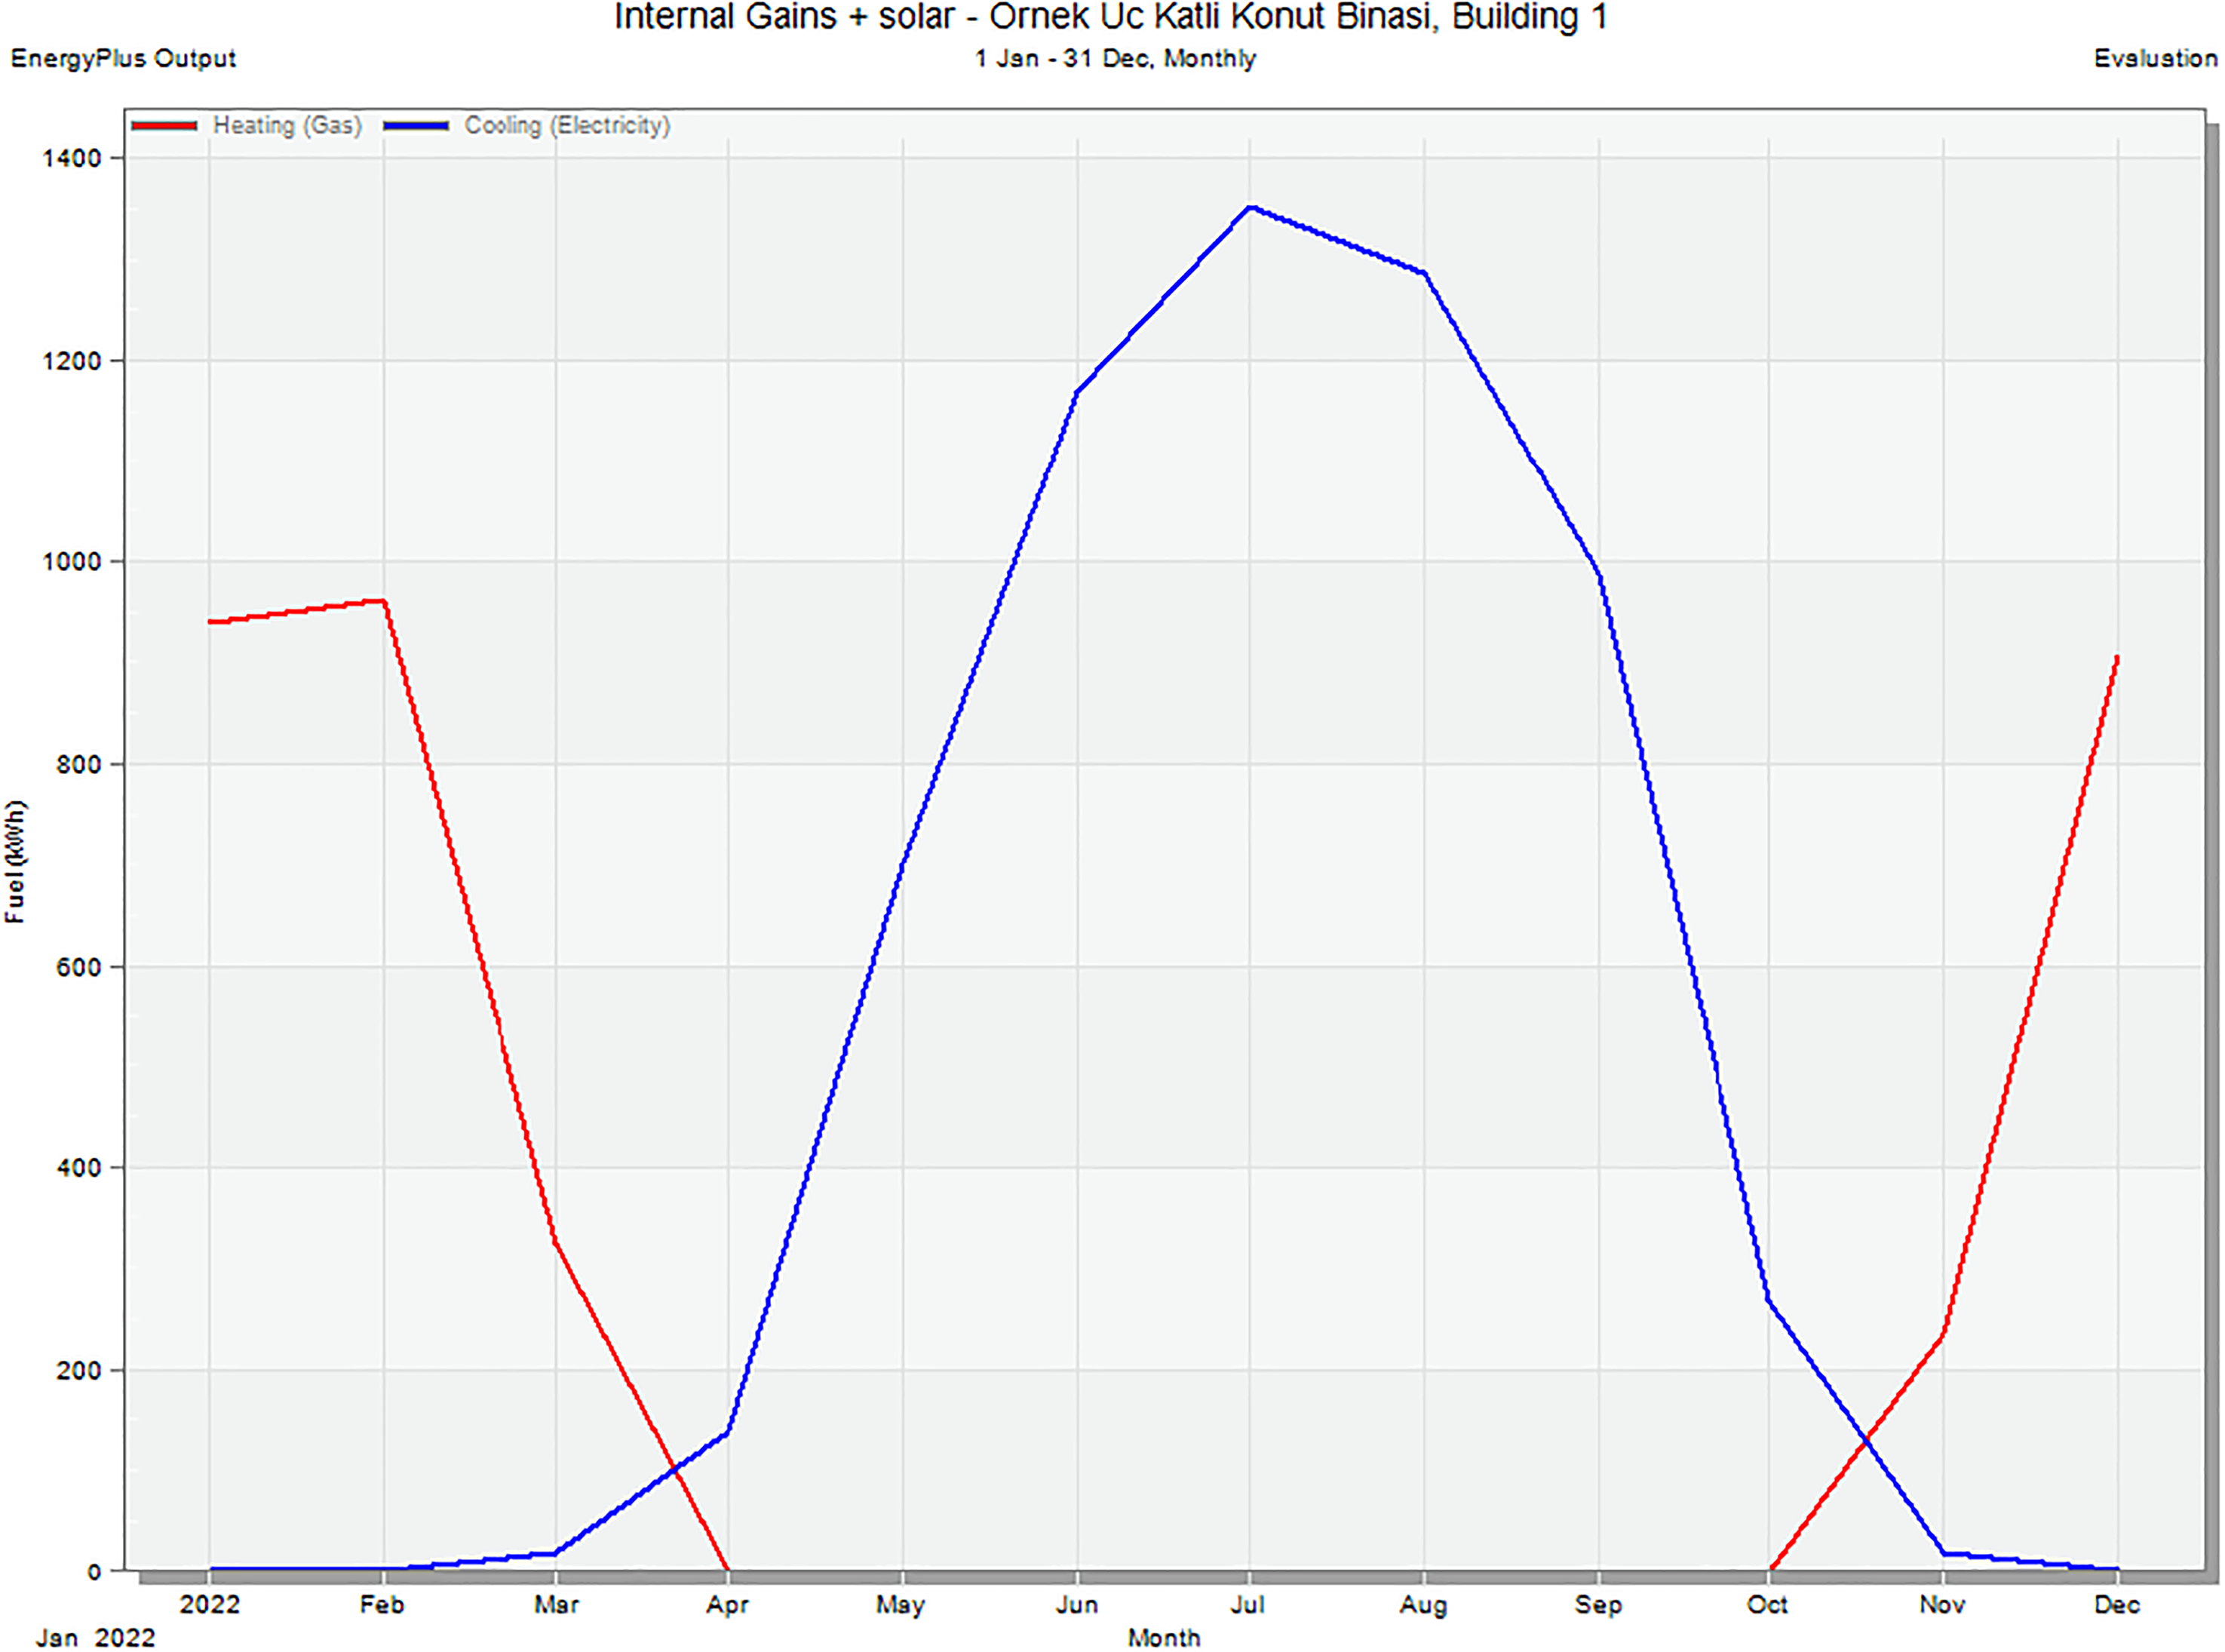
In the reference scenario, heating is provided by radiators and cooling by PTHP. The energy required for heating is met by natural gas and the energy required for cooling is met by electricity. Figure 9 shows that the natural gas energy consumed for heating starts to increase after October and reaches its highest value in February. It is seen that as the weather gets colder, the need for heating and therefore the consumption of natural gas increases and that the outdoor air temperature changes inversely proportional to the natural gas consumption in winter. Since the heating system is activated when the room temperature falls below 20 °C, natural gas consumption for heating in Izmir is zero between May and October, when the outside temperature cannot drop below 20 °C inside the dwelling. The electrical energy consumed for cooling shows an increasing acceleration during the summer months and reaches a maximum value in July. It decreases slightly in August and gradually decreases in the following months. In cooling, energy consumption varies in direct proportion to the outside air temperature. Since the cooling system is activated when the room temperature rises above 24 °C, cooling energy consumption will be zero at temperatures below this.
Annual CO2 emissions of the scenarios.
Determination of retrofit scenarios for transforming the sample building into an NZEB and performing energy analyses
To transform the existing building into an NZEB, eight retrofit scenarios covering active and passive energy efficiency measures were identified. The retrofit scenarios determined for the NZEB transformation are given in Table 5.
Retrofit scenarios identified for the NZEB transformation.
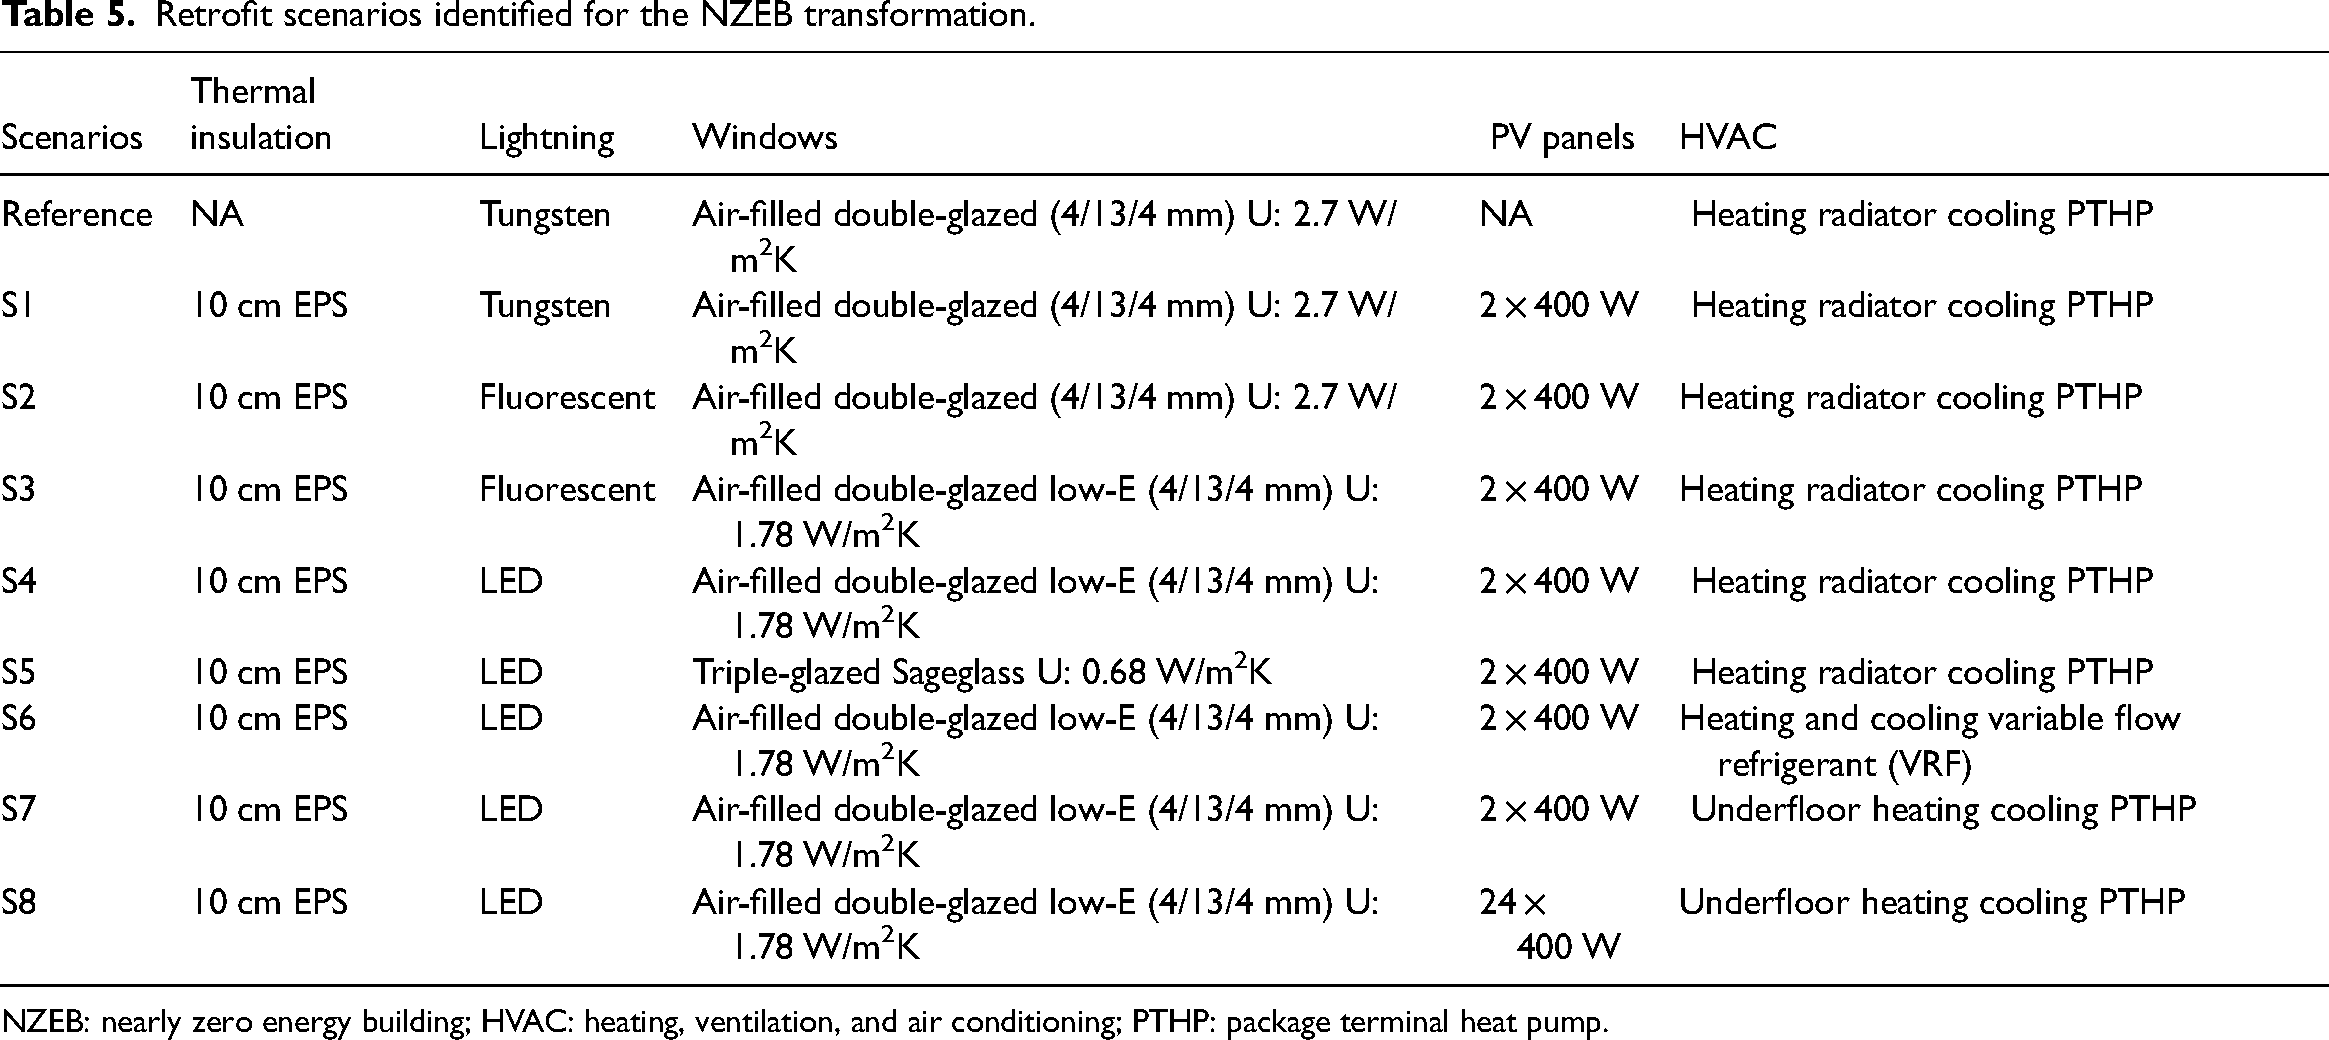
NZEB: nearly zero energy building; HVAC: heating, ventilation, and air conditioning; PTHP: package terminal heat pump.
A combination of active and passive retrofits for both new and existing buildings should be used to achieve high levels of energy savings (BCSD Türkiye, 2020; Hu et al., 2021). This study aims to reduce building energy intensity by implementing scenarios including active and passive retrofits. The reference scenario represents the building in its current state without any retrofit. In each retrofit scenario, a parameter affecting the energy performance of the building is changed and the changes are compared.
When the retrofit scenarios in Table 5 are realized, the Energy Consumption and Emission Values obtained from the analysis using the DesignBuilder program are given in Table 6.
Breakdown of energy consumption and emission values for retrofit scenarios.
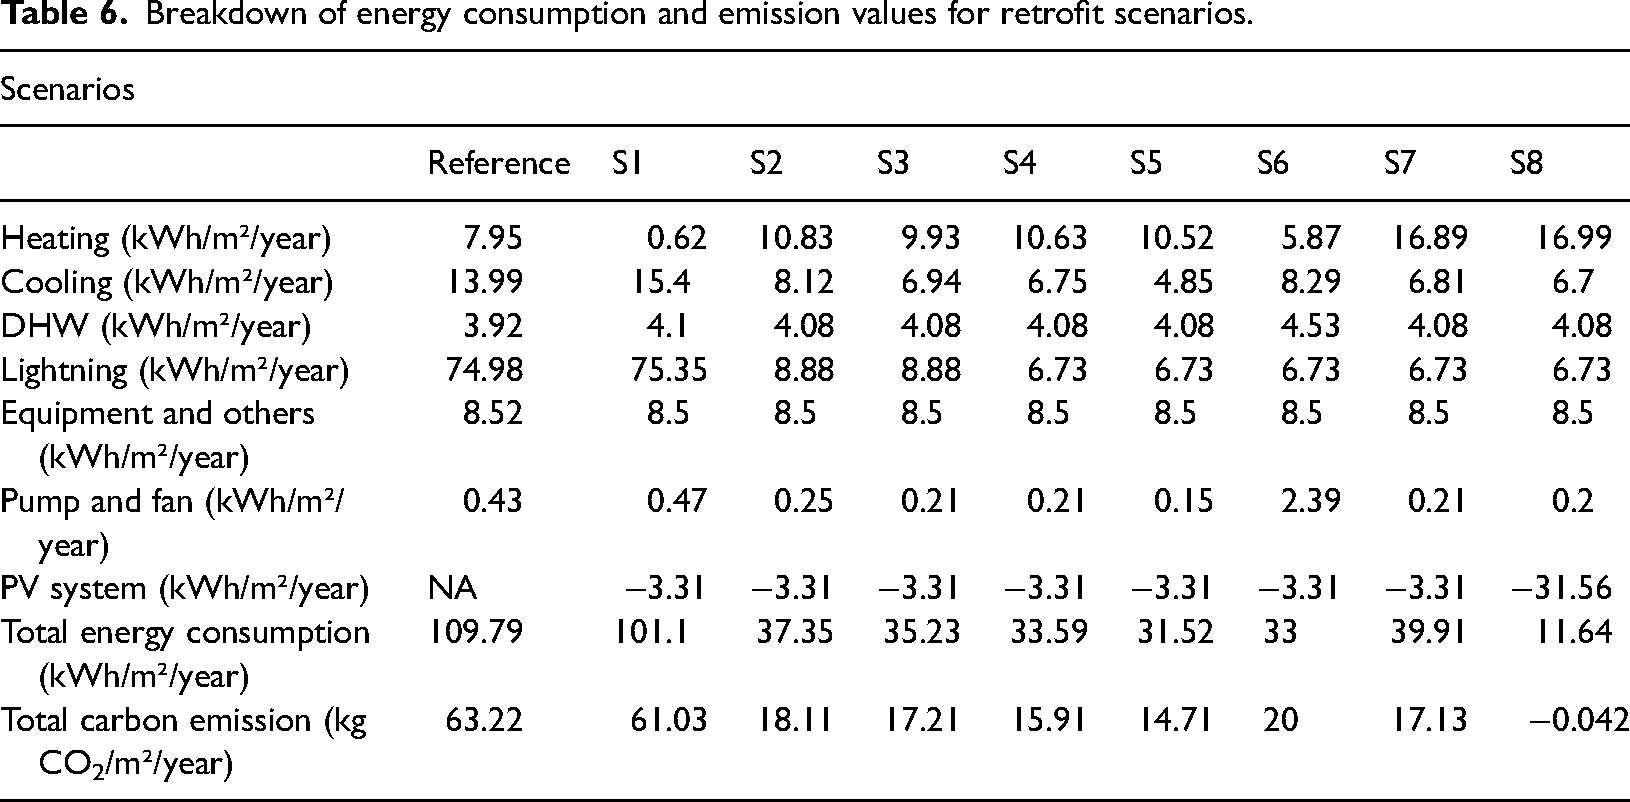
The energy consumption values given in Table 6 are the final energy consumption values obtained from the analysis results of the DesignBuilder program. As a result of the improvements made within the scope of S1; it was seen that insulating the building reduced the annual energy consumption by 4.87% compared to the reference scenario. There is a decrease in the heating loads of the building and an increase in the cooling, DHW, lighting, equipment, pump, and fan loads. Emission value also decreased compared to the reference case. In S1, since EPS insulation was used, heat energy was absorbed inside the building. Therefore, energy consumption for heating in the building decreased, while energy consumption for cooling increased. As a result of the improvements made in S2, it was determined that the use of fluorescent lamps for lighting reduced the annual energy consumption by 63.07% compared to S1. In S2, cooling loads decreased while heating loads increased compared to S1. The reason for this is that the heat energy passing to the environment decreases compared to tungsten since fluorescent lamps are used. DHW, lighting, pump, and fan loads also increased. Equipment and other loads remained constant. Emissions also decreased compared to the S1. As a result of the improvements made in S3, it was observed that Low-E coated glass reduced the total annual energy consumption by 5.68% compared to S2. In S3, compared to S2, the building's heating, cooling, pump, and fan loads are reduced. DHW, lighting, equipment, and other loads remained constant. The emission value has also decreased compared to the S2. In retrofit S4, a 4.65% reduction in annual energy consumption compared to S3 was observed when LED lamps were used instead of fluorescent lamps. In S4, there is a decrease in the cooling and lighting loads and an increase in the heating loads of the building compared to S3. DHW, equipment and other and pump and fan loads remained constant. The emission value has also decreased compared to the S3. In retrofit S5, a 6.16% reduction in annual energy consumption compared to S4 was observed when new generation triple-glazed sageglass and PVC frame were used instead of Low-E glass. In S5, there is a reduction in the heating, cooling, pump, and fan loads of the building compared to S4. The DHW, lighting, equipment and other loads remained constant. The emission value has also decreased compared to S4. In retrofit S6, when VRF is used as the HVAC system, a 0.59% reduction in annual energy consumption compared to S4 is observed. In S6, a reduction in the heating loads of the building is observed compared to S4. Since cooling is done with VRF, heating loads are reduced compared to the radiator system and cooling loads are increased compared to PTHP. DHW and pump and fan loads increased, while lighting and equipment and other loads remained constant. Emissions also decreased compared to the S4. In S7, there is an increase in heating and cooling loads compared to S4, while DHW, lighting, equipment and other and pump and fan loads remain constant. In S7, an increase in heating and cooling loads is observed compared to S6. DHW consumption and pump and fan loads decreased, while lighting and equipment and other loads remained constant. Heating loads increased compared to the VRF system due to the fact that VRF is air-to-air heat transfer and underfloor heating is water-to-air transfer. The time it takes for the system with underfloor heating and the system with VRF to reach the ambient temperature is different. The emission value also increased compared to the S6. In S8, it is seen that the building meets more than 120.25% of its electrical energy needs from PV panels with 24 PV panels. Comparing S8 with S7, there is an increase in heating loads and a decrease in cooling and pump and fan loads. No change was observed in DHW, lighting and equipment and fan loads. The emission value has also decreased compared to the S7. The reason for the slight changes in DHW during the analysis period is due to the drainage in the VRF. The breakdown of energy consumption according to final energy consumption values is given in Figure 7. When S6 is compared with both S5 and S7, it is seen that the cooling energy consumption is significantly higher. The cooling energy loads are 4.85 kWh/m²/year, 8.29 kWh/m²/year, and 6.81 kWh/m²/year respectively. It can be inferred that PTHP provides much more energy-efficient cooling compared to VRF. It is also seen that the largest cooling energy consumption is in S6 compared to all scenarios except the reference scenario and S1 where tungsten lamps are used. Considering that tungsten lamps convert most of the energy into heat instead of light, high cooling consumption is expected.
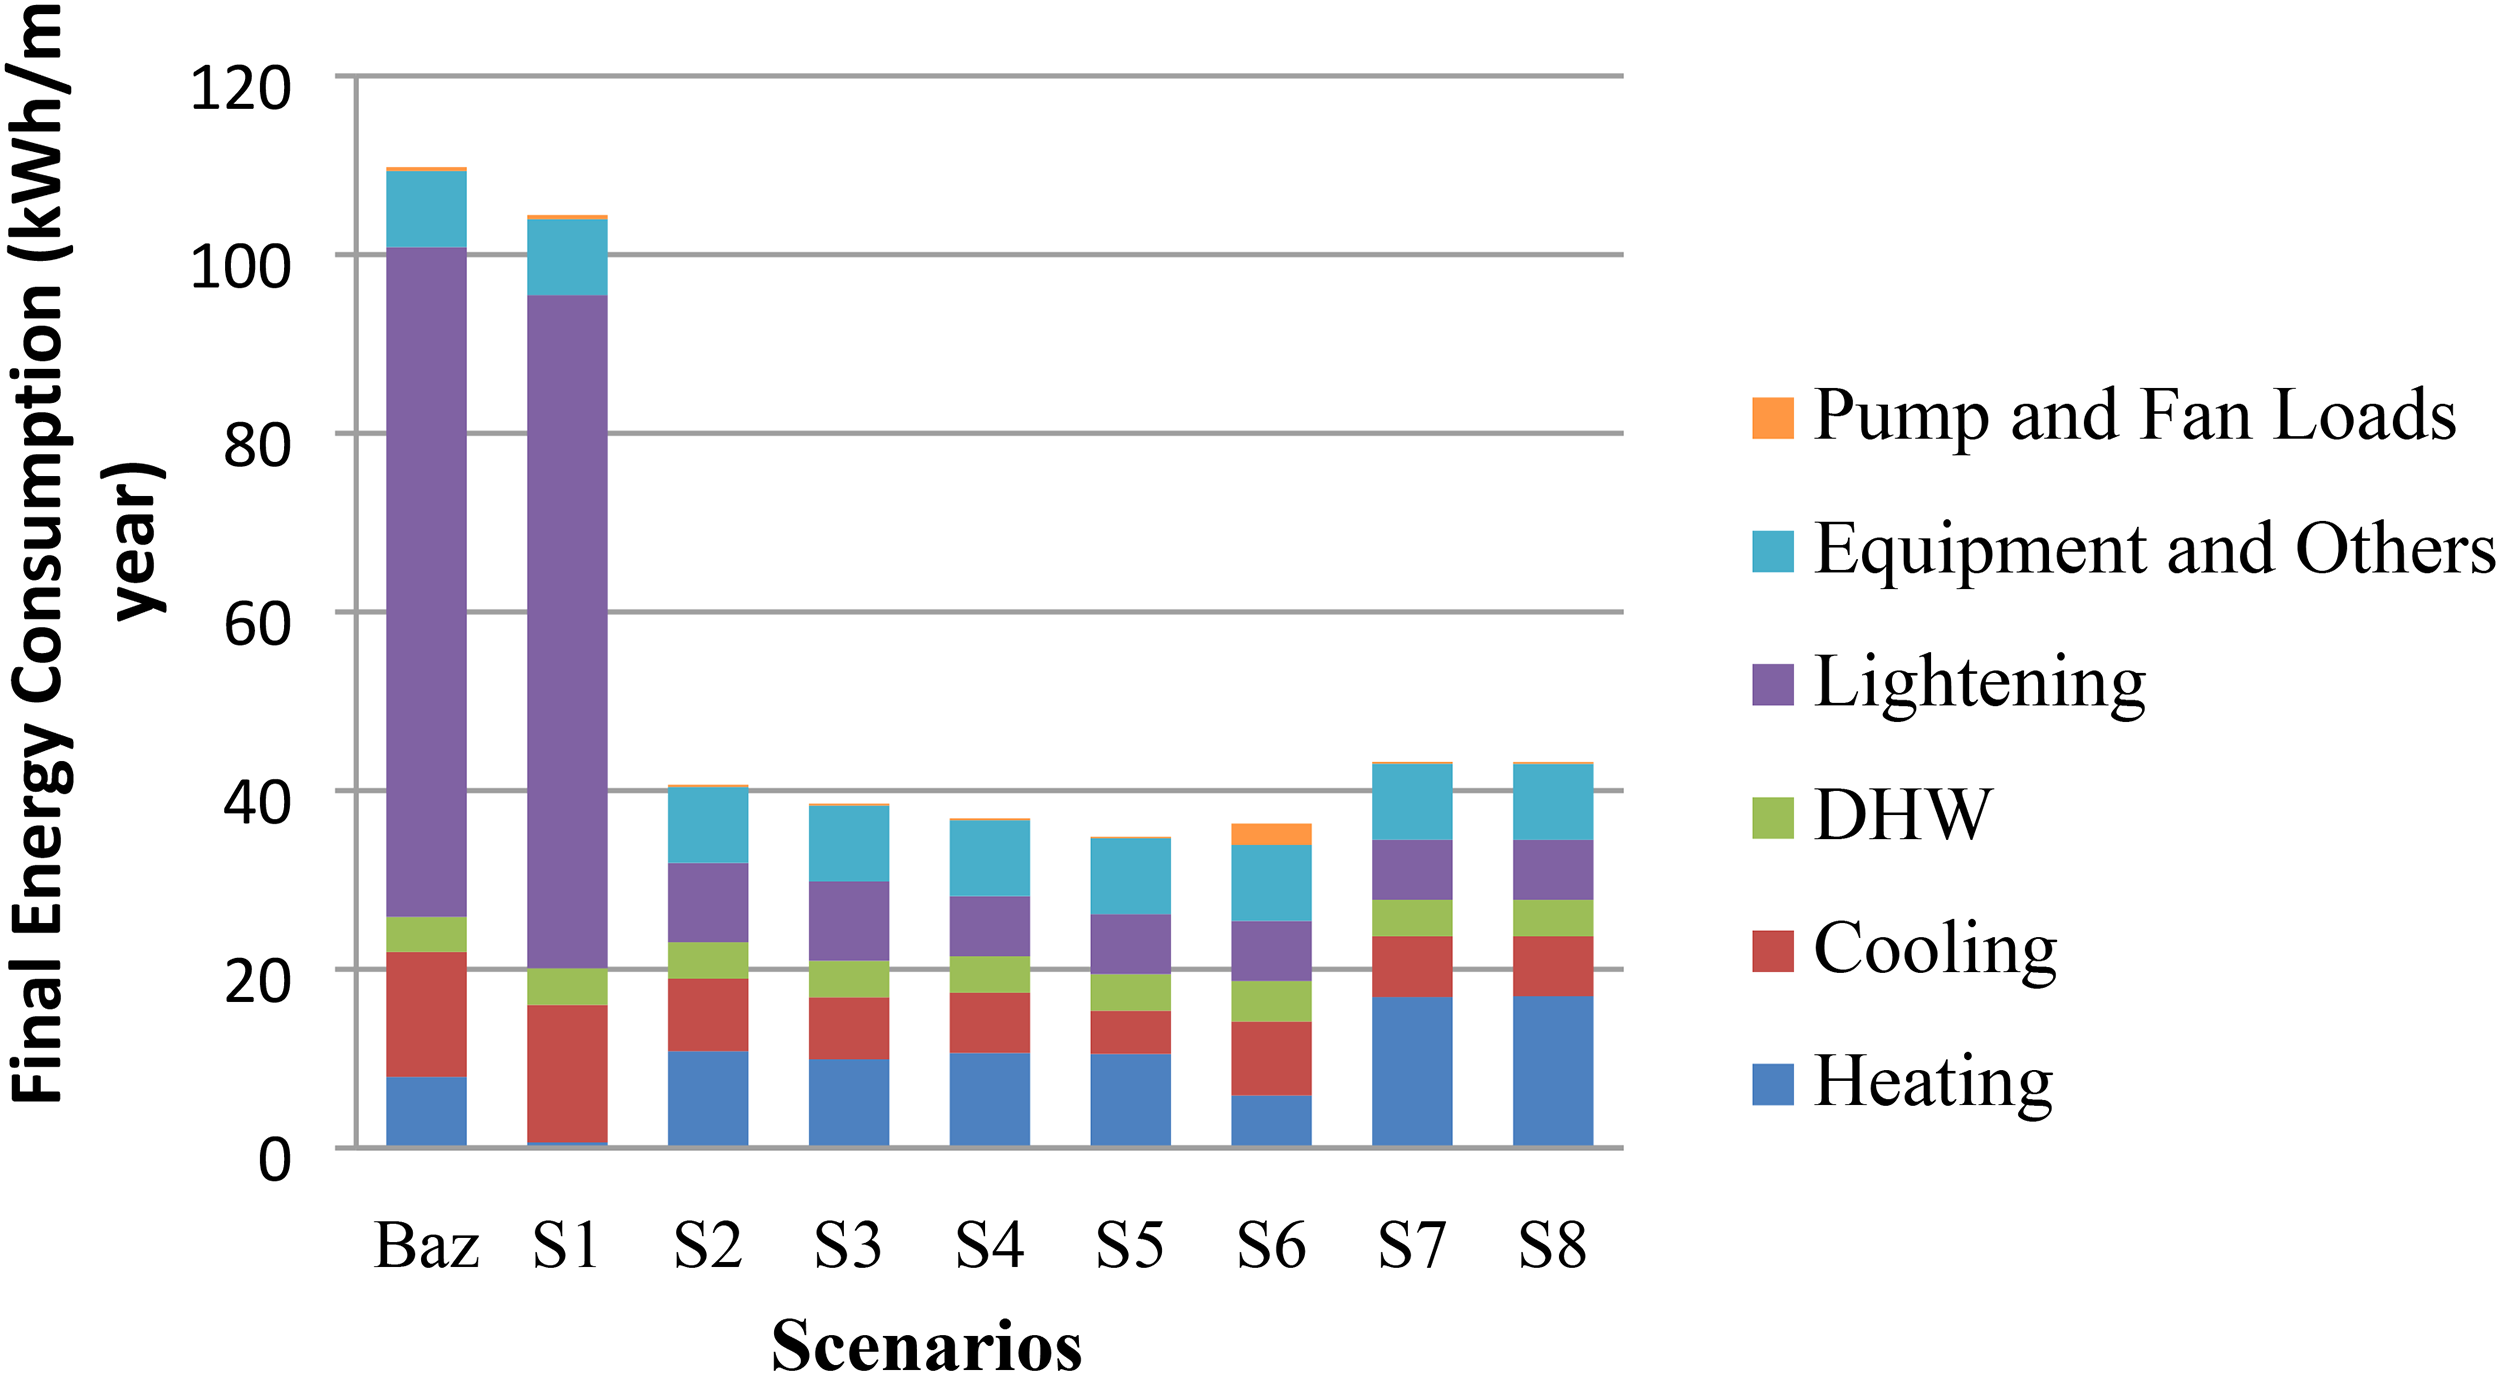
Building energy consumption by end-use.
According to Figure 7, for the reference and S1 retrofit scenarios, energy consumption is predominantly due to lighting. It is aimed to determine the energy consumption for lighting at the lowest energy efficiency level by selecting tungsten lamps (normalized power density of 28 W/m²-100 lux) in the reference scenario and S1 and to determine the lowest lighting energy consumption that can be achieved with improvements (by selecting energy efficient lighting equipment). Due to these selection criteria; lighting energy consumption in the reference scenario and S1 are very high. In S2, S3, S4, and S5, it is seen that the end-uses in energy consumption are equally shared and energy consumption is mainly due to the heating system. In S6, the energy consumed for cooling is higher than the energy consumed for other end-uses. In S7 and S8, the energy consumed for heating is higher than the energy consumed for other end-uses.
Calculation of total annual net primary energy consumption
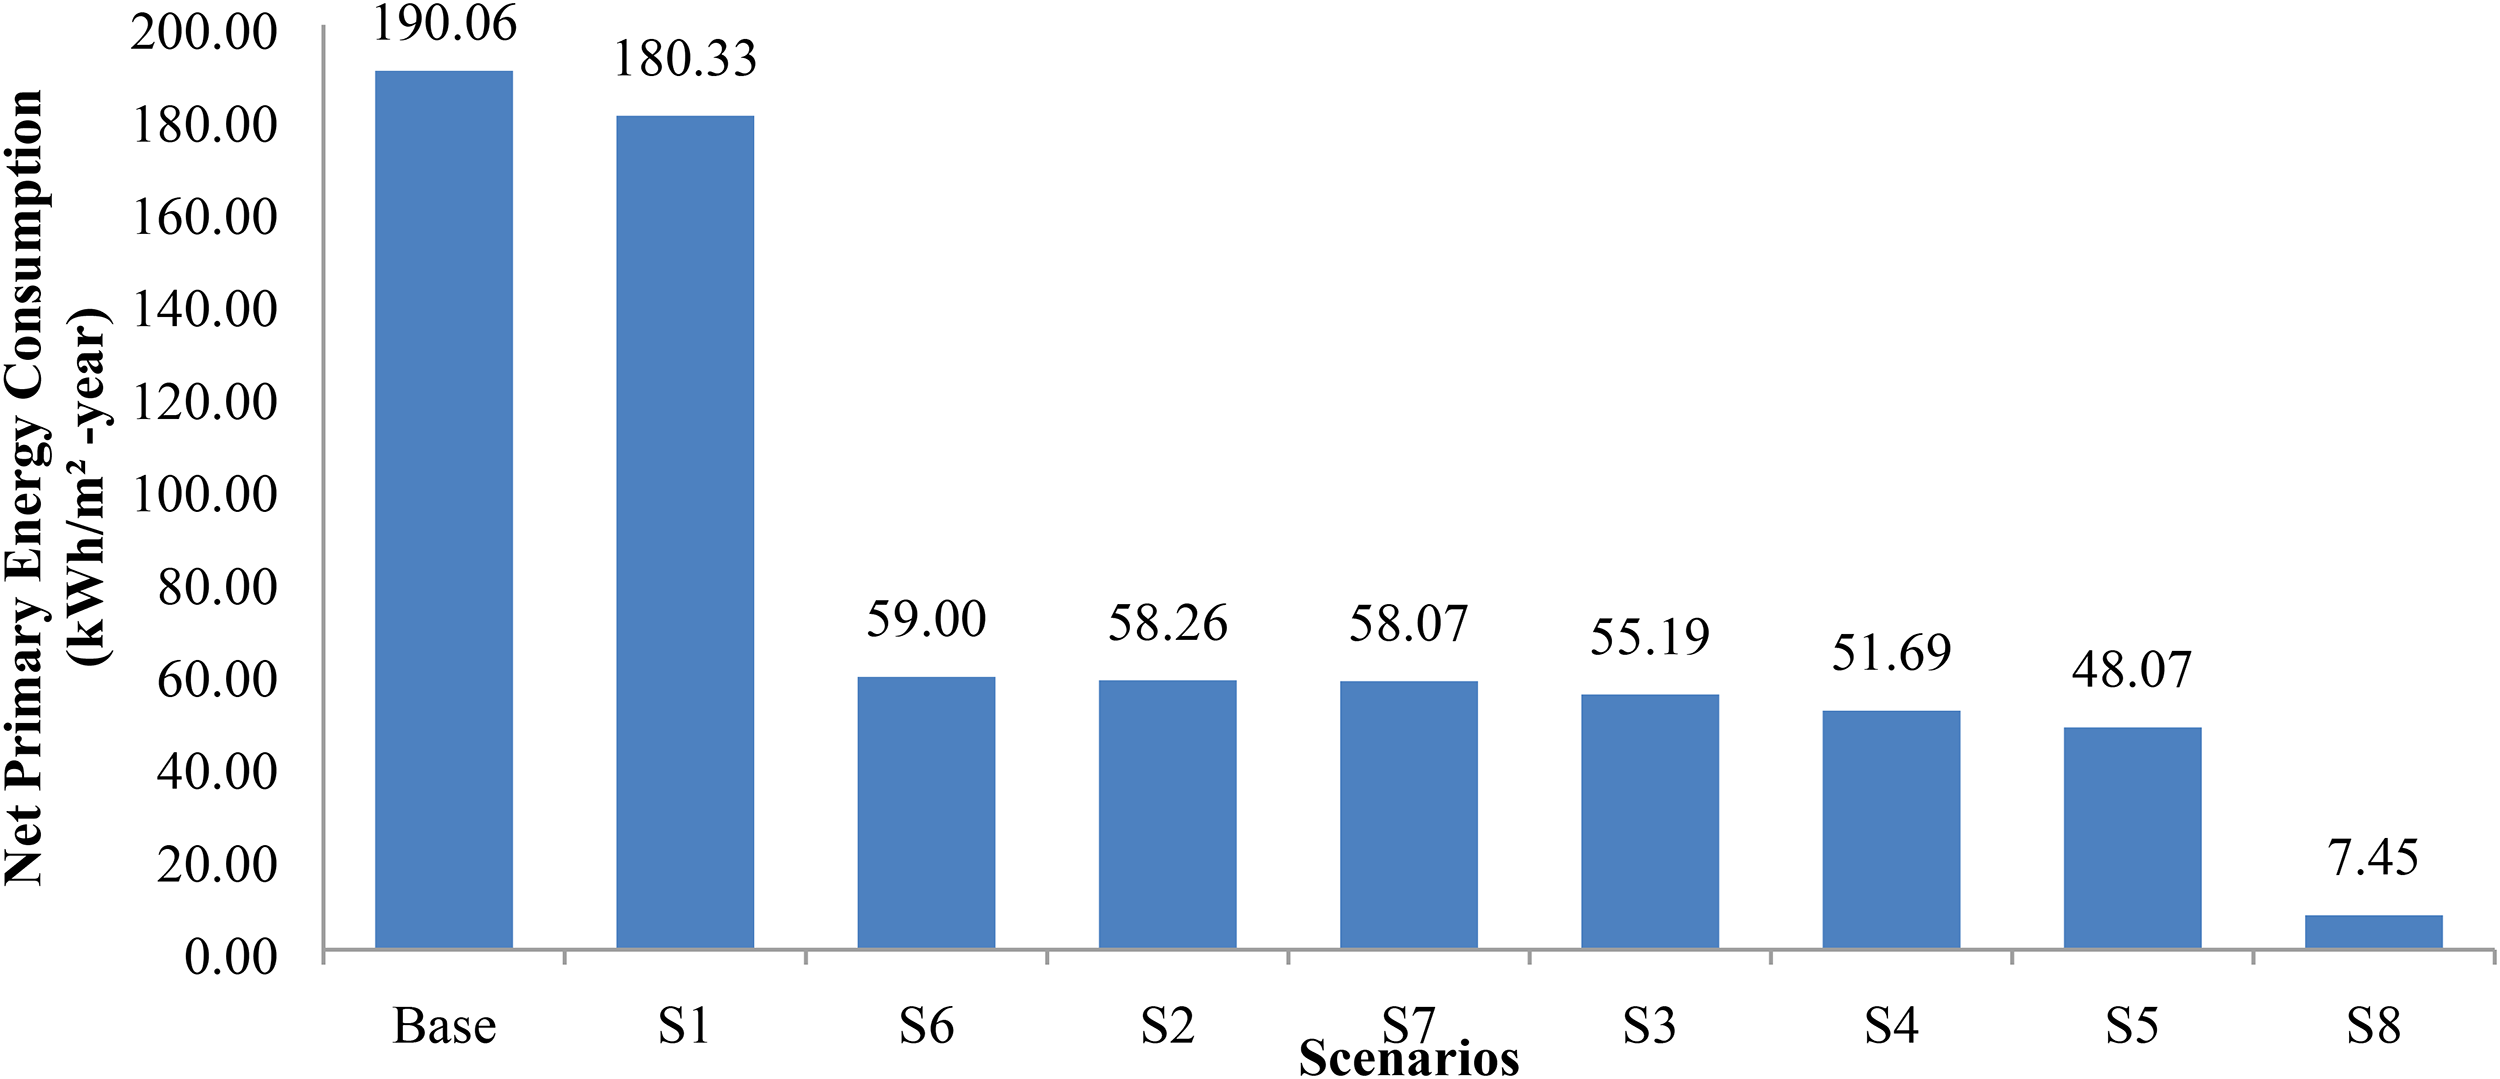
One of the requirements set out in the EPBD directive mandates that member states’ NZEB national plans should specify the primary energy use of the respective states with a numerical value. This value, expressed in kWh/m²/year, takes into account national, regional, or local conditions (OJEU, 2010). To comply with this directive, the final energy consumption values obtained from the DesignBuilder program need to be converted into primary energy. Primary energy is energy that has not undergone any change or transformation (Koç and Kaya, 2015). In order to be able to compare and analyze annual energy consumption under equal conditions, the calculated annual energy consumption must be converted into primary energy (Arıkan, 2021). Since natural gas and other fuels have not undergone any conversion, the primary energy conversion coefficient is taken as 1. In BEP-TR software, the primary energy conversion coefficient of electricity energy as of 2022 was determined as 1.788 by MENR. This coefficient was used for the primary energy consumption conversion of the base building and retrofit scenarios (MEUCC, 2022). The net primary energy consumption values of the reference and retrofit scenarios are given in Figure 8. Net primary energy consumption values are determined by subtracting the generation from the PV power plant from the annual primary energy consumption.
Total annual net primary energy consumptions.
Using BEP-BUY, a component of BEP-TR 2, the official national simulation program of Turkey, the building's overall energy performance class was determined (MEUCC, 2023a). BEP-BUY software does not include some building components, devices, and equipment used in building designs made with DesignBuilder software in its library. For this reason, while determining the total energy performance class of the building, building components, devices, and equipment with similar characteristics were selected and the total energy performance classes of the building were determined by ensuring that the U values were the same or very close. The energy performance class of the reference building was determined as “D,” the class of the building designed according to S5 as “B” and the class of S8 as “A.”
Comparison of retrofit scenarios
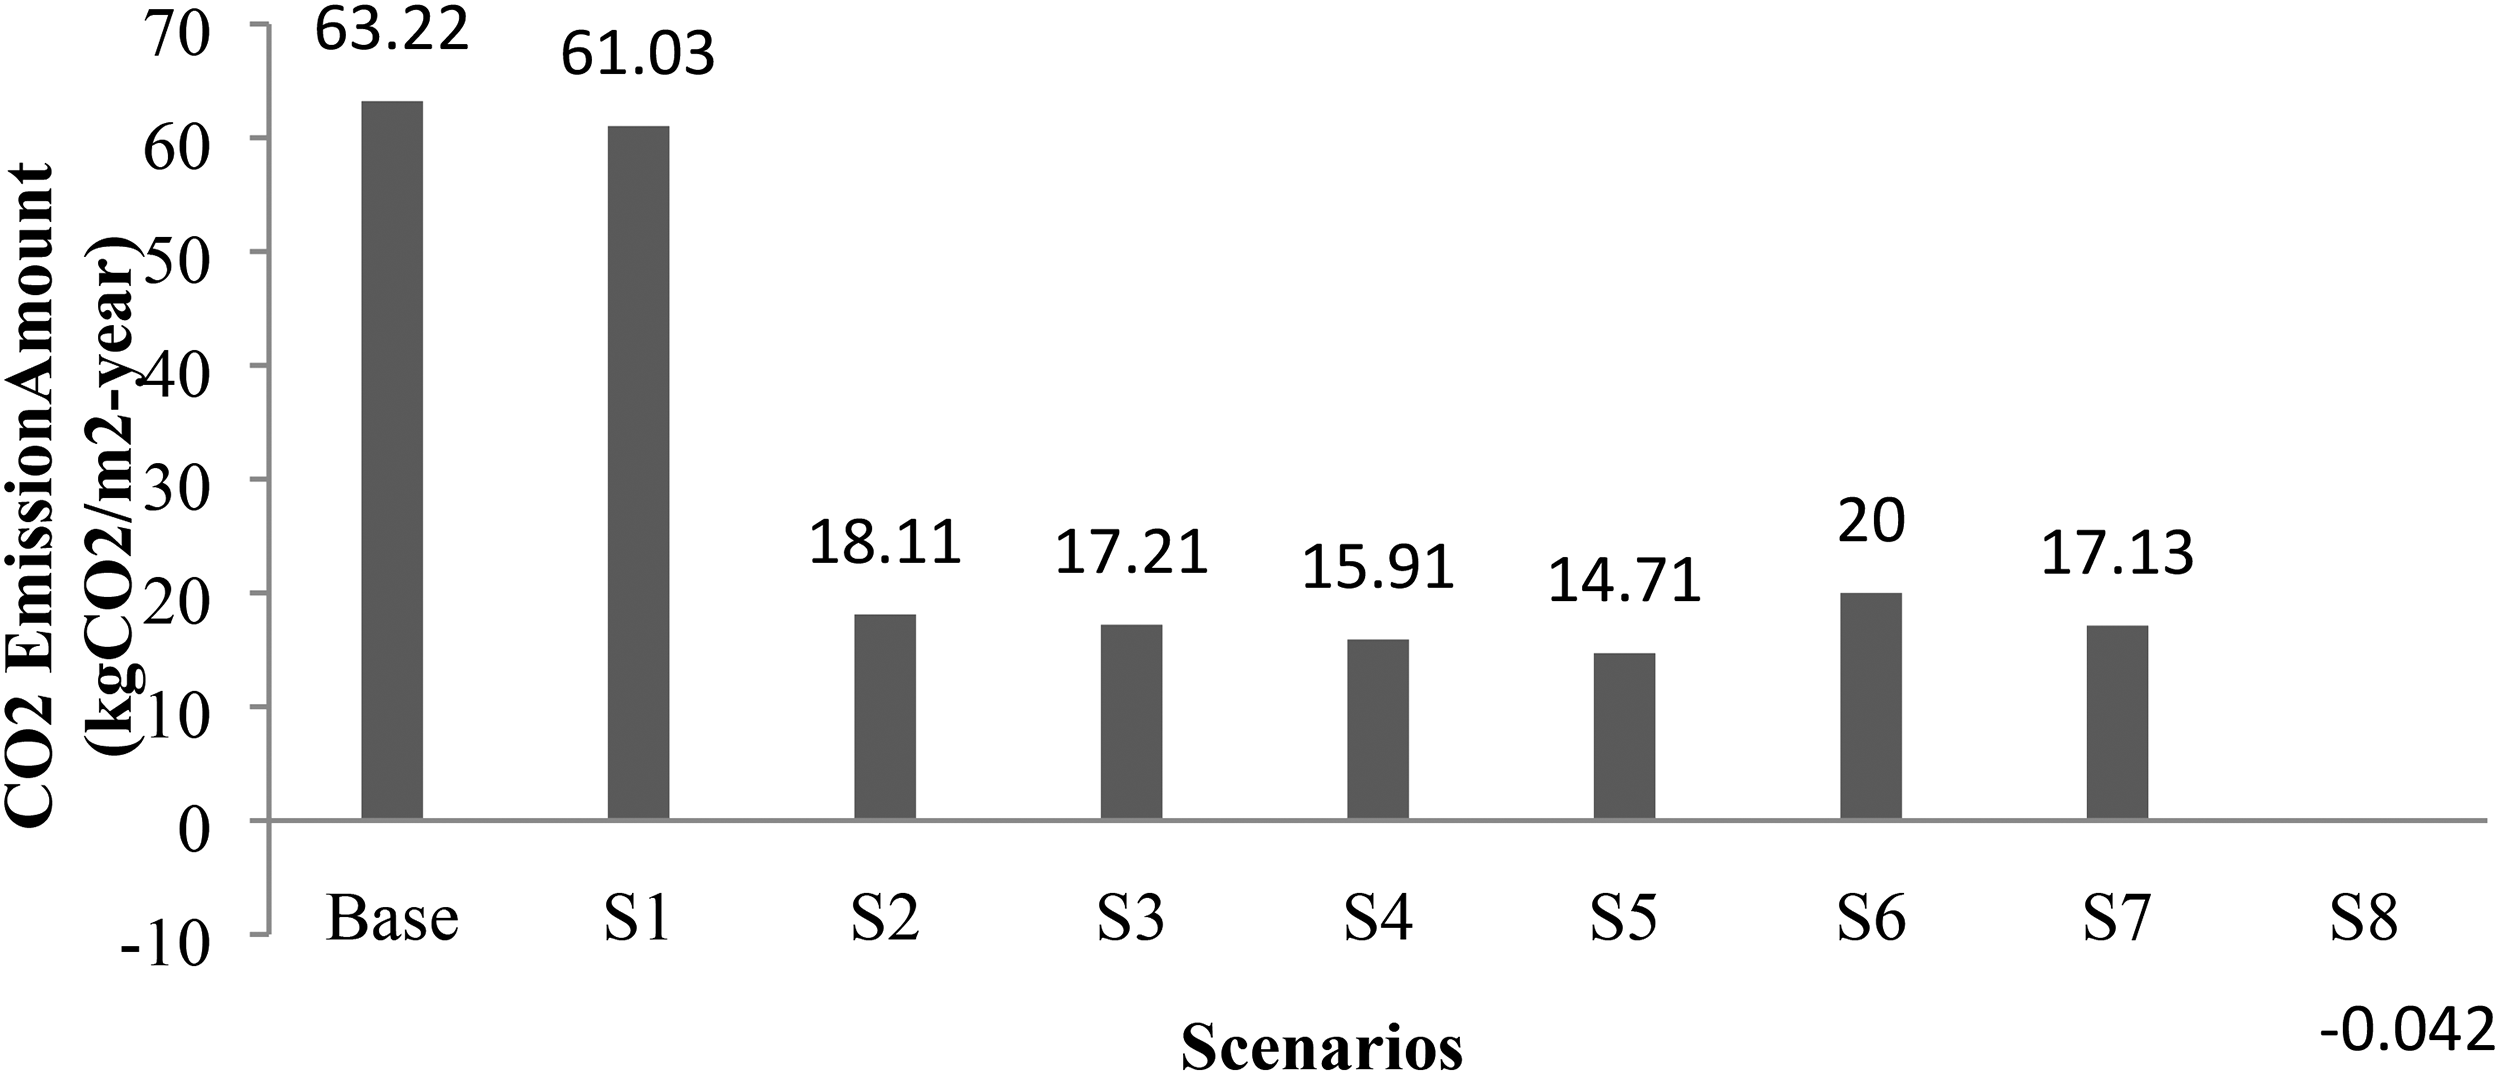
According to the data in Figure 8, the Reference case has the highest net primary energy consumption with 190.06 kWh/m²/year, while S8 has the lowest consumption with 7.45 kWh/m²/year. Another scenario with the lowest net primary energy consumption is S5 with 48.07 kWh/m²/year. S1 has the highest energy consumption among the retrofit scenarios with a net primary energy consumption value of 180.33 kWh/m²/year. CO2 emission values of the reference and retrofit scenarios are given in Figure 9. CO2 emission values were found as a result of DesignBuilder building simulations.
When Figure 9 is analyzed, it is seen that eight different retrofit scenarios have reduced building CO2 emissions. S1 is the scenario that causes the lowest decrease in CO2 emission. S8 has a negative CO2 emission value. This means that no CO2 is released into the atmosphere and some emissions from another source can be offset.
Calculation of investment costs and payback periods of retrofit scenarios
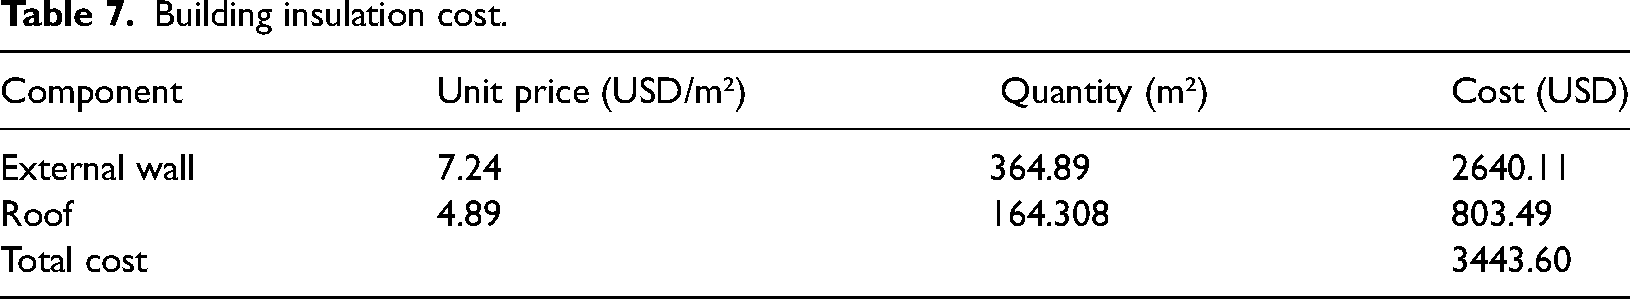
While calculating the investment costs, unit prices are taken from the Ministry of Environment and Urbanization Construction and Installation Unit Price Book for 2022 and 2023 and the Ministry of Culture and Tourism Unit Price Supplement List (MCT, 2023; MEUCC, 2023b). The dollar equivalents of the TRY costs were calculated using the Central Bank of the Republic of Turkey's Indicative Exchange Rates (Forex Buying) (TCMB, 2023). The prices of the cost items not included in these references were obtained by market research. Table 7 shows the cost calculation required for the insulation of the building.
Building insulation cost.
The cost of replacing the tungsten lamps used in the reference building with LED is given in Table 8.
LED lamp conversion cost.
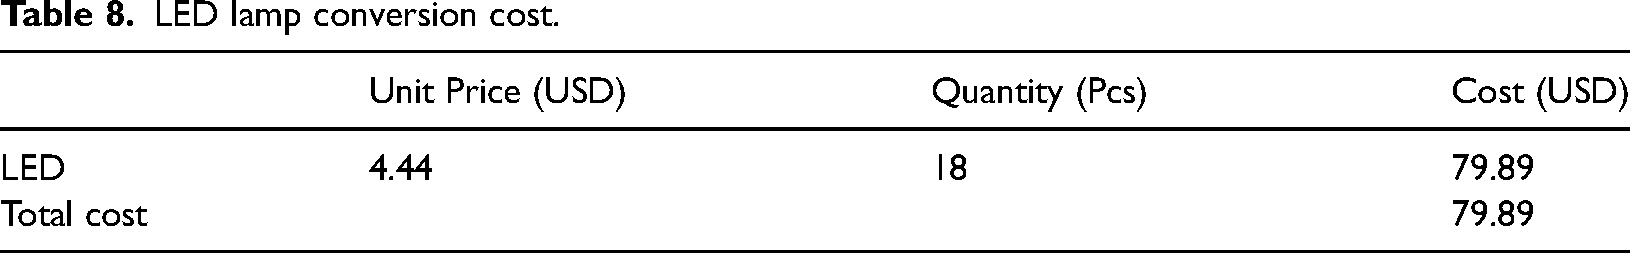
The total cost of LEDs used as lighting elements is 79.89 USD. The cost of Air-filled double-glazed Low-E (4/13/4 mm) glass with a U value of 1.78 W/m2K is calculated as shown in Table 9.
Air-filled double-glazed low-E glass cost.
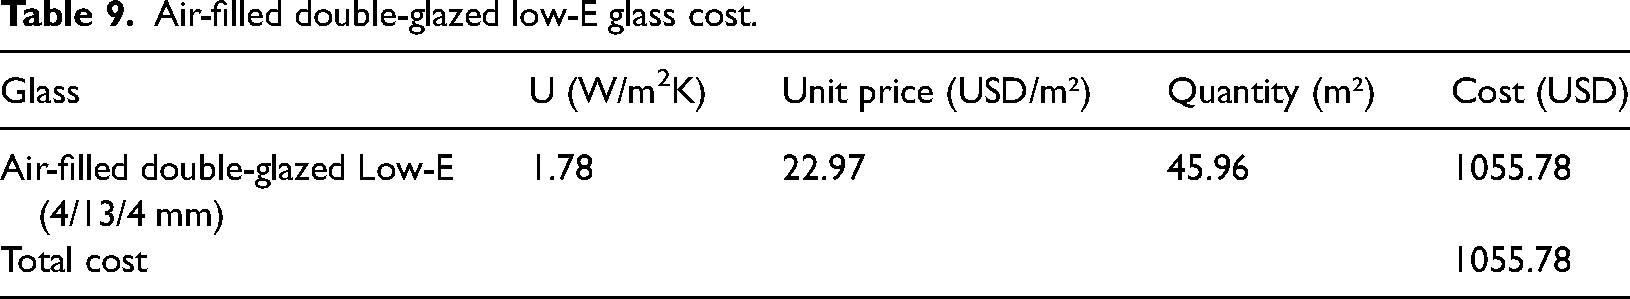
The total cost of replacing air-filled double-glazed glass with air-filled double-glazed Low-E glass is calculated as 1055.78 USD.
When triple-glazed Sageglass with PVC frames with a U value of 0.68 W/m2K is used, the total cost of replacing is calculated as shown in Table 10.
Sageglass triple glazing cost.
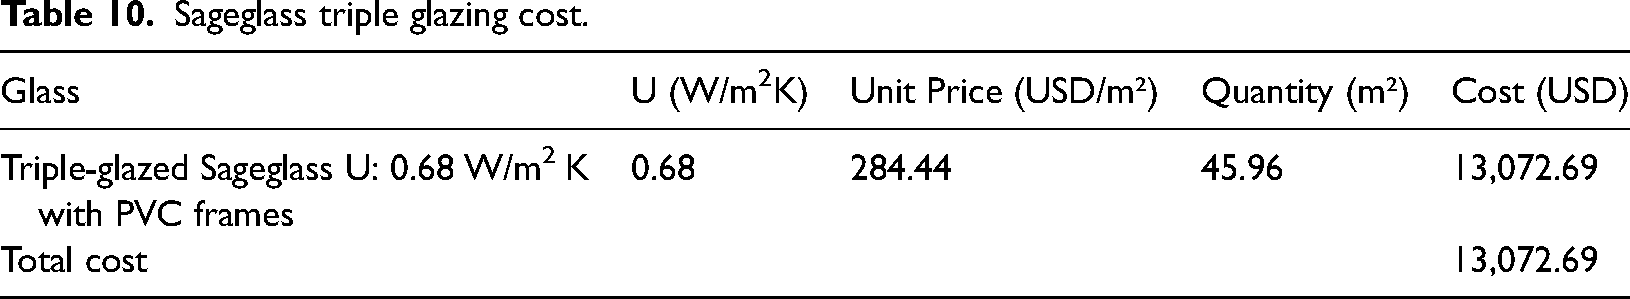
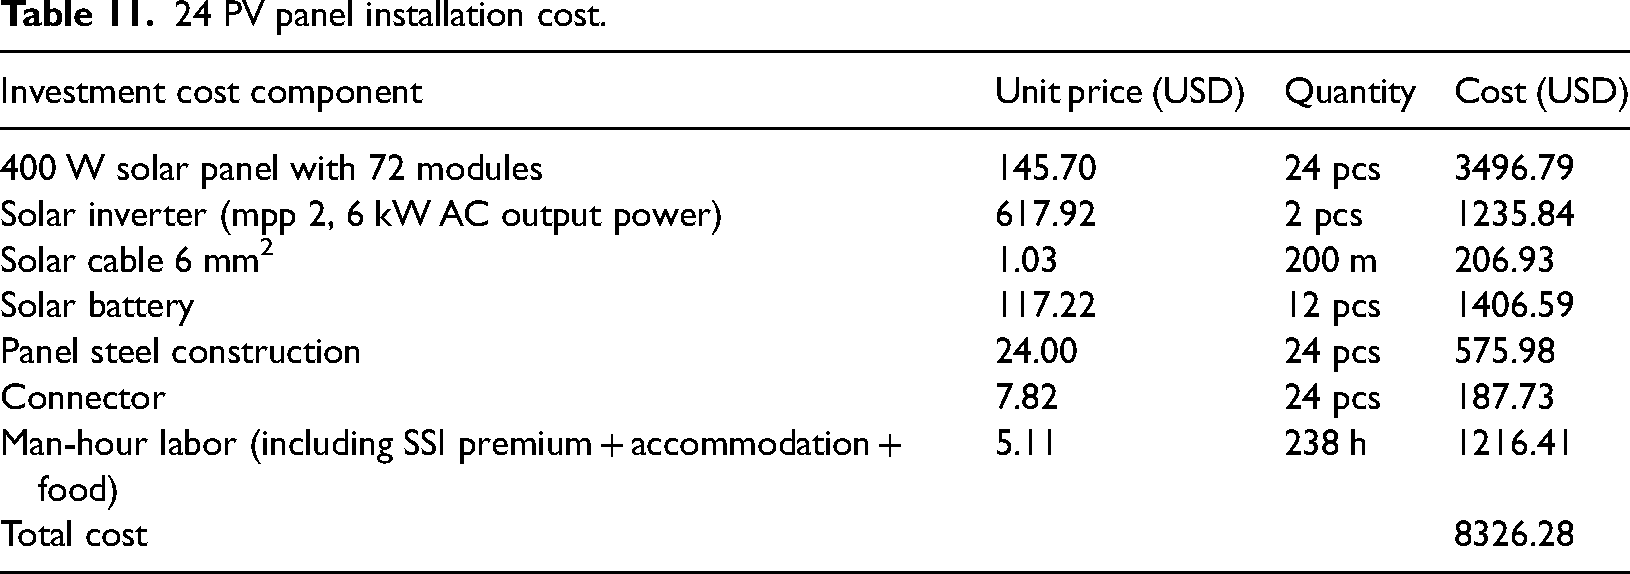
The total cost of triple-glazed Sageglass with PVC frames was calculated as 13,072.69 USD. PV panels were used to generate electricity to meet the NZEB requirement of on-site electricity generation. The investment costs required for PV panel installation are calculated as shown in Tables 11 and 12.
24 PV panel installation cost.
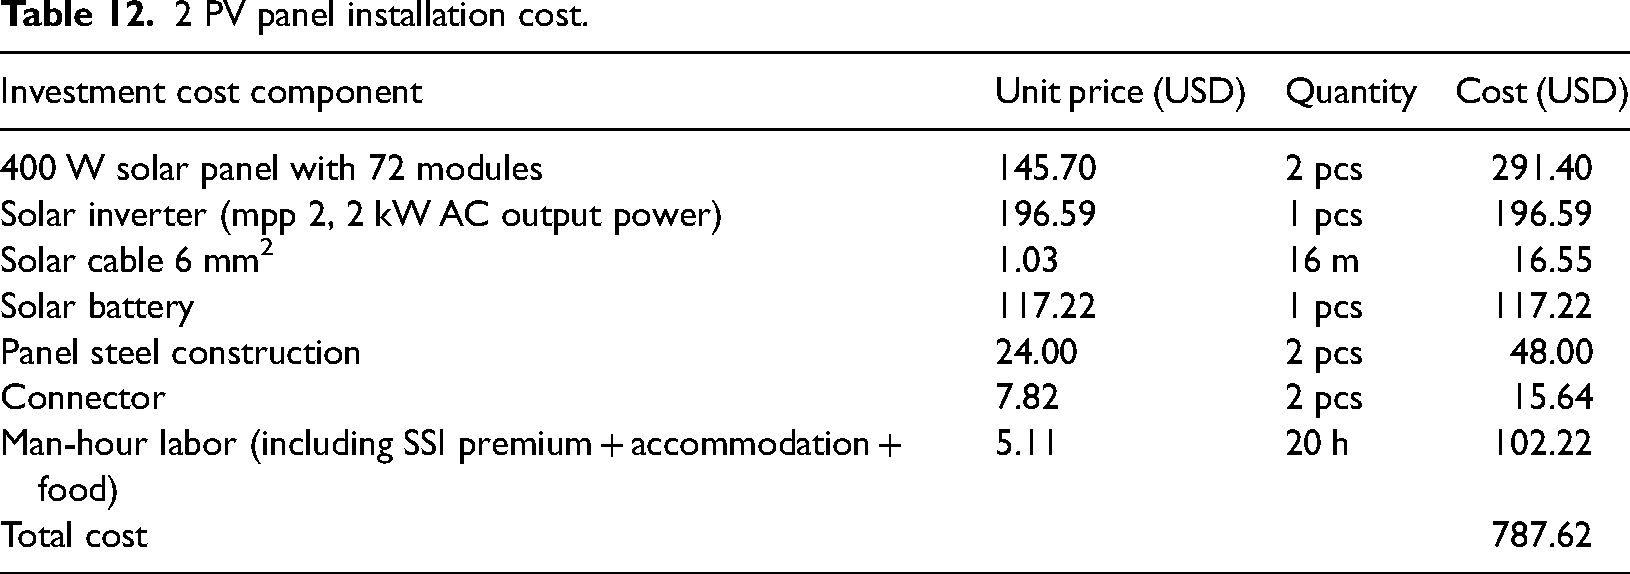
2 PV panel installation cost.
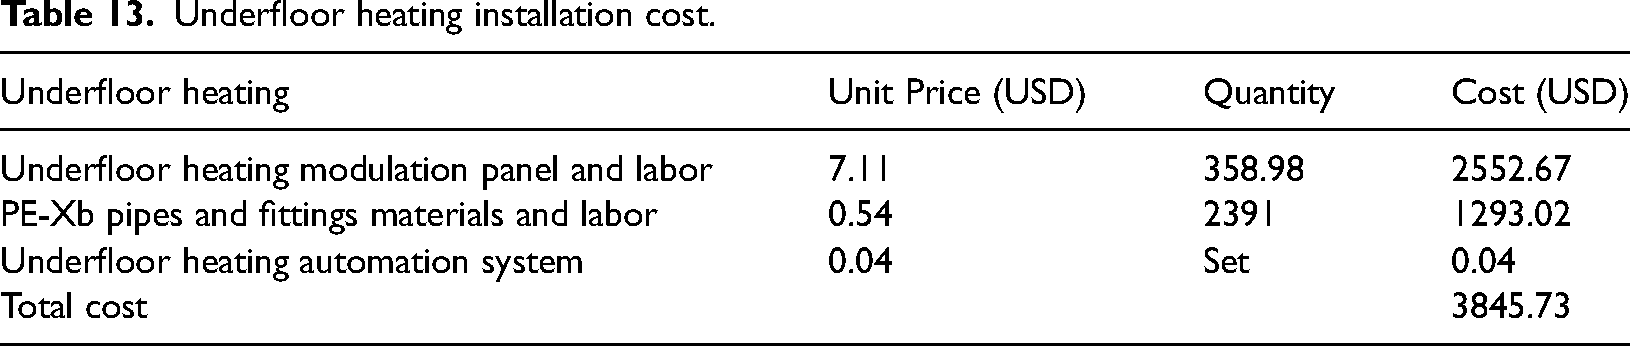
In order to improve the heating system, the cost of underfloor heating has been applied to the guest room, kitchen, bathroom, bedroom, living room, and vestibule. The total floor area of the three-storey building is 358,98 m2. The cost of underfloor heating installation is calculated as in Table 13.
Underfloor heating installation cost.
Payback period calculations were performed for S5 and S8. These two scenarios were selected because they have the lowest annual primary energy consumption among the scenarios analyzed. The comparison data of the annual natural gas and electricity energy consumption of the Reference, S5 and S8 are given in Table 14.
Comparison of energy consumption costs of reference, S5 and S8.
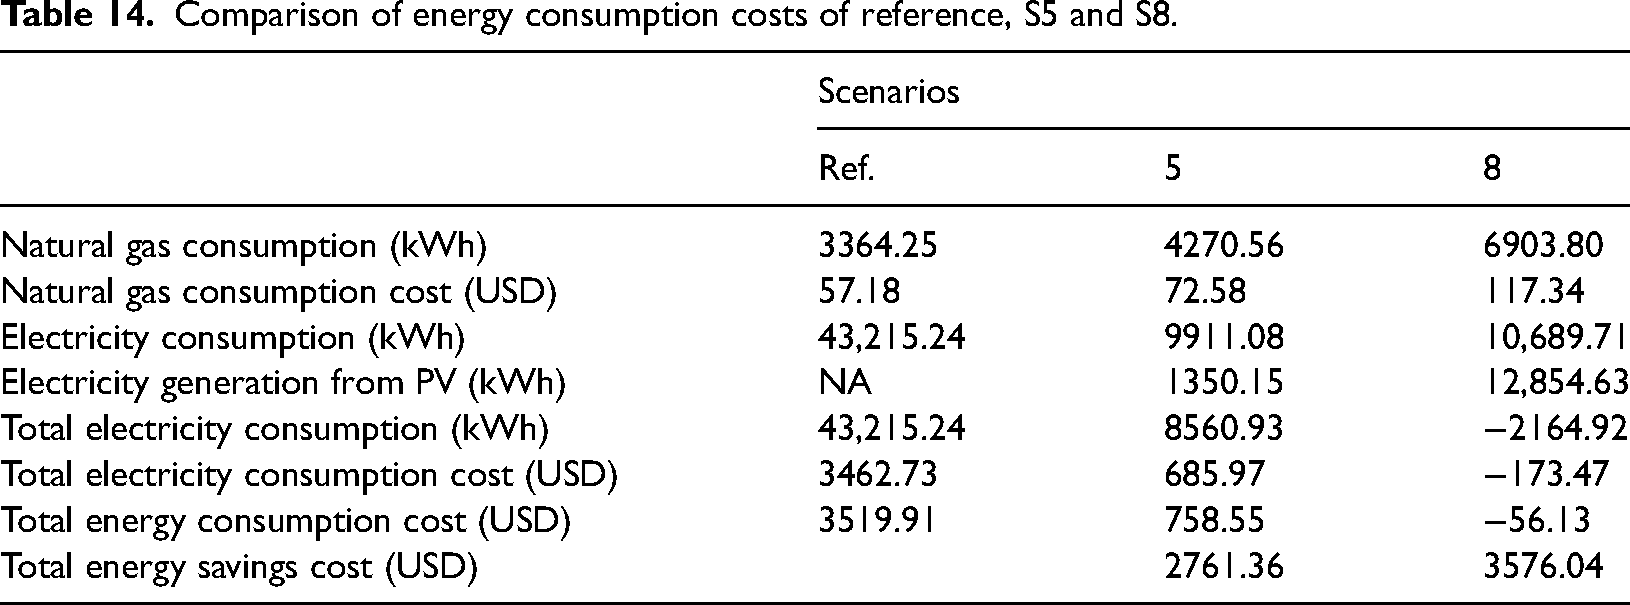
Izgaz natural gas Sm3 Price including VAT for 2023 is taken as 5.086293 TL and EMRA kWh Price including VAT for 2023 is taken as 198.7345 kr/kWh. 1 Sm3 of natural gas has an energy value of 10.64 kWh (EMRA, 2023b; İZGAZ, 2023). In the calculation of electricity consumption cost, the consumption cost was determined by taking into account the BTV share of 5% and VAT of 8%.
Analyzing Table 14, it can be seen that the reference scenario's natural gas consumption is 3364.25 kWh and its electricity consumption is 43,215.24 kWh. Natural gas consumption cost is 57.18 USD, electricity consumption cost is 3462.73 USD and total energy consumption cost is 3519.91 USD. In S5, natural gas consumption is 4270.56 kWh and electricity consumption is 9911.08 kW, but since 1350.15 kWh of this is generated from PV panels, total electricity consumption is 8560.93 kWh. Natural gas consumption cost is 72.58 USD, electricity consumption cost is 685.97 USD and total energy consumption cost is 758.55 USD. In S5, there is a significant total energy-saving cost of 2761.36 USD. In S8, natural gas consumption increases to 6903.80 kWh and electricity consumption increases to 10,689.71 kWh compared to the reference scenario. In addition, 12,854.63 kWh of electricity is generated from PV panels. Total electricity consumption is −2164.92 kWh. Here, the negative values indicate the excess supply due to electricity generation. The total energy consumption cost is −56.13 USD. The fact that the total energy consumption cost is negative shows that the building has no energy consumption cost in S8, on the contrary, it is profitable due to excess production. In S8, an energy saving of 3576.04 USD was realized compared to the reference scenario. By reducing natural gas and electricity consumption, significant savings can be achieved that can contribute to more sustainable and cost-effective operation of buildings.
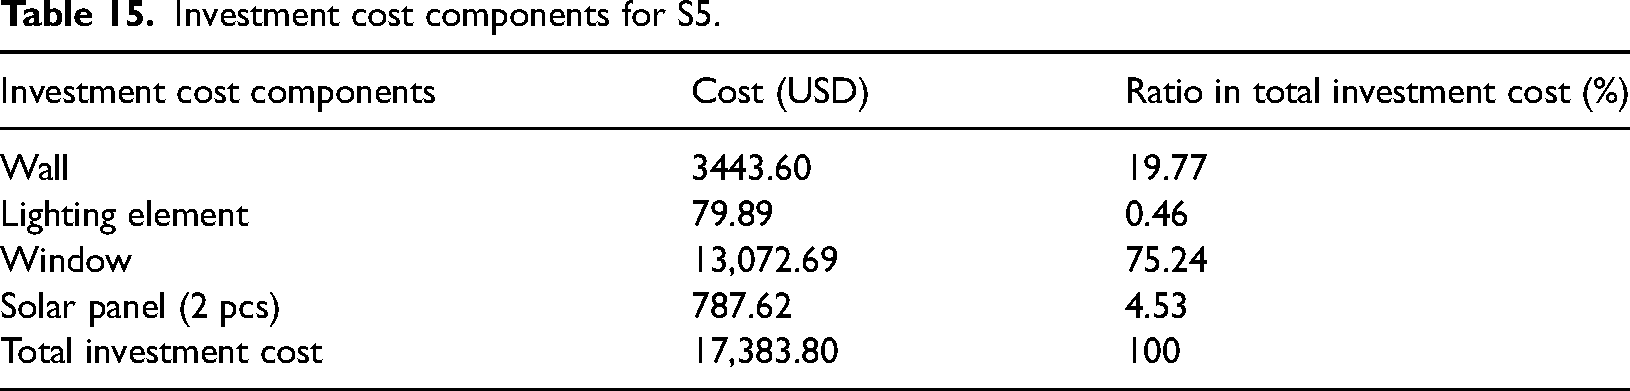
The approach of Net Present Value (NPV) was employed to assess the total value of an investment opportunity. In the NPV method, a certain discount rate is used to discount all future cash flows of the investment to their present value. In the calculations, the discount rate is assumed to be 15%. Energy Unit Price Inflation is taken as 12%. Annual depreciation costs are assumed to be 2% of the investment cost. Investment cost components and amounts for S5 and S8 are given in Tables 15 and 16.
Investment cost components for S5.
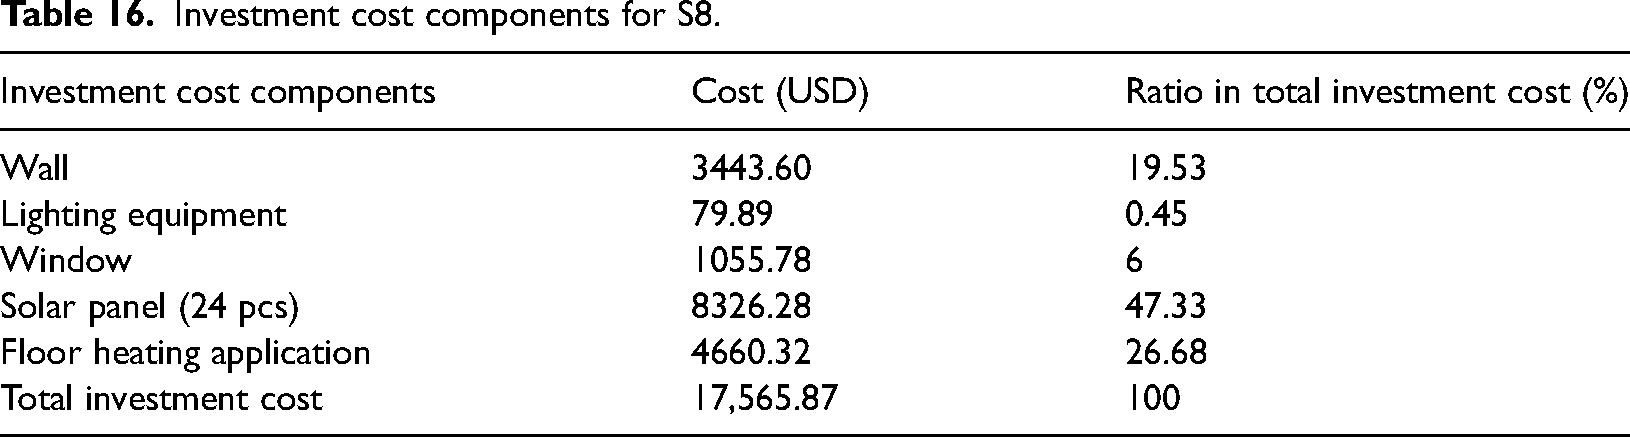
Investment cost components for S8.
When Table 15 is analyzed, it is seen that the investment cost for triple-glazed Sageglass has the highest share among the other investment parameters with a rate of 75.24%.
Table 16 shows that the investment cost for 24 solar panels has the highest share among the other investment parameters with a rate of 47.33%.
The total investment cost for the fifth scenario was found to be 17,383.80 USD. For S8, the total annual investment cost is calculated as 17,565.87 USD. An evaluation of the investment will be made for S8 and S5, taking into consideration the cost data. For this purpose, Equation 1 was used.

The calculation of the fifth scenario's payback period with the NPV method is given in Table 17.
Payback period calculation for S5.
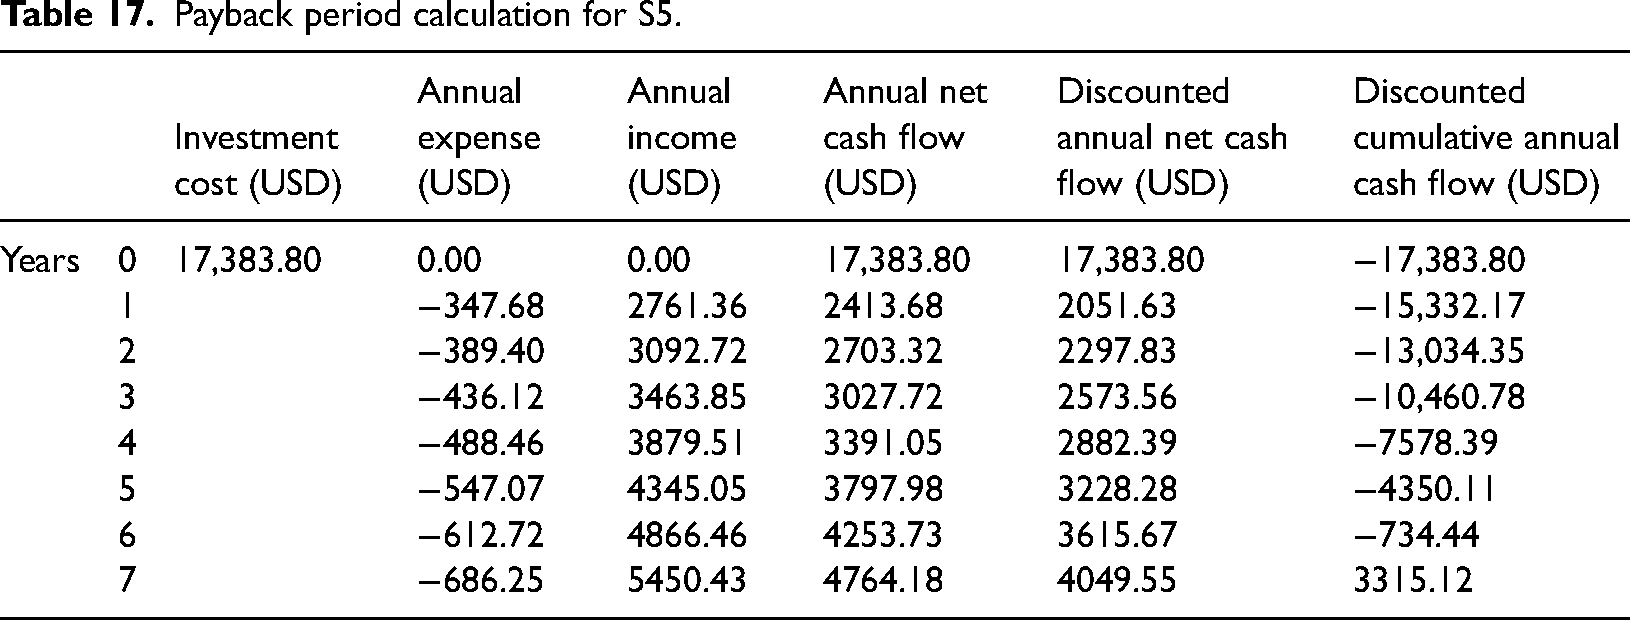
When Table 17 is analyzed; in the first year of the investment, which has an initial cost of 17,383.80 USD, it has an annual depreciation expense of 347.68 USD, which is 2% of the investment cost. Considering the energy unit price inflation for each subsequent year, an inflation-driven increase of 12% is observed. Accordingly, the annual depreciation expense is 389.40 USD in the second year. Accordingly, annual depreciation expenses for the following years are calculated as shown in Table 17. In the first year of the investment, the amount of savings has also increased by 12%, providing annual savings of 2761.36 USD in the first year. The savings for the following years of the investment are calculated as shown in Table 17.
In the investment evaluation calculations carried out in Tables 17 and 18; discounted annual net cash flow represents the present value of the annual net cash flow, taking into account the discount rate. A negative value in the discounted cumulative annual cash flow indicates that the investment is not profitable, while a positive value indicates that the investment is profitable. Accordingly, S5 becomes profitable in the seventh year of the investment. The calculation of the payback period of S8 with the NPV method is given in Table 18.
Payback period calculation for S8.
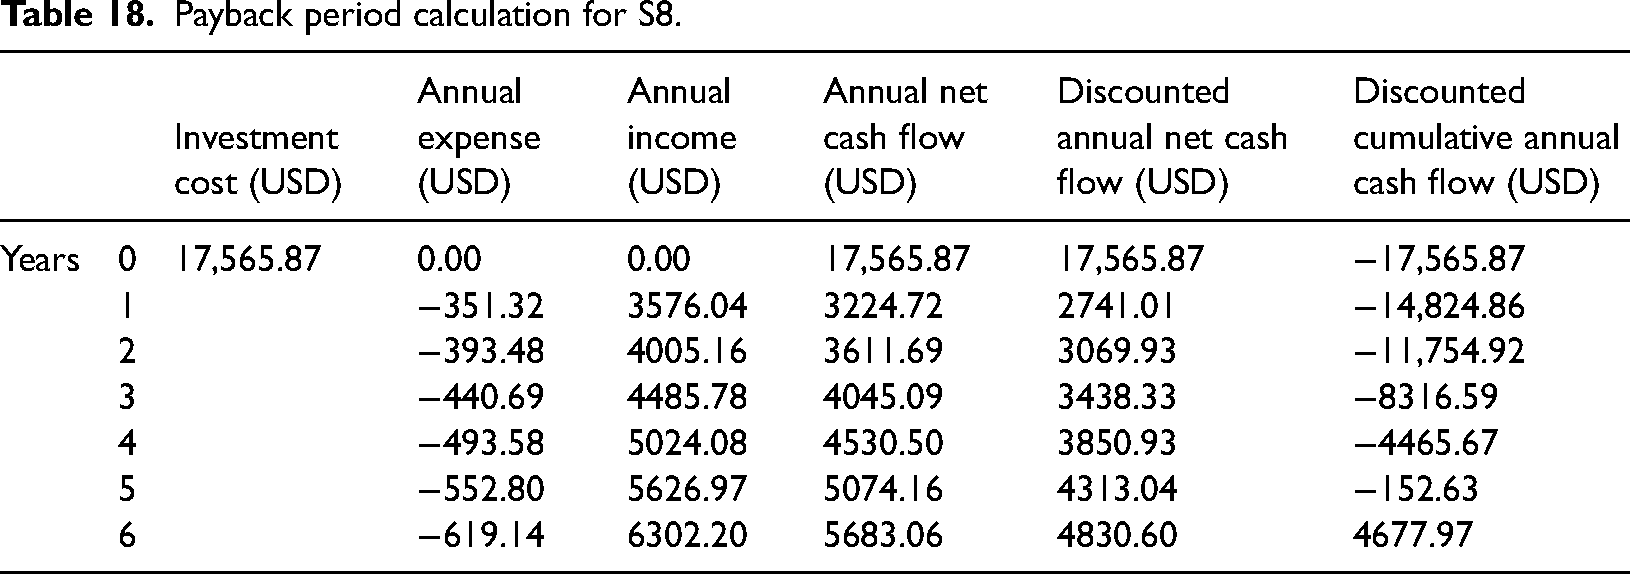
Table 18 shows the NPV cash flow for S8. Annual expenditures in the first year of the investment are calculated by applying 12% energy unit inflation over the years. Annual net cash flow is equal to the sum of annual expenses and annual savings. The discounted annual net cash flow is applied at a rate of 15% per year. When Table 18 is analyzed in light of this information; in the first year of the investment with an initial cost of 17,565.87 USD, there is an annual depreciation cost of 2% of the investment cost (351.32 USD). Considering the energy unit price inflation for each subsequent year, an inflation-induced increase of 12% is assumed. Accordingly, the annual depreciation cost is 393.48 USD in the second year. Accordingly, annual depreciation expenses for the following years are calculated as shown in Table 18. The amount of savings in the first year of the investment was also determined and applied for each year based on 12% energy unit price inflation. Annual savings of 3576.04 USD was obtained in the first year of the investment. The savings for the following years of the investment are calculated as shown in Table 18.
According to the investment evaluation calculations carried out in Table 18; in the case of the S8 scenario, the investment will be profitable in the sixth year. the investment becomes profitable in the sixth year of the investment. When S5 and S8 are compared, it is seen that S5 reaches profitability within seven years while S8 reaches profitability within six years. S8 seems to be the more financially viable option in the short term.
Conclusion
Buildings account for about one-third of global energy consumption. For Turkey, where energy consumption from buildings is 30%, the adoption and implementation of the NZEB approach will reduce energy consumption from buildings.
NZEBs are designed to minimize energy consumption and GHG emissions and support sustainable development. Achieving the SDGs requires a comprehensive approach that includes sustainable design and construction of buildings and NZEBs are an important part of this approach. NZEBs contribute to the achievement of SDGs 7, 11, and 13. NZEBs contribute to a more sustainable future by promoting energy efficiency and the use of RESs. NZEBs directly incentivize the use of RES, as the definition of an NZEB requires that a large portion of the almost zero or very low amount of energy required for the NZEB must be met from RES.
The lack of a national definition of NZEB in Turkey has been the biggest obstacle to its implementation. However, with the “Regulation Amending the Regulation on Energy Performance in Buildings” numbered 31755, this issue has been addressed to a large extent.
Within the scope of this thesis, energy modeling of a residential building in Izmir was made with the DesignBuilder program. The retrofit scenarios required for the building to become an NZEB have been determined, and a detailed energy analysis has been carried out for eight retrofit scenarios and the reference building.
Reference building’s annual primary energy consumption is determined as 190.06 kWh/m2/year. The carbon emission amount of the base building was found to be 63.22 kg CO2/m2/year. As a result of the simulation, it was determined that the most energy consumption was spent on cooling load. The energy consumed for cooling is determined as 5936.69 kWh/m2/year, the energy consumed for heating is 3371.07 kWh/m2/year, the energy consumed for DHW is 1665.24 kWh/m2/year and the energy consumed for lighting is 31811.32 kWh/m2/year. The annual final energy consumption was 109.79 kWh/m2/year. The retrofit scenarios were compared among themselves and the scenario with the lowest consumption and emission value was selected and compared with the reference case. Among the retrofit scenarios, the scenario with the lowest final primary energy consumption was the eighth scenario with 32.33 kWh/m2/year. This value is considerably lower than the 40 kWh/m2/year value, which is the lowest net primary energy use recommended by the EU for buildings located in countries with Scandinavian climates (OJEU, 2016). PTHP provides much more energy-efficient cooling compared to VRF. Among the scenarios implemented for the improvement of the reference building as NZEB, the scenario with the lowest primary energy consumption and the most economical in terms of cost is S8. When S8 and the Reference Scenario are compared, annual net primary energy consumption decreased by 82.99% and annual CO2 emissions decreased by 100.07%.
In addition, as per NZEB definition, PV panels were integrated into the building and the energy consumed by the building was obtained using RES. Thanks to the PV panels integrated into the reference building roof, the renewable energy contribution rate was 120.25%. In S8, the building produces more electrical energy than it needs. The CO2 emission of S8 was found to be −0.042 kg CO2/m2/year.
With the amendment made to the BEP regulation in 2022, it is obligatory for buildings with NZEB features to have energy performance class B or better in the EKB and to use RES at least 10% of the primary energy need of the building. As a result of the calculations made with BEP-BUY; the total energy performance class of the reference building is determined as “D.” In case S5 is realized, the total energy performance class of the building is determined as “B.” In case S8 is realized, the total energy performance class of the building is determined as “A.” If S5 occurs, 1350.152 kWh/year of energy production is realized with PV. If S5 is realized, 6.13% of the primary energy need of the building is met by PV. If S8 occurs, 12,854.634 kWh/year of energy production is realized with Solar Power Plant. If S8 is realized, 49.40% of the primary energy need of the building is met by RES.
Using LED as a lighting tool is the most efficient solution.
The scenario with the highest primary energy consumption and the lowest energy performance was determined as the S1 with 182.95 kWh/m2/year. The carbon emission amount of the S1 was found to be 61.03 kg CO2/m2/year.
The investment cost of S8 was found to be 17,565.87 USD. The highest item in the investment cost is the installation of 24 PV panels with a rate of 47.33%. The investment cost of S5 is 17,383.80 USD. It was determined that the investment cost for triple-glazed Sageglass had the highest share among other investment parameters with a rate of 75.2%.
As a result of the analyses carried out using the NPV method, one of the investment evaluation methods, it was seen that a profit was made in the seventh year of the investment for S5. For the investments to be made for S8, it was determined that a profit was made from the investment in the sixth year of the investment.
In order to see the effect of the PV panel installation façade on electricity production, only the direction was changed without changing the number of PV panels, and it was concluded that the most suitable façade was the south facade. When PV panels were placed on the south facade, electricity production increased by 70.42% compared to the north facade.
In buildings, a combination of both active and passive energy efficiency measures should be implemented to maximize energy savings and sustainability. Passive measures such as insulation and low U-value windows minimize energy losses. These measures provide long-term benefits by reducing the building's overall energy demand and improving occupant comfort. On the other hand, active measures such as energy-saving lighting and renewable energy systems provide additional energy savings through advanced technologies. By integrating both passive and active measures, buildings can achieve optimum energy efficiency, reduce operating costs and contribute to a greener future.
Recommendations
In Turkey, with the amendment made to the BEP regulation in 2022, the NZEB definition was introduced into the legislation. This regulation, which came into force in 2022, is expected to make a significant contribution to the country's efforts to reduce energy consumption and dependence on fossil fuels. The national NZEB definition in Turkey clearly stipulates the share of RES and mandates their use. It is noteworthy that although the NZEB definition was introduced into the legislation with this change in the regulation, there is no numerical indicator as kWh/m2/year as in the EU definition. In Turkey's national NZEB definition, the amount of primary energy use should be expressed numerically in kWh/m²/year. By making changes to the BEP regulation, the RES utilization rate in Turkey, which was initially set at 5%, should be increased to 20%, which is the lowest of the levels set by EU member states. The EU recommendation report also states that NZEBs can be associated with the highest energy performance class (OJEU, 2016). Considering this statement in the recommendation report, the B class criterion valid for Turkey should be changed to the A class, which is the highest class.
Turkey may provide financial incentives, grants, or tax benefits to encourage the adoption of NZEBs. Training programs should be conducted to train professionals in NZEB design, construction and operation. To introduce and popularize the NZEB concept, Turkey should implement pilot projects as in the EU. The BRP concept can be considered as an option for the transformation of existing buildings. The definition of NZEB in Turkey in the BEP Regulation should be rearranged to include buildings of all sizes.
Footnotes
Declaration of conflicting interests
The authors declared no potential conflicts of interest with respect to the research, authorship, and/or publication of this article.
Funding
The authors received no financial support for the research, authorship, and/or publication of this article.