
Abstract
The primary goal of this research was to minimise the energy consumed by heating and cooling loads in residential buildings in a sub-humid Mediterranean climate zone. This was achieved by optimising the design variables of various building envelopes using DesignBuilder software to compare the thermal performance of a baseline building model located in Ajlun (city in northern Jordan mountainous area) with the performance of other buildings with various design configurations. A sensitivity analysis (SA) was then conducted for twelve design variables to evaluate their influence on both cooling and heating loads using a regression method. The variables were divided into two groups according to their importance: a high importance design variables (window to wall ratio, local shading type, round floor construction, natural ventilation rate, infiltration rate (ac/h), glazing type, flat roof construction) and a low importance design variables (partition construction, site orientation, external wall construction, window blind type, window shading control schedule).The final results show significant reduction in the total energy consumption.
Keywords
Introduction
Energy efficiency has become a necessity for countries, governments, scientists, and the public as the demand on energy is increasing sharply while resources are depleting. The residential sector has attracted particular attention as its share of global energy consumption is enormous, especially electrical energy which involves substantial losses in generation, transmission, and distribution.
In Jordan, reducing energy in the residential sector has been a key aim of governmental organisations and institutions, which have created numerous public advertisements about the wise use of energy, initiated several campaigns to replace residential lights with more efficient ones, and provided incentives to install solar water heaters, and solar energy. Additionally, several codes and books have been published that detail the procedures for making buildings (either those already built or new buildings) more energy efficient, although these instructions are not obligatory. Scientist and researchers have ceaselessly investigated ways in which to secure better construction materials, lower costs, more energy efficient buildings, and a greater degree of thermal comfort.
Ensuring buildings are more energy efficient is imperative if the future use of energy is to be sustainable. For optimal thermal performance, there needs to be new, innovative designs for the construction of buildings. To achieve this, effective and accurate software programs are required that can correctly predict the performance of buildings in disparate conditions. However, those produced thus far have been inadequate. To enhance the prediction of energy usage within buildings and lower their running costs, it is therefore vital to address all relevant physical, social, and environmental factors during their construction (Al-Addous and Albatayneh, 2020).
One research study evaluated the effect of various climate zones in Australia (representing the primary global climates) on the thermal performance of a building and developed design methods to align with each climate zone in order to enhance thermal performance. AccuRate (rating software tools accredited by the Nationwide House Energy Rating Scheme in Australia) were then utilised to assess the thermal performance of the same building in different climate zones. The aim was to ensure the right design would be employed for a building based on its surrounding climate. The optimal designs for each climate zone were then assessed against a variety of climate variables (wind speed and direction, solar radiation, rainfall, and humidity) to develop a sustainable building that will substantially reduce energy consumption without sustaining the thermal comfort of residents (Albatayneh et al., 2018). Another research on building design parameters in arid climate showed that a significant energy saving up to 90% can be achieved by infiltration and glazing optimisation(Albatayneh, 2021).
To identify the most practical and inexpensive design, another set of researchers applied passive design methods. Their objective was to combine external shading devices with self-shading envelopes in a 10-story hotel building located in an extreme hot-humid zone in Saudi Arabia. DesignBuilder was utilised to perform modelling and energy simulations. Even though the baseline building did not have a solar shade, fibre glass insulation was installed in the walls and roofs while the windows were double-glazed in accordance with Saudi guidelines the results indicated that the proposed shading reduced annual energy usage by 20.5%. The researchers estimated that 2 years would be needed to pay back the extra costs incurred by the use of passive shading (Shen and Tzempelikos, 2013).
The energy needed to heat and cool a residential building constitutes a substantial amount of the overall energy consumed. For instance, in Jordan, 45.4% of the electricity produced is consumed by residential households, of which 61% is used for heating. Jordan is therefore finding it increasingly difficult to meet the demand for energy. The governments of multiple nations have proposed utilising methods enshrined in codes and guidelines to reduce the amount of energy consumed by residential buildings while increasing energy efficiency and performance. Researchers are thus seeking to determine the best ways to build such buildings or increase energy efficiency in existing buildings (National Electric Power Company, 2020).
To identify the most practical and inexpensive design, another set of researchers applied passive design methods. Their objective was to combine external shading devices with self-shading envelopes in a 10-story hotel building located in an extreme hot-humid zone in Saudi Arabia. DesignBuilder was utilised to perform modelling and energy simulations. Even though the baseline building did not have a solar shade, fibre glass insulation was installed in the walls and roofs while the windows were double-glazed in accordance with Saudi guidelines the results indicated that the proposed shading reduced annual energy usage by 20.5%. The researchers estimated that 2 years would be needed to pay back the extra costs incurred by the use of passive shading (Alhuwayil et al., 2019).
Using DesignBuilder, three drawing halls were simulated on campus in a study conducted at Mansoura University in Egypt. The purpose was to enhance the energy efficiency within these halls according to three criteria: existing levels of thermal comfort and lighting, the effect of lighting and natural lighting, and whether selected alternatives could improve cooling loads without impacting thermal comfort. Ignoring daylight requirements, the results indicated that ventilation system functionality, optimising the shade overhangs and louvres of windows, and low glazing transmittance reduced cooling loads by 26% to 31% in comparison to the base case (Samaan et al., 2018).
Another study employed DesignBuilder to simulate the thermal performance of a 145 square metre rural house in Beijing, North China. The objective was to implement passive energy modifications on the building envelope to decrease the energy consumed annually for heating purposes. The most salient modifications were replacing the traditional windows with double glazed windows and installing thermal insulation within the building. The results indicated that these modifications saved 60% of the energy consumed for heating purposes (Liang et al., 2017).
Another study strived to increase levels of thermal comfort, reduce the electricity consumed, and enhance natural ventilation in high-rise residential buildings using air conditioning that contained a one-sided ventilation space (windows in just one exterior wall). Their objective was to assess whether a ventilation shaft located at the back of the room would magnify mean air velocity by increasing the pressure differential between the outlet of the shaft at roof level and the window. The room was designed to be typical of a unit in a 25-story residential building in Bangkok. The Computational Fluid Dynamics feature of DesignBuilder was utilised to evaluate the air velocities in predetermined inhabited space areas both with and without a ventilation shaft (the test and reference room, respectively). Once modified by the increased air velocity, the ambient temperature of the room was used to determine hours of comfort in both rooms during the summer. The results suggested that the mean air velocity in the test room increased significantly whereas in the reference room it was too low to produce a cooling effect without the assistance of natural wind. The number of comfort hours over the summer rose from 38% in the baseline room to 56% in the test room. This suggests that the planned ventilation shaft will save almost 2700 KWh of air conditioning energy (Prajongsan and Sharples, 2012).
In one study (Alhuwayil et al., 2019), the thermal comfort of a four-storey office building in the Netherlands was assessed. This involved performing an uncertainty analysis (Bayesian node method) and sensitivity analysis (Latin Hypercube sampling) on the effect of 89 input variables, including wind pressure difference coefficients, room air temperature distribution, outdoor climatic conditions, heat gains from people, lighting and equipment, and the control of solar shadings and windows, on the number of hours in a year when more than 10% occupants feel dissatisfied. A second study (Simon et al., 2018) similarly assessed levels of thermal assessment along with heating/cooling loads to determine the energy needs of buildings. This involved performing a sensitivity analysis (Morris method and FAST) on the effect of 24 variables, including building height, length, width, rotation, view of the ground, ground reflectivity, insulation thickness, glazing ratio, weather parameters, setpoint temperature, ventilation rates, and variables relating to occupancy and the building environment, on yearly heating loads, heating load per m3, heating power, and summer comfort. Other researchers (Samaan et al., 2018) employed a holistic approach that involved conducting different types of sensitivity analysis and uncertainty analysis.
Another study (Liang et al., 2017) was conducted to achieve multi-dimensional optimisation and analyse the performance of a semi-detached residential house with a focus on costs. Both uncertainty analysis and sensitivity analysis (metamodels) were performed to evaluate the effect of infiltration rate at 50 Pa, ventilation system heat recovery, the U-value of different building components, window type, sunscreen type, energy pricing scenarios, workmanship errors, internal heat gains, and temperature set points on net-present cost (based on effectiveness and robustness). In Harkouss et al. (2018), various forms of sensitivity analysis (DSA, MCA, SSA methods) were performed to assess the effect of 70 input parameters, including thermal conductivity of materials, thermostat setpoints, ground reflectivity, surface convection coefficients, solar radiation, and heat gains, on energy consumption, peak power demand, maximum/minimum/mean swing of temperature, mean radiant temperature, and dry resultant temperature in passive solar single zone buildings.
In another study (Zhao et al., 2015), the renovation of university buildings was examined to assess thermal comfort and adaptation to changes in climate conditions. To achieve this, the researchers performed a sensitivity analysis (SRC and ACS methods) and an uncertainty analysis to determine the effect of multiple parameters, including weather conditions, the physical properties of building materials, internal heat gains (occupancy, metabolic rate, equipment, lighting, setpoint temperature), interventions in building fabric and systems, infiltration rate, chiller COP, and boiler efficiency, on annual heating energy, annual cooling energy, and carbon emissions.
To support the decision-making process in the design of buildings a holistic assessment of an office building with an EC façade was conducted to determine levels of visual and thermal comfort. The researchers conducted a sensitivity analysis (global main index) to measure the effect of 8 parameters: location, façade, orientation, window control, WWR, SW, internal heat gains, thermal mass, and airtightness rating at 75 Pa, on heating/cooling/total/lighting energy consumption, peak load improvements (heating/cooling/total), UDI, and PP (Heo et al., 2012).
Combining cost-benefit calculation and bps, 3 case studies were conducted to assess whether the buildings were compliant with standards. Sensitivity analysis (Sobol sampling) and uncertainty analysis were therefore conducted to determine the effect of the U-values of building components, ACH, heat recovery, and thermal bridges on annual heating energy per square metre of floor. A cost-benefit analysis was also carried out based on sampling results (Garcia Sanchez et al., 2014).
Sensitivity was performed to assess the effects of building parameters and occupancy parameters on levels of thermal comfort in residential buildings. Specifically, this involved determining the effect of orientation, U-Wall, U-Roof, U-Floor, U-Windows, solar heat gain coefficient, window frame thickness, thermal control, ventilation and infiltration rate, occupation, metabolic rate, and clothing level on annual heating levels, energy consumption, and predicted mean vote index (Østergård et al., 2016).
The researchers aimed to reduce energy consumption and increase levels of thermal comfort by optimising the design of buildings. Utilising both sensitivity analysis and a genetic algorithm, they assessed the effect of window shading size, width and length, window and door infiltration rates, AF-Ventilation, U-Ext Wall, U-Int Wall, U-First Floor, U-Roof, SHD, α-Ext Wall, α-Roof, α-Floors, and thickness of floor slab on the energy consumption of heating/cooling/fans, cooling degree hours, heating degree hours, total degree hours, and global objective (Van Gelder et al., 2014).
Also focusing on energy consumption and thermal comfort, the researchers sought to optimise the design of buildings in sup-tropical regions. To achieve their objective, they performed a sensitivity analysis to assess the effect of orientation, window to wall ratio, skylight to roof ratio, U-Wall, U-Roof, U-Skylight, U-Win, U-Floor, C-Floor, C-Roof, C-Wall, α -Ext Wall, SHGC, T-vis, infiltration, glazing, floor, parapet, and corner linear transmittance on hourly discomfort index, cooling energy, and annual electricity energy (Lomas and Eppel, 1992).
A research focused on energy consumption and levels of thermal comfort throughout the entire process of building design. Their approach was to conduct a sensitivity analysis that determined the effect of multiple parameters on energy consumption, predicted mean vote index, UDI, lighting energy consumption, and heating/cooling energy. These parameters were: orientation, window to wall ratio, overhang depth, SHGC, insulation, infiltration rate, insulation thickness, window resistance, T-slab Floor, infiltration, effectiveness of sensible heat recovery, effectiveness of air distribution, heating and cooling set points, T-cool air, and T-heat air (Tian and de Wilde, 2011).
In another study (Bournas et al., 2016), researchers assessed the performance of an office room with automated shading in terms of energy consumption and the amount of daylight received. To achieve this, they conducted both a sensitivity analysis and an uncertainty analysis to determine the effects of window to wall ratio, window type, space aspect ratio, insulation, T-Shading, α-front shade, and α-back shade on UDI, lighting energy consumption, and heating/cooling energy. Focusing on energy consumption, thermal comfort, and daylight received, Kim (2017) explored how informed decisions could be made in a multi-dimensional space. They performed a sensitivity analysis to evaluate the effect of window to wall ratio, U-Wall, U-Win, solar heat gain coefficient, and degree of side fin surface reflectance on energy consumption, daylight, and over temperature.
In Ioannou and Itard (2015), the researchers compared the suitability of different methods of sensitivity analysis for assessing the energy performance of buildings. To that end, they compared the effectiveness of SRC, FAST TGP, and Morris in determining the effect of aspect ratio, window to wall ratio, number of floors, orientation, overall scale, U-values (wall roof, and window), solar heat gain coefficient, lighting peak density, and equipment peak density on heating energy use, cooling energy use, and electricity use. In Bre et al. (2016), the researchers conducted a sensitivity analysis (Morris) to assess the impact of reflectance values. They measured the impact of the reflectance of surfaces: floor, wall, ceiling, ground, and frames, on total annual illumination, useful daylight illuminance, daylight autonomy, and the daylight factor.
An investigation conducted using DesignBuilder software on a typical 100 square metre residential apartment on the 3rd floor of a three-storey building in Egypt. Two cases were taken into consideration: one with wall and roof thermal insulation, and the other without heat insulation. The sensible cooling load, air-conditioner energy usage rate, energy usage charge, and the CO2 emitted by the power station, because of energy consumed in the two situations where the room temperature was set at 24 °C, 22 °C and 20 °C, respectively. The results demonstrated that consumption of approximately 40% of the electricity used by the air conditioner culminated in a substantial decrease in running costs. This was achieved using thermal insulation (glass wool blanket) with a thickness of 0.05 m in the walls and roof of the final floor. Such energy savings would also reduce almost 30% of the CO2 generated by the power plant due to the increased energy use in the residential building (Li et al., 2018).
Case study on assessing the possible energy savings of residential buildings and utilizing solar energy was conducted in the central of Saudi Arabia. Walls, roof, and windows are responsible for reducing energy consumption by 27% for walls, 14% for roof, and 6% for window. The study's feasibility showed that the number of years needed to offset the initial investment for a proposed roof PV system exceeds the project's life due to cheap electricity tariff (0.019 $/kWh) (Almushaikah and Almasri, 2020).
A research to explore energy savings in buildings by modifying their design elements and assessing how the incorporation of such tailored elements along with effective air quality would lead to an energy efficient building. For this purpose, a typical two-story terraced house in Kuala Lumpur, Malaysia, was chosen to model energy usage using a dynamic building simulation. The building occupied an overall area of 676 square metres and was divided into 11 zones with individual thermal properties for each level (Sadeghifam et al., 2015).
A case model was conceptualised using Revit Architecture software and analysed using Energy Plus software. Present trends in energy use were defined and the optimum energy consumption level was calculated by replacing parts with new energy-efficient materials. A Design of Experiment (DOE) process was subsequently applied to find the best combination of factors. The findings showed that the ceiling fabric had the greatest impact on energy consumption and conservation in these types of buildings in tropical countries. Even wall structures had a strong impact on energy consumption. Furthermore, temperature was the most important consideration for air quality. The combined impact of temperature and diverse wall and ceiling materials optimised cooling loads through the use of a reverse brick veneer R20 for walls, suspended ceiling plaster insulation, double glazed timber frame windows, and a holding temperature of 26 °C (Jung and Jazizadeh, 2020).
This paper presents a sensitivity analysis for 12 design variables and an optimisation of the parameters of building envelopes in the Sub-Humid Mediterranean climate zone in Jordan by modifying building design variables (local type of shading, rate of infiltration (ac/h), flat roof construction, window-to-wall ratio, type of glazing, type of window blind, partition construction, rate of natural ventilation, ground floor construction, orientation of the building, outside wall construction, and window shading control schedule); DesignBuilder software was used to determine how they influence the general thermal efficiency. The objective was to achieve a reduction in cooling and heating loads while sustaining the typical levels of thermal comfort produced by utilising mechanical systems for cooling and heating.
Methodology
This section demonstrates the process of optimizing several design parameters of a building’s envelop in the Jordanian Saharan Mediterranean, very warm climate zone through simulating a baseline building’s thermal performance using DesignBuilder software and evaluating the sensitivity of the design parameters on its heating and cooling loads and eventually came up with an optimized solution for these design parameters. The current research therefore aimed to reduce the energy consumed by heating and cooling loads in residential buildings in Ajlun City in the Jordanian Saharan Mediterranean, a very warm climate zone city, by optimising various design variables of the building envelope.
The research was divided into 4 stages:
Using DesignBuilder simulation software to construct a three-dimensional model for a baseline building representing a typical Jordanian building constructed according to local codes and instructions. Identifying the design parameters and the related values on which the optimisation analysis was conducted. Defining the importance of the design variables and categorising them according to their importance level by implementing a sensitivity analysis. Performing an optimisation process that involved conducting numerous random simulations from which an optimised solution was chosen from a vast number of design parameter configurations.
Location and climate
The Sub-humid Mediterranean climate is characterized by hot dry summers and rainy winters. This climate has an average temperature ranged between −3°C, to 18 °C in their coolest winter months. This climate has a dry summer month with less than 40 mm of precipitation. The average temperature in the warmest month above 23 °C.
The Sub-humid Mediterranean climate zone in Jordan covers Ajlun and Al-Salt where Ajlun was selected as a representative city which is situated 76 kilometers north west of Amman and about 800–1,200 meters above sea level. Ajlun’s climate is moderate in summer and cold during winter and the average temperature in the hotness month in summer is 29.8 °C and the coldness winter month is January where the average daily temperature is 7 and there some days below zero Celsius. Average relative humidity is ranged between 38% in June to 64% in January. Precipitation is concentrated in the winter from November to February; the average precipitation is 467 mm per year (Fick and Hijmans, 2017).
Building baseline specifications and shape
The considered baseline residential building consists of living room, saloon, kitchen, storage room, master bedroom and two bedrooms and two bathrooms and has an overall area of 186 m2. Figure 1 shows the building layout and its zones where each room is represented by its individual zone. The building oriented where the long axis facing the south-north axis. The considered surrounding environment has no external shading or wind hurdles affecting the thermal performance of the building.
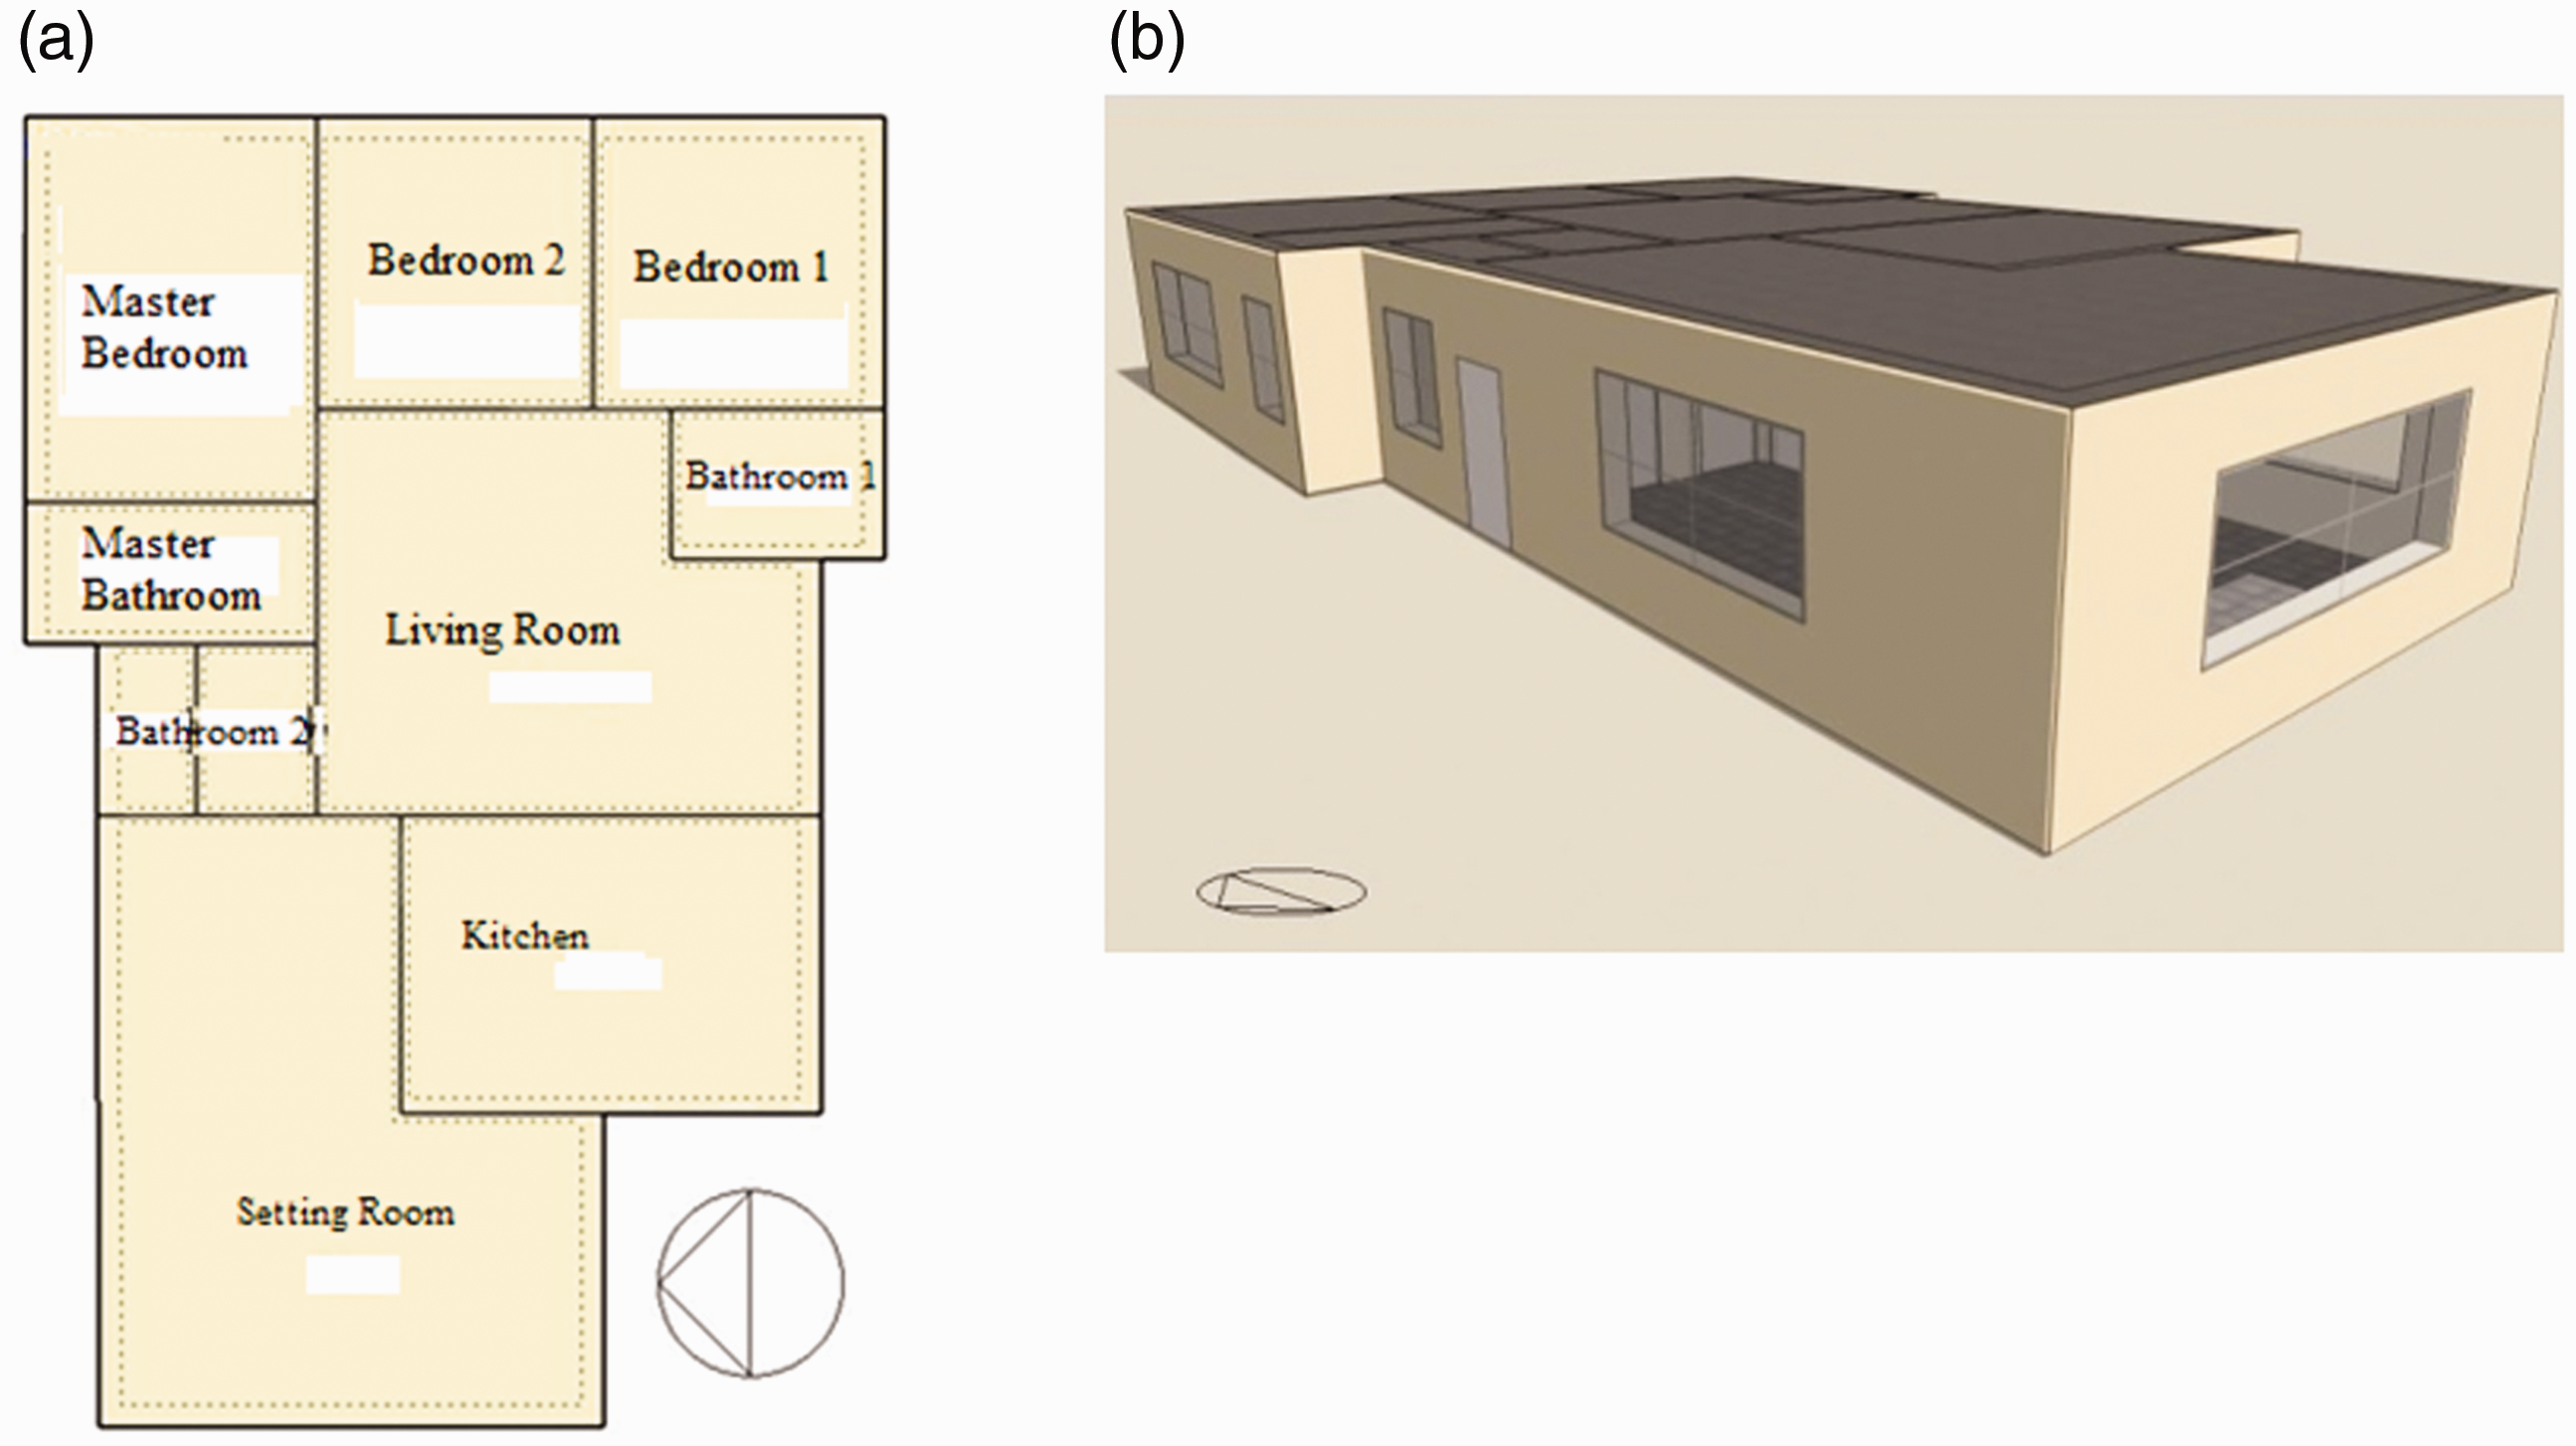
(a) Layout of the base building. (b) Overview of the building.
The building envelope materials and its specification acquired from typical architectural design schematics that tracking Jordanian building codes (Jordanian Engineers Association, 2021) and applied to Design Builder software as following:
Walls, floor and roof
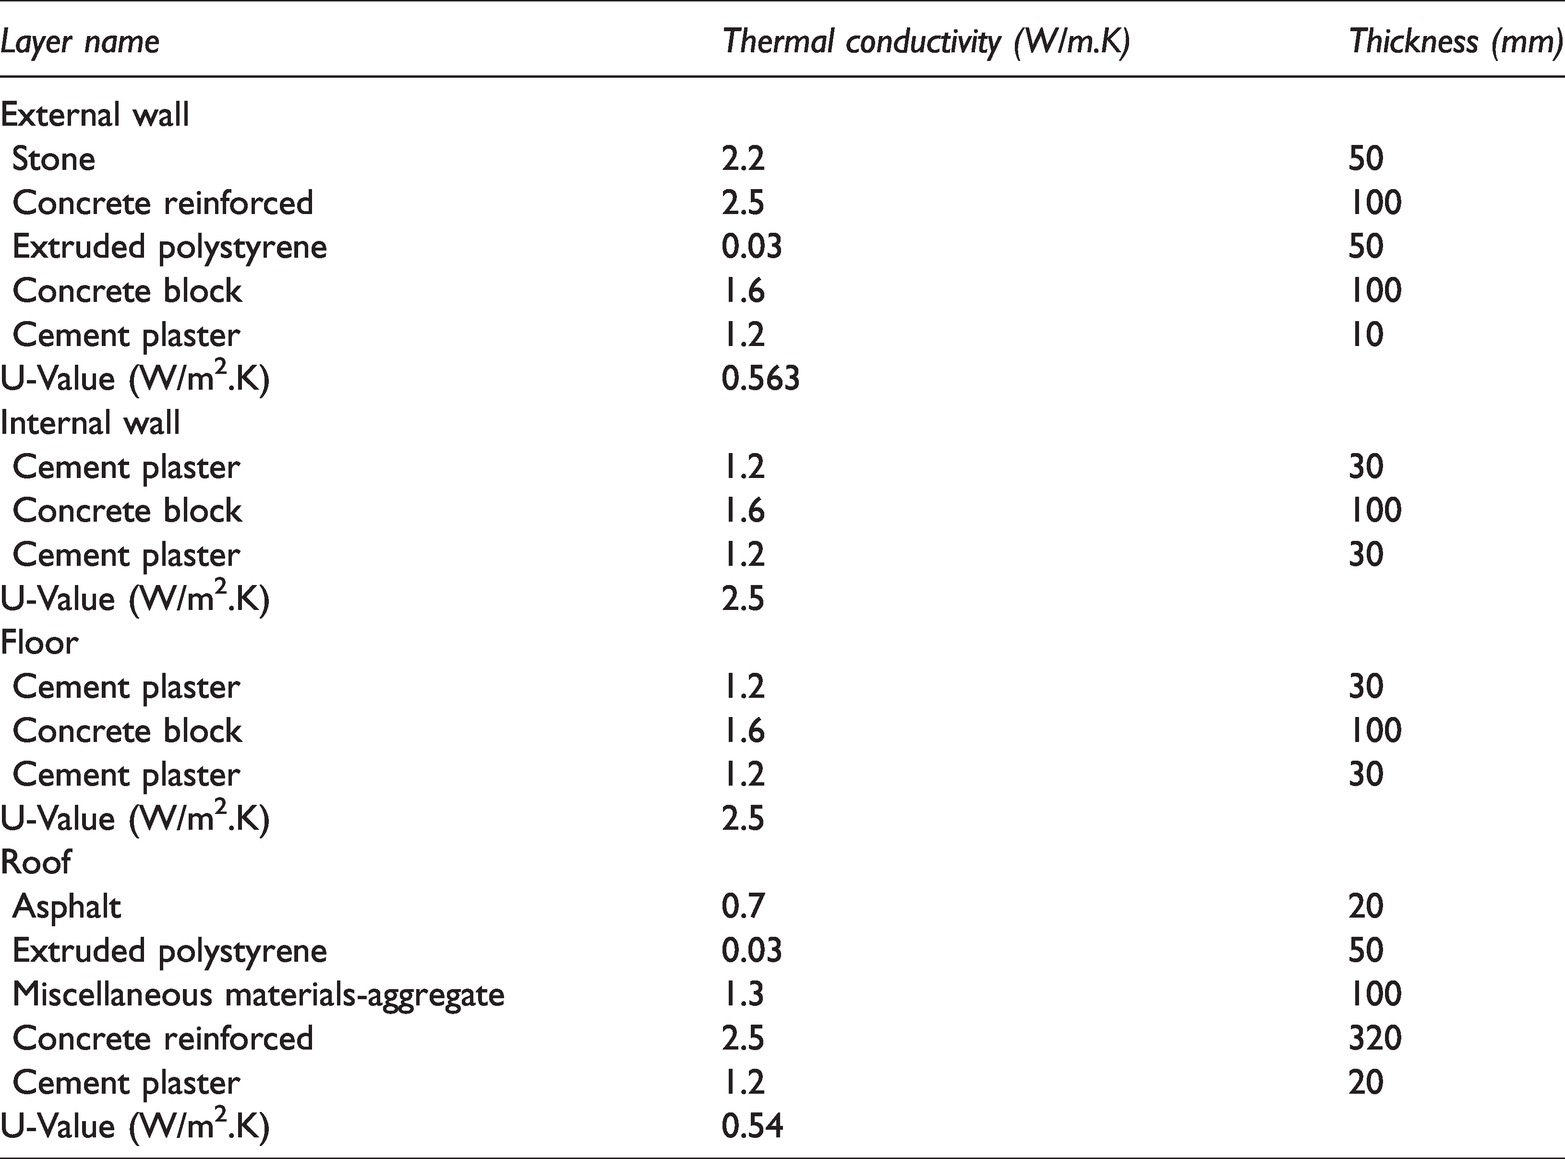
The building external, internal, roof and floor materials specification and configuration illustrated in Table 1.
Walls, roof and floor materials’ thermal conductivity and their thicknesses.
External windows glassing and frame
The external windows glassing materials’ specification and configuration illustrated in Table 2.
Glazing layer configuration and their thicknesses.
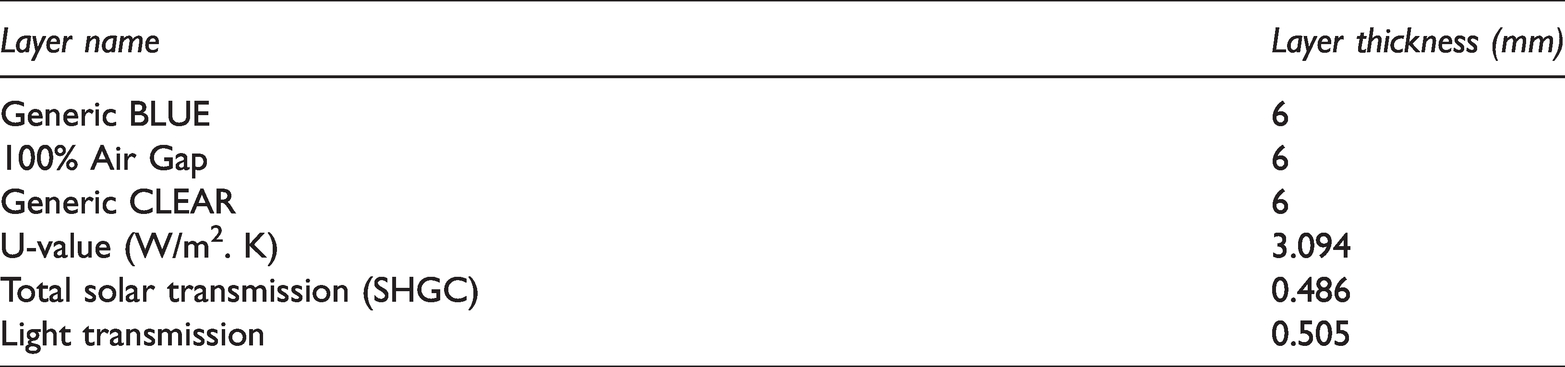
External windows glassing surrounded with thermally broken aluminum frame U-value =5 W/m2. K.
Simulation software
Desingbuilder software (version 6.1) was used to stimulate the energy performance of the building. DesignBuilder is an EnergyPlus based software tool analyzed building energy, including heating, cooling, lighting, and ventilation. Also, it used to control and measure building carbon, cost, and daylighting performance. DesignBuilder provides a sample and handle tool to simulate and optimize the building envelope and environment through rapidly comparing of buildings' elements performance and delivering accurate results immediately. DesignBuilder allows the user to exam the effect of changing each building envelope materials on energy performance and consumption in the building.
The genetic algorithms (GA) used by DesignBuilder require a number of options to control the way that the solutions evolve. The maximum number of generations to be used will determine the time and computing resources required to complete the analysis. Typical values are in the range 50–500 depending on size of the problem (the population size). Initial population size will typically be between 10 and 50 depending on the size of the analysis for 10 variables; each with 10 options will choose a value between 20 and 50. Like other settings on this dialog the best values to use for fastest and most reliable convergence will come from experience. In this research the maximum population size defines an upper limit on the population size of each generation. This value should be higher than the Initial population size. The default maximum population size is 50 which typically work well with the default Initial population size of 20. The interval size is calculated as (objective max value - objective min value)/(2n−1). The crossover rate is in fact a relative probability (compared to individual mutation probability) of a new solution being created by crossover. For example, if the crossover rate is 1.0 and individual mutation probability is 0.5, there are 67% (1.0/1.5) chance that the new solution will be created by crossover, and 33% (0.5/1.5) chance it will be created by mutation. The default value is 1.0. Typical range is 0.6–1.0 (Designbuilder.co.uk., 2021).
Energy retrofit strategies
With the object of enhance the overall thermal performance of each Jordanian climate, several design variables are considered:
Temperature set point of heating and cooling
Temperature set points of heating and cooling systems have a significant effect on energy consumption in the building. According to PMV and adaptive thermal comfort modules in this climate zones the heating and cooling set temperatures will be fixed on 19 °C for the heating system and 24 °C for the cooling system. For instance using the adaptive thermal comfort at 80% acceptability limits indicates that the comfortable temperature range between: 18 to 24 °C in winter months and 22.1 to 29.1 °C in summer months (CBE, 2021).
Building orientation
Optimum building orientation may be reducing the energy consumption in the building. To select the most energy efficient orientation, the base case design will be rotated by from 0° to 360° with a step of 5°noting that the base case has a rotation degree of 90°.
External walls insulation thickness
Thermal conductivity (U-value) of external walls has a tangible effect on the overall heating and cooling load in the building. Therefore, the effect of increasing insulation thickness will be investigated. Table 3 shows how the U-value of the external wall changes with increasing the insulation thickness.
External wall insulation thickness and its related U-values.
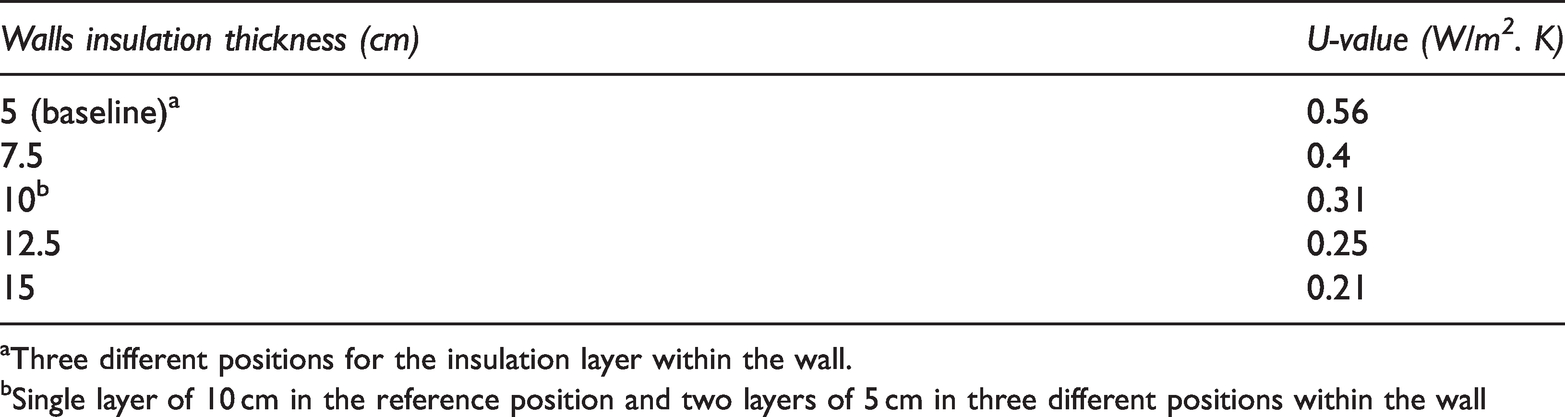
aThree different positions for the insulation layer within the wall.
bSingle layer of 10 cm in the reference position and two layers of 5 cm in three different positions within the wall
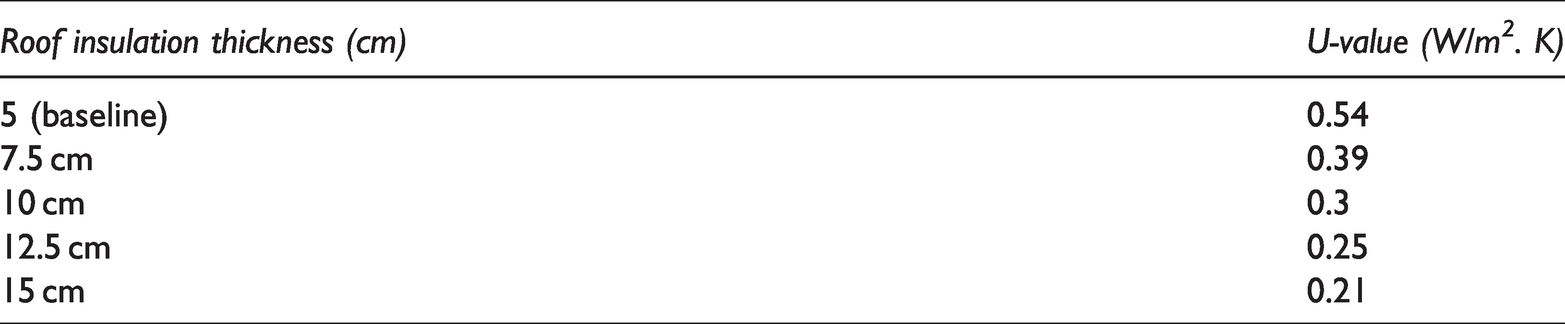
Roof and floor insulation thickness
Thermal conductivity (U-value) of roof consider as one of the main elements of building envelope. Therefore, the effect of increasing the thickness of thermal insulation layer will be tested. Table 4 shows how the U-value of the roof change with increasing the insulation thickness.
Roof and floor insulation thickness and its related U-values.
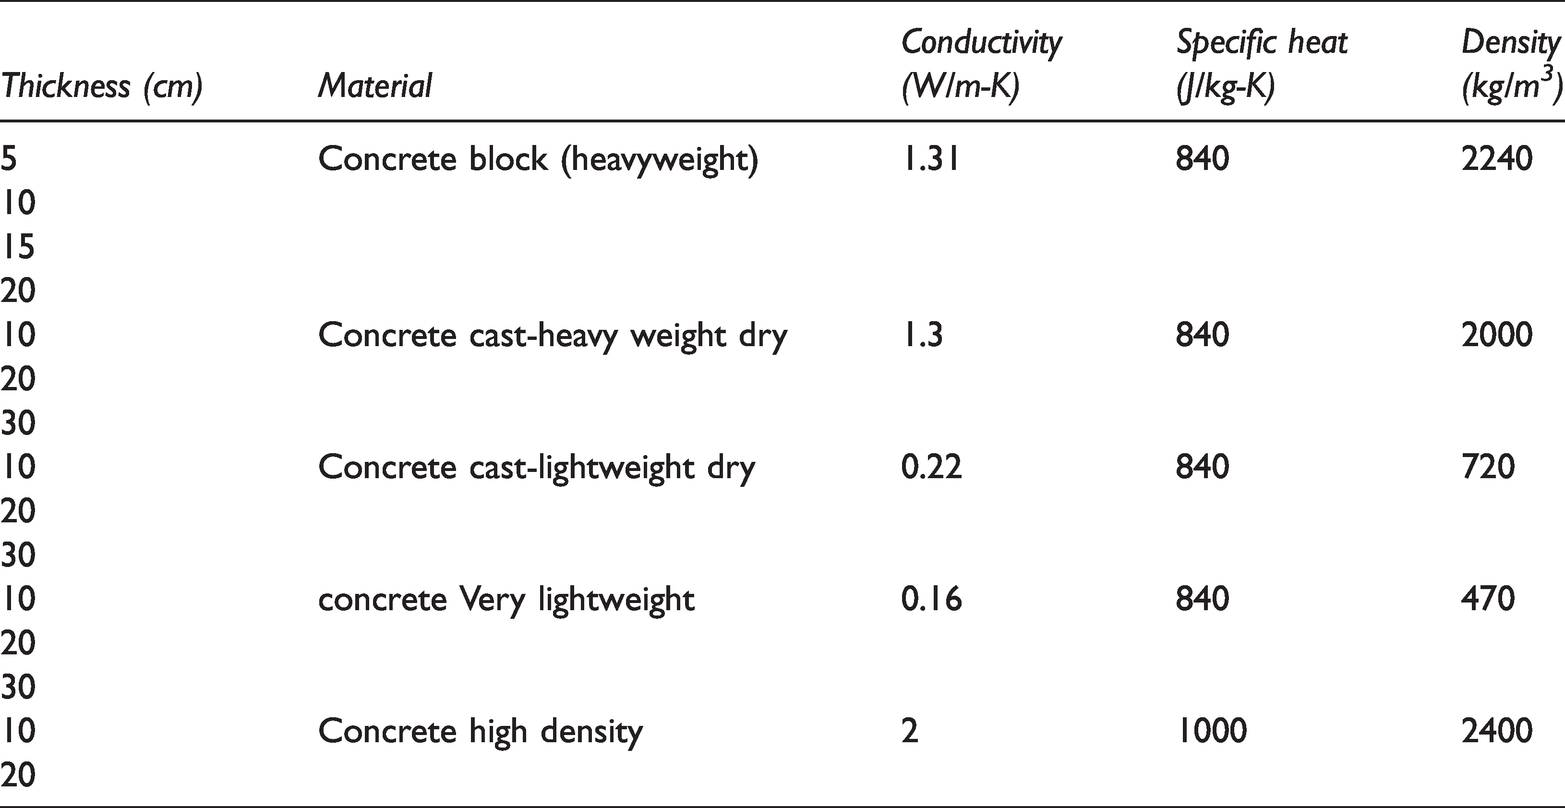
Internal walls thermal mass
The effect of changing the internal walls thermal mass will be tested. Table 5 shows the specifications of the thermal masses will be tested for the construction of the internal walls.
Specifications of various thermal masses for internal walls.
Specification of glassing types.
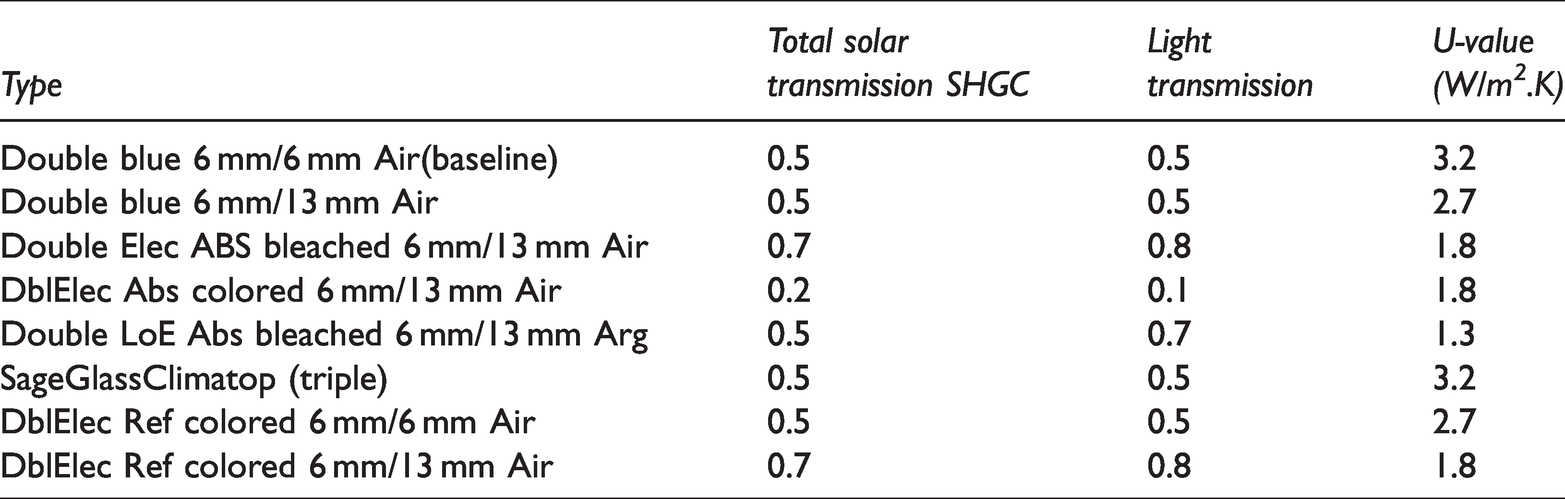
Glazing type
The glassing material feature and specification have a significant effect on energy performance. Therefore, several glassing types have been investigated to examine its effect on heating and cooling loads in building. Table 6 shows the Specification of those types which obtained from the DesignBuilder data base.
Window to wall ratio
Windows consist one of the important elements in building envelop that have a significant impact on heating and cooling loads in the building as it allows for energy gain from the sun radiation while it might increase the infiltration rate and the thermal conductivity between among the building and the outside environment. Therefore, the windows to wall ration will be investigated from 0% to 100% with a step of 1%.
Infiltration rate (air leakage)
Infiltration rate is defined as air leaking that entering the inside of the building from the outside surrounding environment through cracks, openings, and doors. The infiltration rate measured by air change per hour (ac/h). Different infiltration rates will be tested from 0.25(ac/h) to 1.5(ac/h).
Local (external) shading
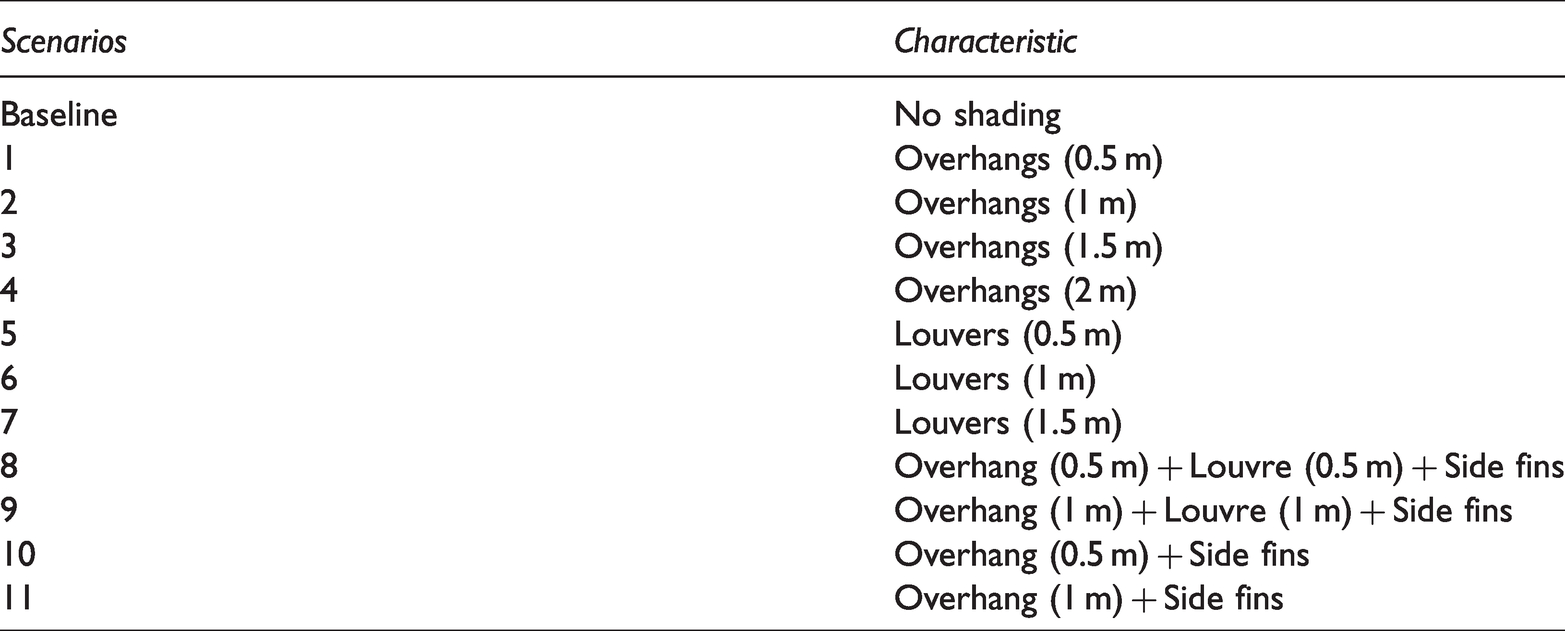
Local shading known as models built on the outer surface of the window in the building envelope like overhangs, louvres and side fins (Figure 2). Different scenarios were created to be tested using those devices individually or in combination Table 7.
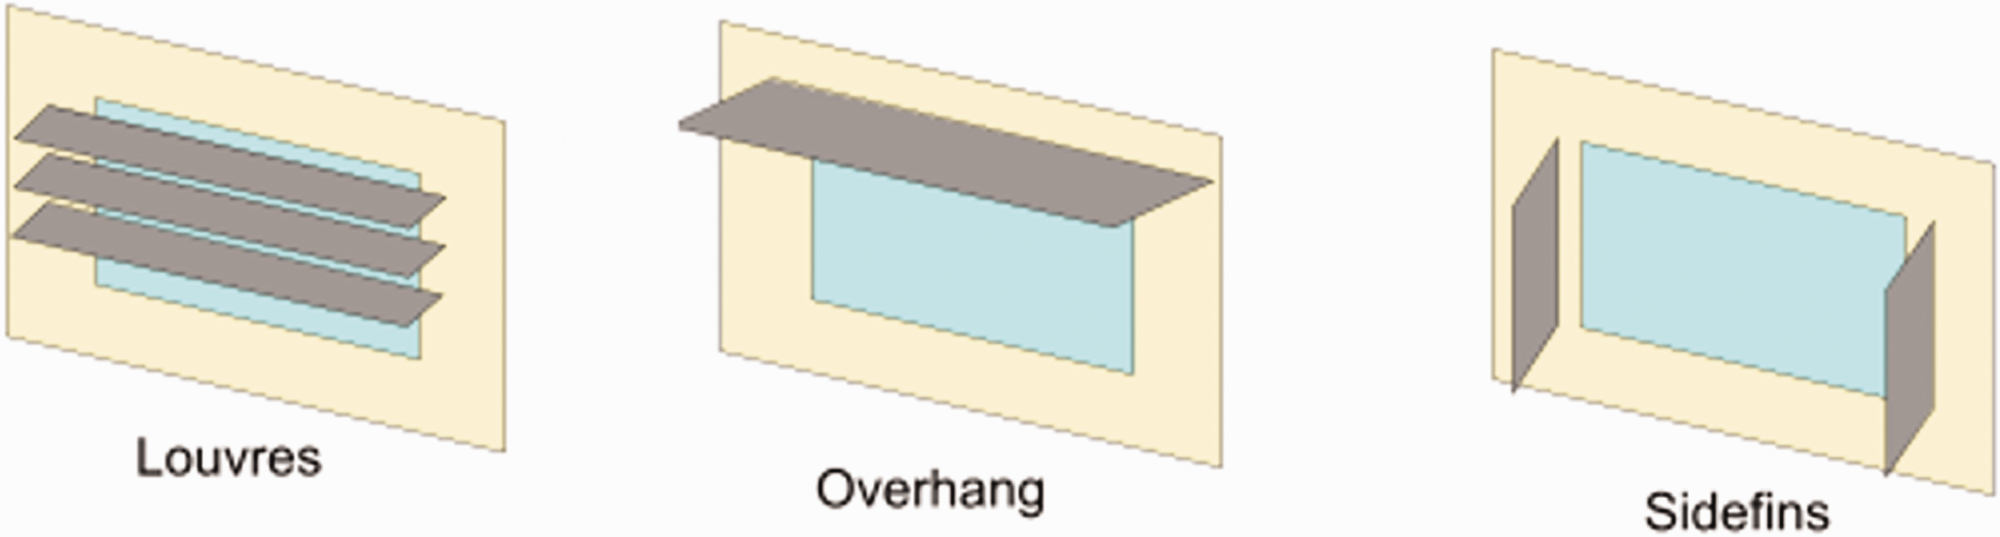
Local shading techniques (overhangs, louvers and side fins).
External windows shading scenarios.
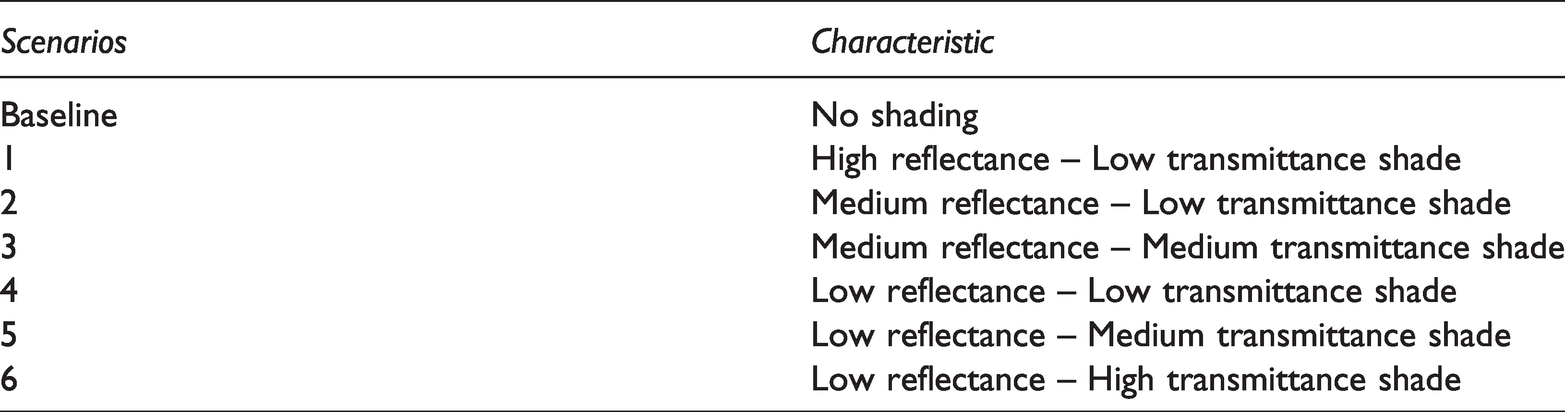
Window shading type and schedule
Window shading devices knows as tools that cover the window-glassing surface which can be controlled to be opened or closed to allowing or preventing the radiation or portion of it to enter the building depending on its reflectance and transmittance properties.
Therefore, different types of diffusing shades with different light properties will be tested to find out its influence on the heating and cooling loads (Table 8). Also, 11 schedules controlling the opening of the window shading will be tested.
Diffusing shades types.
Natural ventilation rate and schedule
If controlled properly, natural ventilation plays an important role in reducing the heating and cooling loads as it increases the heat exchange between the inside of the building and the outdoor environment based on the temperature difference between the two zones. Therefore, the natural ventilation rate was tested for 0(ac/h) to 5(ac/h) with a step of 0.1(ac/h) while the schedule was set according to the occupancy of the rooms.
Sensitivity analysis
Design variables might have an interaction effect on the heating and cooling loads. Thus, testing one variable at a time or using any local sensitivity analysis method might not provide the optimum solution. Hence, optimisation for these different variables must be performed. However, if the number of variables and their values are immense then there will be an enormous number of possible combinations of simulations; conducting all these simulations could take days or even months. Therefore, a global uncertainty and sensitivity analysis study needed to be conducted as this indicates which variables have the highest and lowest impact on the desired output. Consequently, the number of variables considered in the optimisation process was reduced to speed up the optimisation process.
A sensitivity analysis elaborates the relationship among the design variables and the desired objectives. Several methods can be conducted, such as Fourier amplitude sensitivity testing(FAST), Morris, and regression. In this research, the regression method was used as it is an existing feature within DesignBuilder software and is a comprehensive method that can be applied to obtain responses for complex models. In such cases, the important factor in the sensitivity analysis is the Standardised Regression Coefficient (SRC) which identifies the most and least important variables. The objectives are heating and cooling load while the design variables are those mentioned in section 3.4 (Energy Retrofit Strategies).
Several points need to be considered to ensure DesignBuilder provides accurate results:
The sample size of the random simulations is usually 1.5 to 10 times the number of variables while DesignBuilder recommends a sample size equal to or higher than 10 times the number of variables. In this research, there were 12 main variables, some of which might have 16 possible values or more. Hence, the sample size was chosen to be 100 times the number of variables, which equals 1200 random simulations. When defining the variables, DesignBuilder recommends ordering their values according to whether they are increasing or decreasing, such as ordering the external wall insulation by increasing or decreasing the related U-value. DesignBuilder also recommends not using options which have the same value when conducting a sensitivity analysis. For instance, changing the insulation place within the wall will not change the wall U-value and therefore such options were not included in the sensitivity analysis.
Optimisation
After conducting the sensitivity analysis, the design variables were categorised according to their effect on the heating and cooling load. The variables were then divided into two groups: the high importance group (consisting of all variables except the ones which have low importance on both heating and cooling loads) and the low importance group.
Optimisation then took place, which is a strategy for effectively scanning and selecting design alternatives that better achieve core product efficiency objectives. Optimisation is in many respects similar to a better-known methodology that uses design curves to evaluate how the performance of objectives varies in line with changes in the design variables of the building.
Genetic algorithms (GA) search for optimal design options in DesignBuilder Optimisation even more effectively than parametric regression as they allow for more variables (up to 10). They also allow for 2 objectives to be included in the analysis, which in this case are “minimising heating load” and “minimising cooling load”. The analysis usually begins with a population of randomly generated values, and the process is iterative whereby the population in each iteration is called a generation. Every generation measures the fitness of the variables in the population; in the optimisation problem, the fitness is typically overcome by the value of the objective function. The fitter individuals from the existing population are stochastically chosen and the genome of every individual (recombined and probably spontaneously mutated) is converted into a new generation. The next version of the algorithm uses the latest generation of possible solutions. The algorithm typically stops when a certain number of generations has been generated or when the population has achieved a sufficient fitness stage (Whitley, 1994).
With heating on one side and cooling on the other, the results of the study are graphically illustrated, and the output of each combination of variables simulated as part of the analysis are presented on a graph. For heating/cooling loads, the minimum values constitute the “Pareto Front” of optimal designs on the left bottom of the cloud data-point.
The high importance group were optimised with a random sample of 6000 simulations while the low importance group were optimised with a sample of 2000 simulations. After conducting the optimisation, the solution of the two groups that has the lowest summation of heating and cooling loads was selected and combined and a simulation then run to determine whether the heating and cooling loads can be reduced further.
Results and discussions
Because the purpose of the research was to optimise the design parameters of several building envelopes, a baseline residential building that complied with Jordanian codes was designed and its thermal performance evaluated using Designbuilder software. This step was extremely important as it constituted the starting point from which the thermal performance of various designs was compared to evaluate whether a certain design had a positive or negative effect on the thermal performance of buildings. The simulation demonstrated that, for sub-humid Mediterranean climate zones (Ajlun, Jordan), the annual consumption of energy in the baseline building was 776.92 KWh/year and 3736.76 KWh/year for cooling load and heating load, respectively.
Sensitivity analysis
Sensitivity analysis (SA) was conducted for 12 design variables to evaluate their influence on both heating and cooling loads simultaneously using a regression method with 1200 random runs. Based on the SA, the variables were divided into two groups according to their importance: a high importance group (window to wall ratio, ground floor construction, local shading type, infiltration rate (ac/h), glazing type, flat roof construction, natural ventilation rate, window blind type) and low importance group (partition construction, site orientation, external wall construction, window shading control schedule). A genetic algorithm (GA) was deployed for both groups using 6000 and 2000 runs for the high importance and low importance variables, respectively. Three potential solutions for the high importance variables were then compared: minimising heating load individually, minimising cooling load individually, and minimising heating and cooling loads simultaneously. The optimal solution chosen was minimising both heating and cooling loads as this was more energy efficient. The optimum solution for the high and low importance variables was selected based on the lowest summation of the heating and cooling loads.
Using the impeded feature in DesignBuilder, a sensitivity analysis was conducted on 12 design variables. The method applied was regression where the indicating factor was the Standardised Regression Coefficient (SRC) and the number of random simulations chosen was 100 times the number of design variables. The SRC of the cooling load presented in Figure 3 indicates that cooling load was most strongly influenced by window to wall ratio. The input and output were directly related. Increasing window to wall ratio thus increased cooling load. Cooling load was also strongly influenced by local shading type and moderately influenced by natural ventilation rate, ground floor construction, flat roof construction, infiltration (ac/h) and window blind type. Site orientation, partition construction, external wall construction, glazing type, and window shading control schedule did not have a notable influence on cooling load and these inputs could therefore be ignored in further analysis of the cooling load for this model.
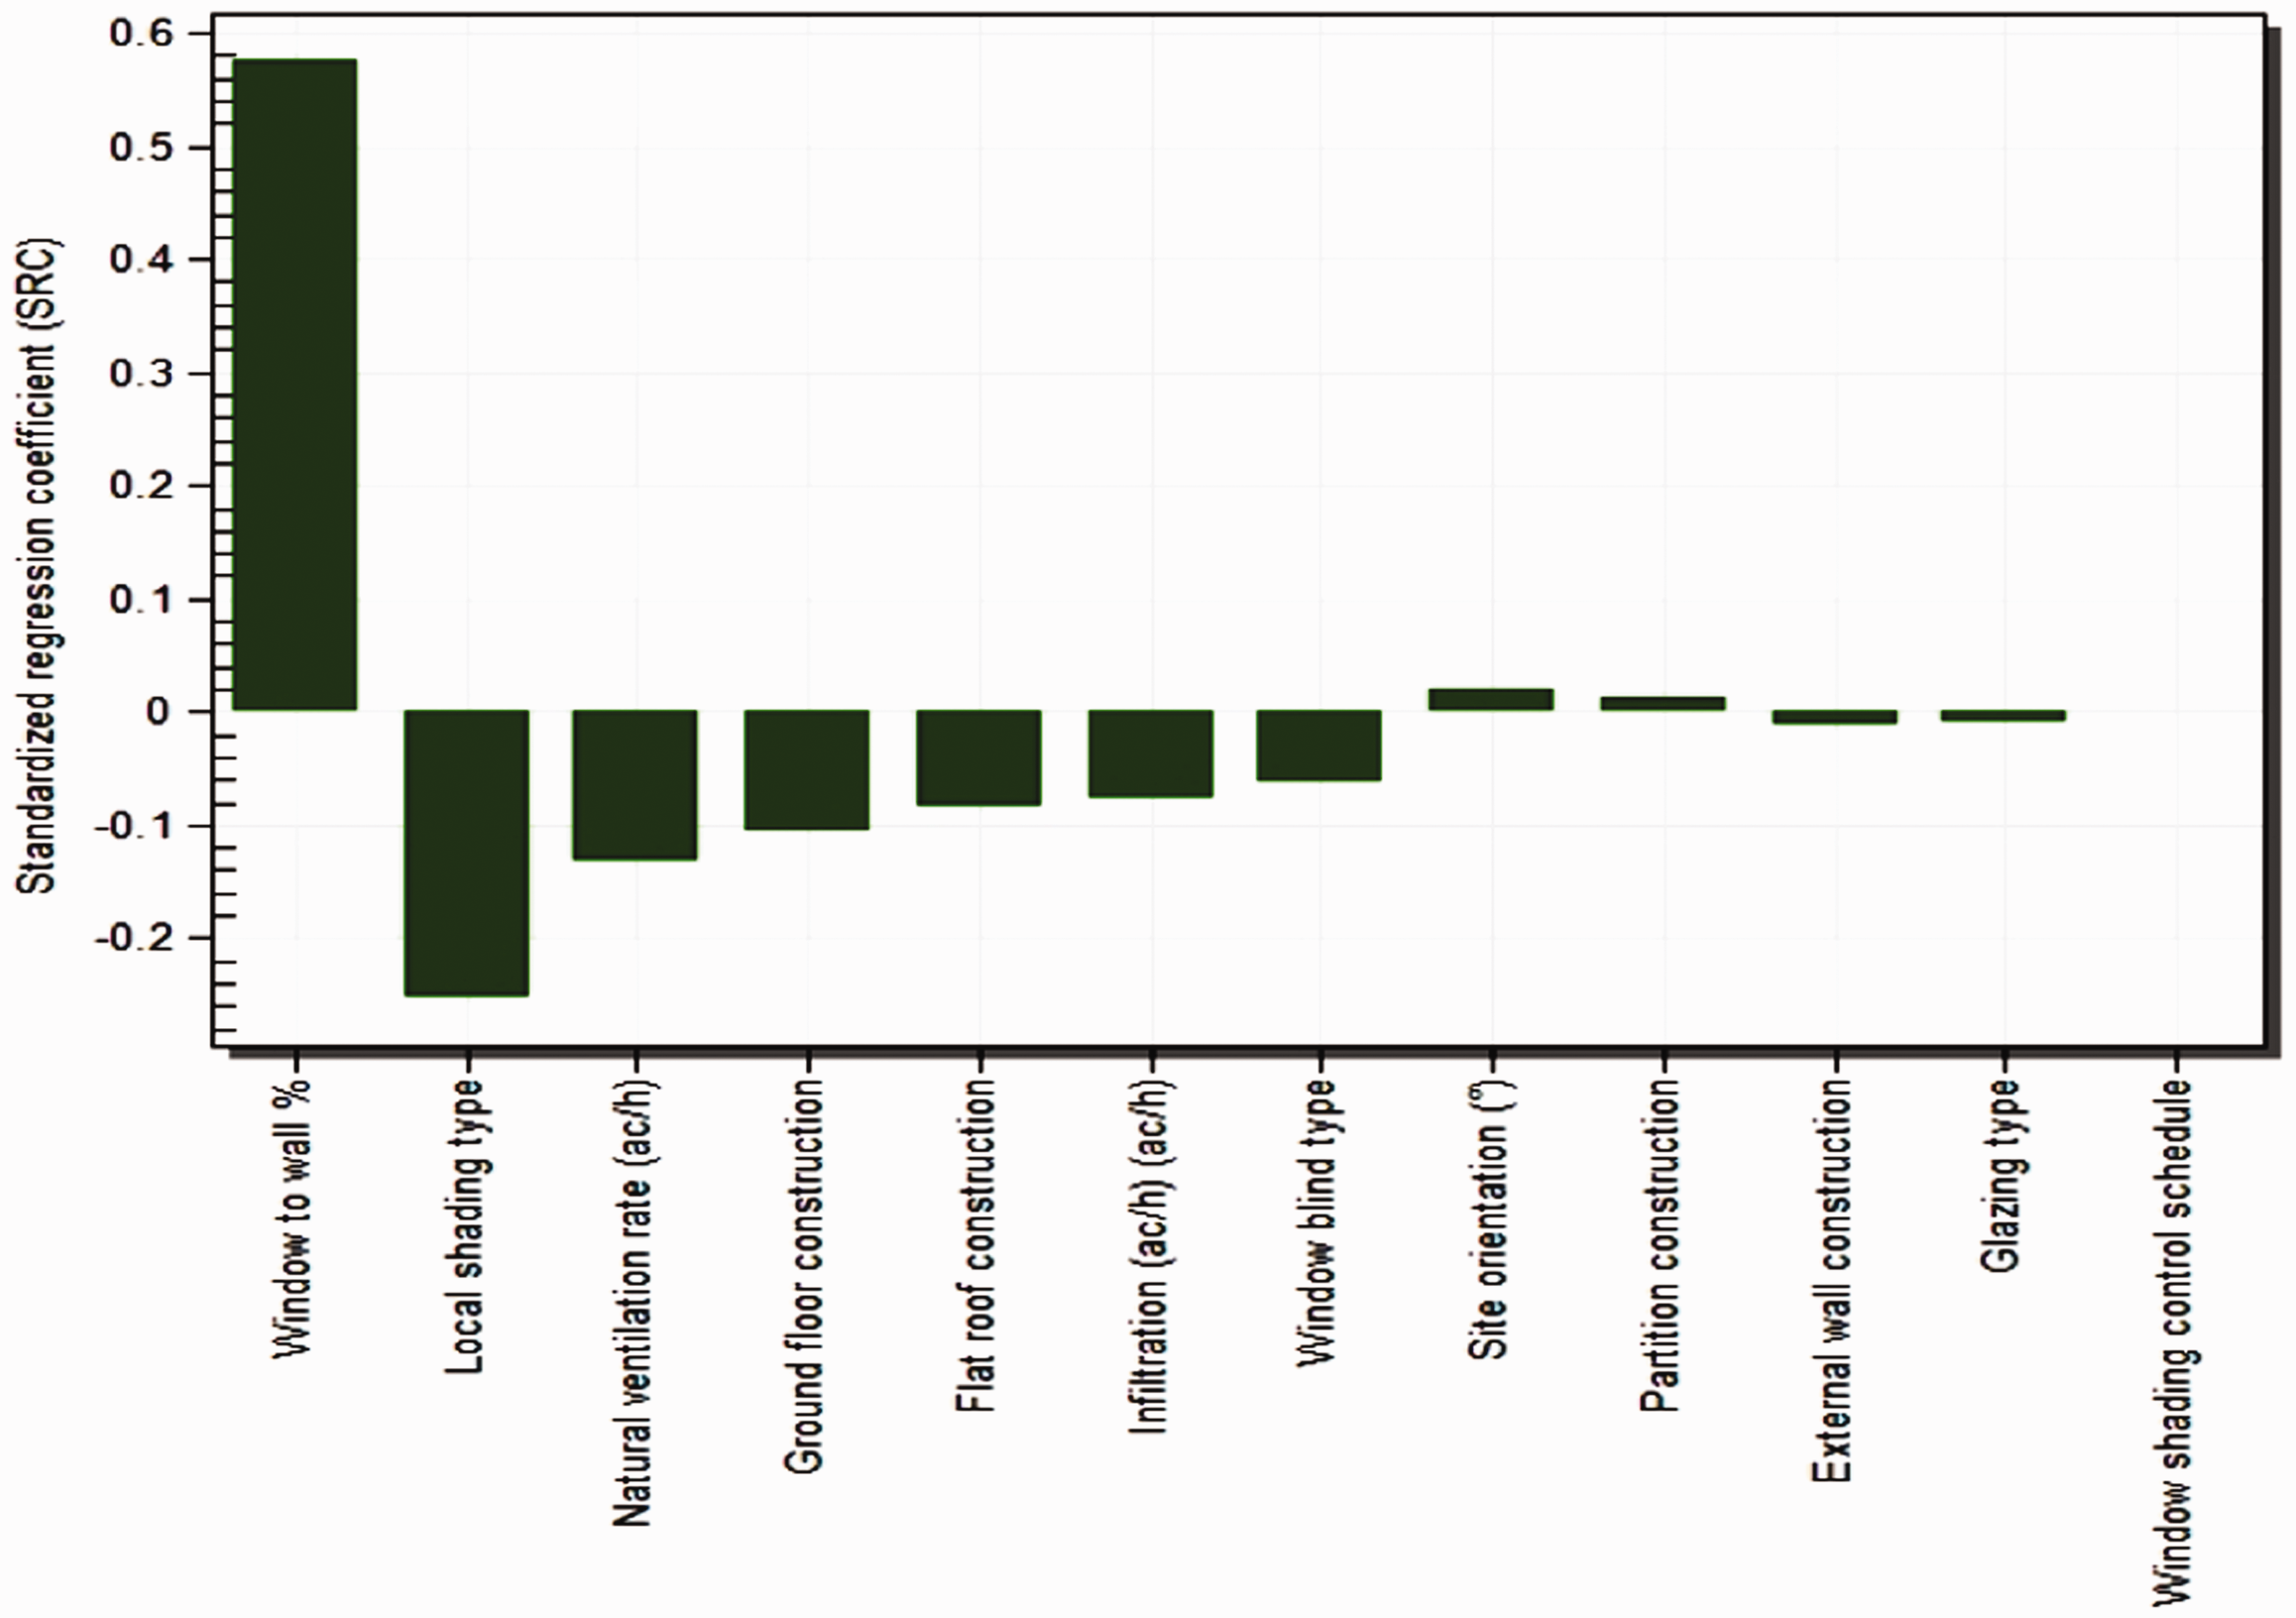
Cooling load sensitivity analysis.
The SRC of the heating load presented in Figure 4 indicates that heating load was most strongly influenced by infiltration (ac/h). The input and output were directly related. Increasing infiltration (ac/h) thus increased heating load. Heating load was also strongly influenced by glazing type and moderately influenced by local shading type, window to wall ratio, and flat roof construction. Window blind type, site orientation, window shading control schedule, partition construction, external wall construction, natural ventilation rate, and ground floor construction did not have a notable influence on heating load and these inputs were therefore ignored in further analysis of the heating load for this model.
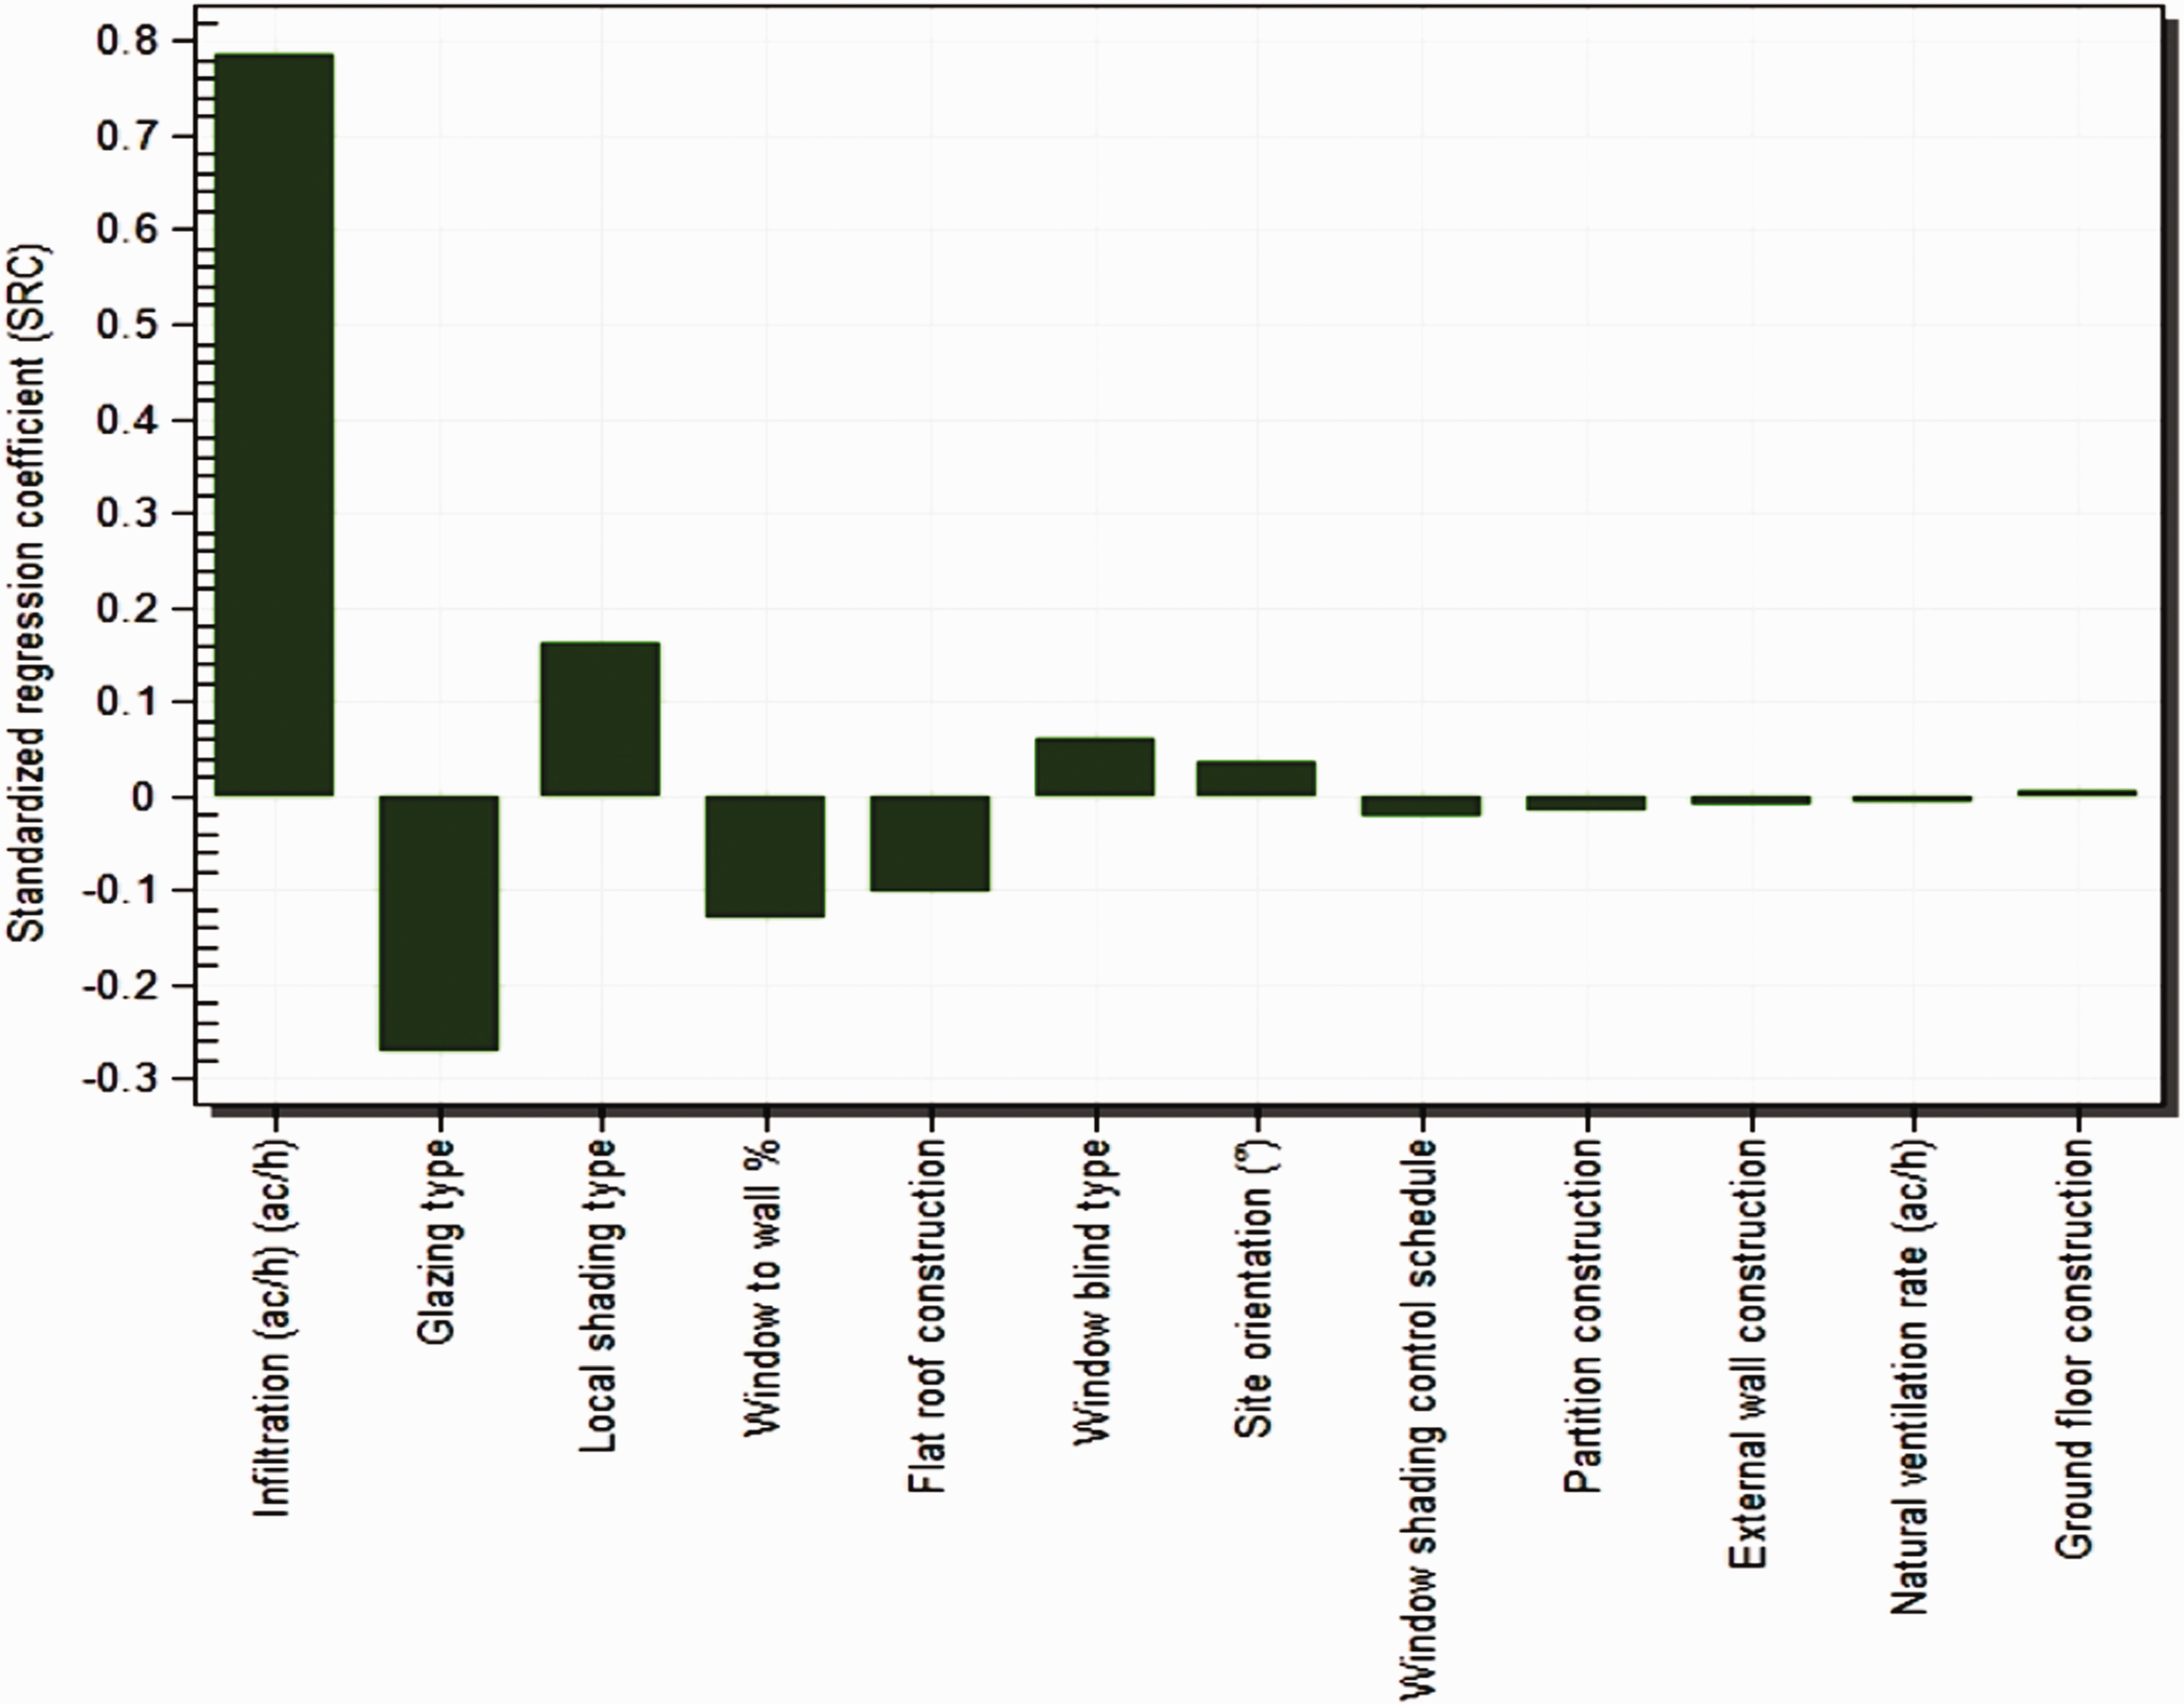
Heating load sensitivity analysis.
The design variables were then categorised according to their importance for heating and cooling loads, as presented in Table 9. This made it easier to determine which variables to include/exclude in the optimisation process
Sensitivity analysis.
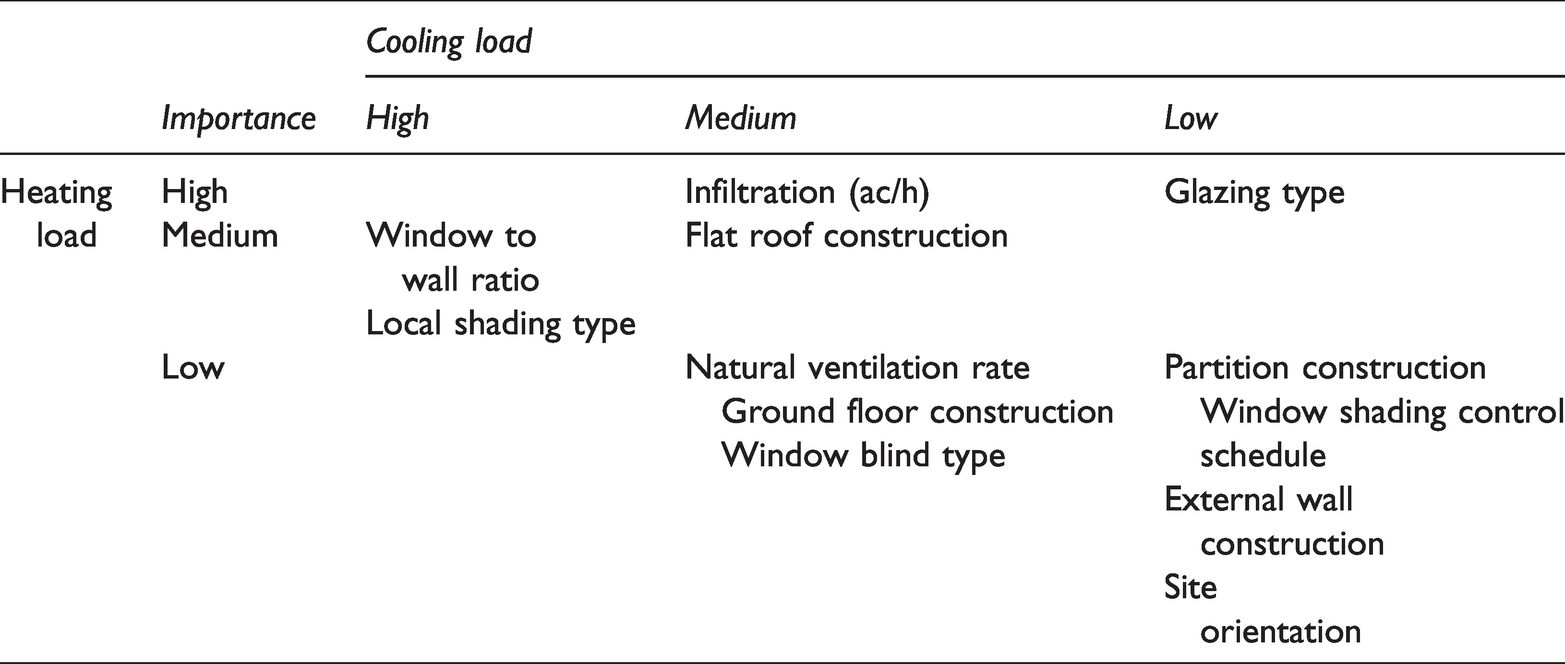
From this, two groups of design variables were identified:
The high importance group (window to wall ratio, ground floor construction, local shading type, infiltration rate (ac/h), glazing type, flat roof construction, natural ventilation rate, window blind type).
Based on Table 3–1 and the SRC graphs; window to wall ratio, glazing type, and local shading type were included in the high importance group but with different levels of influence on both heating and cooling loads. These factors combined define the amount of solar heat gain. Because the sub-humid Mediterranean can experience extreme heat in the summer and cold in the winter, these factors need to be optimised to limit the amount of direct solar radiation entering the building in summer while maximising it in winter.
Decreasing the U-value of the flat roof construction and ground floor construction by increasing the insulation thickness is too expensive, yet it plays a major role on trapping the indoor temperature and delays heat transfer from the outdoor environment to the inside, thus delaying and reducing the inside peak temperature in the summer season.
Conversely, the infiltration rate had the highest negative impact on the heating load as it leaked the heat contained in the building to the external environment while having a slight impact on the cooling load. The infiltration rate can be substantially reduced at a relatively low cost by applying insulation material to window edges, wall cracks, and door frames.
The natural ventilation rate can play a significant role, especially in the summer season, if properly controlled based on the temperature difference between the indoor/outdoor environments.
The low importance group (partition construction, site orientation, external wall construction, window shading control schedule).
Although partition construction and external wall construction exerted a low influence on heating and cooling loads, in most cases increasing insulation thickness or using better insulation material is extremely expensive. Thus, it is likely to be retained as it meets the standards. However, it was still considered in the optimisation to determine the most suitable values. Site orientation, by contrast, is usually restricted by the land shape and location but this research considered no such restriction when determining the optimal orientation.
Optimisation
The genetic algorithm (GA) technique in the DesignBuilder was deployed to optimise the 2 groups of design variables by setting the objectives of the optimisation to minimise heating and cooling loads. Overall, 6000 random simulations and 2000 random simulations were utilised for the high importance group and low importance group, respectively.
High importance variables
The 6000 solutions of the random simulations are presented in Figure 5 along with their related heating and cooling loads. The Pareto Front (the most optimal solutions) is presented in orange colour.
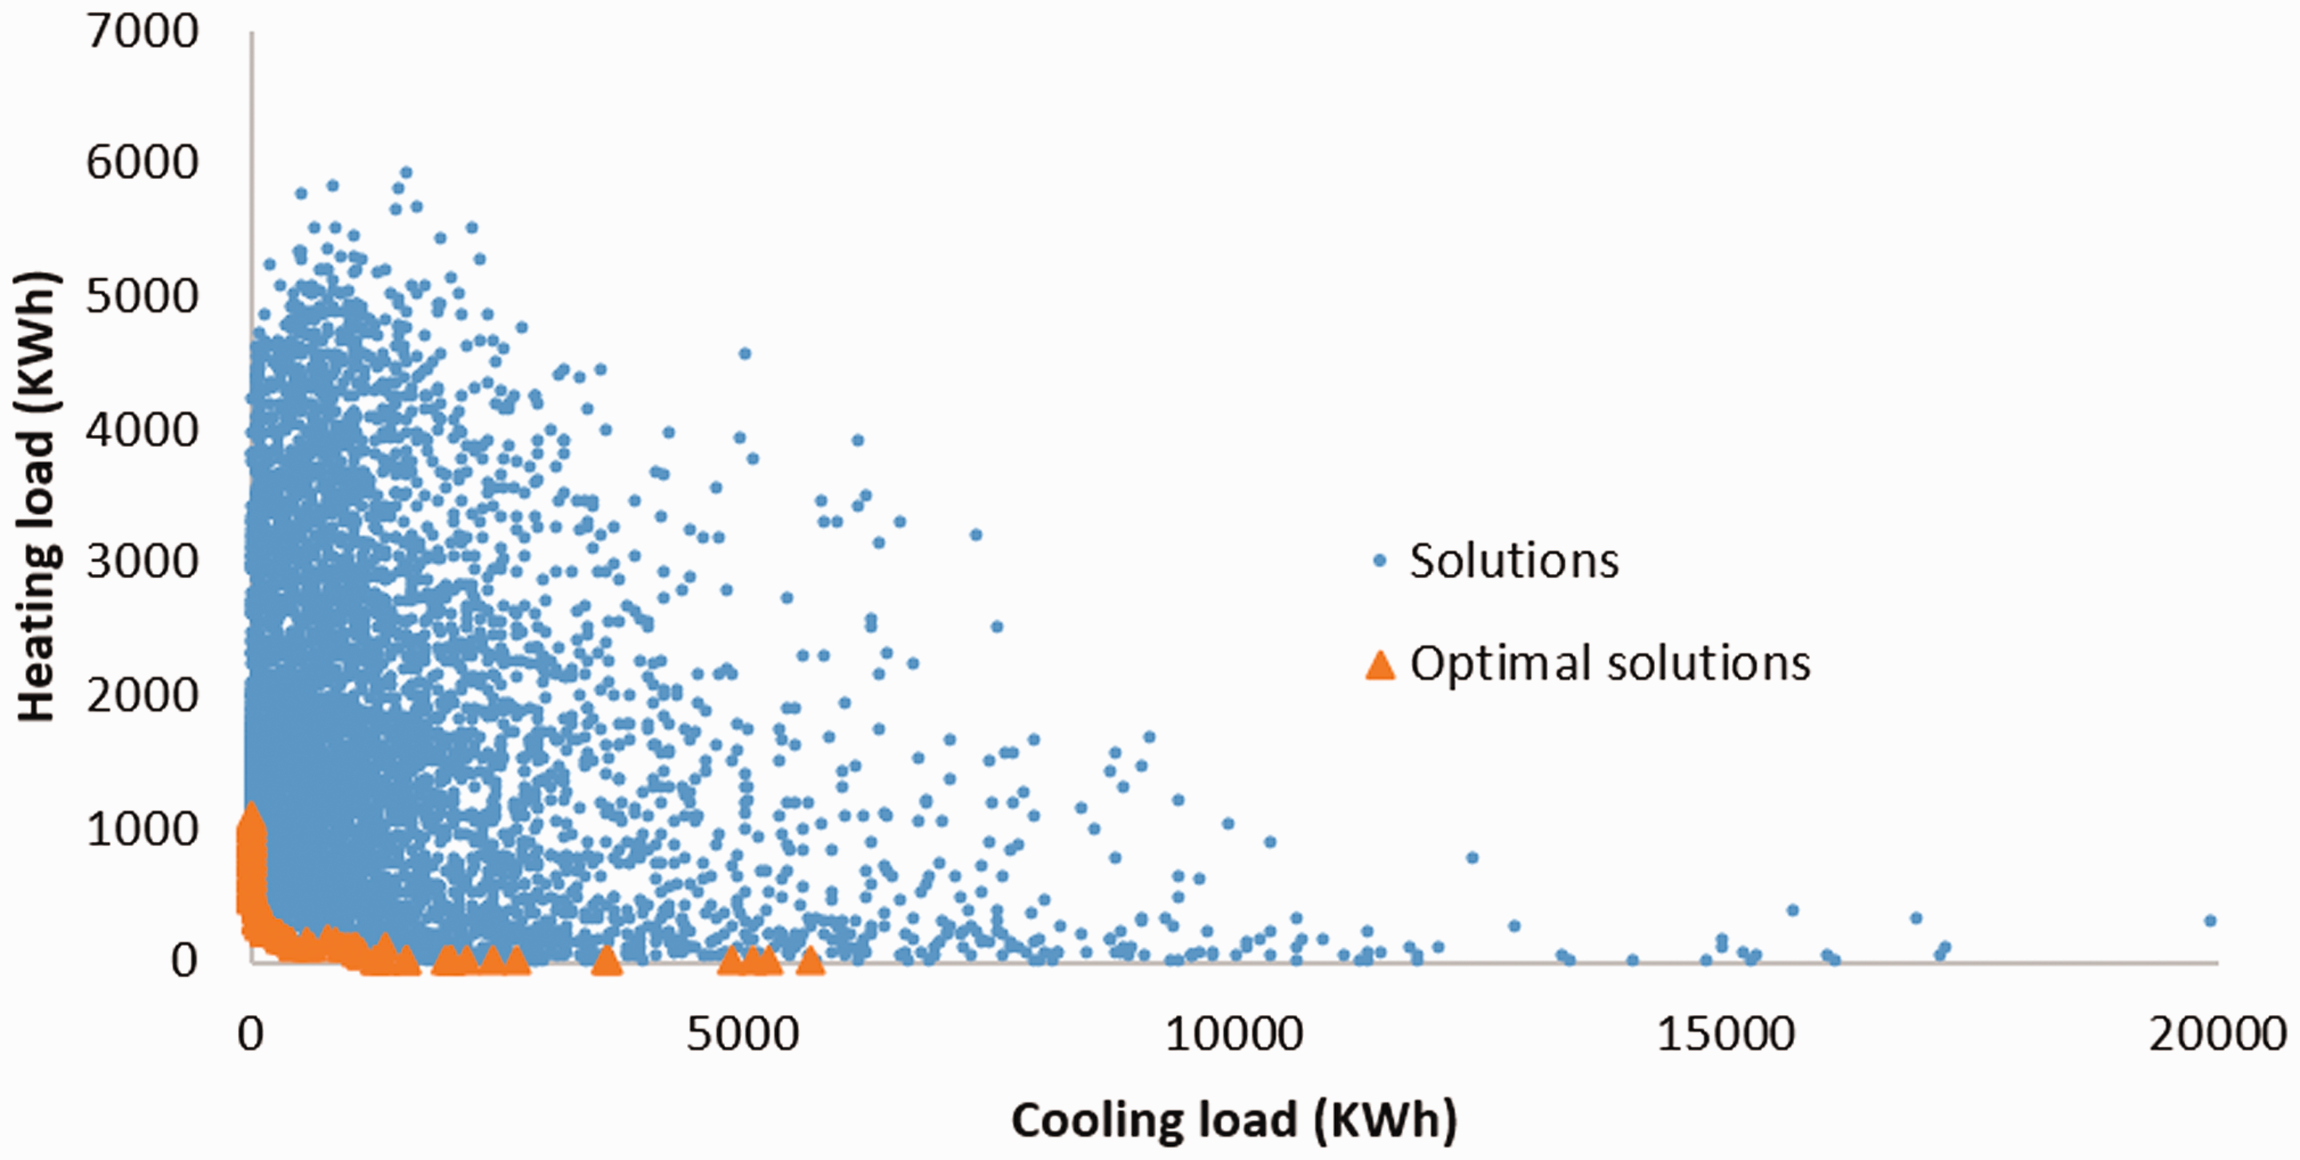
Optimisation of high importance variables.
Three solutions: (minimising cooling load, minimising heating load, minimising the summation of heating and cooling loads) were defined among the Pareto Front as follows:
Minimising cooling load:
The cooling load of the baseline building was relatively low (776.92 KWh/year). Thus, out of the 115 optimal solutions; 20 solutions had a cooling load less than 1KWh/year and the related heating load ranged from 770.52 KWh/year to 1094.25 KWh/year.
The design variables for the solution with the lowest heating load (770.52 KWh/year) among the 20 solutions is presented in Table 10.
Optimum cooling load solution for high importance variables.
Most of the design parameters for these 20 solutions were the same. The most variable parameters were natural ventilation rate, which ranged from 0 to 4.6 (ac/h) and Window to wall ratio, which ranged between 4 and 40%.
Minimising heating load:
Heating load was the dominant load for the base building (3736.76 KWh/year), yet by choosing optimal solutions that concern the heating load despite the corresponding cooling load, the heating load could not be reducedby optimising the high importance design parameters alone. Nevertheless, 21 optimal solutions achieved a heating load lower than 100 KWh/year while the corresponding cooling load ranged from 1082.75 KWh/year to 5721.8 KWh/year.
The design variables for the solution with the lowest cooling load (1082.75 KWh/year) among the 21 solutions are presented in Table 11.
Optimum heating load solution for the high importance variables.
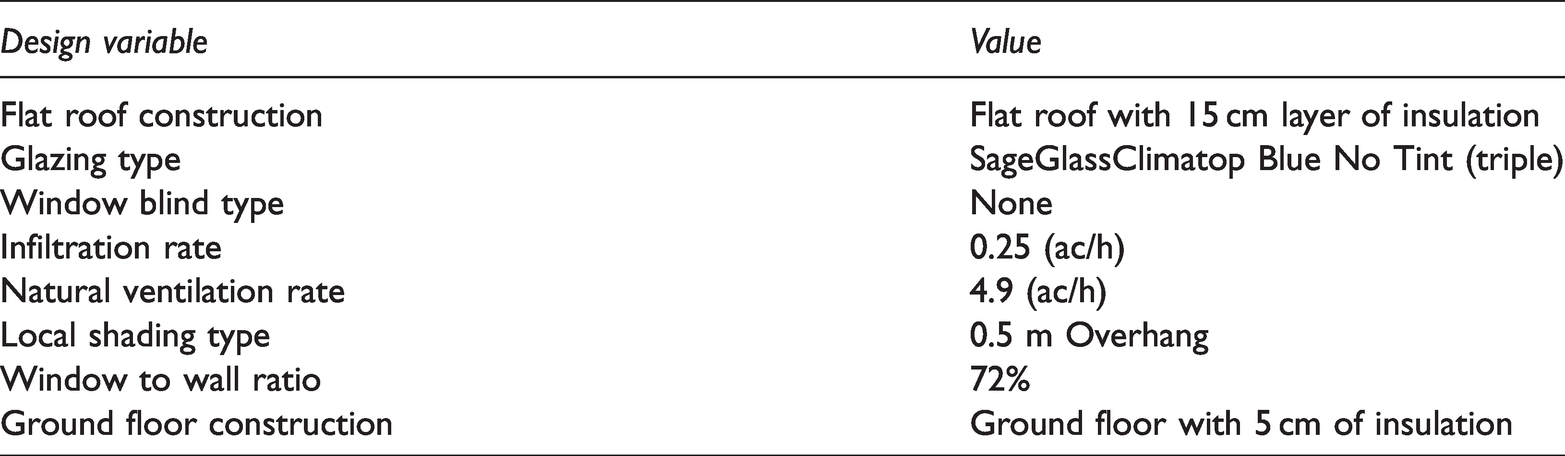
The 21 solutions shared virtually the same flat roof construction, glazing type, window blind type, and infiltration rate. However, natural ventilation rate ranged between 0.3 and 4.9 (ac/h), local shading type varied among all the possible types defined as an input for the simulations, window to wall ratio ranged between 72 and 100%, and ground floor construction was insulated with an insulation layer between 5 and 15 cm in thickness.
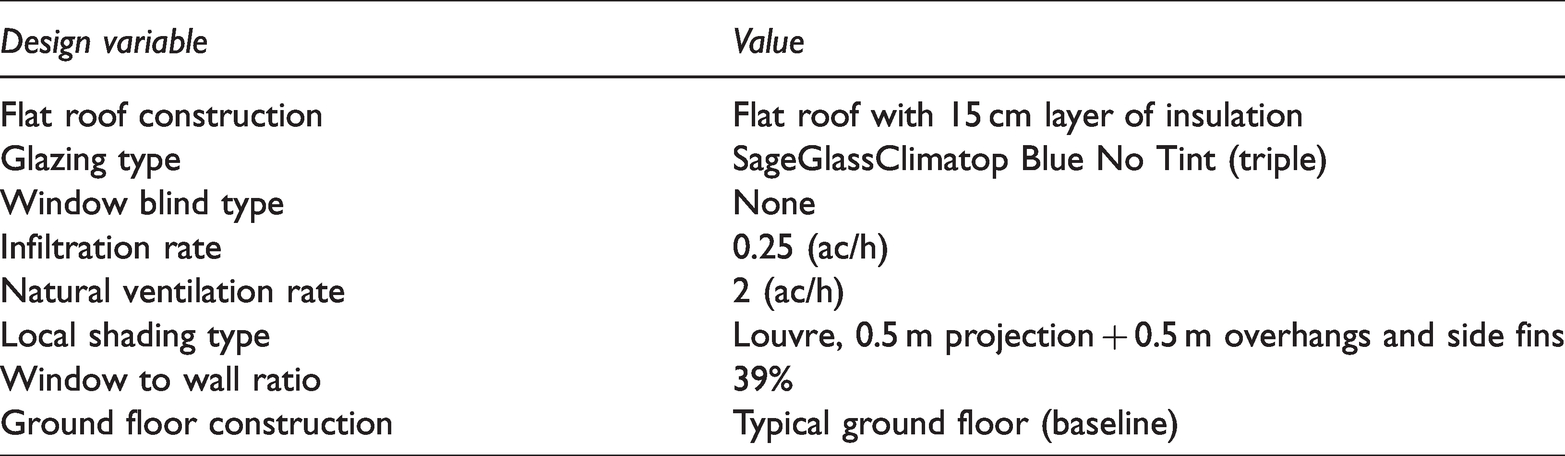
Minimising both heating and cooling loads:
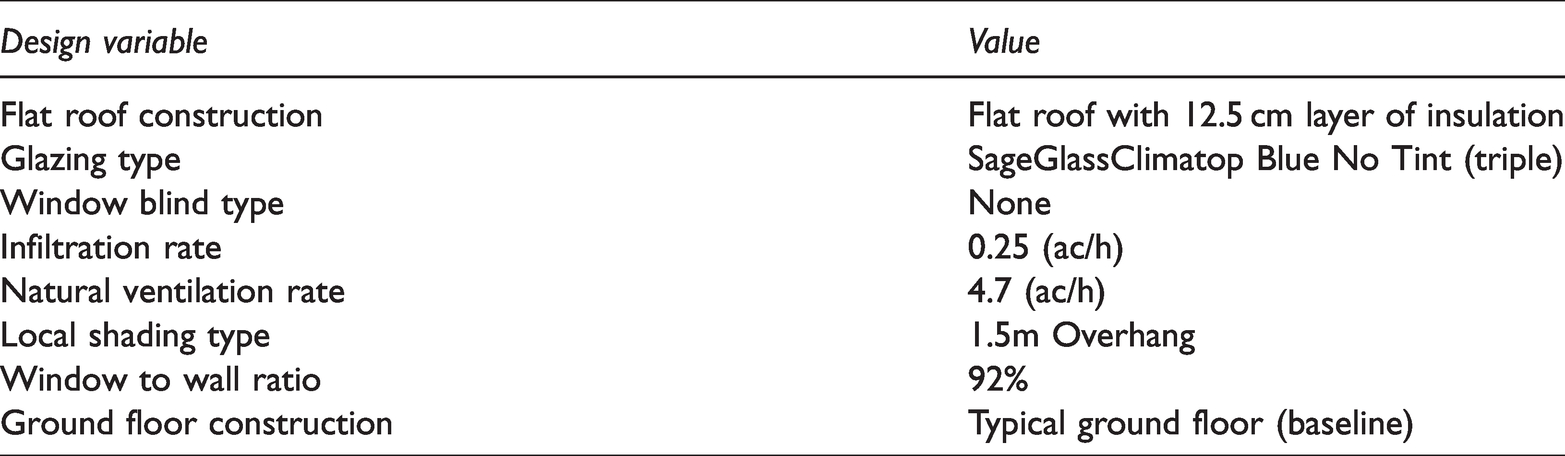
The solution with the lowest summation of heating and cooling was chosen where the summation of energy consumption was 371.69 KWh/year divided into 130.35 KWh/year for the cooling load and 241.33 KWh/year for the heating load. The design variables for this solution are presented in Table 12.
Optimum solution for high importance variables.
In comparing the three chosen solutions for the three optimisations, it is clear that the optimal solution for minimising both heating and cooling load is closer to minimising heating load alone. This is because it is the dominant load.
Low importance variables
Figure 6 presents the cloud of the random simulations for the low importance group of variables and the Pareto Front (the most optimal solutions).
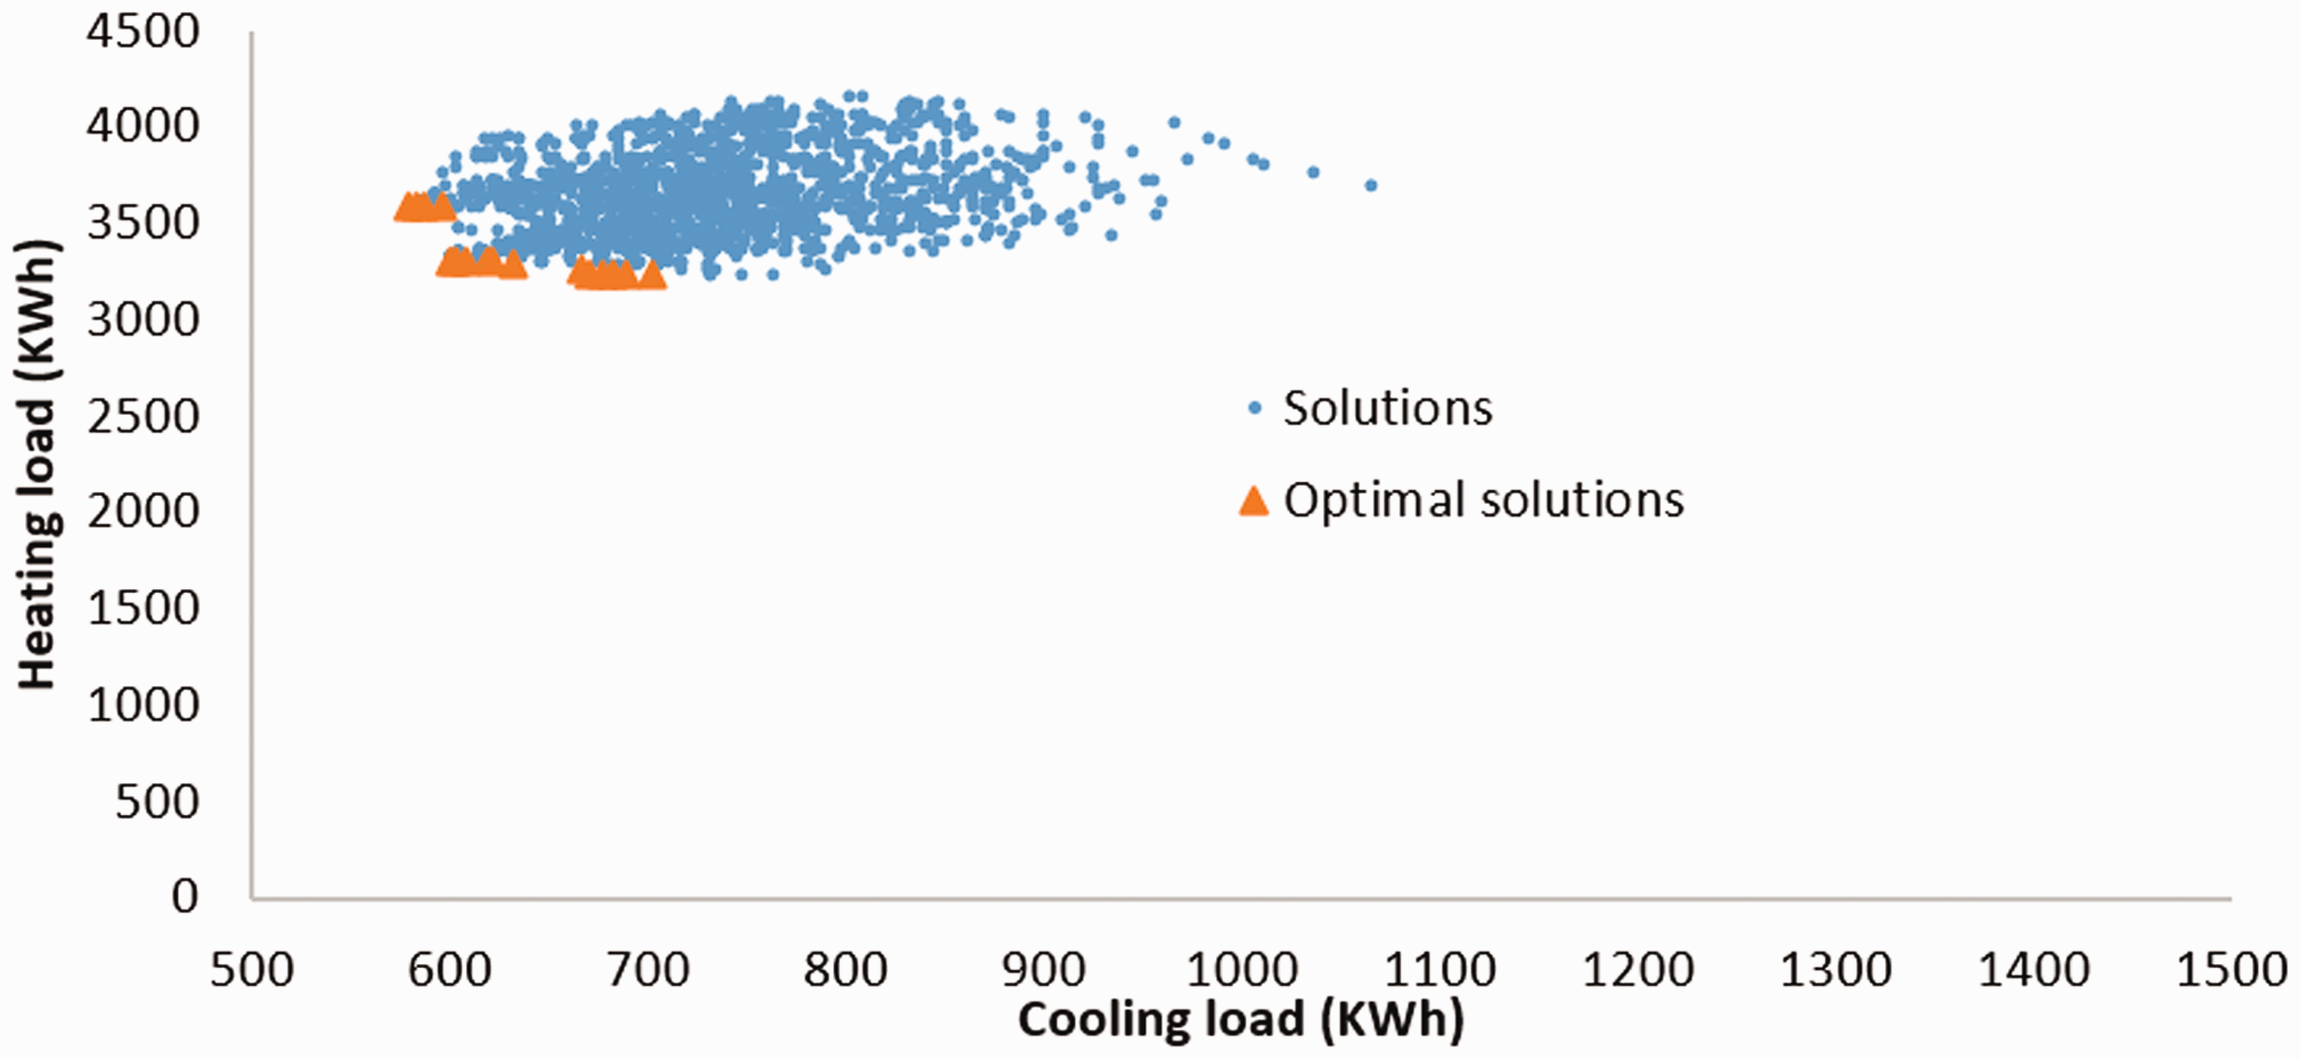
Optimisation of low importance variables.
Among the 2000 solutions, the Pareto Front (optimal solutions) indicates that only 16 optimum solutions were defined in which the cooling load ranged from 579.72 to 701.75 KWh/year and the heating load ranged between 3232.27 and 3595.52 KWh/year.
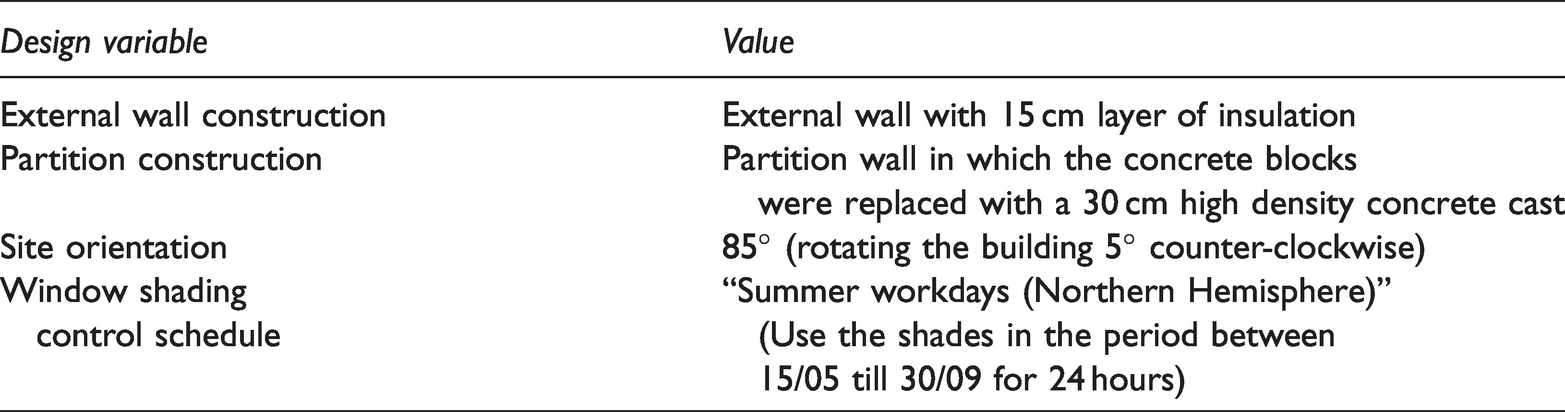
The small range for these loads was predicted as the modified design variables were shown to have low importance by the sensitivity analysis. Thus, only the solution with the lowest summation of heating and cooling was chosen where the summation of energy consumption was 3908.56 KWh/year divided into 602.74 KWh/year for the cooling load and 3305.56 KWh/year for the heating load. The design variables for this solution are presented in Table 13.
Optimum solution for low importance variables.
Optimal solution
After choosing the optimum solution for both high and low importance variables, the design variables for the two solutions were combined and a simulation for the heating and cooling load of the building constructed. The overall energy consumption was further reduced to 274.67 KWh/year divided into 148.23 KWh/year for the cooling load and 126.44 KWh/year for the heating load. However, reducing energy consumption by implementing the modifications suggested by the optimisation of the low importance design variables does not appear to be cost effective, especially the external wall construction and partition construction.
Conclusion
This research is to perform a sensitivity analysis for 12 design variables and optimisation of the parameters of building envelopes in the Sub-Humid Mediterranean climate zone in Jordan. The aim was to reduce the consumption of heating and cooling loads while maintaining the same thermal comfort already achieved using the heating and cooling systems. A simulation of the thermal performance of a baseline building was conducted and this showed that the baseline building will consume 4513.68 KWh/year of energy divided into 3736.76 KWh/year for the heating load and 776.92 KWh/year for the cooling load. A sensitivity analysis of the selected design variables was then conducted using the regression method. Based on this, the design variables were divided into a high importance and low importance group.
Both groups of variables then underwent an optimisation process using a Genetic Algorithm (GA). Three solutions were compared while optimising the high importance design variables: minimising heating load individually, minimising cooling load individually, and minimising heating and cooling loads simultaneously based on the lowest summation of the two loads. The results indicated that the solution optimising heating and cooling load simultaneously achieved a higher reduction of energy consumption and was cost effective as energy consumption was reduced by 91.76%, 83.22%, and 93.45% for total energy consumption, cooling load, and heating load, respectively. The total energy consumption obtained by the optimisation was 371.69 KWh/year divided into 130.35 KWh/year for the cooling load and 241.33 KWh/year for the heating load. However, implementing the modifications suggested by the optimisation of the low importance variables was not cost effective, especially with respect to modifying external wall construction and partition construction. These design variables can therefore be neglected in future studies.
Supplemental Material
sj-pdf-1-eea-10.1177_01445987211020432 - Supplemental material for Sensitivity analysis optimisation of building envelope parameters in a sub-humid Mediterranean climate zone
Supplemental material, sj-pdf-1-eea-10.1177_01445987211020432 for Sensitivity analysis optimisation of building envelope parameters in a sub-humid Mediterranean climate zone by Aiman Albatayneh in Energy Exploration & Exploitation
Footnotes
Declaration of conflicting interests
The author(s) declared no potential conflicts of interest with respect to the research, authorship, and/or publication of this article.
Funding
The author(s) received no financial support for the research, authorship, and/or publication of this article.
References
Supplementary Material
Please find the following supplemental material available below.
For Open Access articles published under a Creative Commons License, all supplemental material carries the same license as the article it is associated with.
For non-Open Access articles published, all supplemental material carries a non-exclusive license, and permission requests for re-use of supplemental material or any part of supplemental material shall be sent directly to the copyright owner as specified in the copyright notice associated with the article.