
Abstract
The law of ground pressure behavior can accurately guide the material proportion and performance of the roadside backfill body (RBB) in gob-side entry retaining (GER), thereby reducing the waste of materials and the cost of retaining roadway. In this study, a similar material modeling is used to verify the spatiotemporal law of the ground pressure in the engineering case of solid dense backfilling mining in Xingtai Mine, China. Based on that law, the theoretical requirements for the bearing performance of the RBB are proposed. Finally, a material mix proportion that meets the theoretical requirements is obtained by compression test, and the deformation and failure characteristics of the backfill body with that mix proportion are analyzed. The results show that the maximum pressure of the backfill body measured in Xingtai Mine is 5.5 MPa, which is about 40 m away from the coal face; after 40 m, the force on the backfill body will not increase anymore. The physical simulation experiment also proved that the ground pressure behind the coal face increases gradually and tends to be during the backfilling process, which shows certain spatiotemporal characteristics. Through the proportioning experiment, it is determined that the optimal material mix proportion of the RBB is gangue:fly ash:cement = 10:3:1, which meets the theoretical requirement that the strength of the RBB at any position is not less than the ground pressure at that position. The research results provide theoretical support for the field practice of GER in solid dense backfilling mining.
Keywords
Introduction
The solid dense backfilling mining technology has been widely used, which can effectively control the movement of the overlying strata in the goaf, reduce the degrees of the ground pressure behavior in the stope, and can provide good conditions for gob-side entry retaining (GER) (Huang et al., 2017; Yang et al., 2021; Zhao et al., 2023). Retaining roadways along the edge of the backfilling area is an innovative combination of GER technology based on the application of solid waste backfill materials in goaf, which has the dual advantages of backfilling mining and GER. It can not only deal with a large amount of solid waste, protect the surface environment, but also reduce roadway excavation. Therefore, this method has significant technical advantages and economic benefits (Yang et al., 2019; Zhang et al., 2012; Li et al., 2019).
In the research field of GER in solid backfilling mining, many scholars have conducted in-depth research on it mainly from two aspects, namely, the surrounding rock control of GER in backfilling mining and the material properties of roadside backfill in GER. For the research on surrounding rock control of GER in backfilling mining, Zhang et al. (2013) analyzed the deformation characteristics of surrounding rock of GER in dense backfilling mining and the action mechanism of roadside backfill body (RBB), established the relationship between lateral pressure and reasonable width of RBB; Ju et al. (2015) proposed a collaborative control system for overlying strata under the condition of backfilling goaf and retaining roadway, and determined the influence parameters of surrounding rock stability; Xie et al. (2014) proposed the comprehensive control technology of backfill material performance optimization, rockbolt-cable and hydraulic support combined support under the conditions of deep and large height backfilling mining, and explained its mechanism; Ma et al. (2011) established a mechanical model for the key stratum of GER in backfilling mining, and solved the problem of lateral pressure of the gangue backfilling area on the supporting wall beside the roadway. In addition to the surrounding rock control of GER in backfilling mining (Huang et al., 2017; Zhou et al., 2012), many scholars (Cheng et al., 2020; Sun et al., 2019; Zhao et al., 2021a) have also studied the mechanical properties of the RBB. For example, Chang et al. (2018) studied the stress state and mechanical response of the RBB, and used high-water materials as the RBB for field application; Gong et al. (2017, 2018) studied the effects of the water–cement ratio, aggregate content, and age on the contractibility and resistance increasing speed, compressive strength, and post-peak carrying capacity of the concrete with gangues as an aggregate, also discussed the rationality and adaptability of gangue concrete as a roadside support material for GER; Li et al. (2017b) analyzed the strain hardening behavior of crushed gangue backfill materials through compaction test, and proposed a method of simulating CGBMs (crushed gangue backfill materials) using double yield model.
In addition, many literature have carried out research on the mix proportion of different types of backfill materials, such as tailings (Fall et al., 2008), gangue (Feng et al., 2016), waste rock (Fu et al., 2018), multi-source solid waste (Zhao et al., 2022), etc., and various methods have been used, such as response surface method (Wei et al., 2022), BP neural network method (Feng et al., 2021), orthogonal test method (Zhang et al., 2022), multi-objective comprehensive decision-making method (Zhao et al., 2022), etc. However, the above-mentioned researches on the mix proportion of backfill materials are seldom carried out targeted research based on the law of ground pressure behavior, resulting in the lack of precise matching between the obtained mix proportion of backfill material and the temporospatial laws of ground pressure behavior, especially for the mix proportion of roadside backfill materials in the GER. When GER is conducted in the backfilling mining engineering, the RBB is often damaged due to its strength that cannot support the roof pressure, resulting in high safety risks. If the support strength of the RBB is increased blindly, the cost of the roadside backfilling will rise sharply, the benefit of retaining the roadway will decrease, and the application of GER in backfilling mining will be restricted. The bearing capacity of RBB often does not match with the ground pressure behavior of GER, there is no good solution in the current open literature. Therefore, it is necessary to conduct a study on optimizing the mix proportion of the roadside backfill materials based on the spatiotemporal law of ground pressure behavior, so as to solve the adaptability problem between the bearing capacity of backfill materials and the ground pressure behavior of GER.
In this study, Xingtai Mine is taken as an engineering practice to monitor the ground pressure behavior, and the similar material simulation method is used to verify the spatiotemporal law of ground pressure behavior in solid dense backfilling mining, thereby establishing the spatiotemporal coupling model of roof and the backfill body, and the theoretical requirement that the bearing performance of the RBB meets the ground pressure behavior is put forward. Finally, through the material compression experiment, the material mix proportion of the RBB that meets the theoretical requirements is obtained. This paper provides a theoretical direction to solve the adaptability problem between the bearing capacity of the RBB and the ground pressure behavior of GER, which has a reference significance for the engineering application of GER in backfilling mining.
Engineering practice
Coal face overview
The engineering practice of backfilling mining in Xingtai Mine is as a case for analysis. Comprehensive mechanized solid backfilling mining technology with gangue and fly ash as the main backfill materials is adopted in the coal face. After the goaf is backfilled with solid waste, the tamping mechanism at the back of each hydraulic support is used to repeatedly compact the backfill materials, so that the goaf can achieve a dense backfilling effect. According to relevant literature (Liu et al., 2010) and on-site survey, the average dip angle of the coal seam where the coal face of Xingtai Mine is located is 9°, the average buried depth is 320 m, and there is a thin layer of gangue in the middle of the coal seam. The average mining height of the coal face is 3.0 m, the inclined length is about 50 m, and the total advancing length is about 133 m. The actual backfill operation takes about 40 days, and the maximum daily advancing distance is 4.8 m.
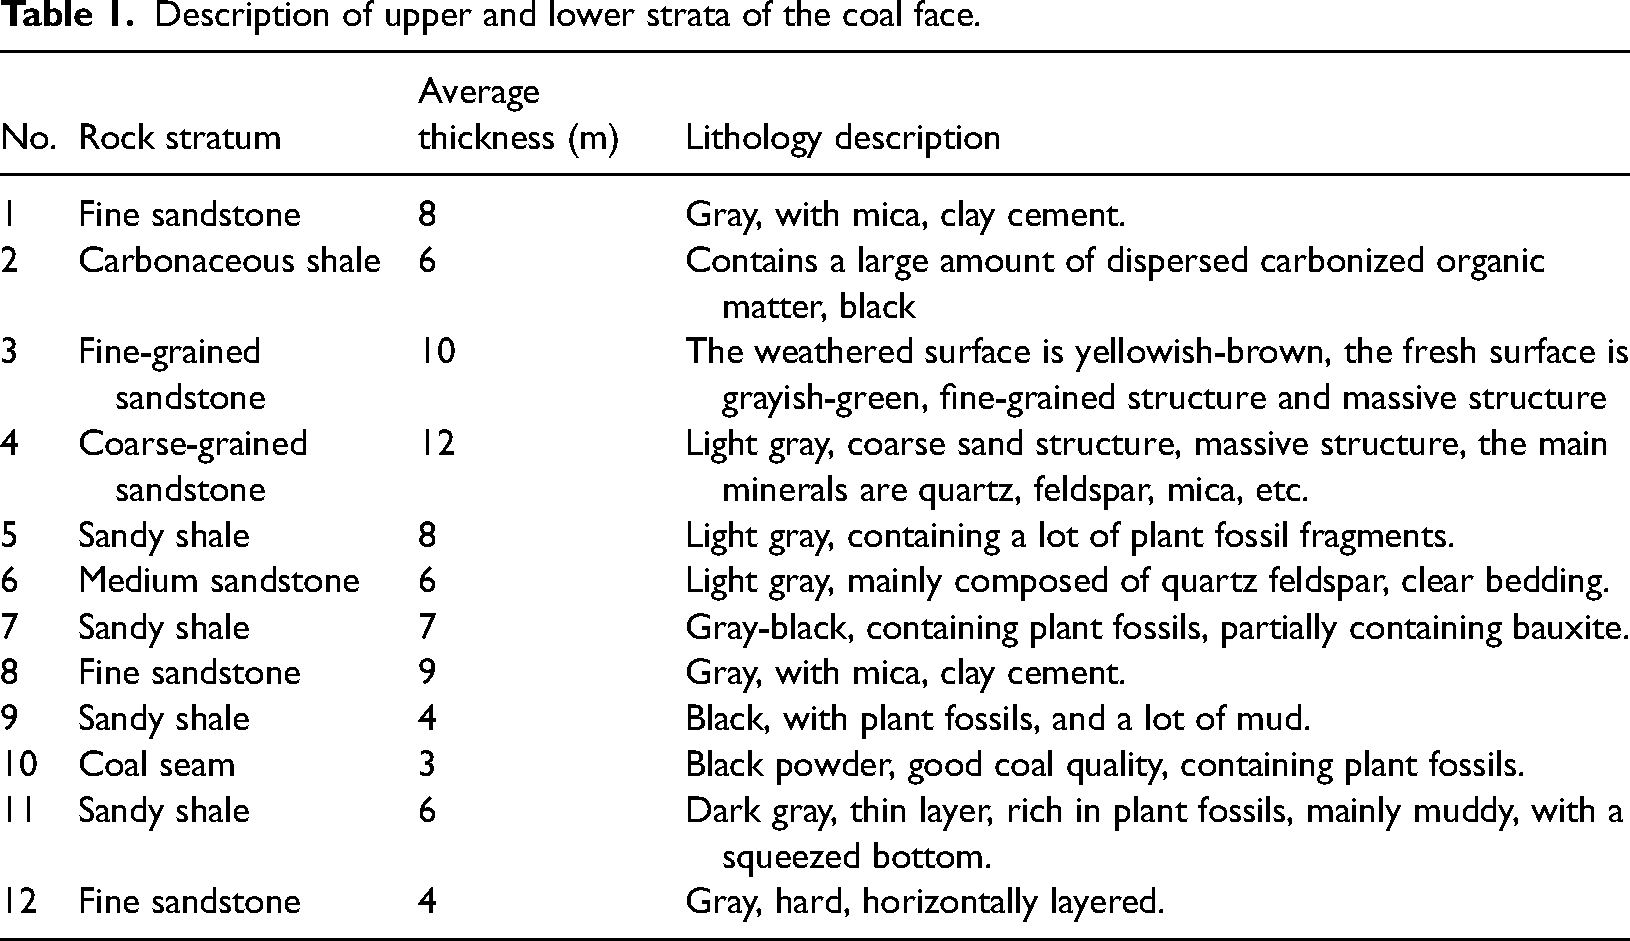
Through the judgment and analysis of the rock samples collected on-site, it is found that the lithology of the roof and floor of the coal seam where the coal face is located is mainly sandstone and shale with different thicknesses. The upper and lower strata lithology of the coal face is shown in Table 1.
Description of upper and lower strata of the coal face.
Monitoring results of ground pressure
The monitoring results of online monitoring machines arranged on the hydraulic supports along the inclination of the coal face show that as the coal face advances, the support pressure of the coal face is overall less than the rated working resistance. The pressure distribution along the inclination of the coal face is different from the compactness of the backfill body, and the roof pressure is small in place with high backfill density. The pressure peak appears at a periodic step of 40–55 m, and the pressure strength coefficient is about 1.15, indicating that the backfill material in goaf effectively weakens the strength of ground pressure behavior at the coal face.
When the coal face advances 15 m, 40 m, and 65 m from the open-off cut, the pressure on the goaf backfill body is monitored by three rows of pressure sensors. The monitoring results show that the pressure monitor has a pressure display in the range of 13–15 m behind the coal face. When the advancing distance of the coal face reaches the span length of the main roof (about 15 m), the overlying strata subsidence faster and the backfill body is rapidly compressed. When the distance from the coal face is 15 m, the pressure monitored on the backfill body is 3.5 MPa, while the pressure reaches the peak value of 5.5 MPa when the distance is 40 m from the coal face, and then the pressure tends to be stable, which indicates that as the advancing distance increases, the force on the backfill body increases first and then stabilizes.
Similar material modeling
To verify the spatiotemporal law of ground pressure behavior in the engineering practice of dense backfilling mining in Xingtai Mine, and provide guidance for the selection and optimization of roadside backfill materials, a similar material simulation experiment was carried out.
Construction process of similar material model
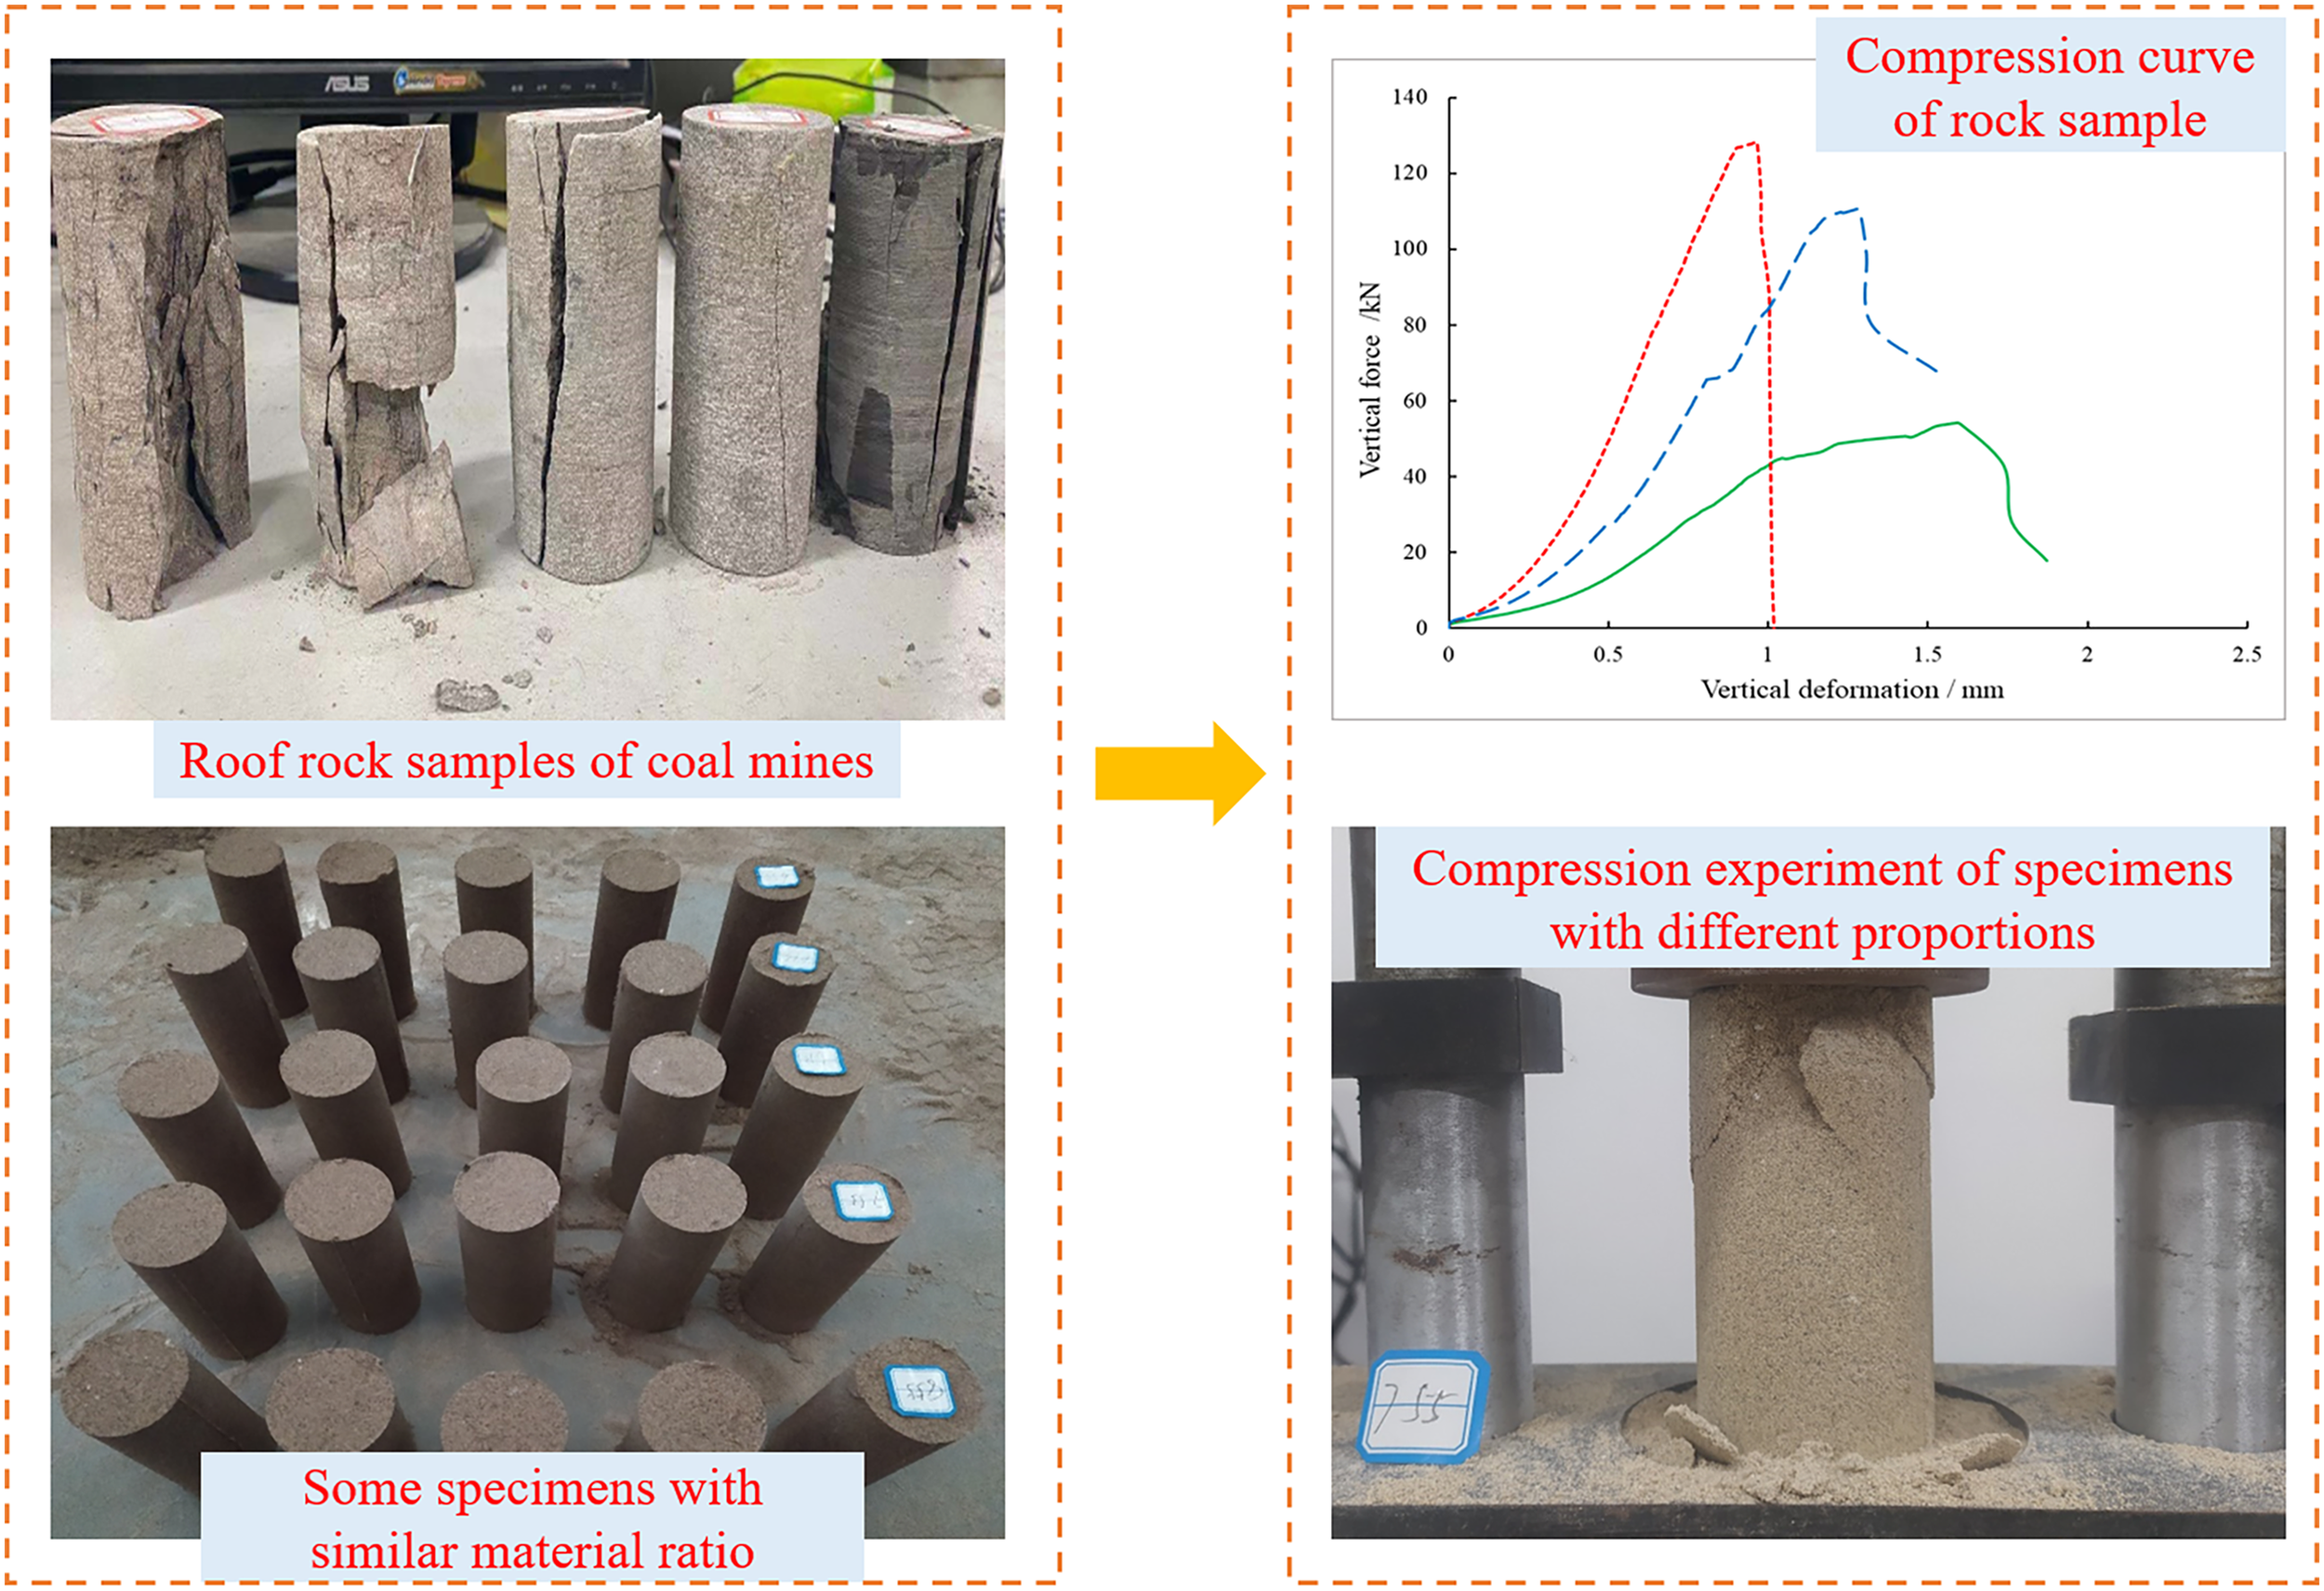
The size of the similar material model in this experiment is 1.5 m × 0.1 m × 0.85 m (length × width × height), the bulk density similarity ratio of similar materials and rocks is 1:1.6 (model:prototype), the parameters such as geometric similarity ratio, stress similarity ratio, and time similarity ratio are calculated by referring to the equations in the literature (Zhao et al., 2021a), respectively. Finally, combined with the laboratory conditions, it is determined that the similarity ratio of the physical model to the field prototype is as follows: the geometric similarity ratio is 1:100, the stress similarity ratio is 1:160 and the time similarity ratio is 1:10. Fine sand, lime and gypsum are used as materials for simulating the rock stratum in the similar material model. Before the model was established, the ratio number of each rock stratum was determined by similar material ratio experiments, that is, the standard cylindrical specimens with diameter of 50 mm and height of 100 mm were made of similar materials with different ratio numbers, and five specimens were made for each group of ratio number. After drying, the uniaxial compression test was carried out on each specimen to test its compressive strength, as shown in Figure 1. The compressive strength of each group of specimens was averaged, and the ratio number with similar material strength closest to the actual rock sample strength was selected as the ratio number of the corresponding rock stratum. For example, the ratio number 873 in this experiment means that the ratio of lime to gypsum is 7:3, and the ratio of cementitious material composed of lime and gypsum to fine sand is 1:8
Similar material ratio experiment.
The thickness of the rock stratum in the model is determined by the actual thickness of the rock stratum and the geometric similarity ratio. The material consumption of each rock stratum in the similar material model is calculated by Equation (1).
The water consumption of each rock stratum is determined according to 10% of the material dosage, and the material dosage of rock stratum in the mode is finally determined, as shown in Table 2.
Material dosage of rock stratum in the model.
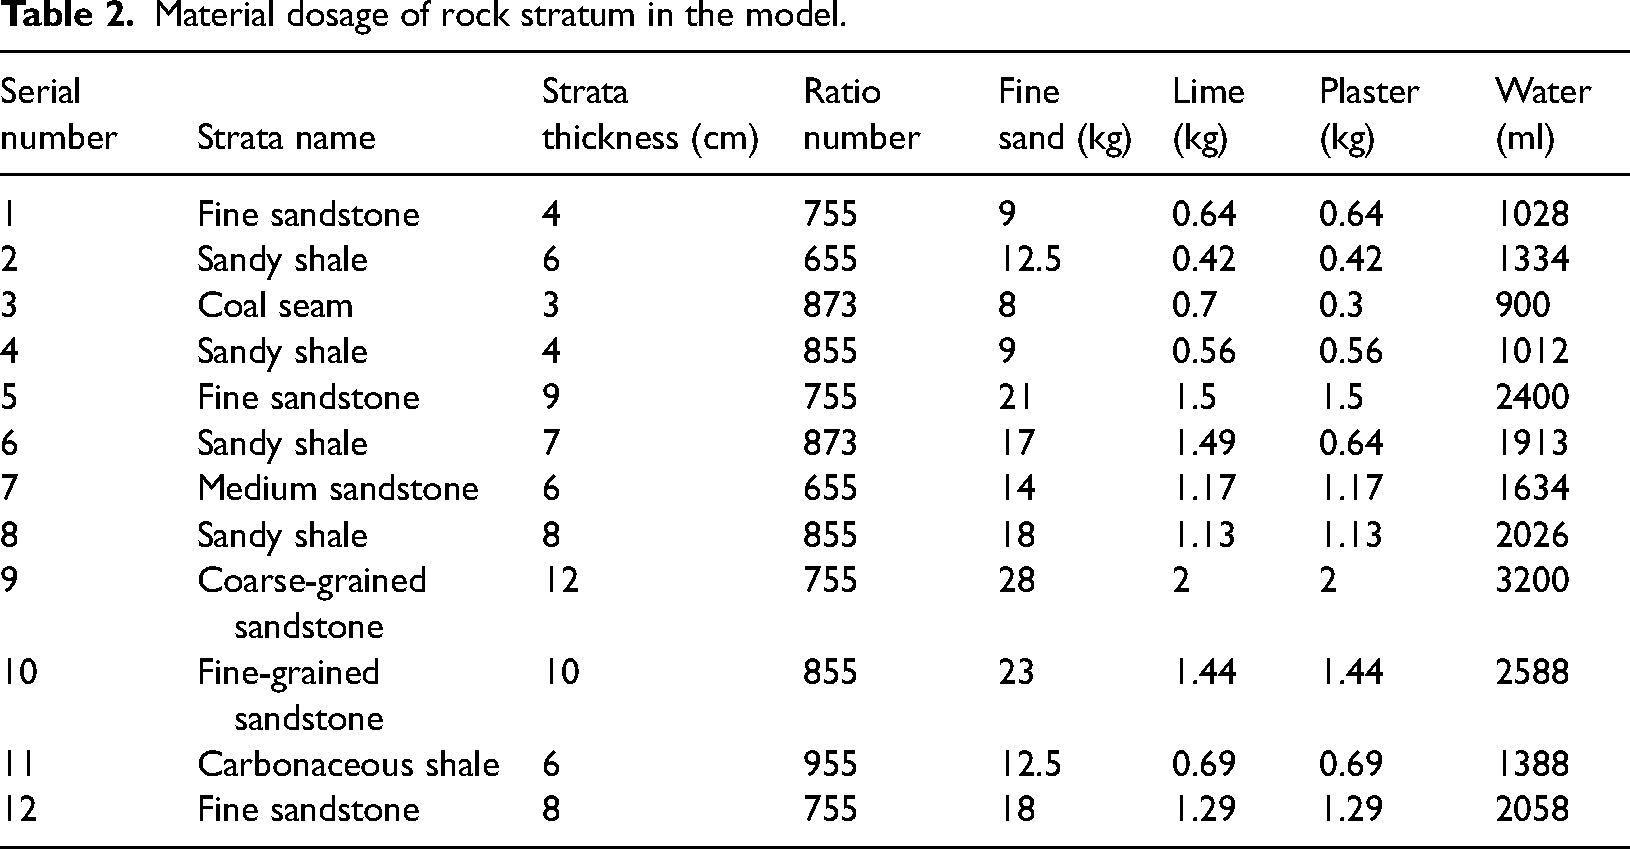
When constructing the model, to reduce the boundary effect caused by the simulation platform on the rock stratum, the oiled paper was used to isolate the simulation platform from the edge of the model. Due to the large thickness of each rock stratum, each rock stratum was divided into small layers with a thickness of 1–3 cm during the construction of the model. After the fine sand, lime and gypsum were weighed, mixed and stirred evenly with water according to the ratio number of each rock stratum, the rock stratum was built successively from the coal seam floor, as shown in Figure 2. During the model construction, micro-earth pressure sensors were arranged in the corresponding rock stratum. Each layer of the rock stratum was gently compacted to make the rock stratum thickness consistent with the design scheme. After the rock stratum was built to a height of 0.85 m, a heavy load (0.04 MPa) was loaded as a compensating load to simulate the load of the unpaved rock stratum from the top of the model to the surface, which was always placed on top of the model during the excavation and backfilling process. The model was left to dry for 7 days after construction, and then the baffles were removed. The 3D photogrammetric coding points were arranged on the model. Excavation, backfilling and monitoring of measuring points were carried out after the model was basically dried and formed.
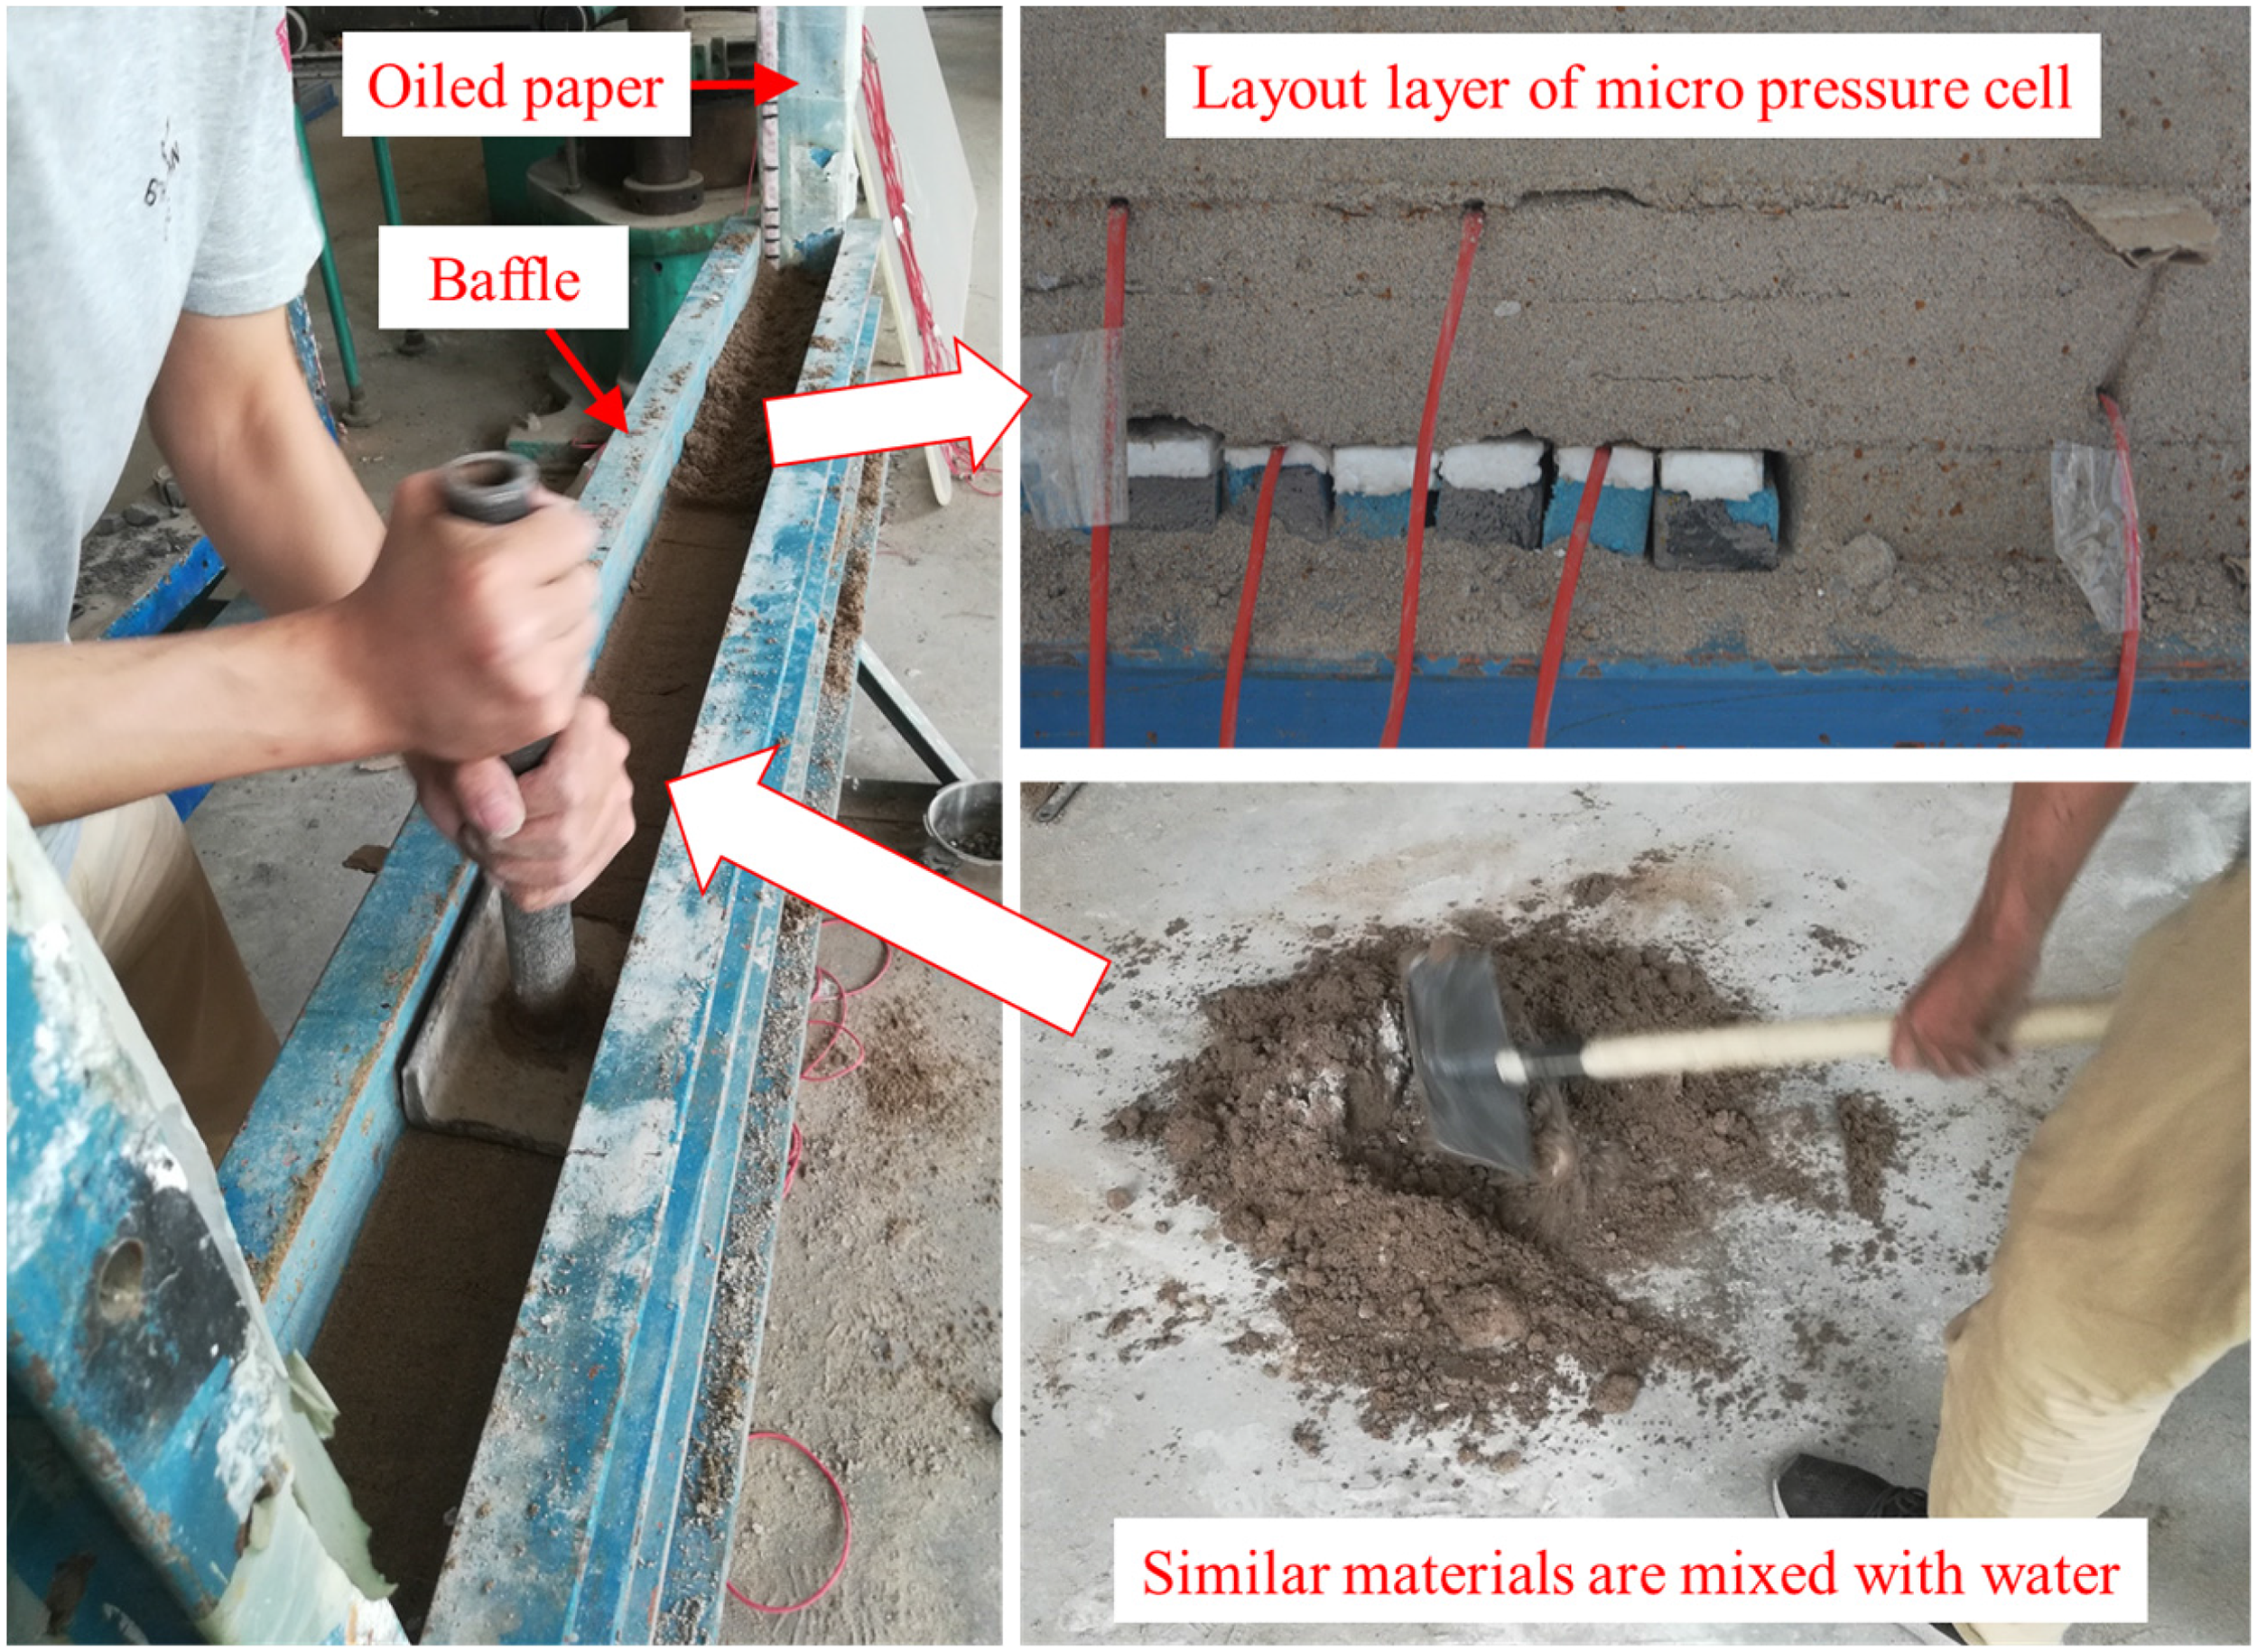
Construction of the similar material model.
Selection of similar materials for backfill body
To make the physical model closer to the engineering site, as can be known from the similarity theory that the compression characteristic curve of the simulated backfill should be close to or the same as that of the underground backfill composed of gangue and fly ash (the mass ratio is 1:0.4). According to laboratory conditions, four combinations of soft and hard foam materials with different thickness ratios were selected for compression experiments to find suitable similar materials for backfill bodies. The material combinations with the volume ratio of soft foam to hard foam of 0:1, 1:0, 1:2, and 1:3 were numbered as No. 1, No. 2, No. 3, and No. 4 materials, respectively. The composition of the four combined materials and their compression curves are shown in Figure 3. It should be noted that the theoretical curve in Figure 3 is the compression curve formed by the actual compressive stress of the backfill material after the reduction by the stress similarity ratio and its actual strain.
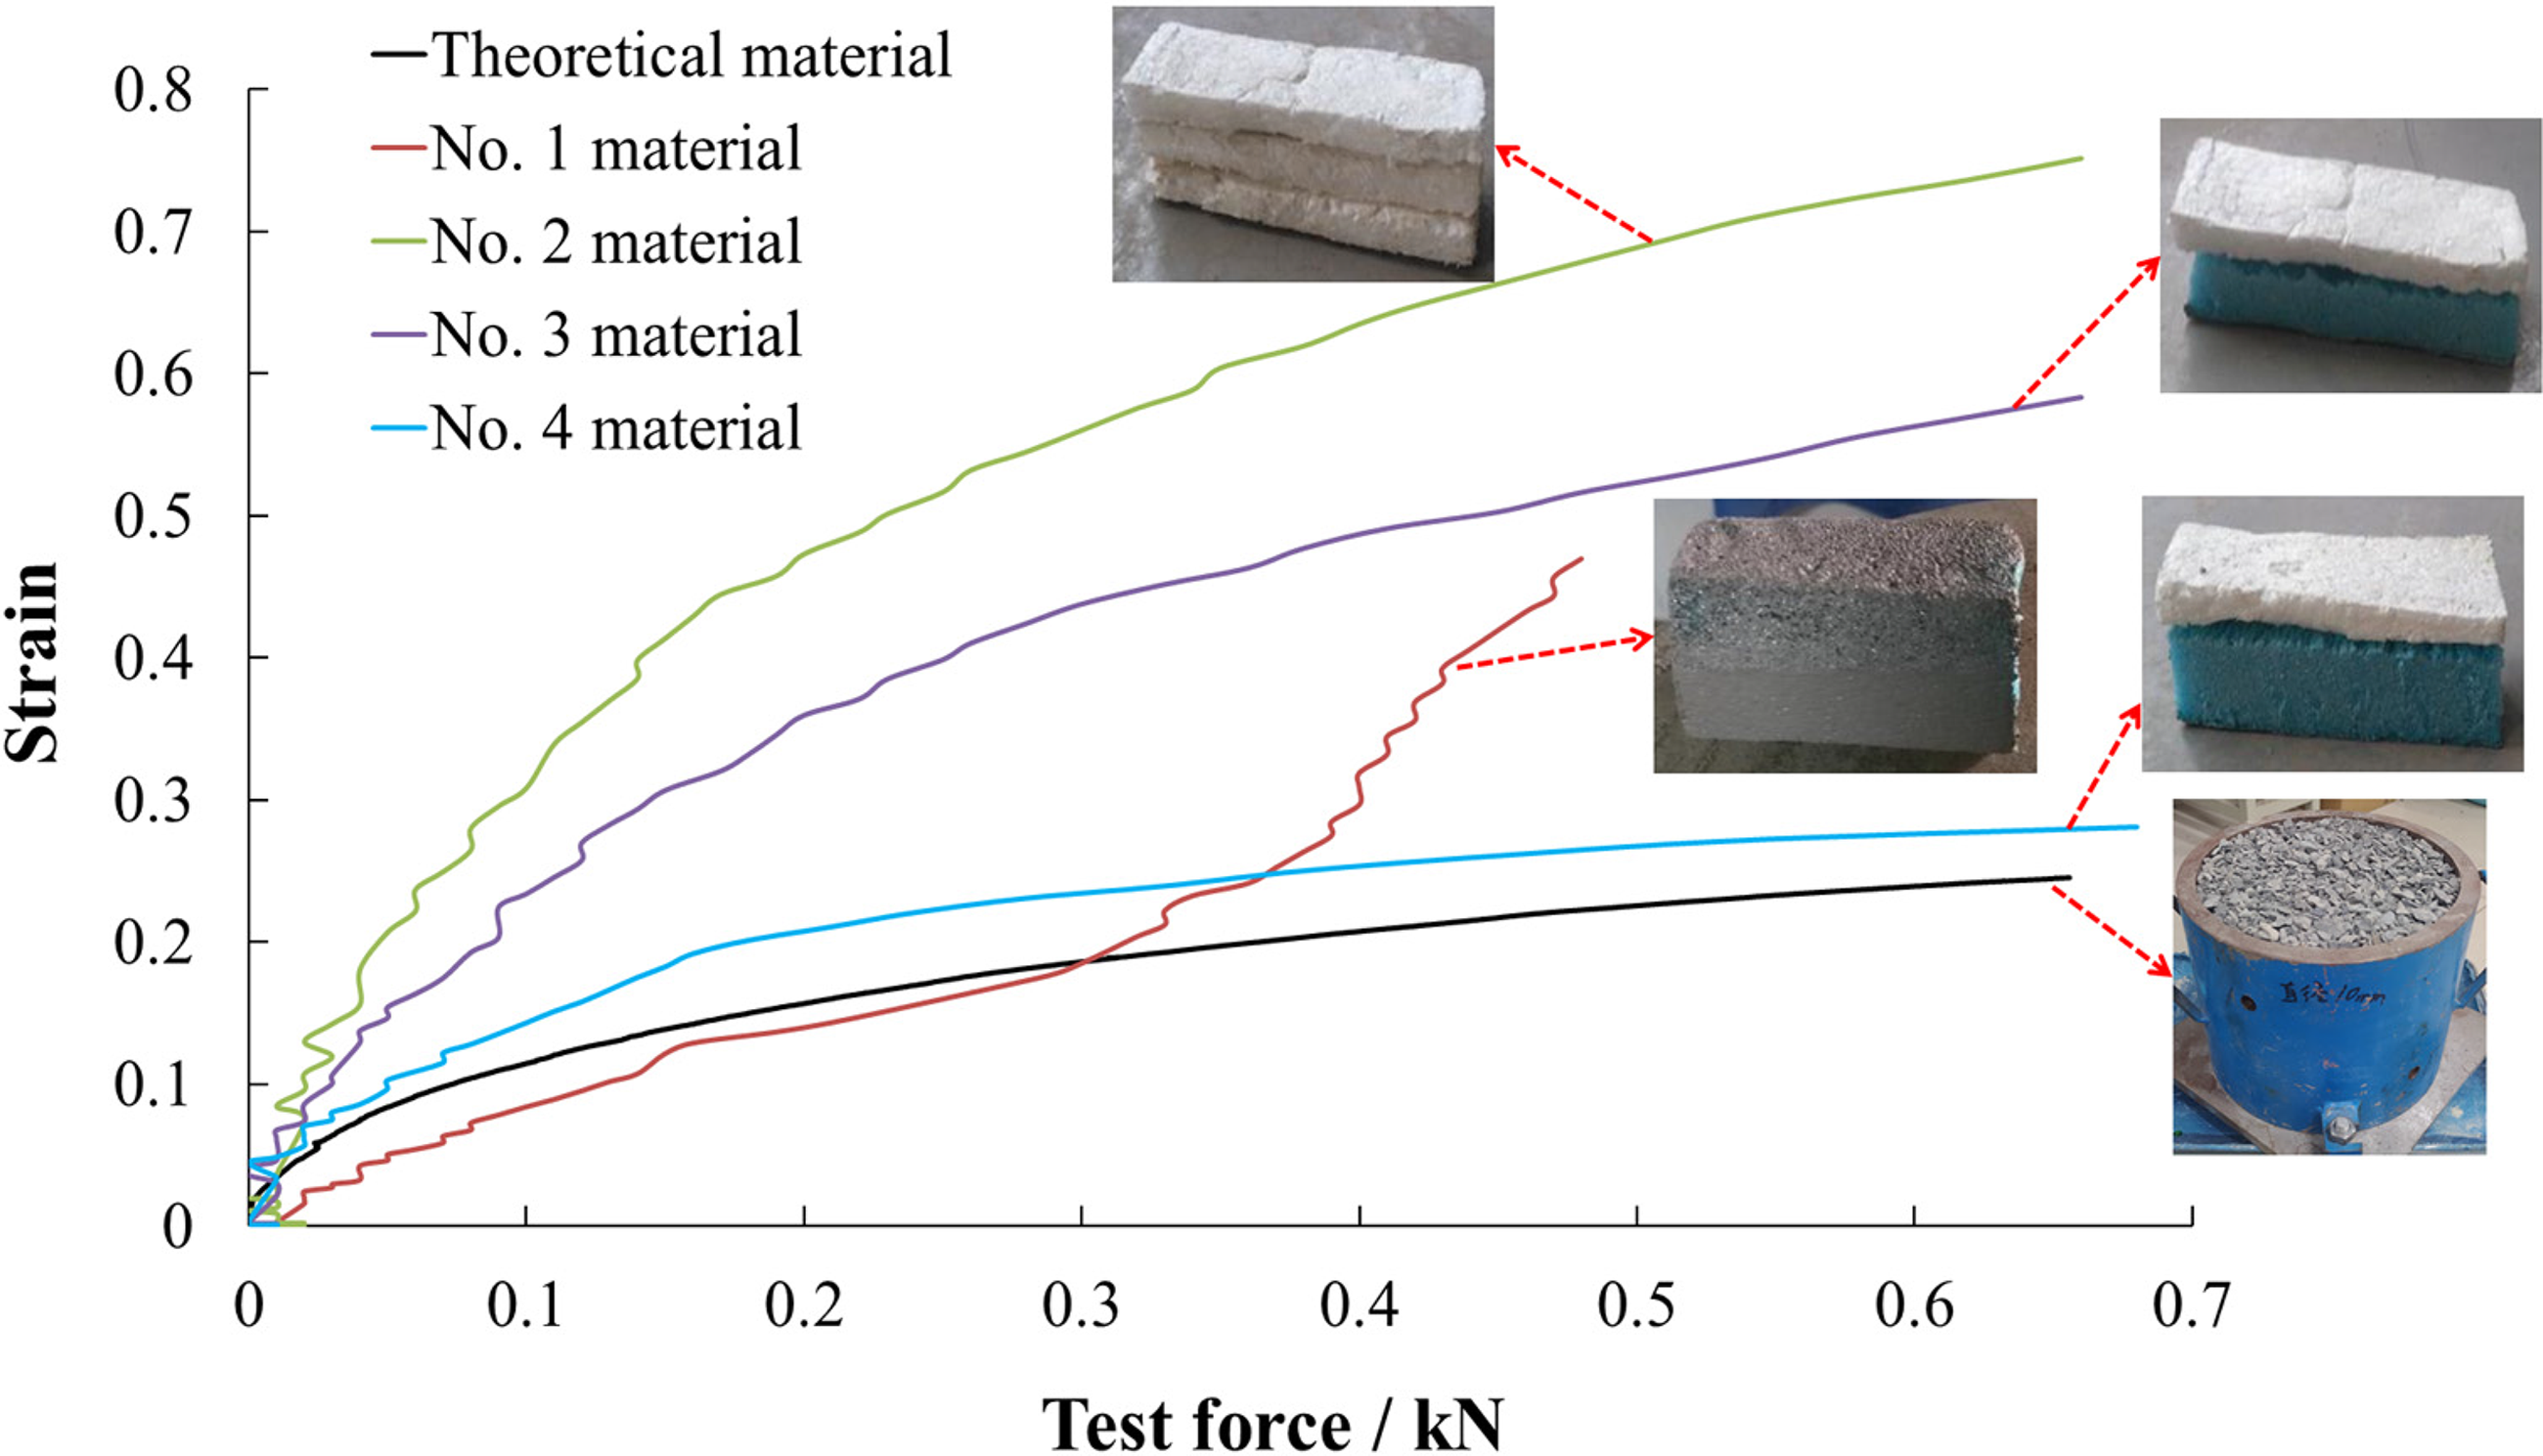
Compression characteristic curve of four material combinations.
By comparing the compression characteristic curves of the four material combinations with that of theoretical materials, it can be found that No. 1, No. 2, and No. 3 material combinations cannot be used as similar simulation materials for the backfill body because of the large strain during the compression process or the large difference between their compression curve trend and that of the theoretical material. The compression characteristic curve of No. 4 material combination is very close to that of the theoretical material in this experiment, so No. 4 material combination is selected as the similar material to simulate the underground backfill, that is, No. 4 material combination is soft foam:hard foam = 1:3.
Simulation and monitoring scheme
When building the model, a micro-earth pressure sensor was arranged at every 10 cm interval in the main roof about 5 cm above the coal seam, and was respectively numbered “R1–R10.” Two micro-earth pressure sensors, numbered “P1” and “P2,” were respectively arranged at the junction of the coal seam and the immediate roof at a distance of 10 cm from the model boundary. According to the field practice and experimental needs, the coal seam was excavated and backfilled after the model was applied with compensation load and remained for 15 minutes. There are coal pillars with a width of 20 cm on both sides of the coal seam in the model, and an area with a length of 110 cm in the middle is for excavation and backfilling. The direction of excavation and backfilling is from left to right. The specific layout of the measuring points is shown in Figure 4.
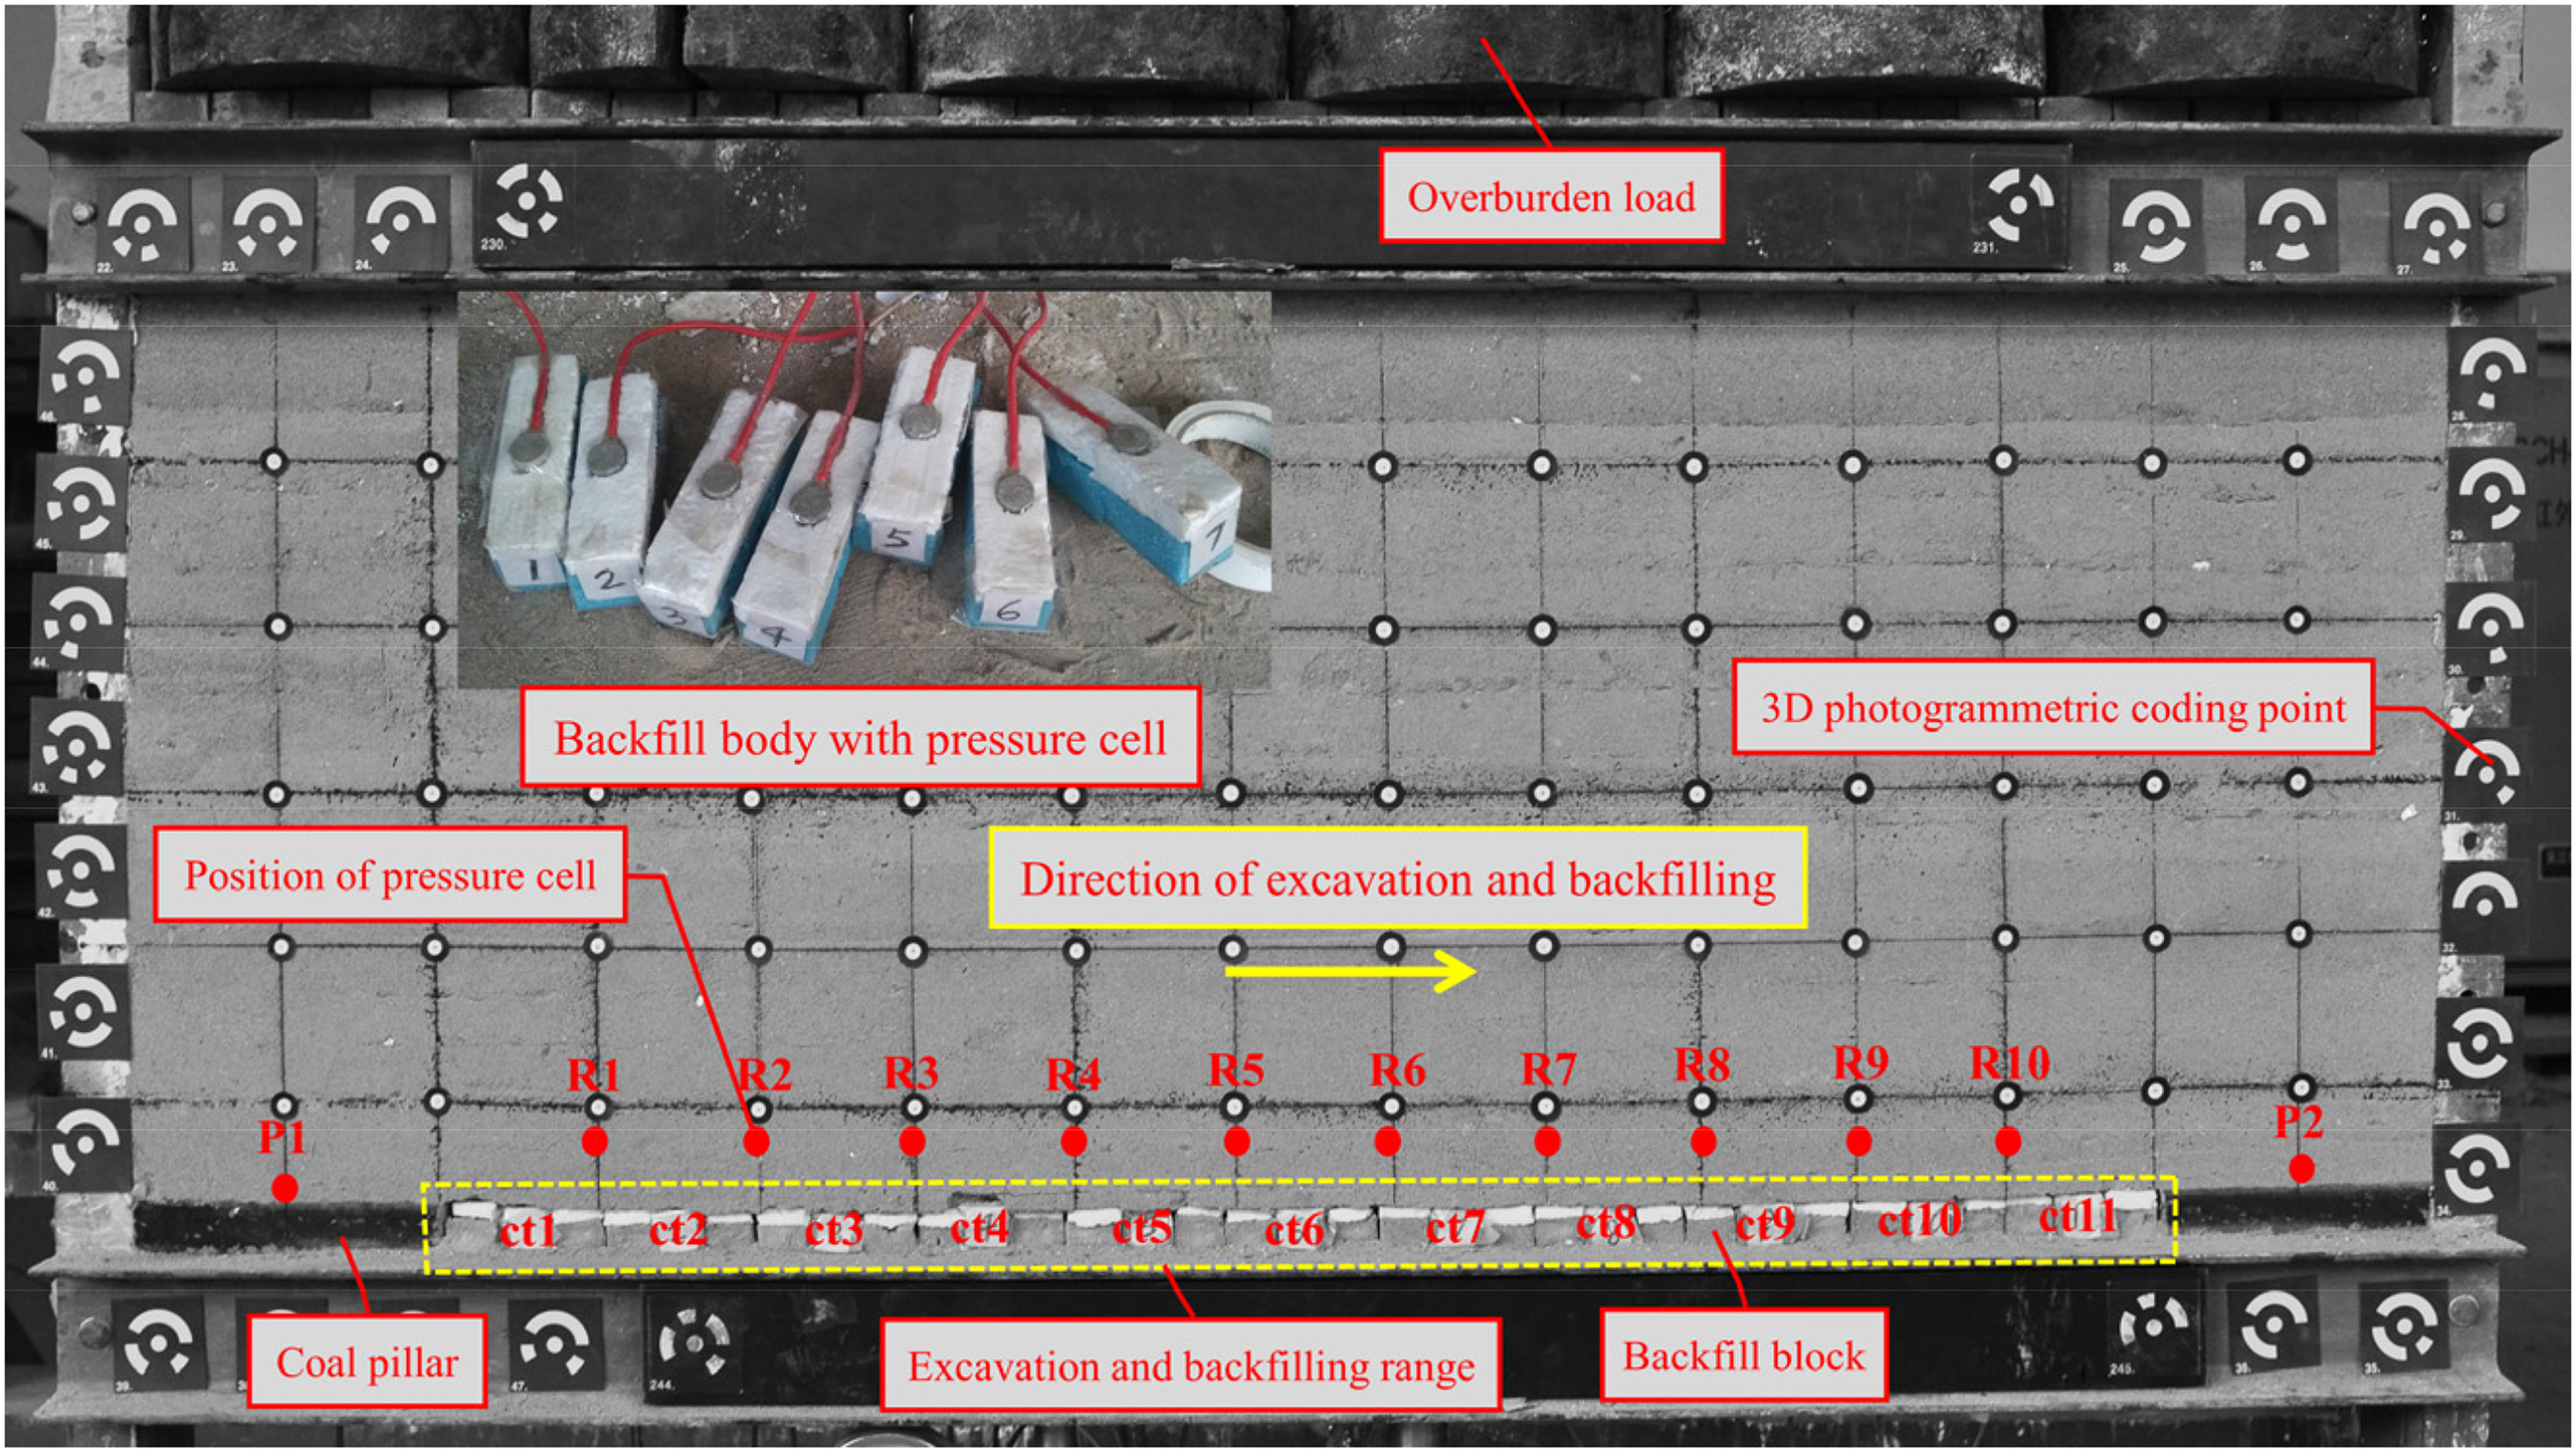
The layout of measuring points in the model.
In the experiment, each backfill block is used to represent the actual daily mining distances on site. According to the average daily mining distance in engineering practice, the average width of the backfill block is set to be 3.3 cm. The excavation and backfilling steps of the similar material model are as follows: start from the left side of the model (20 cm away from the model boundary), use sharp tools to excavate the coal seam in the physical model, the excavation length is about 3.3 cm, and the height is about 3 cm. Then slowly fill the backfilling block into the excavated space to realize the backfilling of the goaf. After that, wait for the model to stand still for about 5–10 minutes and the monitoring data changes stably, excavate a 3.3-cm long coal seam and fill the block again, follow this cycle until the stopping line. For every 10 cm of excavation and backfilling, a pressure cell was arranged in the middle backfill block to measure the force on the backfill body. The number of the backfill body where the micro-earth pressure sensor was arranged is “ct1–ct11,” as shown in Figure 4. The DH3815N static strain test system was used to regularly monitor the stress change, with a time interval of 5 seconds. The XJTUDP-3D photogrammetry system was used to take pictures every time three backfill blocks were backfilled. After the last block was backfilled and left to stand for about 10 minutes, the model was photographed by the XJTUDP-3D photogrammetry system. The model was then left to stand for 12 hours and photographed again to observe the movement of the overlying rock.
Spatiotemporal law of stress on roof and backfill body
Through monitoring and recording the data of each measuring point during coal seam excavation and backfilling, the stress data of each measuring point under the relative time of test record are obtained, which is plotted as shown in Figures 6 and 7.
As can be seen from Figure 5 that in the excavation and backfilling process of the coal seam, the stress of the measuring point in the roof shows the changing law of “stress rise–stress unloading–stress recovery and then stress stability.” Before the coal face passes through each measuring point in the roof, the measuring point is in the area of the coal face's advanced abutment pressure, which causes the stress of the measuring point to increase. As the backfilling distance increase, the peak stress of advanced coal face also shows a slowly increasing trend, and its peak value tends to be stable after passing through the measuring point R8, at this time the backfilling distance is more than 80 cm; When the coal face passes under each roof measuring point, the immediate roof loosens and the stress of each measuring point drops sharply; After the coal face passes the roof measuring point about 3–5 backfill blocks, the roof stress begins to recover slowly, which indicates that the strata above the measuring points in roof are bent, subsided; After excavation and backfilling are completed, the stress of roof measurement points is finally stabilized between 10 and 23 kPa, showing the stress distribution with high in the middle of the backfilling area and low near the coal pillar. The measured stress value of the roof after stabilization is less than the theoretical value of the in-situ rock stress. The reason is that there is one or more key stratum in the overlying strata. The key stratum is not completely broken during the advancement of the coal face, which has taken part of the overlying strata's weight and transferred the overlying stress to both coal pillars. As the increase of the backfilling range, the stress of measuring points on both coal pillars slowly increases. The stress of P1 measurement point begins to stabilize after backfilling 100 cm, and the stabilized stress value is about 68 kPa, which exceeds the theoretical value of the in-situ rock stress.
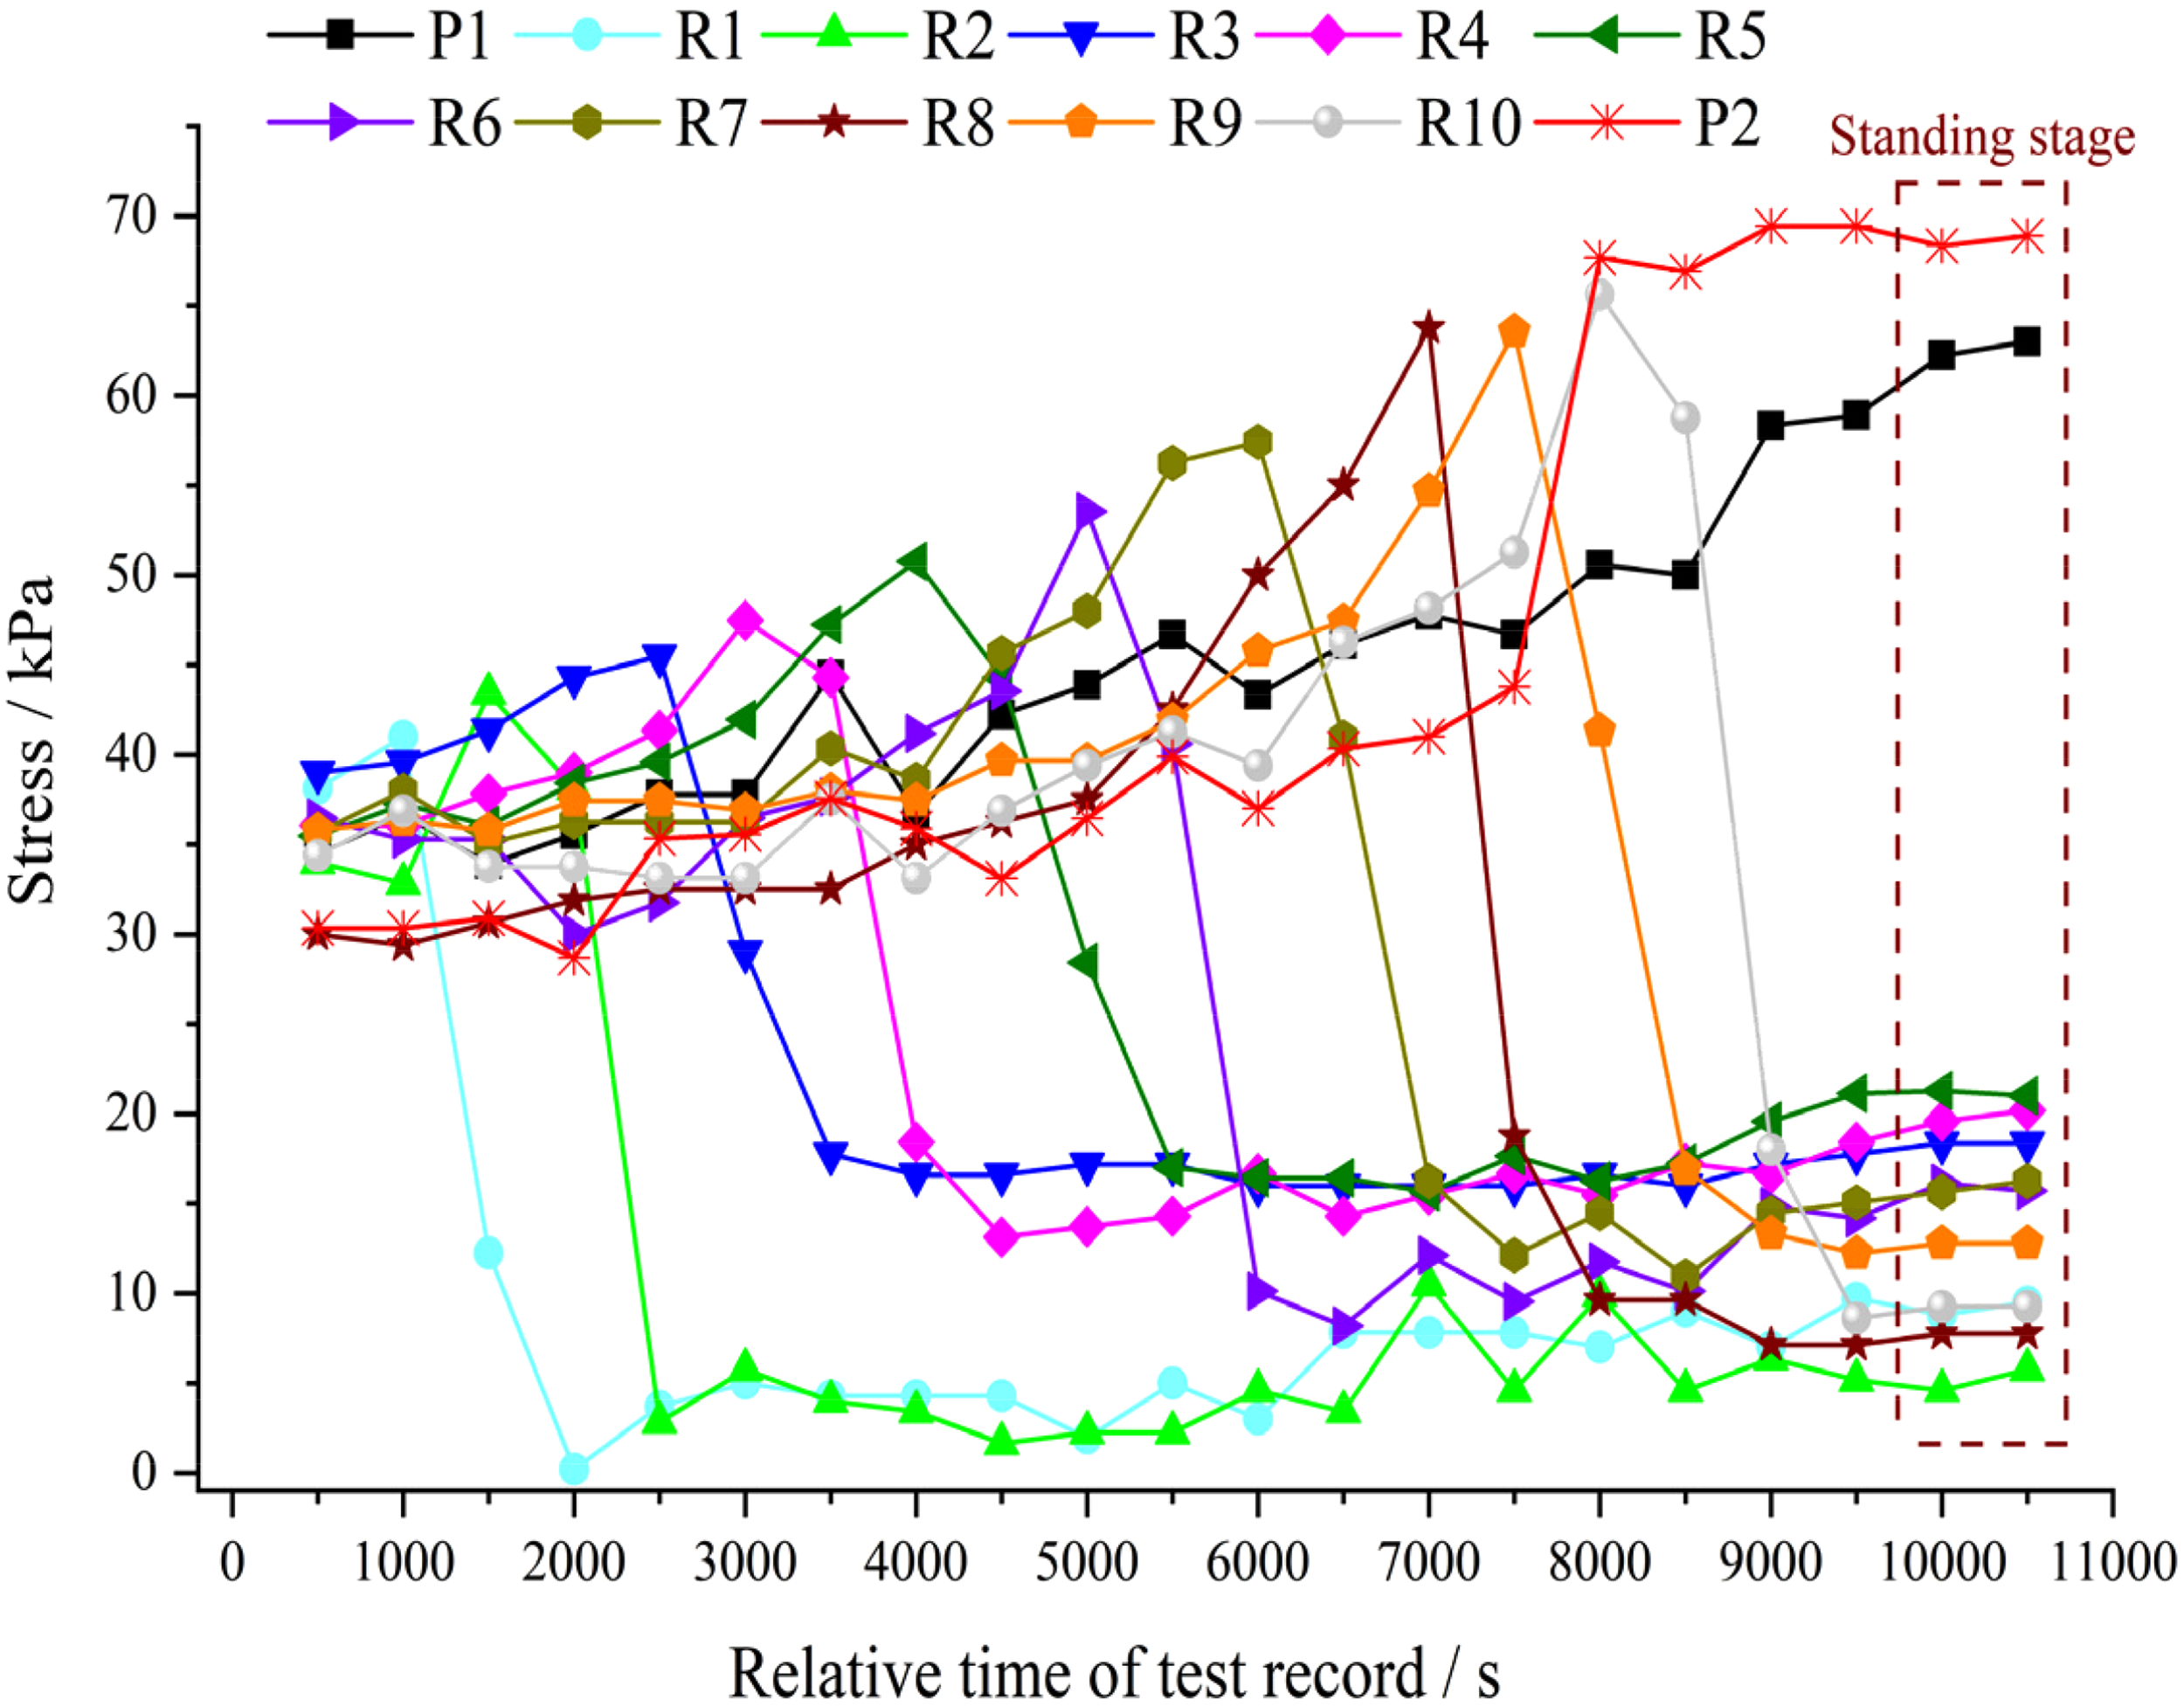
Stress record of measuring points in the roof.
In Figure 6, the stress of each measuring point in the backfill body shows a trend of first increasing and then stabilizing with the increase of backfilling time and distance. During the backfilling process, it is found that 1–2 backfill blocks behind the coal face are basically not stressed, and the stress of backfill blocks at about 3–6 cm behind the coal face begins to increase. As the distance from the coal face increases, the force of the backfill block increases accordingly until it stabilizes. The distance between the initial stress and the stress stability of the backfill block is about the width of 6–8 backfill blocks. After the stress of each measuring point in the backfill body is stable, the value is in the range of 10–25 kPa, that in the middle of the backfilling area increases faster, and its final value is generally larger than that of the measuring point near the coal pillar. The stress distribution on the backfill body is basically consistent with that of the roof measuring point. The stress distribution and growth law in this experiment are basically consistent with the stress monitoring results in engineering practice.
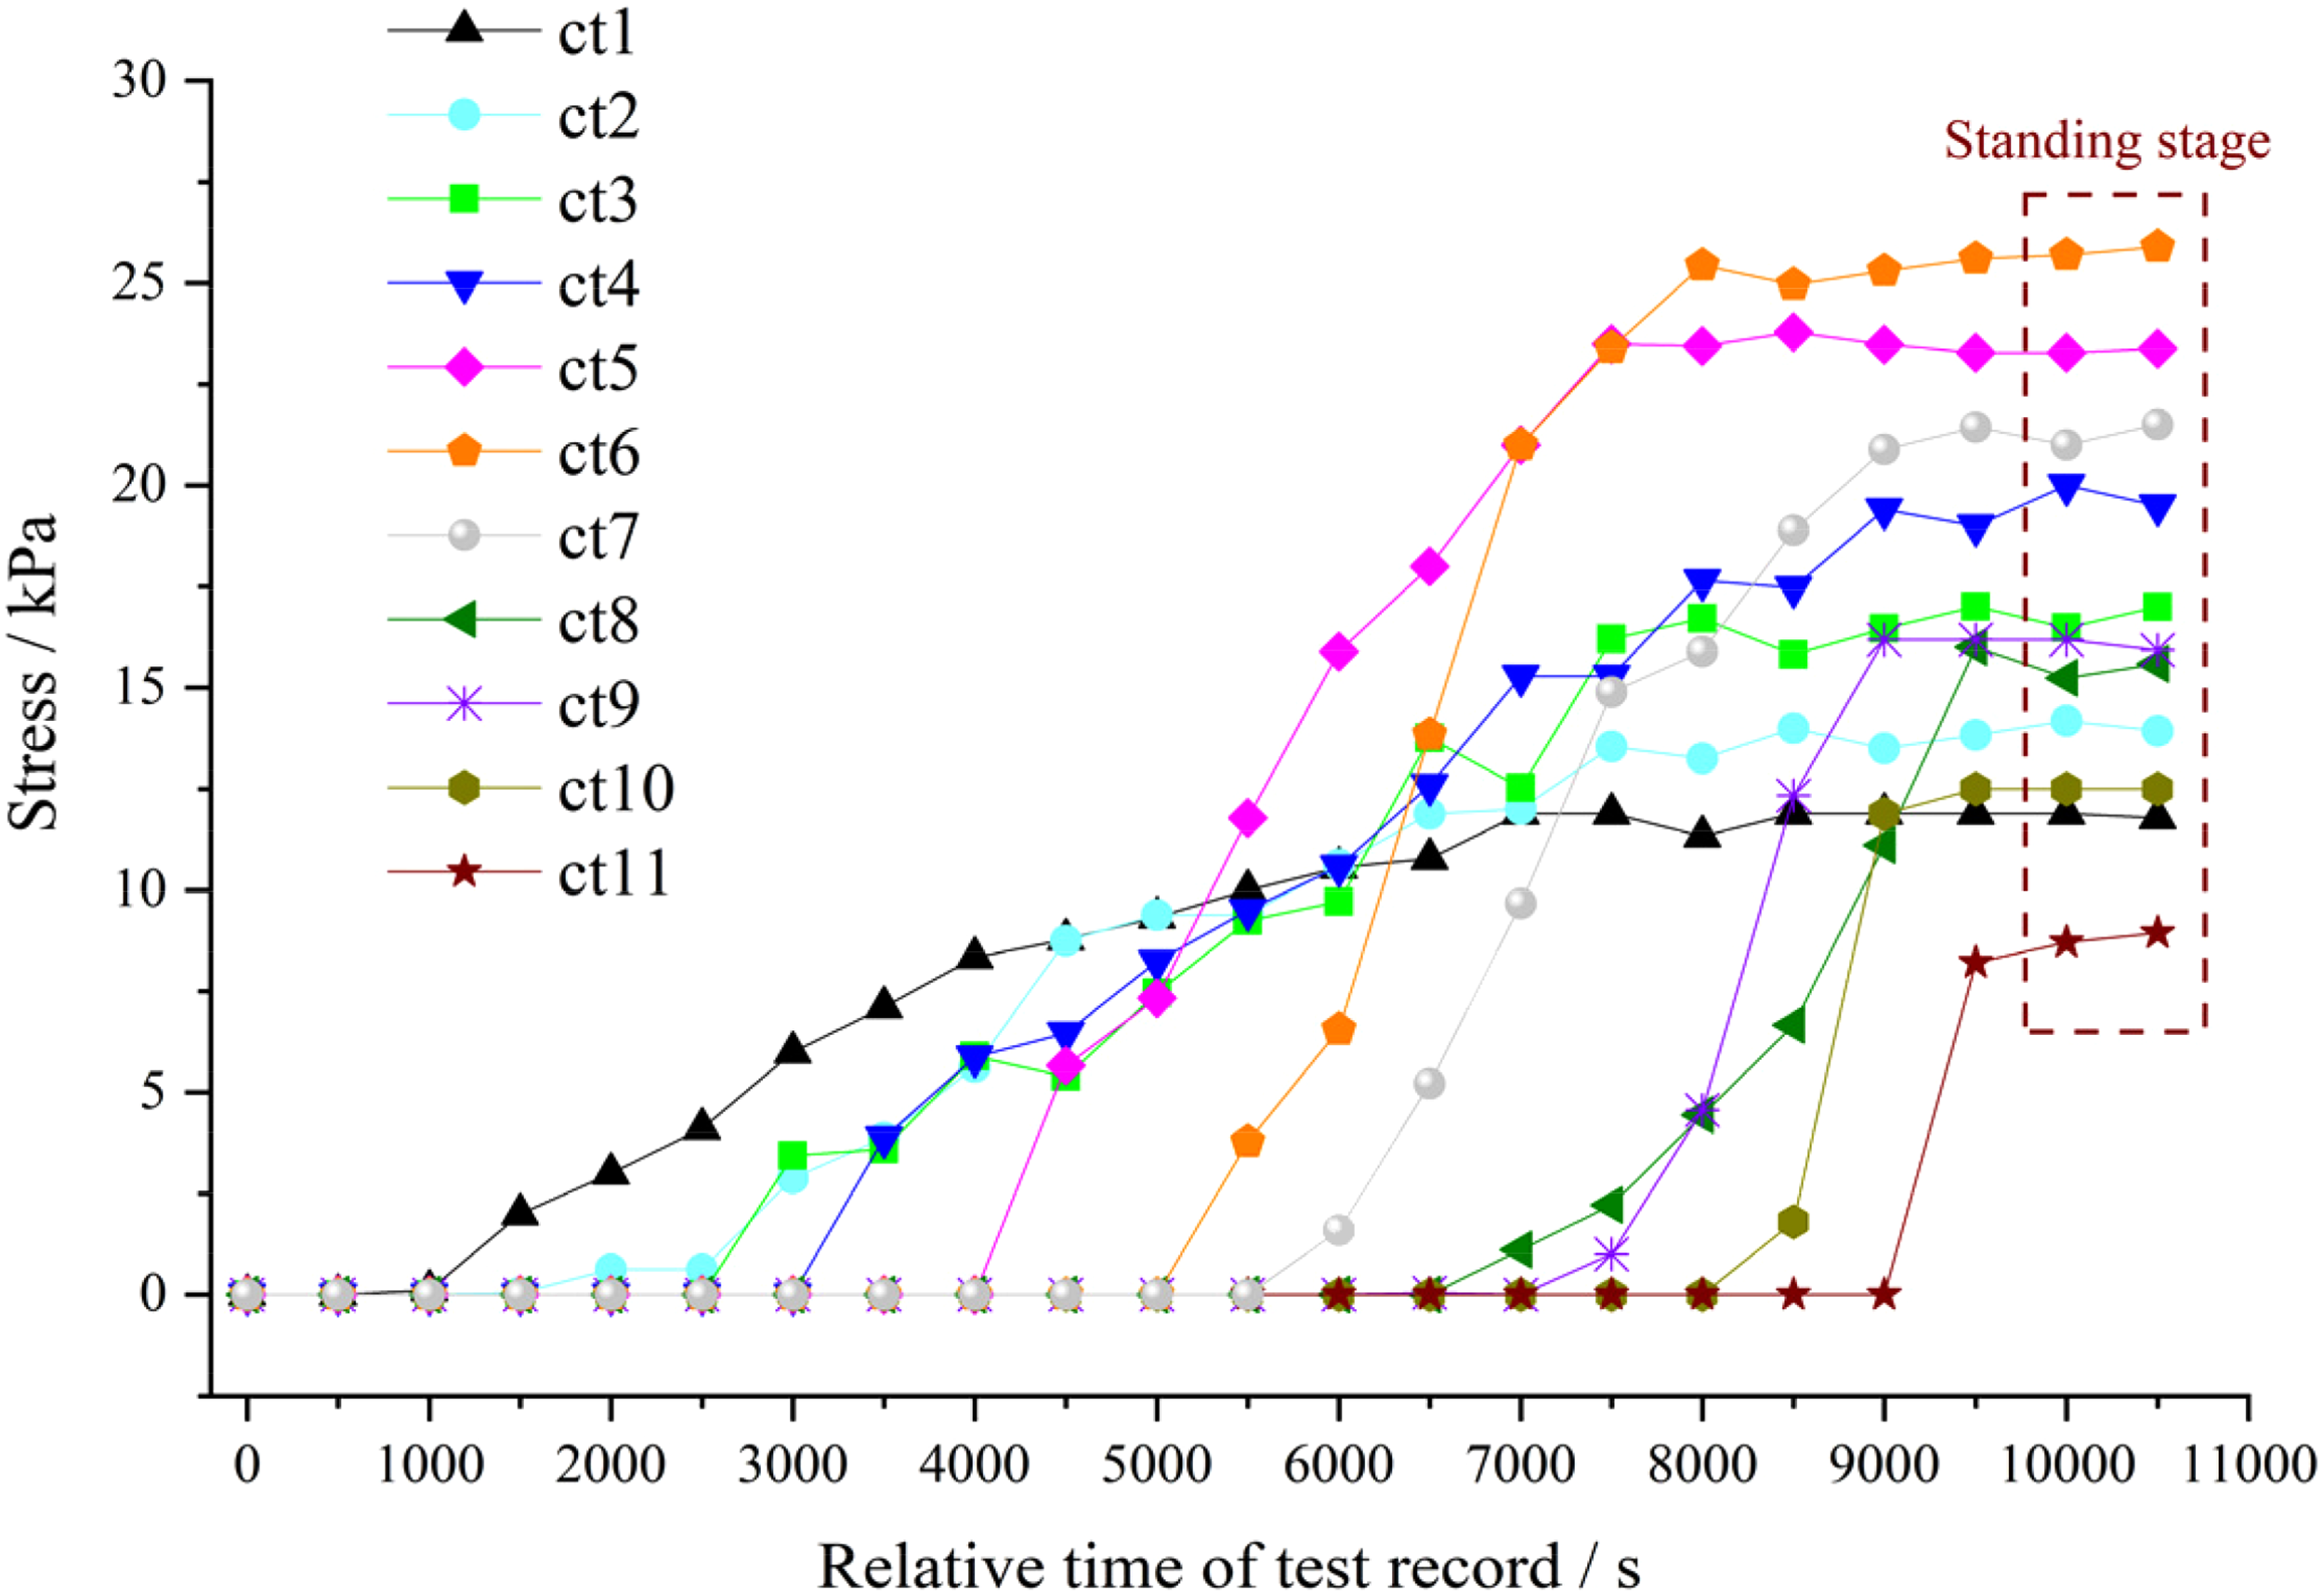
Stress record of measuring points on backfill body.
From the comparative analysis of Figures 5 and 6, it can be found that the stress on the backfill body increase slowly after the stress of the measuring point in the roof decreases rapidly, which indicates that the interaction between the overburden subsidence and the support of the backfill body occurs at this time. The support effect of the backfill body on the roof increases with the increase of the backfilling distance, and the roof stress recover slowly until the two reach the equilibrium state. This phenomenon shows that there is a coupling characteristic between overburden pressure and supporting force of backfill body within a certain distance behind the coal face.
Spatiotemporal law of displacement on roof and backfill body
To reveal the spatiotemporal evolution law of the roof and backfill body in displacement, dynamic deformation diagrams of the model after backfilling 0 cm, 20 cm, 40 cm, 60 cm, 80 cm, 100 cm, 110 cm and standing for 12 hours after stopping mining are selected, as shown in Figure 7a–h.
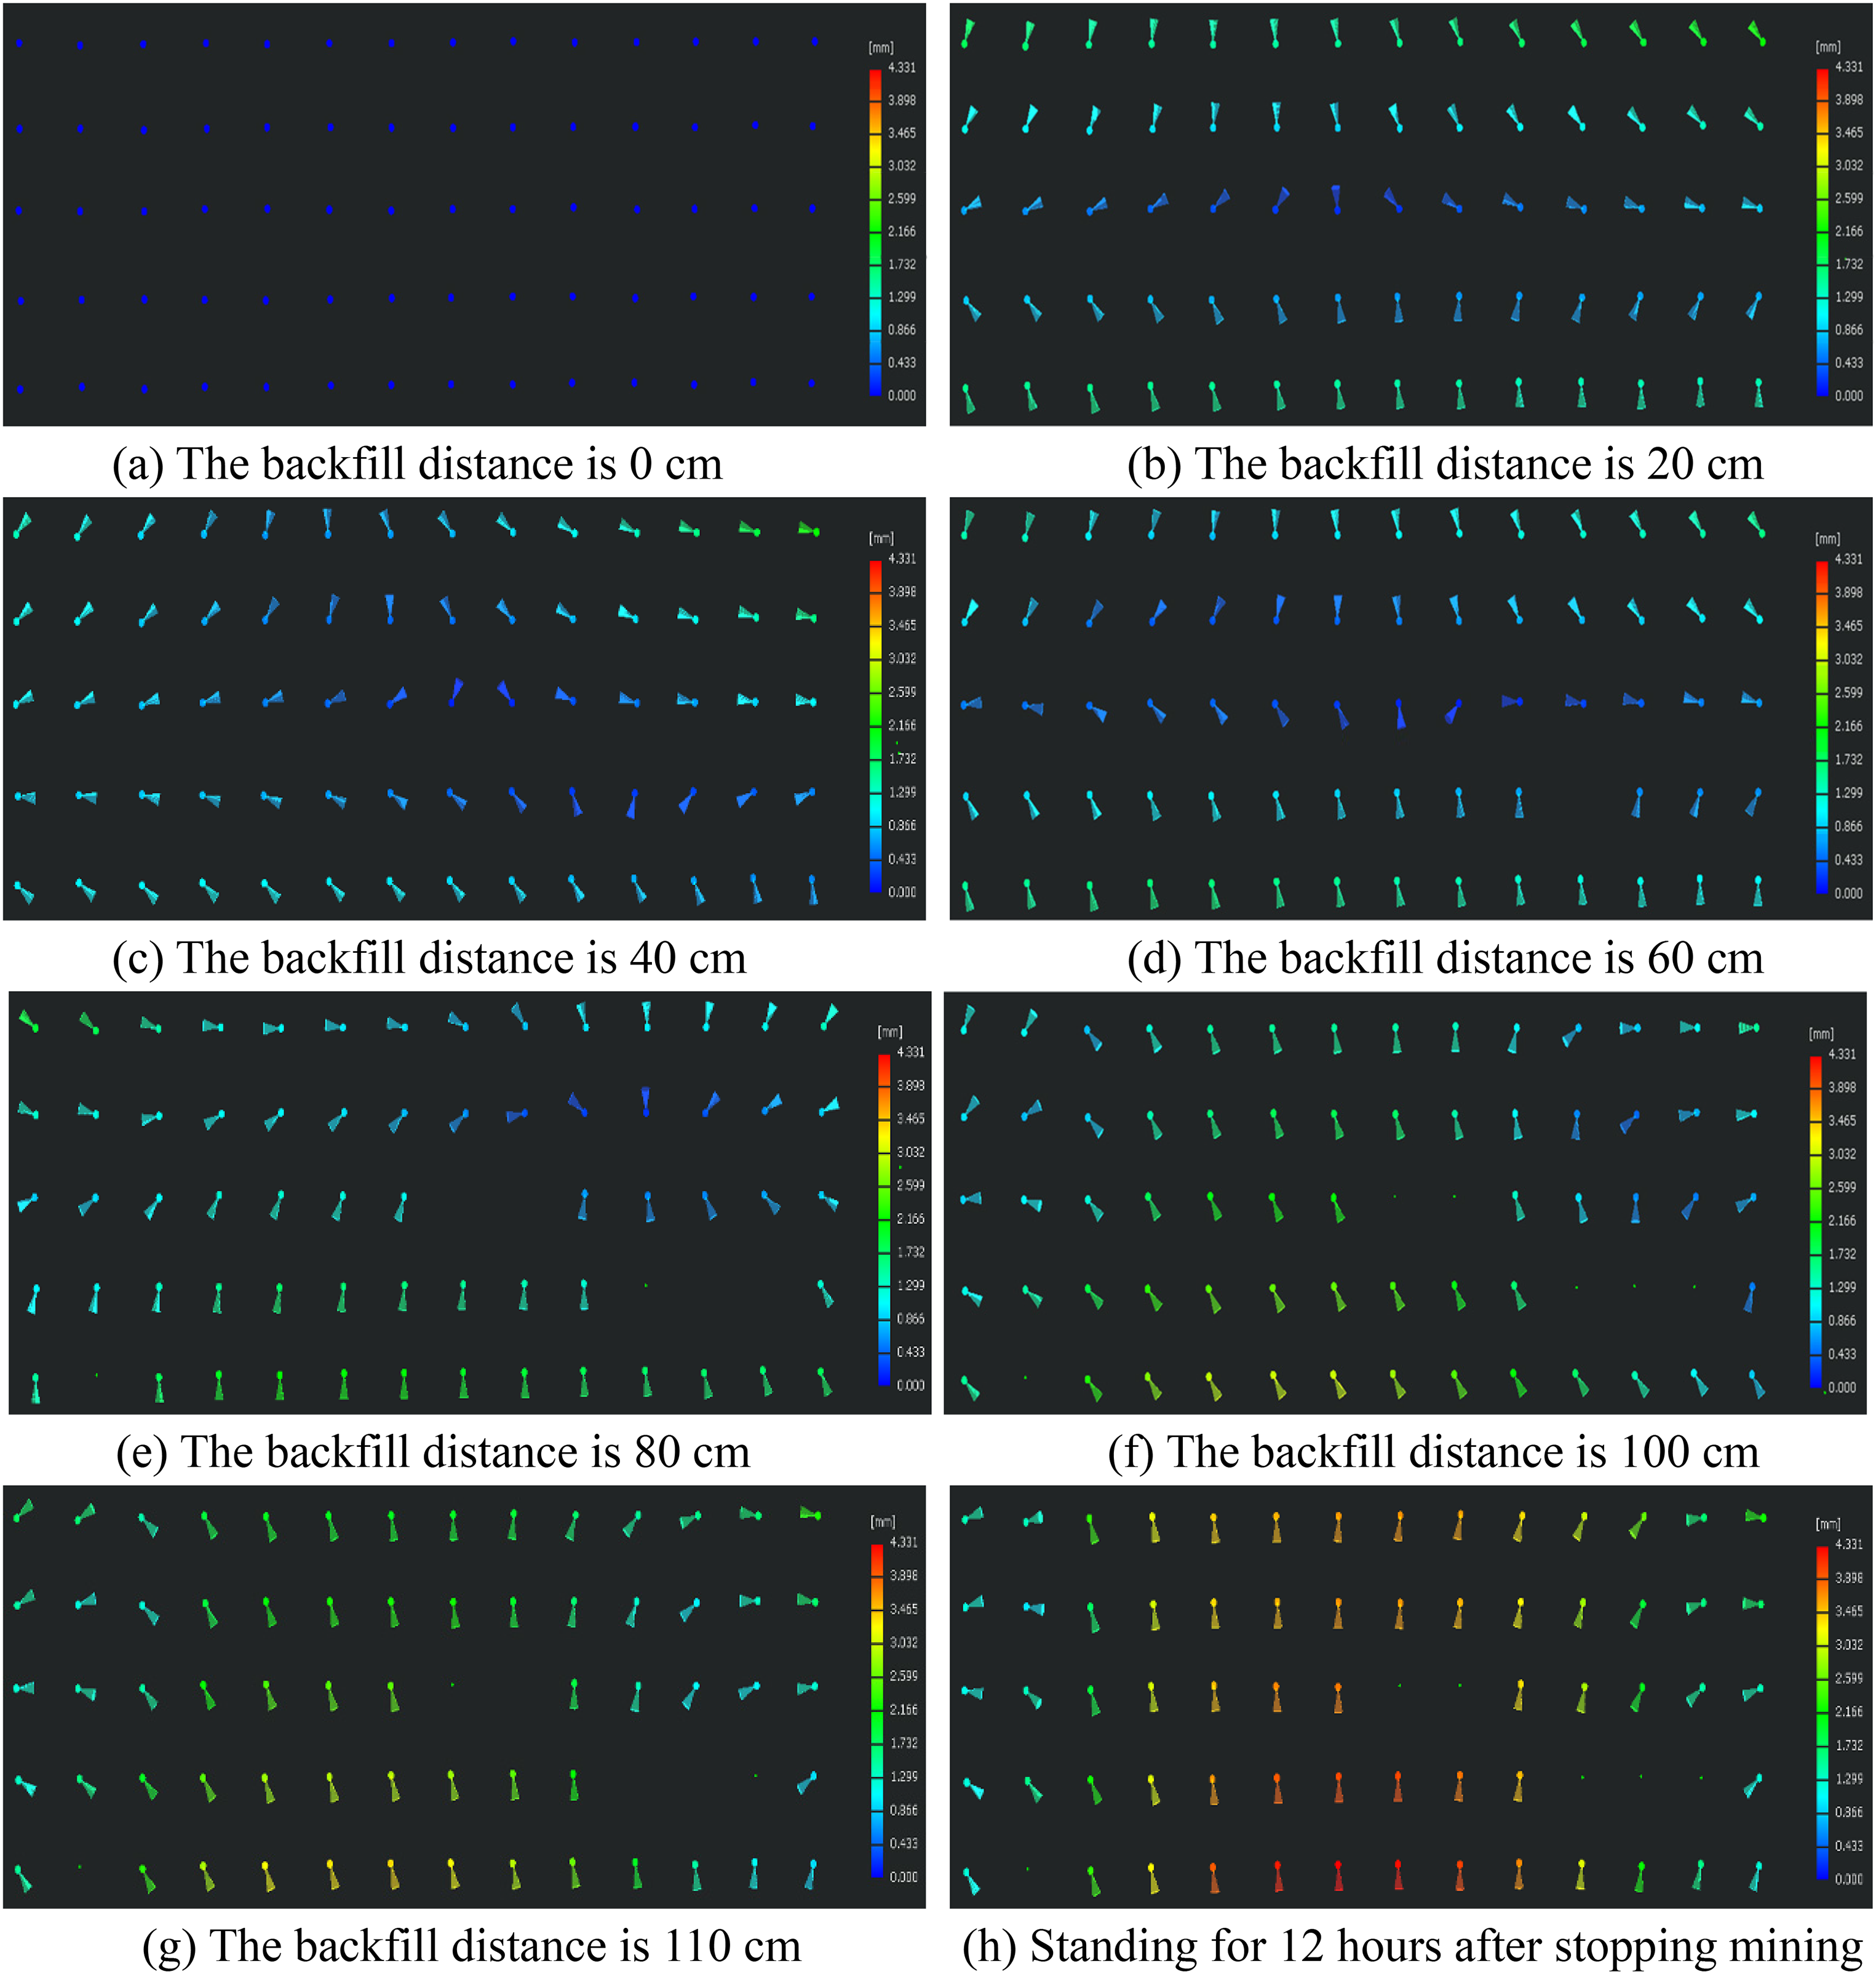
Deformation diagram of overlying strata.
As can be seen from Figure 7a–h, when the coal seam is not excavated and backfilled, overlying strata in the model basically has no displacement; When the backfilling distance is 20 cm, the overlying strata in front of and behind the coal face begins to subside and deform slightly, and the subsidence is less than 1 mm; The maximum subsidence of the roof after backfilling 40 cm, 80 cm, and 110 cm is about 1.30 mm, 2.17 mm, and 3.46 mm, respectively, which indicates that as the coal face advances, the roof subsidence in goaf are gradually increases. The area with the greatest of roof subsidence is in the middle of the backfilling range, and the roof subsidence on both sides of the backfilling area is small due to the support of the coal pillar. The distribution law of the compression degree of the backfill body can also be reflected from the stress value of the backfill body in Figure 6h.
The roof subsidence and backfill body compression are not only shown in the spatial distance, but also temporality. Comparing Figure 7g and h, it is found that although the gob backfill work has been completed, the deformation of the rock stratum is still proceeding slowly. The maximum subsidence of overlying strata in the model with backfilling of 110 cm and standing for 12 hours is 3.46 mm and 4.33 mm, respectively. As time goes on, the interaction of the overburden subsidence and the compression of the backfill body gradually slowed down and balanced, which reflects the temporality of roof subsidence and strength increase of backfill body.
Theoretical requirements for the bearing performance of the RBB
According to engineering practice and similar material modeling, the spatiotemporal model of roof subsidence and strength increase of the RBB is established, as shown in Figure 8. Along the coal face strike, as the backfilling distance increases and time passes, the subsidence state of the roof behind the coal face gradually develops from the active stage to the stable stage, the overburden pressure on the backfill body gradually increases and then stabilizes as it moves away from the coal face. Under the action of the roof load, the supporting strength of the RBB has also undergone the process of slow growth and then stabilization The roof at any distance behind the coal face will produce pressure on the RBB due to its subsidence, and the time taken for the coal face to pass through this distance is also the period when the support strength of the RBB increases continuously. Therefore, the law of ground pressure behavior and the strength growth of the backfill body show certain spatiotemporal coupling characteristics (Li et al., 2017a, 2020; Zhao et al., 2021b).
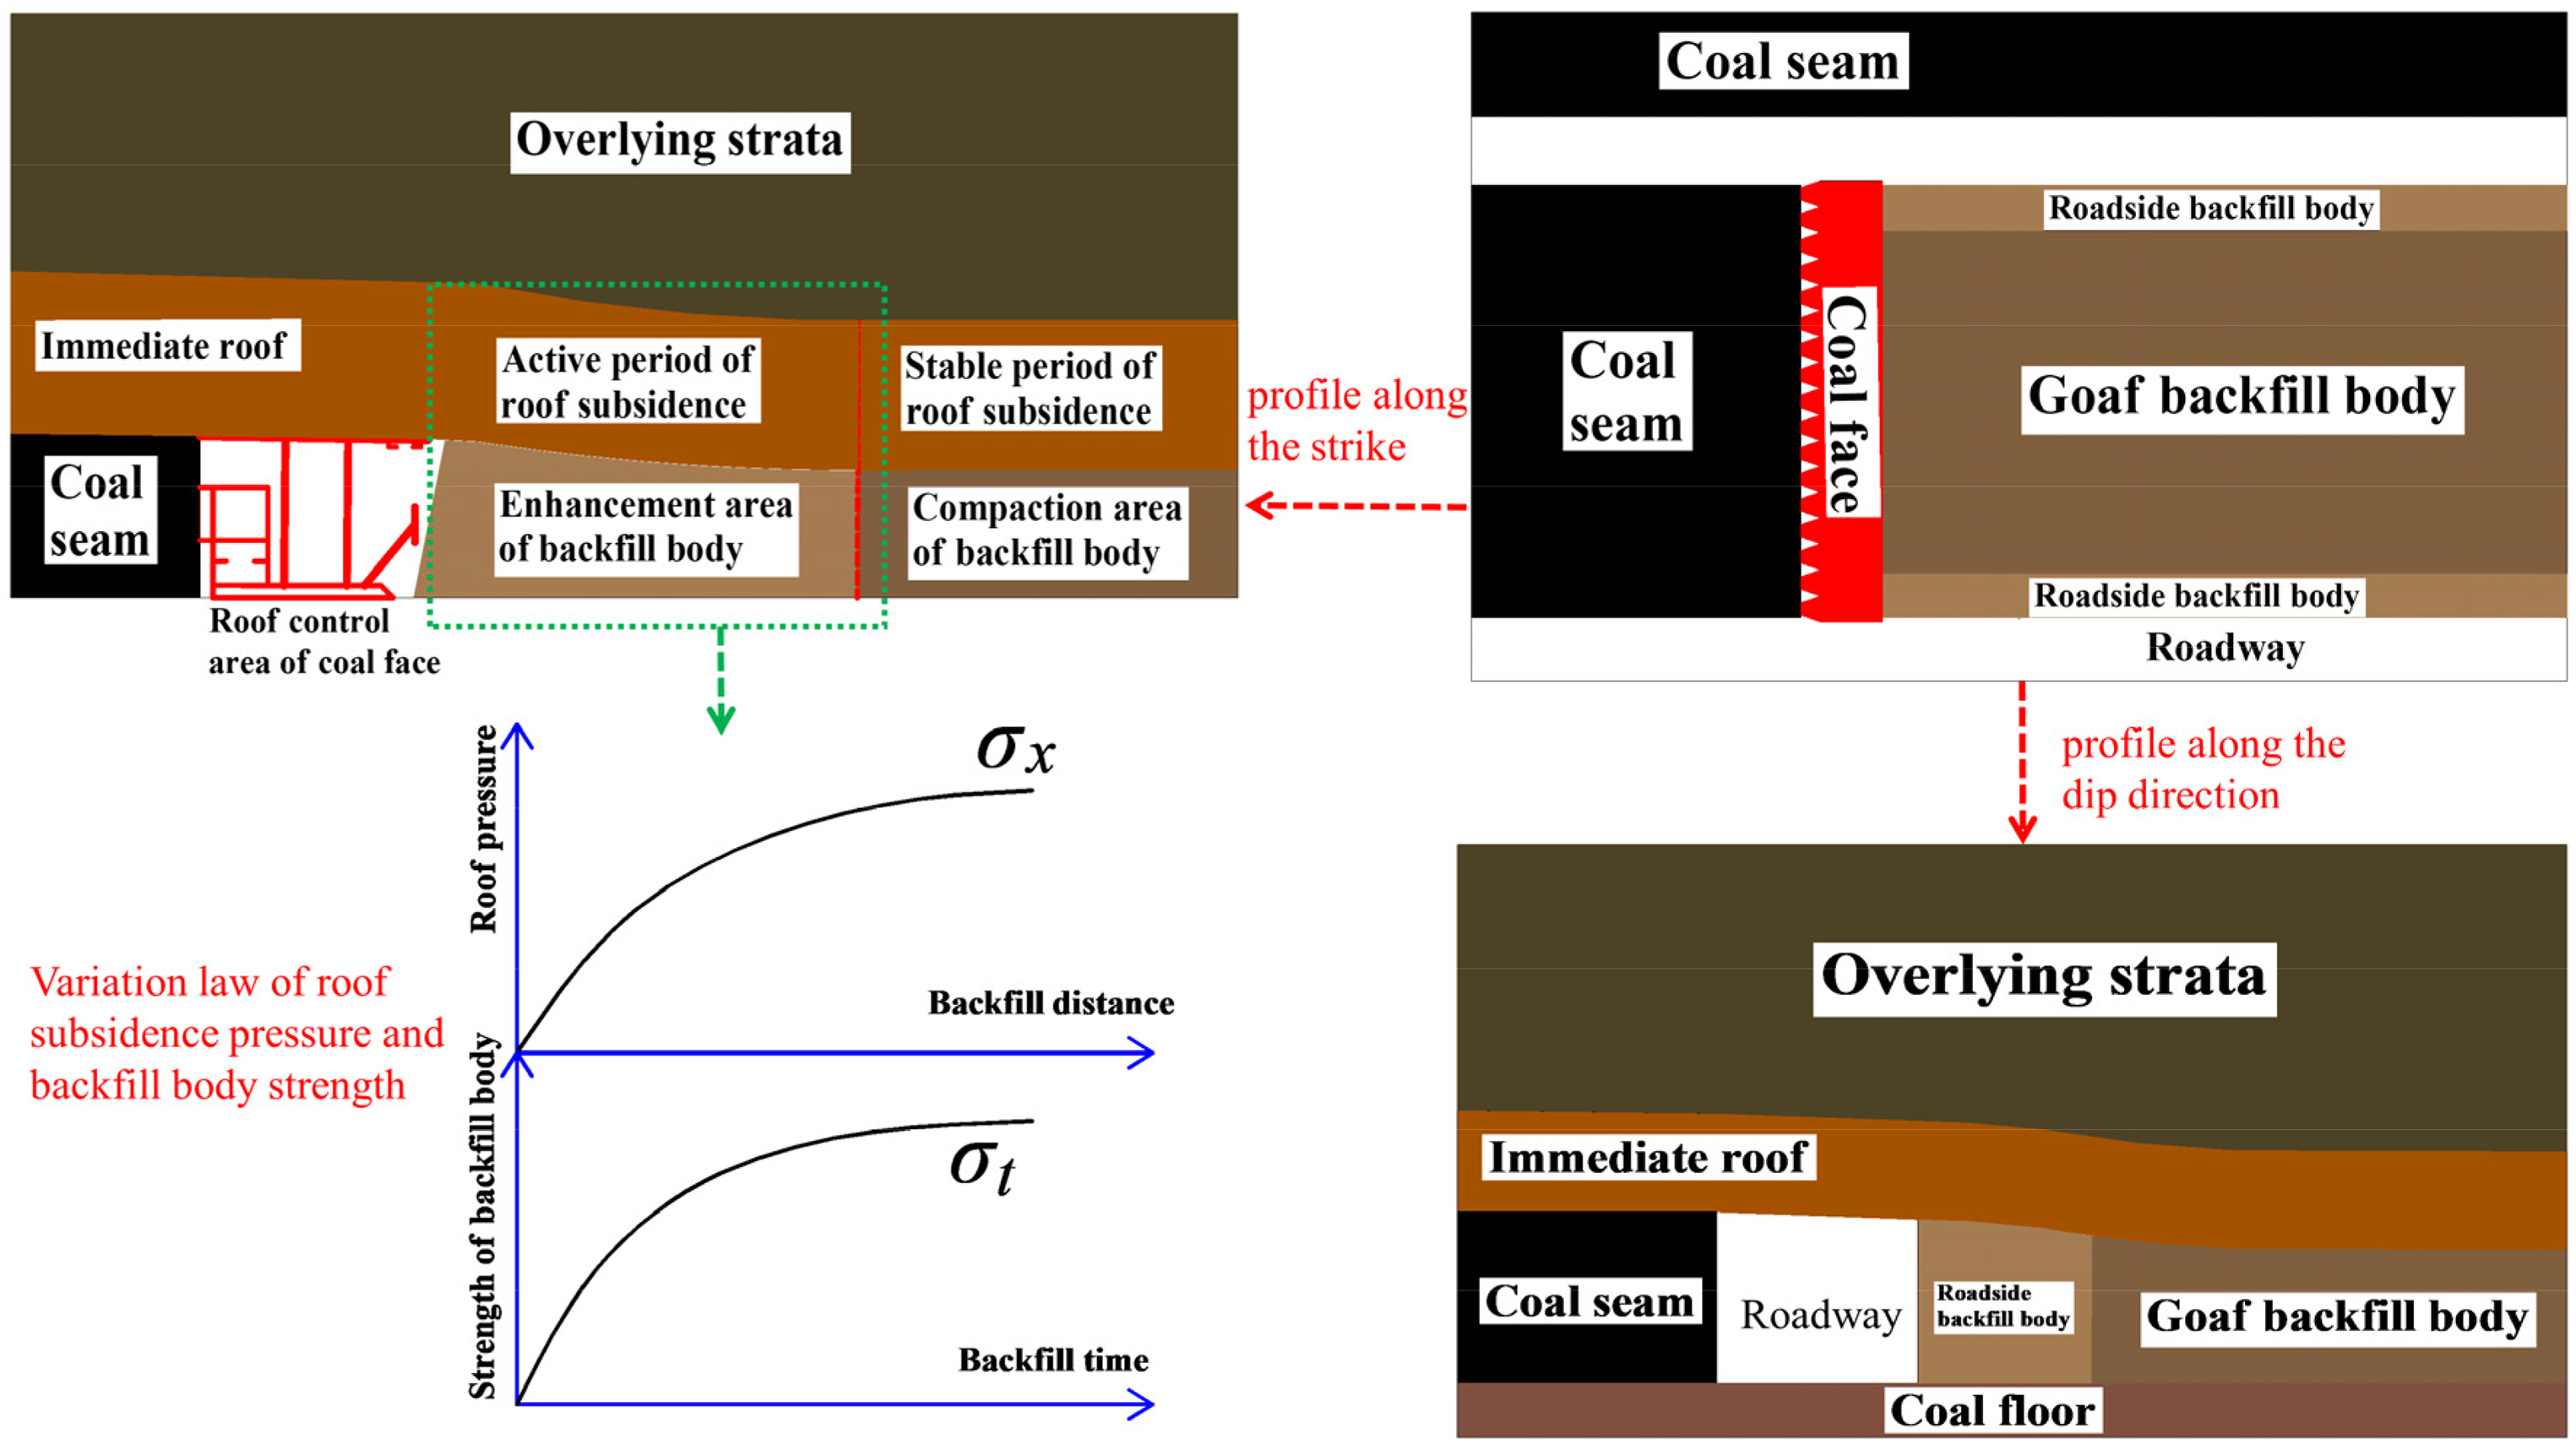
Spatiotemporal coupling model of roof and backfill body.
Based on the spatiotemporal law of ground pressure behaviors, the theoretical requirement for the GER in dense backfilling mining is that the support strength of the RBB increasing with the advancing time of the coal face is always not less than the ground pressure behavior with the advancing distance of coal face, that is, during the advance of the coal face, the strength of the RBB at any distance behind the coal face is always not less than the roof pressure at that place, including when the roof pressure reaches the peak value behind the coal face, the support strength of RBB is still not less than this peak value. The formula is expressed as:
Meanwhile, the compression of the RBB should not be too large to ensure the requirements of the roadway section. Assuming that the initial section of the roadway is rectangular, after the immediate roof tilts and subsides, the compressed area of the roadway is similar to a right angle trapezoid, as shown in Figure 9.
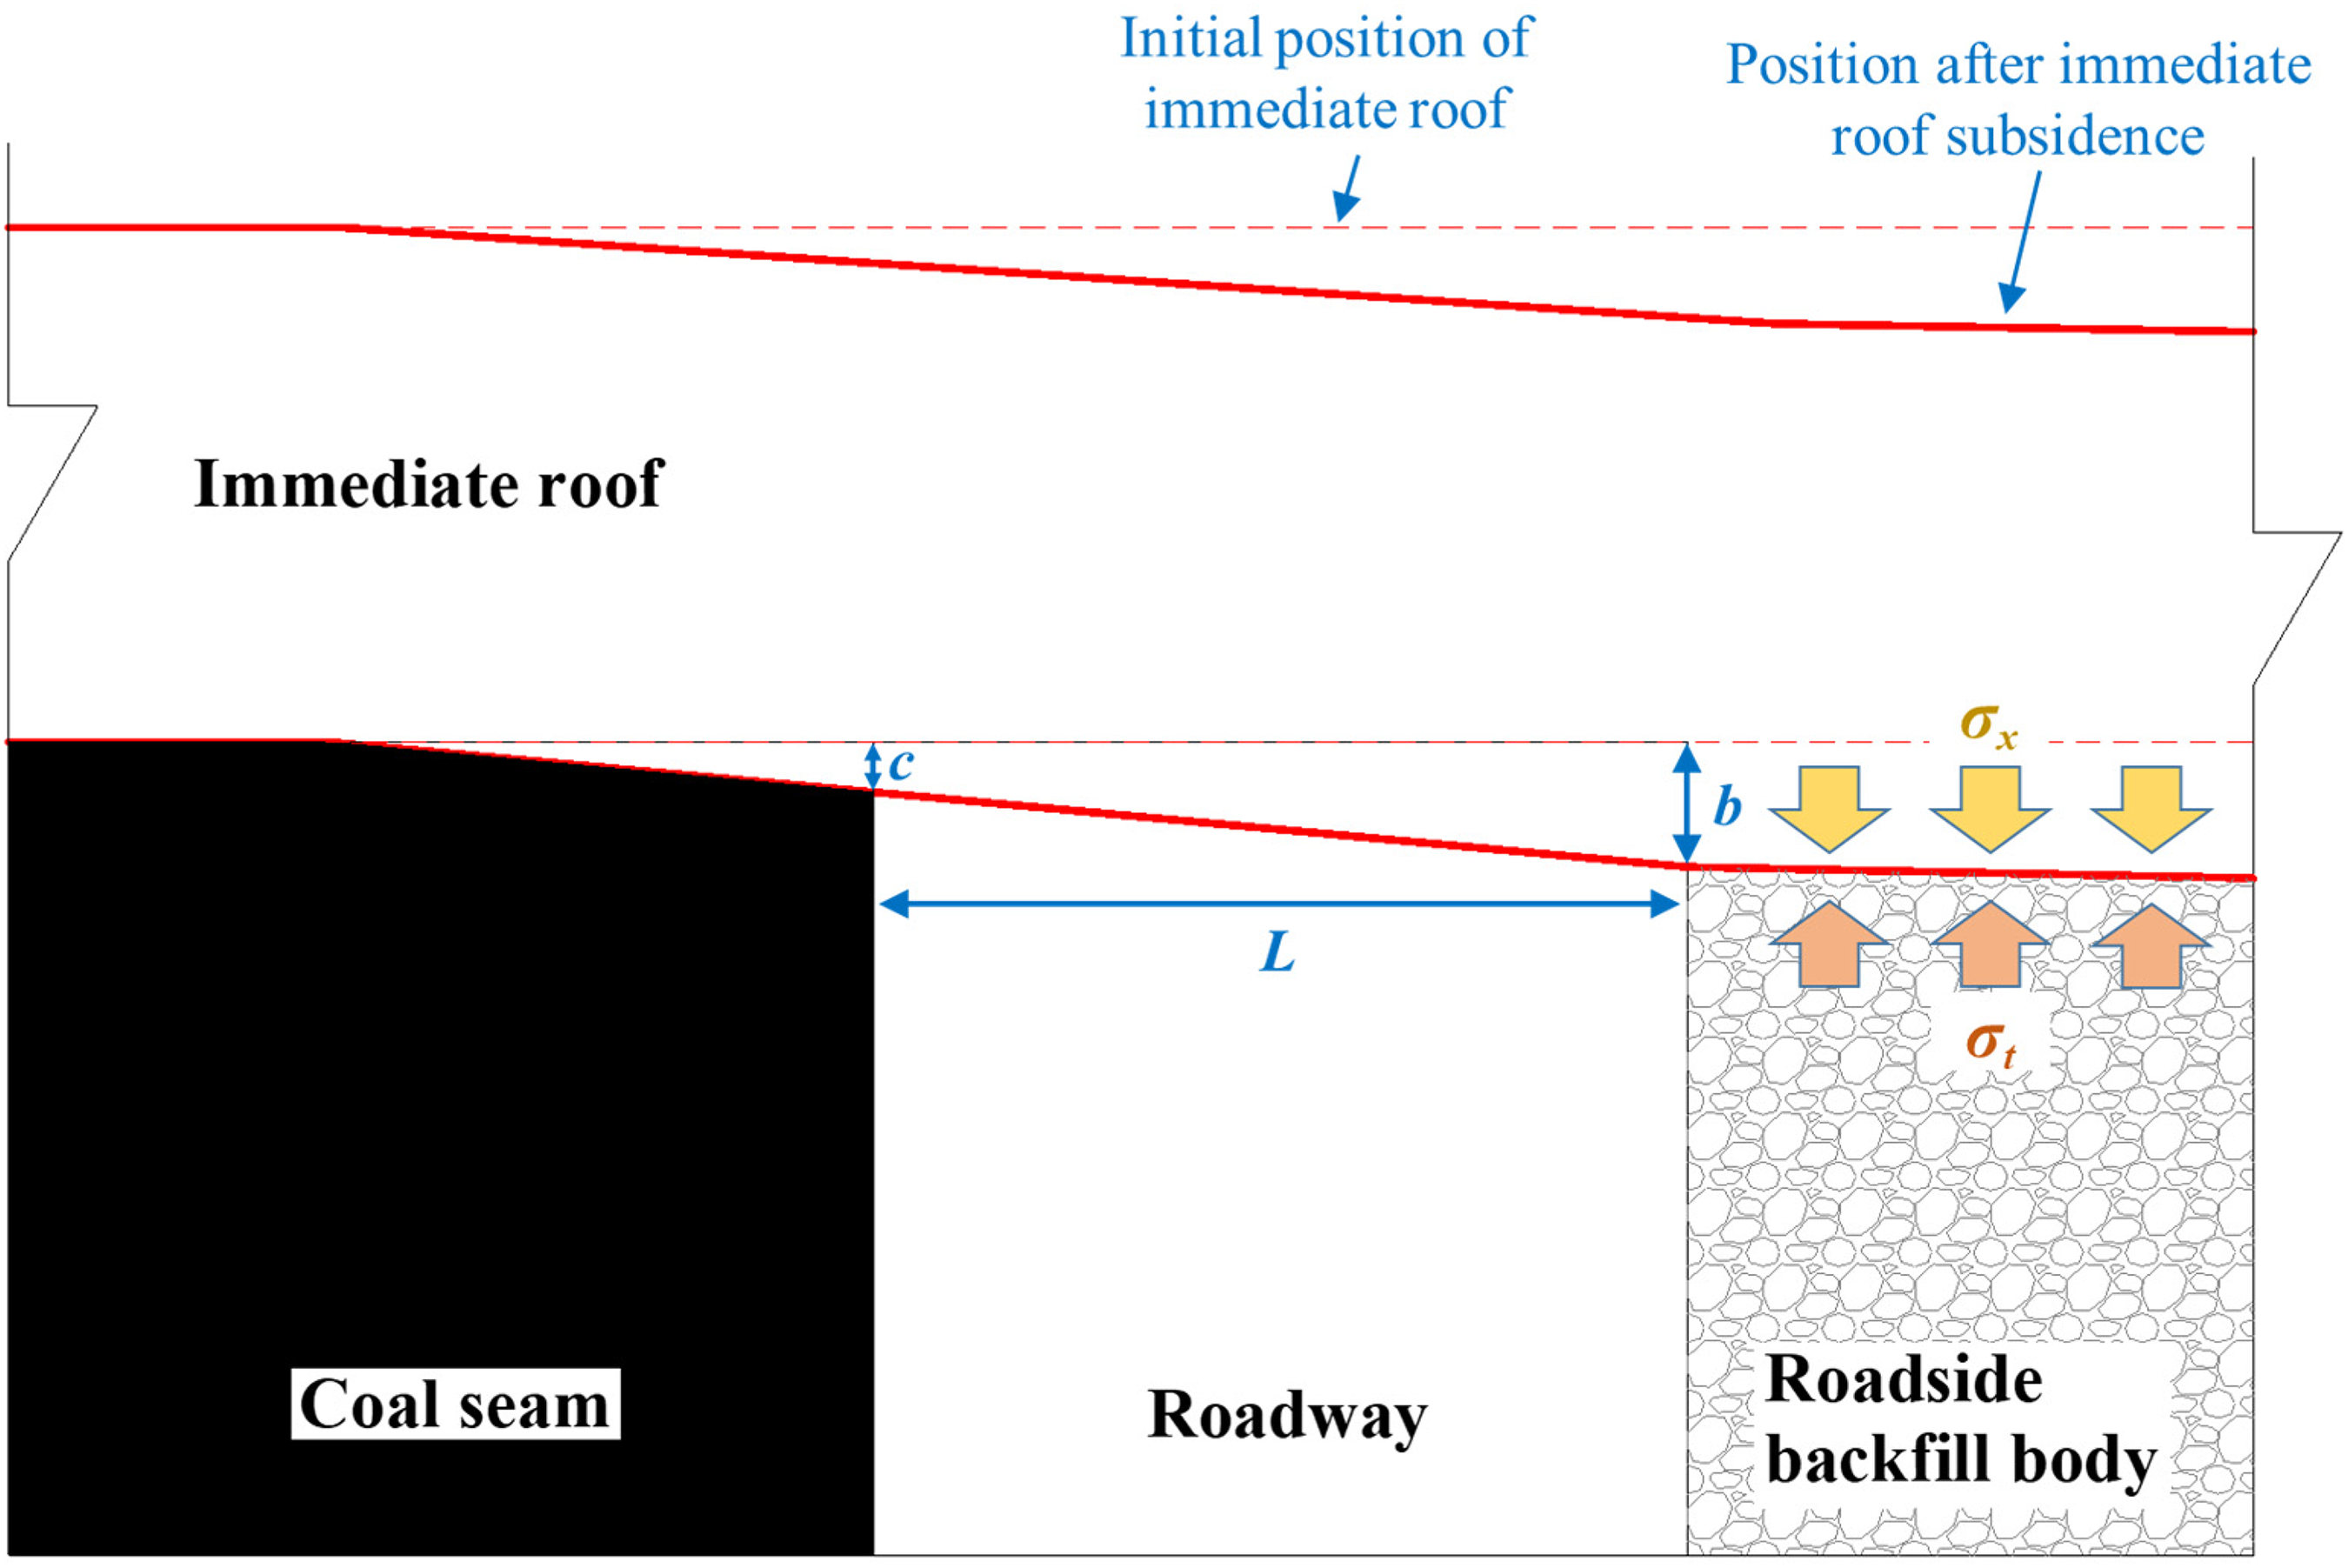
Cross-section of the roadway before and after immediate roof subsidence.
The conditions to be met for the roadway section area after the RBB is compressed are:
In this way, during the backfilling process, the RBB and the goaf backfill body jointly control the deformation of the surrounding rock and the movement of the overlying strata, and it can always maintain stability and integrity, and achieve the effect of effectively supporting and maintaining the roadway (Chen et al., 2018).
Material ratio test of RBB
Selection of gangue gradation
The literature (Xu et al., 2011) pointed out that loose gangue has the least compactness in its natural state (original gradation). Therefore, according to the particle size distribution of the gangue discharged from mine production, the gangue with a particle size of less than 40 mm is selected as the test material, and Talbol Formula (Fuller and Thompson, 1907) is used to guide the gangue gradation. Talbol Formula is as follows: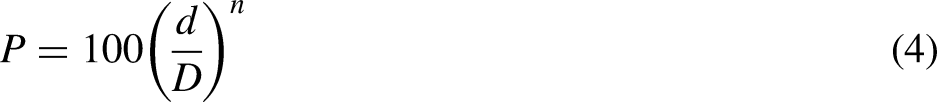
Gangue gradation with different Talbol coefficients.
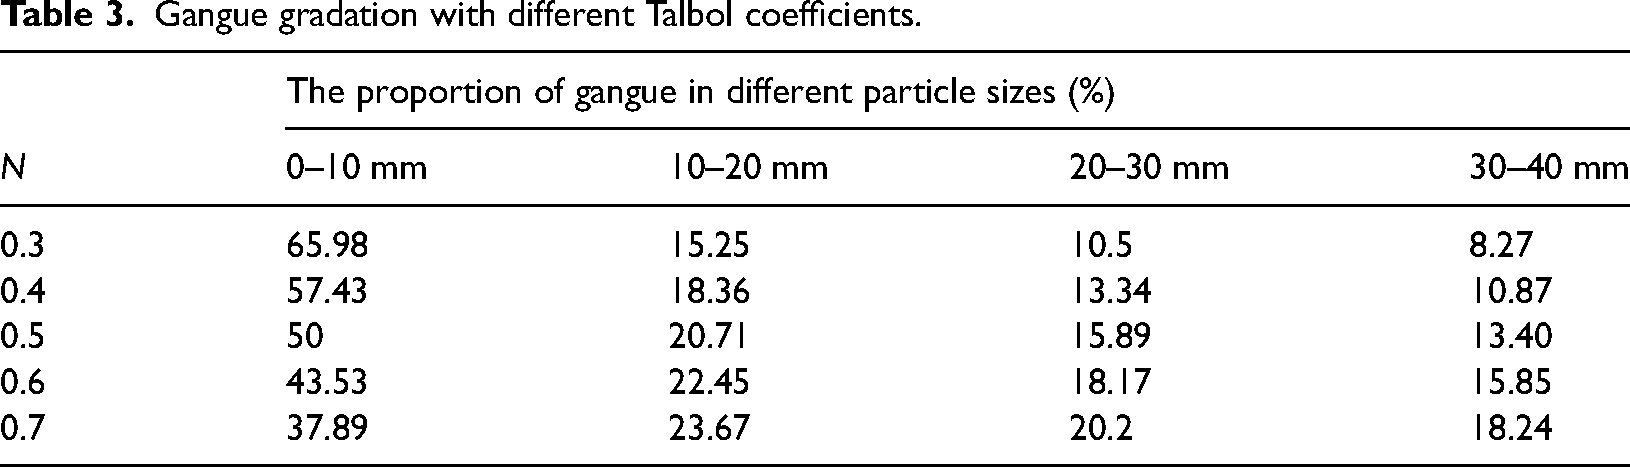
The stress–strain curve of the continuous gradation gangue was obtained by compression test with different Talbol coefficients (Figure 10).
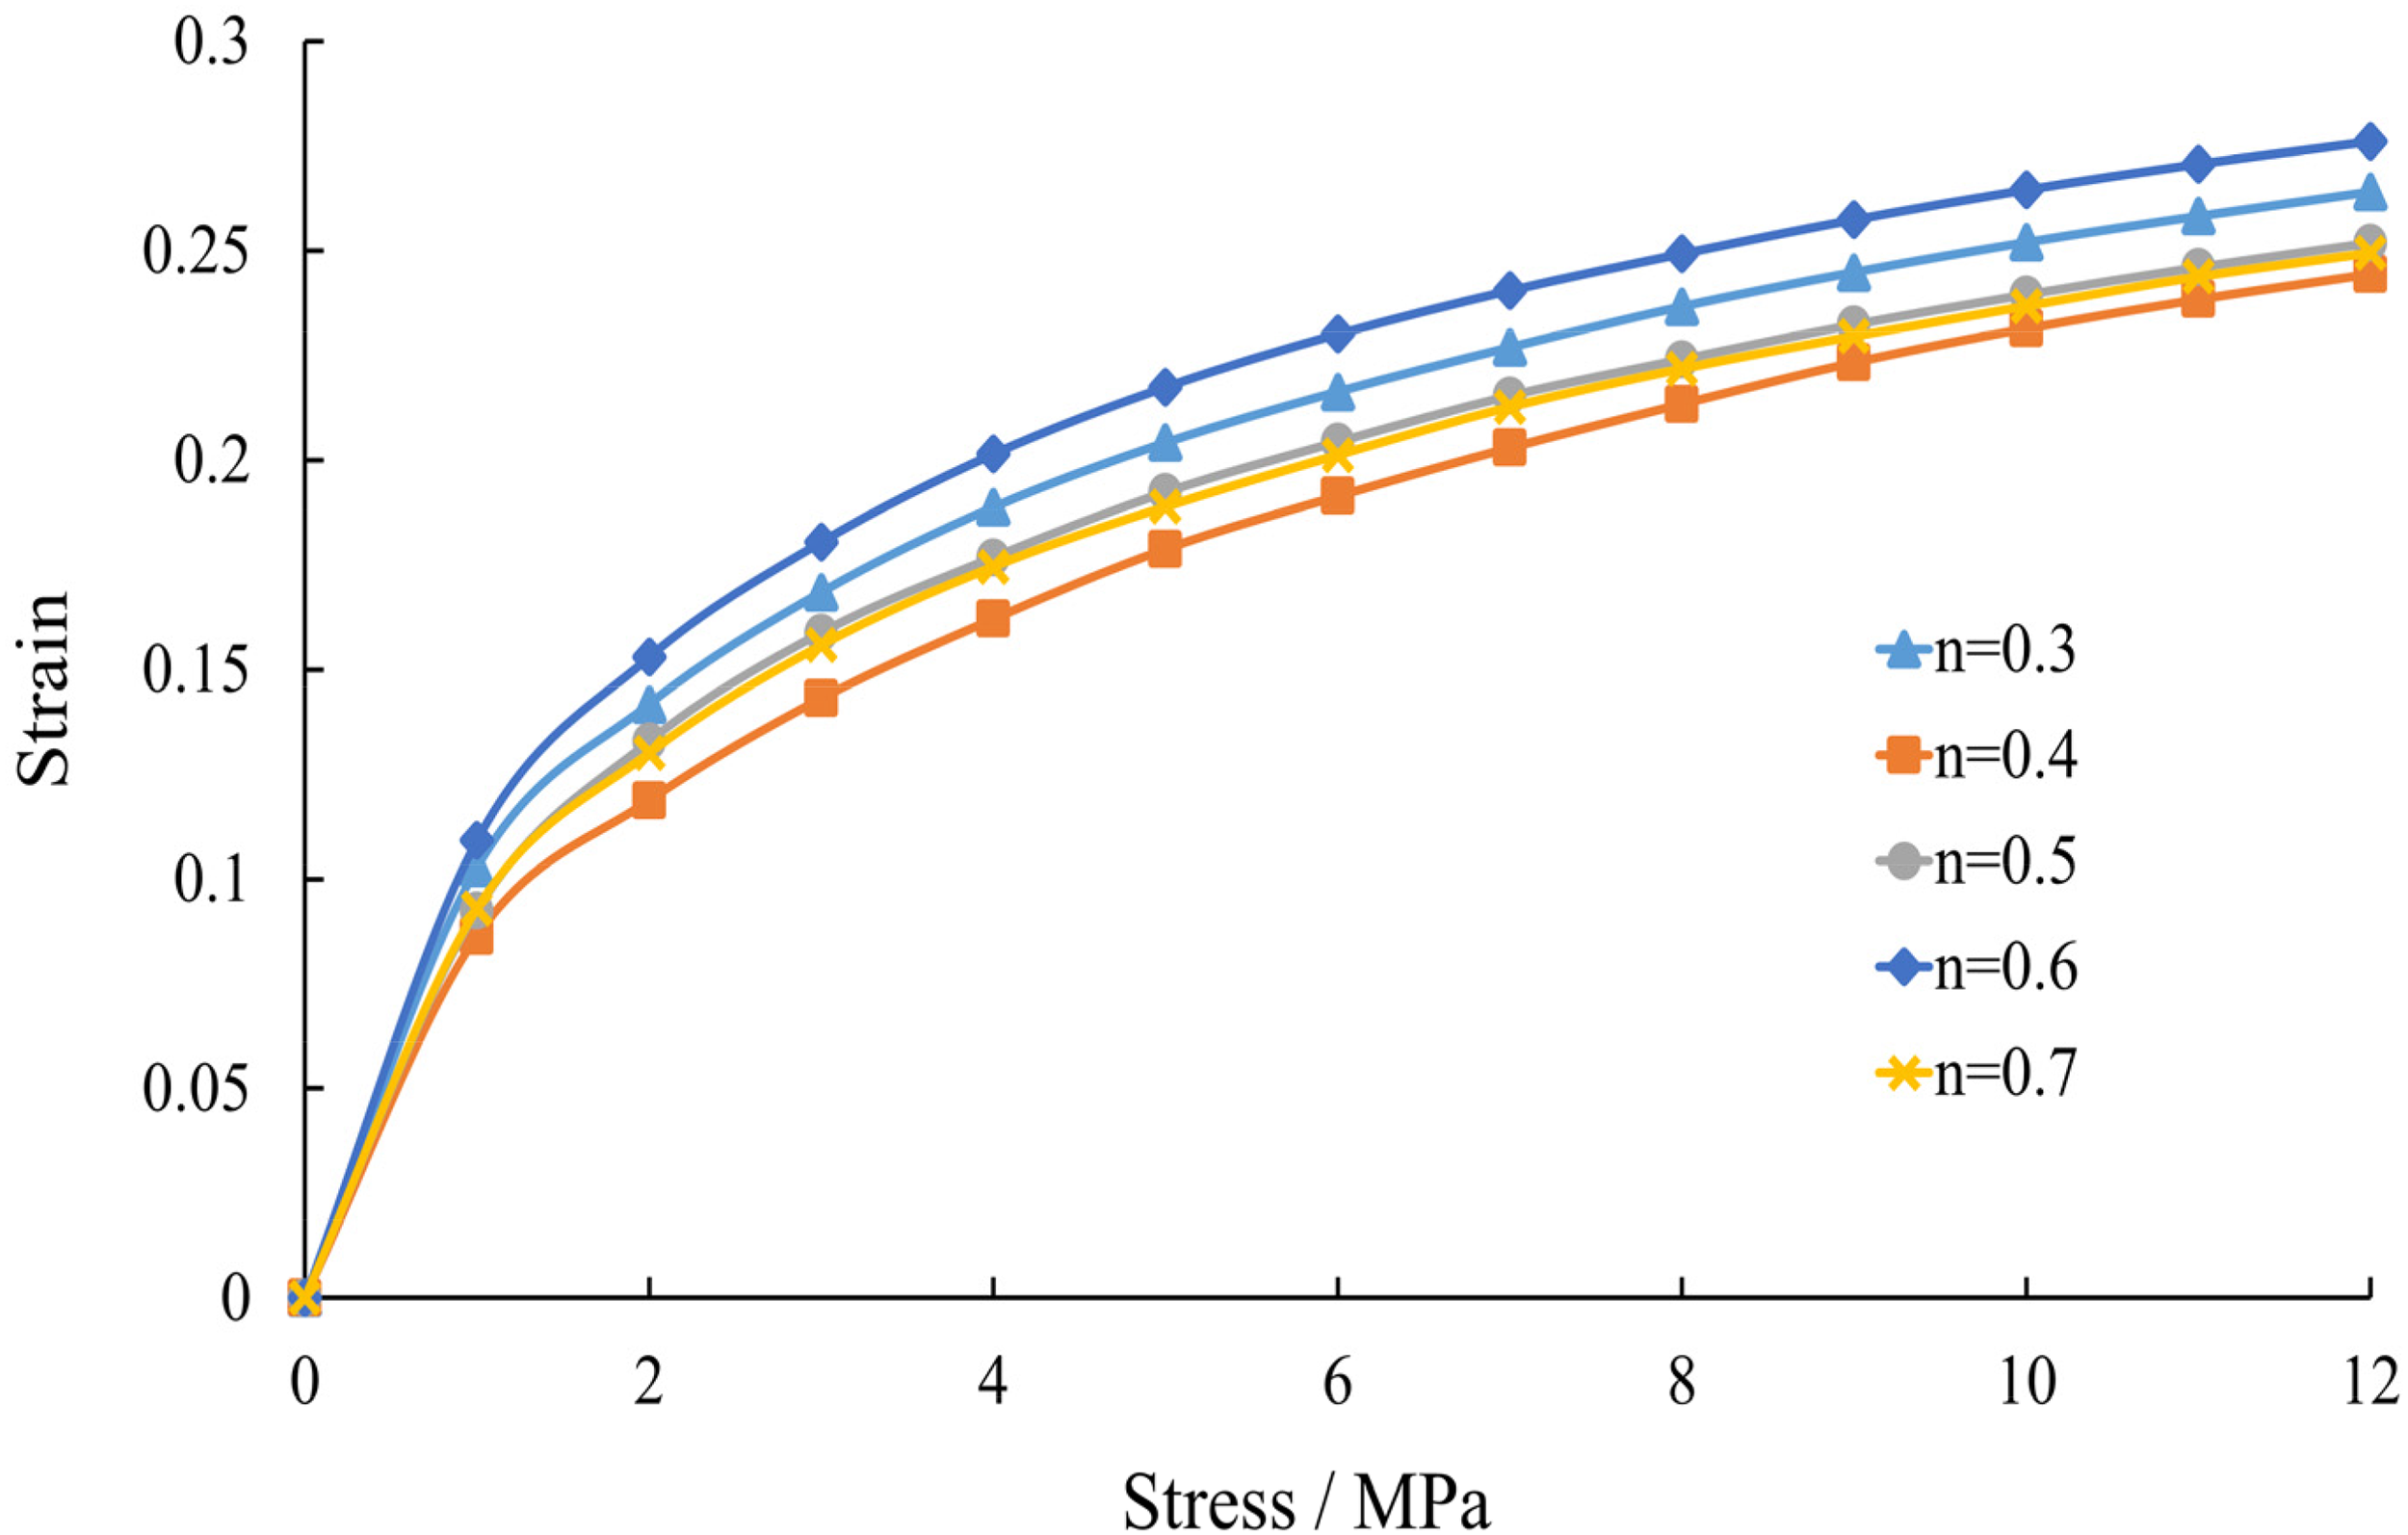
Compressive stress–strain curve of continuously graded gangue.
Figure 10 shows that the compressive stress–strain curve of continuously graded gangue exhibits a logarithmic pattern that increases rapidly and then increases slowly, the inflection point is found at about 2 MPa. By comparing the stress–strain curves with different Talbol coefficients, it is found that the strain variation of continuous gradation gangue with Talbol coefficient n = 0.4 is the smallest, indicating that the compression ratio of continuous gradation gangue with Talbol coefficient n = 0.4 is the smallest and the density is the highest, this gradation is therefore chosen as optimal for use as aggregate in the test material.
Test scheme
To find a material ratio that can make the aging strength of the RBB meet the spatiotemporal law of ground pressure behavior under the dense backfilling condition, make the RBB has enough strength to support the roof pressure and movement in time, which plays the role of maintaining the roadway section. Considering the backfilling cost, gangue, fly ash and cement were selected as test materials (as shown in Figure 11), and then specimens were made and compressed. The specific ratio scheme is shown in Table 4.
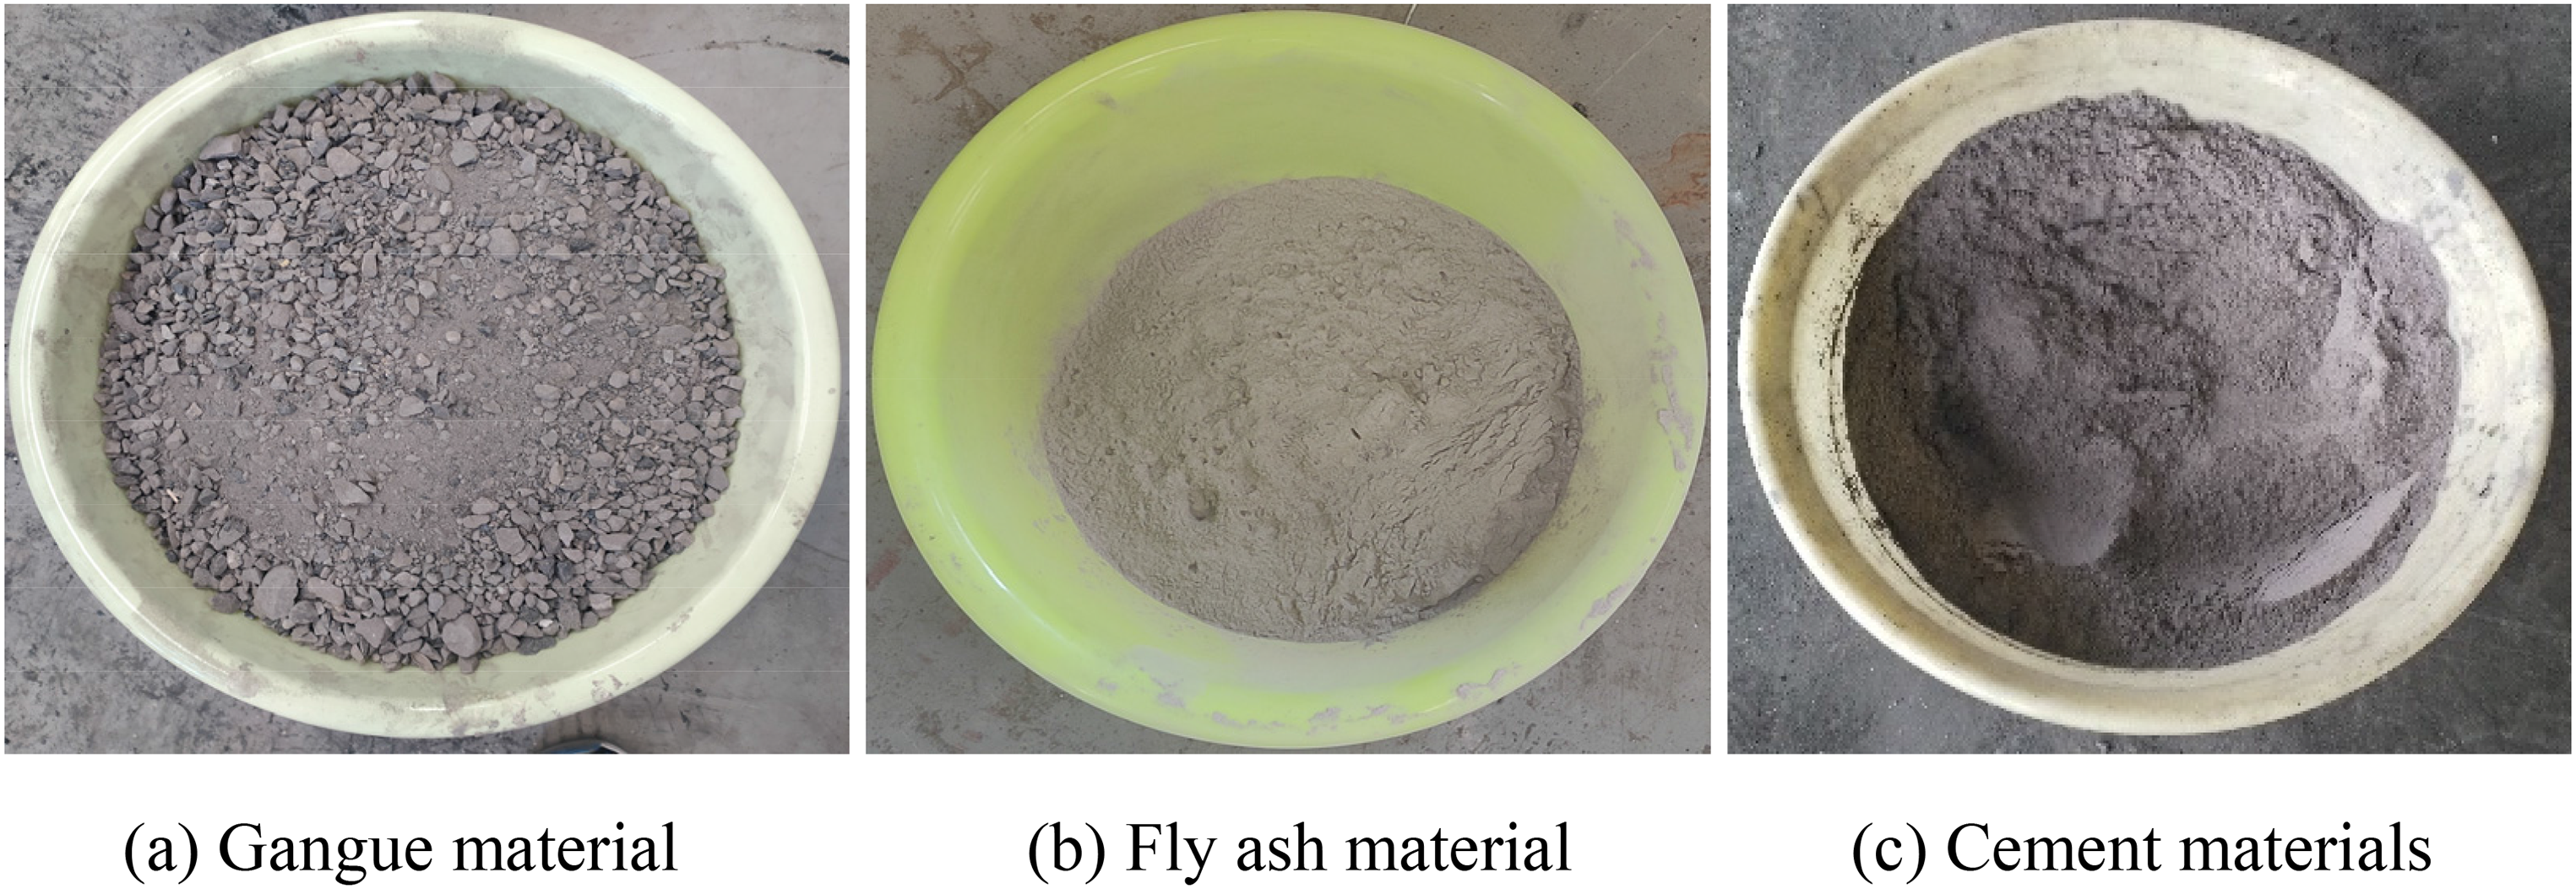
Test materials.
Material ratio scheme of RBB.
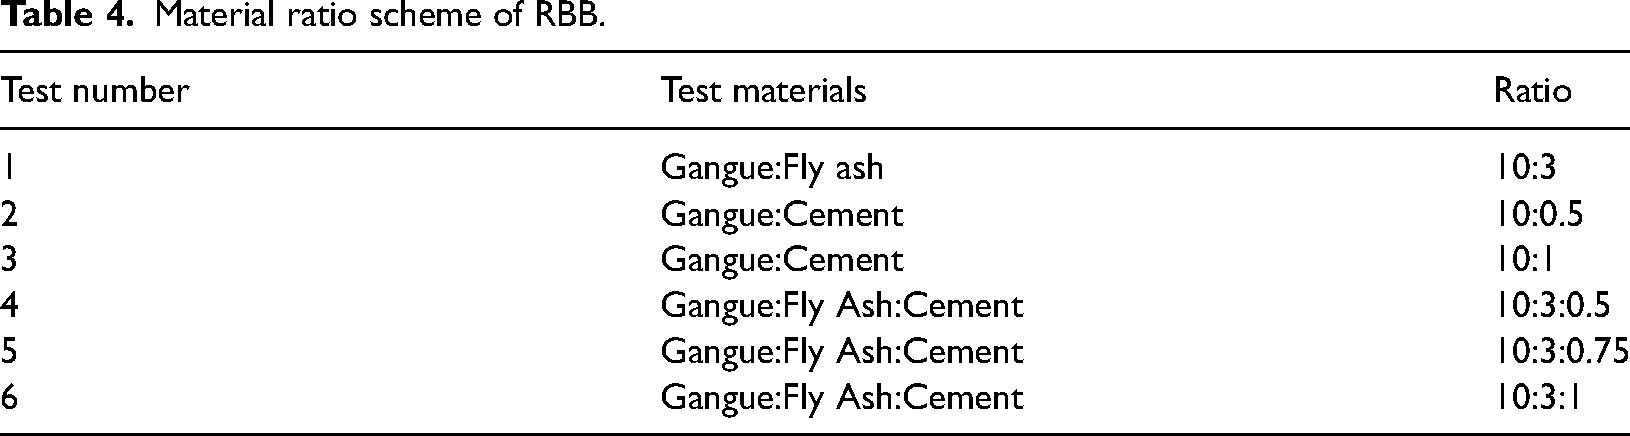
It should be noted that the water–cement mass ratio of the specimens is 0.6. The material is evenly stirred and poured into the forming mold and then compressed vertically, the compressive stress is 2 MPa to simulate the tamping force of hydraulic support on the backfill body during the on-site backfilling. The compacted specimens are placed under natural conditions (the average temperature is about 25°C, the relative humidity is about 80%), and demoulding after one day. In the above-mentioned engineering practice, the pressure on the backfill body in goaf monitored at the distance of 15 m and 40 m from the coal face is 3.5 MPa and 5.5 MPa, respectively. According to the calculation of coal face advancing 4.8 m a day at most, the time of advancing 15 m and 40 m is 3.13 days and 8.33 days, respectively, so 3 days, 7 days and 28 days are selected as the curing time of specimens in each test group.
Analysis of test results
Strength characteristics of the specimen
Through uniaxial compression of the specimens in each test group, the compressive strength is plotted as shown in Figure 12.
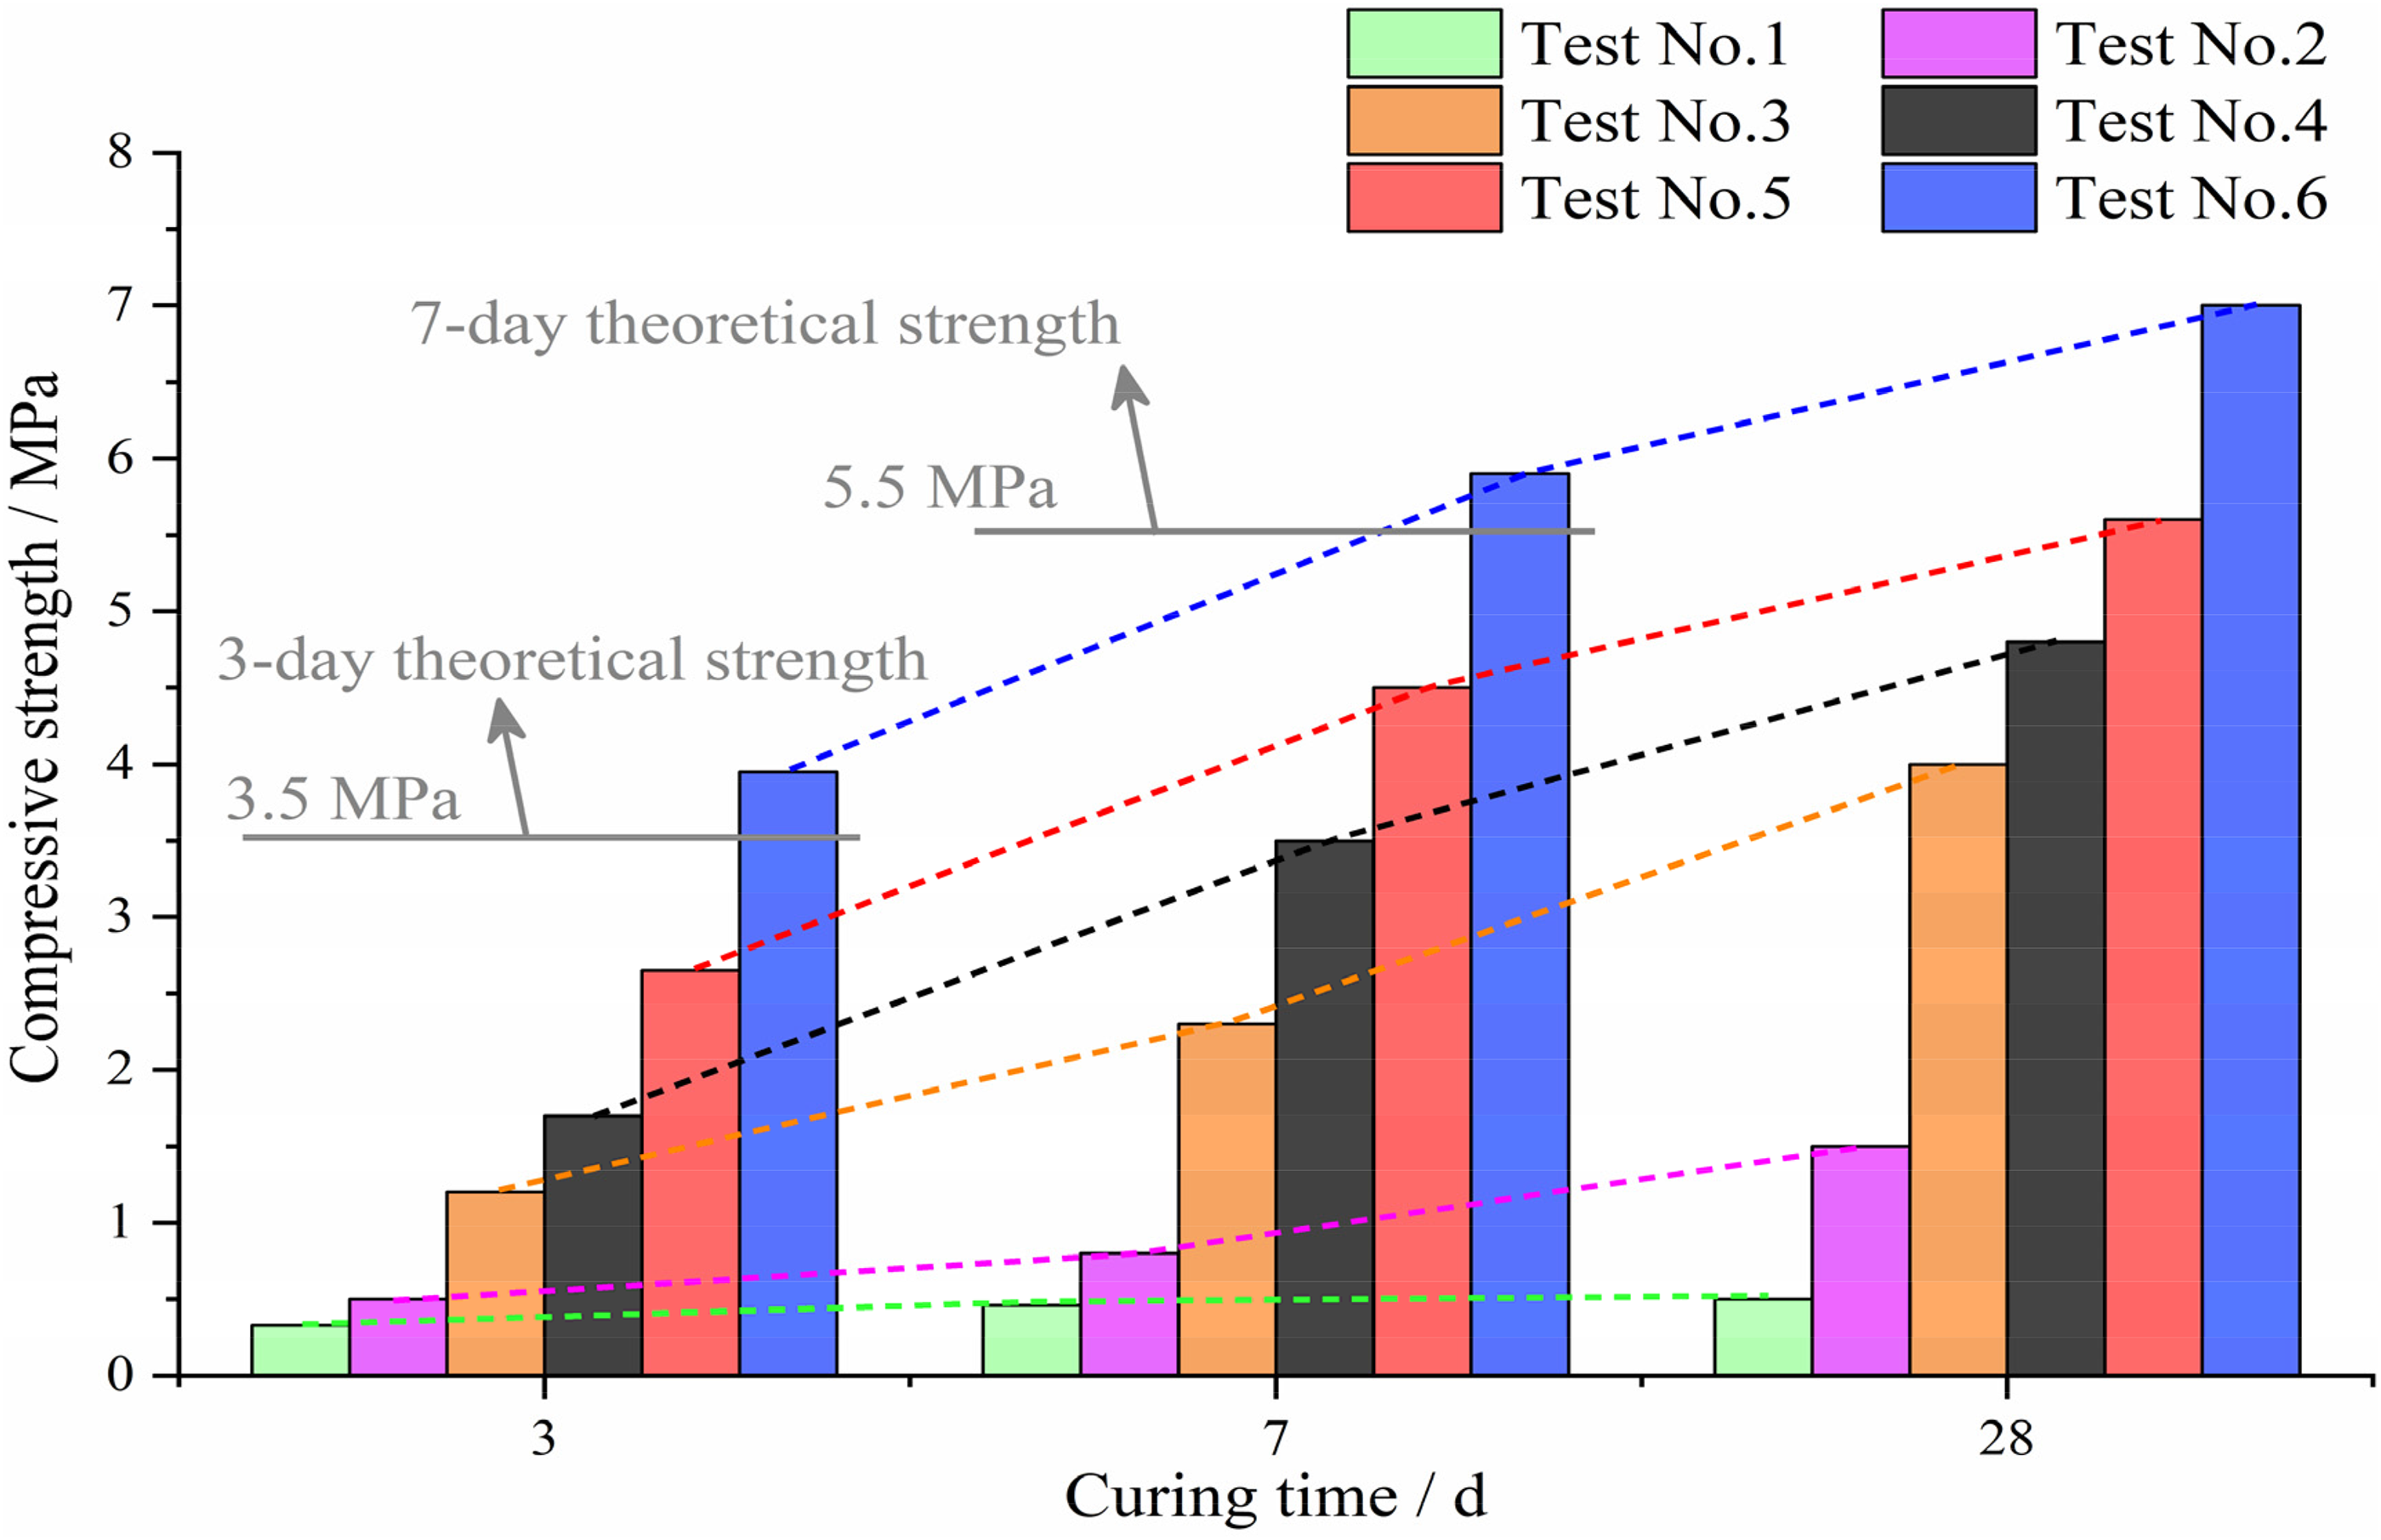
Compressive strength of specimens.
From the analysis of Figure 12, it can be seen that the strength of the specimens in each test group showed different degrees of increasing trends with the increase of time. The strength of the specimens in the No.1 test group is the least obvious change with time, that is, after adding 30% fly ash into the gangue, the compressive strength is still very small, basically no more than 1 MPa, so the material of No. 1 test group cannot be directly used as the support material for RBBs.
The components of the test pieces in No. 2–3 test groups are gangue + 5% cement and gangue + 10% cement respectively. As can be seen from Figure 13, the uniaxial compressive strength of the specimens is significantly higher than that of the No. 1 test group, especially in the period from 7 days to 28 days, the strength increase is relatively large, but compared with the theoretical strength under the corresponding time, it is still small, that is, the RBB with this material ratio cannot effectively resist the ground pressure behaviors in the coal face advancement in time. Therefore, the materials with the ratio of No. 2–3 test groups cannot be directly used as theoretical support materials for RBB.
Deformation characteristic curve and failure morphology of the specimen.
Different proportions of cement were added to the materials of No. 1 test group to form test specimens of No. 4–6 test group. It can be seen from Figure 12 that the compressive strength of the specimens also obviously increases with the increase of cement content, indicating that cement and fly ash react with each other to jointly promote the cementation of the backfill body and improve the bearing capacity of the gangue cemented body. Among them, the strength of the RBB formed by the material ratio of the No. 6 test group is the highest. The strength at the curing time of 3 days and 7 days is 4.0 MPa and 6.5 MPa, respectively, which are greater than the theoretical roof pressure of 3.5 MPa and 5.5 MPa at 3.13 days and 8.33 days behind the coal face, respectively. In addition, the strength of the specimens in the No. 6 test group after 7 days is still increasing, which is always greater than the peak value of ground pressure in engineering practice. Therefore, the RBB with the material ratio of the No. 6 test group can always resist the overburden subsidence during the advancement of the coal face, and can stably support the roof pressure. The strength of the specimen with this material ratio meets the theoretical requirements.
Deformation and failure characteristics
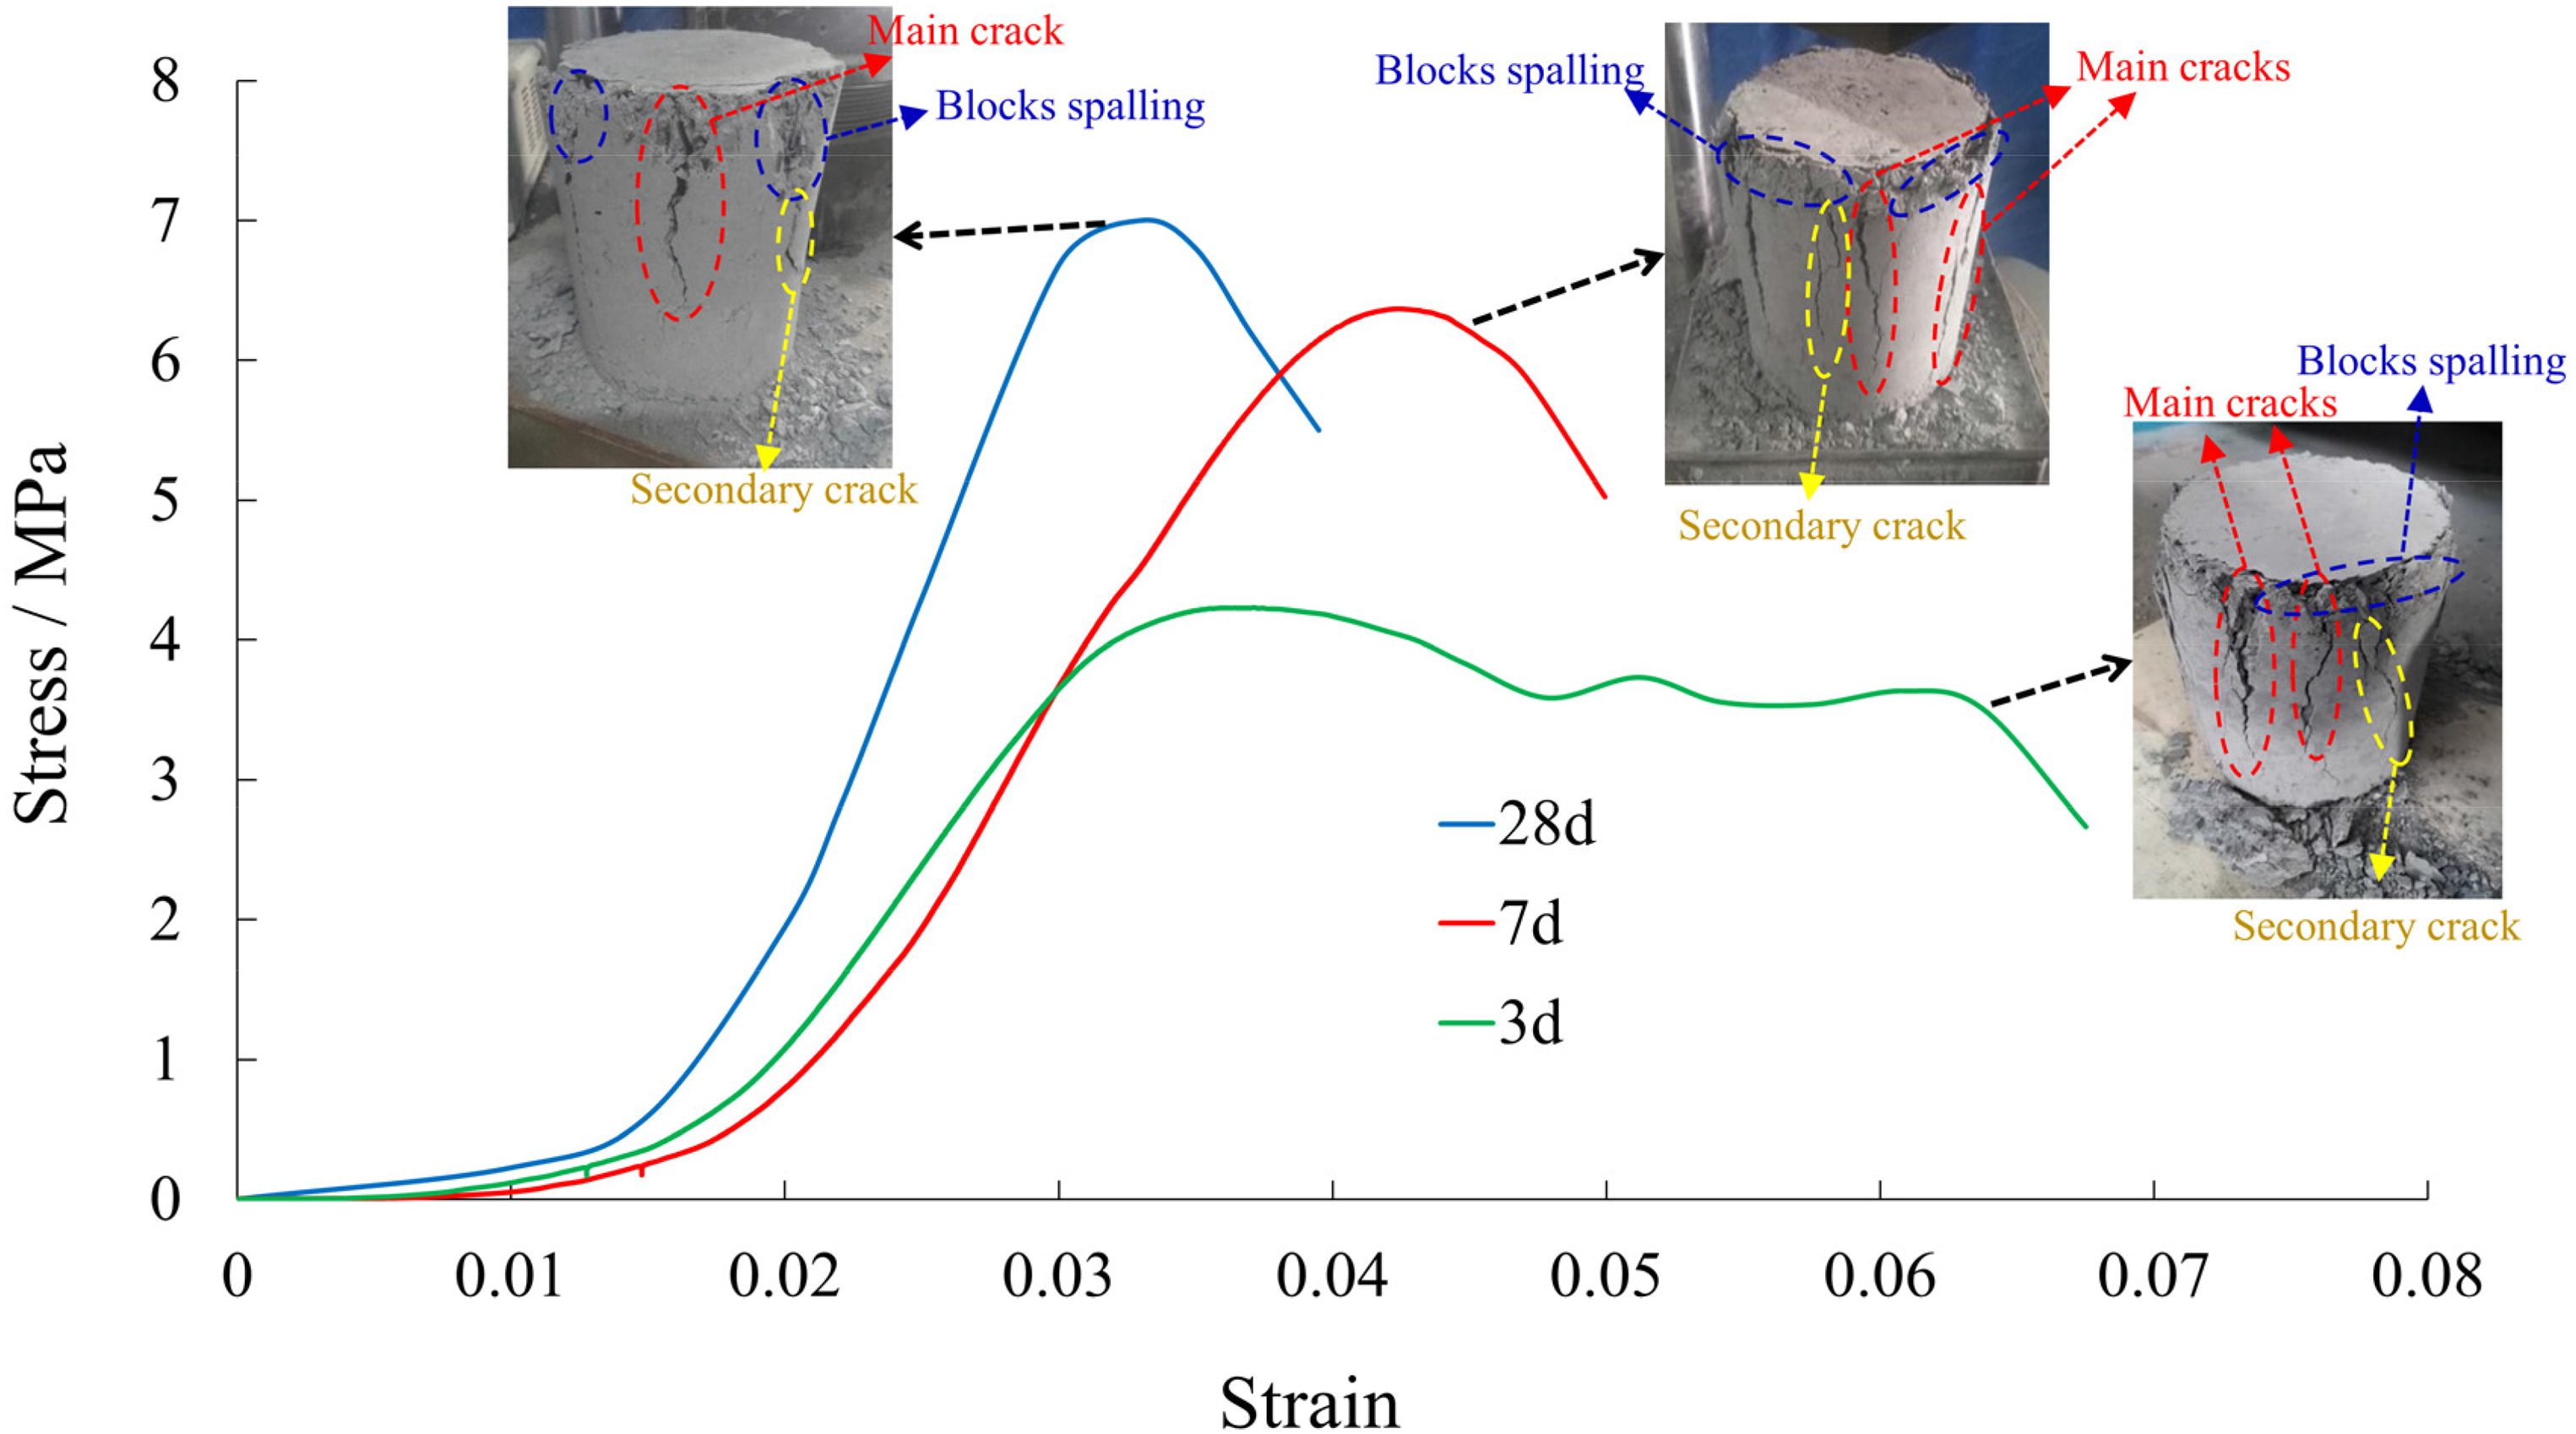
To analyze the deformation and failure characteristics of the specimens in the No. 6 test group under different time conditions, the stress–strain compression curve and the failure morphology after compression are shown in Figure 13.
In Figure 13, it can be seen that the shape of the stress–strain curve of the backfill specimen is similar to that of the typical rock stress–strain curve, but the failure stage of the specimen is different. The post-peak failure process of the specimen with a curing time of 3 days is relatively slow, the top of the stress–strain curve changes smoothly, the strain in the post-peak failure stage increases continuously, and the residual strength shows a downward trend in volatility until the specimen is completely destroyed. However, the specimens with curing time of 7 days and 28 days have a sharper top shape of the stress–strain curve due to crack expansion and instability failure occurred faster during the compression process, and the curve of the post-peak failure stage has a sharp downward trend, indicating that the specimens with a long curing time have higher strength and greater hardness, once the pressure exceeds their peak strength, they will suddenly lose stability and damage, so that the failure form of the specimens with long curing time and high compressive strength tends to develop towards brittle failure. The strain range of the specimens with different curing times when they fail is between 0.03 and 0.045. The strain for the initial failure of the specimen with a curing time of 3 days after reaching the peak strength is about 0.035–0.04, and the strain at the final instability failure is about 0.06–0.065, indicating that the final deformation of the backfill body with short curing time and low compressive strength is greater than that of the backfill body with long curing time and high compressive strength, but the overall deformation of the backfill body is still small during the compression process.
Analyzed from the failure morphology of the specimen, whether the curing time is 3 days, 7 days, or 28 days, before the specimen is completely destroyed, it is accompanied by the process of deformation, crack initiation, and crack development. The specimens generally have splitting failure modes, the surface of the specimen mostly has several wide longitudinal main cracks, accompanied by multiple longitudinal secondary cracks, which extend from top to bottom and jointly cause damage to the whole specimen. Observing the specimens, it is found that, compared with the specimens in the initial state, the specimens after the destruction have generally had obvious deformation such as compression and expansion, while the surface of the specimen did not appear loose and collapsed in a large area, the area where the blocks spalling mostly occurs in the upper part of the specimen. Moreover, when the specimens with long curing time and high strength are damaged, there are relatively few cracks and spalling blocks, and the integrity and stability of the damaged specimens are relatively good.
Discussion
In this paper, the engineering practice of solid backfilling in Xingtai Mine as a research case, the spatiotemporal law of ground pressure behavior in backfill mining by on-site monitoring and physical simulation. Based on that, the spatiotemporal coupling model of ground pressure behavior and RBB enhancement is established, and the theoretical requirements for the bearing performance of RBBs are proposed to guide the selection and proportion of roadside backfill materials. Finally, through the mechanical performance test of backfill materials with different proportions, the proportion of roadside backfill materials that meets the theoretical requirements is obtained. Compared with the traditional backfill material proportioning method, the material proportioning of RBB mentioned in this paper is more targeted, that is, the proportion of roadside backfill materials are determined according to the law of ground pressure behavior in the stope, so as to avoid the blindness of roadside backfill and reduce the mismatch between material strength and mine pressure. If cement is blindly added to the backfill material to increase the strength, it will lead to an increase in the cost of GER. The idea and method of determining the material proportioning and mechanical properties of RBBs according to the ground pressure behavior can guide the engineering practice of roadside backfill in GER under similar conditions, and can make the construction of RBB more scientific and reasonable.
However, this study still has some limitations. (1) During the mixing process of roadside backfill materials, the proportion of cement in the backfill materials that meet the theoretical strength requirements reaches 10%, which is a large proportion. In the engineering application of GER, the increase in the amount of cement will increase the cost of roadway retaining, thereby reducing the willingness of coal enterprises to adopt the roadside backfilling method. (2) In the backfill material proportion experiment, the size of the specimens made of different proportion materials is not a recognized standard size, and its strength may be different from that of the standard specimens due to the size effect. (3) The proportion of backfill materials obtained in this study is determined according to the ground pressure behavior of Xingtai Mine, that is, the maximum force on the backfill body under the conditions of backfill mining shall not exceed 5.5 MPa. However, the ground pressure behavior of other mines will be quite different from that of Xingtai Mine, so the mix proportion of backfill materials obtained in this study is not necessarily suitable for other mines. (4) The proportion of backfill materials whose strength meets the theoretical requirements obtained in this paper has not been applied and verified in field engineering. The strength of the backfill specimens was obtained under ideal laboratory conditions with constant curing temperature and humidity and small specimen dimensions. However, the underground environment is complex, and there will be inaccuracies in the on-site batching operation process. If the backfill body with this material proportion is compressed in a complex underground environment, its mechanical properties may change. Therefore, it is unknown how the backfill material proportion obtained from the laboratory will be applied to the field. At present, the proportion of backfill materials has not been applied and verified in the field, which is the biggest shortcoming of this study, and it is also beyond the control of the authors.
In the future, the types and sources of backfill materials can be enriched, and cementitious materials with wider sources and lower cost can be used instead of cement, such as increasing the content of fly ash and adding desulfurization gypsum appropriately, so as to improve the economy of roadside backfill. How effective and reliable is the backfill material proportion that meets the requirements of the theoretical model? In the future, it needs to be applied to the coal mine GER engineering to test the effectiveness of the backfill material proportion. Finally, according to the degree of ground pressure behavior under different coal mine conditions, the roadside backfill can be carried out by the ideas and methods of this study to carry out targeted material proportions to meet the specific working conditions and the requirements of GER for ground pressure behavior.
Conclusions
In this study, through monitoring in the stope, similar material simulation experiments and laboratory experiments, the proportioning test of roadside backfill materials matching the ground pressure behavior in the stope was carried out, and the following conclusions were obtained:
The solid dense backfilling engineering practice in Xingtai Mine shows that the ground pressure in the stope is weak, and the force on the backfill body increases first and then stabilizes with the increase of the advancing distance. The pressure reached a peak value of 5.5 MPa at a distance of 40 m from the coal face, and then the pressure basically tended to be stable. A similar materials simulation experiment was used to verify the law of ground pressure behavior in solid backfilling. The results show that with the increase of backfilling distance and time, the stress of the roof goes through a process of rising-falling and then slowly rising to the final stability, while the force on the backfill body in the goaf increases slowly as it moves away from the coal face, and the stress value after stabilization is less than the original rock stress value, whether it is the goaf roof stress or the backfill body stress. Based on the law of ground pressure behavior obtained through engineering practice and physical simulation experiments, the spatiotemporal coupling model between roof subsidence and backfill body reinforcement is constructed, and the theoretical requirements for the performance of the roadside body in the GER under the condition of backfill mining are proposed, that is, the aging strength of the roadside body at different positions in the goaf should not be less than the roof pressure it bears, and the 7-day strength of the roadside backfill material should not be less than the maximum roof pressure of 5.5 MPa. To meet the theoretical requirements, the roadside backfill material mix proportion experiment and the age strength characteristics research were carried out, and the optimal proportion of roadside backfill materials meeting the theoretical requirements was gangue:fly ash:cement = 10:3:1, and the 3-day and 7-day strength of the roadside backfill materials with the optimal proportion can reach about 4.0 MPa and 6.5 MPa, respectively, finally the deformation and failure characteristics of the specimen were analyzed.
Footnotes
Declaration of conflicting interests
The author(s) declared no potential conflicts of interest with respect to the research, authorship, and/or publication of this article.
Funding
This research was supported by University Synergy Innovation Program of Anhui Province (GXXT-2021-017), Anhui Province University Graduate Research Project (YJS20210389), National Program on Key Basic Research Project of China (2019YFC1904304) and Research Project of Institute of Energy, Hefei Comprehensive National Science Center (21KZS217), 2022 Anhui New Era Education Quality Engineering Project (Graduate Education) (2022cxcysj110) and Hebei Provincial Natural Science Foundation of China (E2022402014).